resonance raman studies of catecholate and phenolate complexes of recombinant human tyrosine...
TRANSCRIPT
5504 Biochemistry 1995,34, 5504-5510
Resonanke Raman Studies of Catecholate and Phenolate Complexes of Recombinant Human Tyrosine Hydroxylase?
Isabelle Michaud-Soret,$,e Kristoffer K. Andersson,"J and Lawrence Que, Jr.*s$
Departments of Chemistry and Biochemistry, University of Minnesota, Minneapolis, Minnesota 55455
Jan Haavik
Department of Biochemistry and Molecular Biology, University of Bergen, N-5009 Bergen, Norway
Received November 15, 1994; Revised Manuscript Received February 14, 1995@
ABSTRACT: Human tyrosine hydroxylase isoform 1 (hTH1) was expressed in Escherichia coli, purified as the apoenzyme, and reconstituted with iron. The resonance Raman spectra of hTHl complexed with dopamine, noradrenaline, tyramine, and catechol have been studied and compared to those obtained for TH isolated from bovine adrenal glands or rat phaeochromocytoma tissue. A TH-phenolate complex is reported for the first time. Using dopamine selectively '*O-labeled in the 3-position or both 3- and 4-hydroxy positions, we have been able to assign unambiguously the origin of the low-frequency vibration bands: the band at 631 cm-' involves the oxygen in the 4-position; the band at 592 cm-' involves the oxygen in the 3-position, and the band around 528 cm-' is shifted by both, suggesting a chelated mode vibration. A small shift of the 1275 cm-* band and no shift of the 1320 cm-' band were observed, showing that those two bands involve essentially ring vibrations of the catecholate moiety, rather than the C-0 stretching vibration as previously suggested. The spectrum of the catechol-&,-hTHl complex confirms this assignment. The resonance Raman spectra of the 54Fe, 56Fe, or 57Fe isotope-containing enzymes complexed with dopamine are virtually identical, showing that the component of the iron in the ~ 6 0 0 cm-' vibrations is too small to be observed. These results provide a better understanding of the Raman properties of iron-catecholate complexes in this enzyme, as well as in other metalloproteins and model compounds.
Tyrosine hydroxylase (EC 1.14.16.2) catalyzes the rate- limiting step in the biosynthesis of catecholamines both in brain and in adrenal medulla (Levitt et al., 1965). This enzyme contains non-heme iron and requires tetrahydro- biopterin as cosubstrate to hydroxylate L-tyrosine to 3,4- dihydroxyphenylalanine (DOPA)' (Fukami et al., 1990). A mechanism for the reaction requiring oxygen activation has been proposed (Dix et al., 1987). Human tyrosine hydrox- ylase exists as four different isoforms (hTH1 -hTH4) gener- ated by alternative splicing events (Grima et al., 1987; Nagatsu & Ichinose, 1991; O'Malley et al., 1987). All isoforms have recently been expressed in Escherichia coli (Haavik et al., 1991; Sutherland et al., 1993). The recom-
' This work was supported by the National Institutes of Health (GM-
* To whom correspondence should be addressed. Telephone: 612-
8 Present address: CEAIDCpartement de Recherche Fondamentale sur la matitre condensee, CNRSLaboratoire de Chimie de Coordination (URA 1194), SESAM, Centre d'Etudes NuclCaires de Grenoble, F-38054 Grenoble cedex 9, France.
33162 to L.Q.) and the Research Council of Norway (to J.H.).
6250389. Fax: 612-624-7029. Department of Chemistry, University of Minnesota.
'I Department of Biochemistry, University of Minnesota. Present address: Department of Biochemistry, University of Oslo,
P. B. 1041 Box Blindem, 0316 Oslo, Norway. @Abstract published in Advance ACS Abstracts, April 1, 1995. ' Abbreviations: hTH1, -2, -3, -4, human tyrosine hydroxylase
isofoms 1,2,3, and 4, respectively; PAH, phenylalanine hydroxylase; 3,4-PCD, protocatechuate 3,4-dioxygenase; 1,2-CTD, catechol 1,2- dioxygenase; RNR R2, R2 protein of ribonucleotide reductase; LMCT, ligand-to-metal charge transfer; DOPA, 3.4-dihydroxyphenylalanine; PDA, N-(2-pyridylmethyl)iminodiacetate; salen, N,N '-ethylenebis- (salicylidenimine) dianion.
0006-2960/95/0434-5504$09.00/0 0
binant enzymes are tetramers, composed of four identical subunits of predicted molecular masses (from the cDNA sequences) of 55 553-58 521 Da. The purified apoenzymes are rapidly activated (up to 40-fold) by the incorporation of 1 equiv of Fe2+ per subunit (Haavik et al., 1991). The iron ligands are unknown, but spectroscopic studies [Mossbauer (Haavik et al., 1993) and EXAFS (manuscript in prepara- tion)] indicate that there is no tyrosine or sulfur coordination. Sequence comparisons among the different aromatic amino acid hydroxylases show that six histidines are conserved in the sequences (Grima et al., 1987) of which some have been proposed as ligands. Together with the spectroscopic data, this suggests an environment of histidines and carboxylate- (s) for the iron (Anderson et al., 1988, 1992). The protein isolated from mammalian tissues has a blue-green color which has been shown to be due to an iron-catecholamine complex (Anderson et al., 1988). Catecholamines act as feedback inhibitors of the catecholamine biosynthesis (Uden- friend et al., 1965; Dairman & Udenfriend, 1971) by coordination to the TH active-site iron center (Andersson et al., 1988, 1989). The biological significance of the cat- echolamine binding to TH has not been settled, and it is not yet clear whether such complexes are present in vivo, or are artifacts generated during enzyme purification, due to leakage of catecholamines from secretory granules. However, the enzyme as isolated from mammalian tissues contains nearly stoichiometric amounts of tightly bound catecholamines (Andersson et al., 1988, 1992). When iron-reconstituted recombinant human TH is exposed to physiologically relevant concentrations of dopamine, noradrenaline, or
1995 American Chemical Society
Resonance Raman Studies of Tyrosine Hydroxylase
adrenaline, in the presence of oxygen, such complexes are also rapidly formed (Haavik et al., 1991), in a reaction where the rate-limiting step appears to be the autoxidation of enzyme-bound Fe(I1) to Fe(II1). The binding of catechola- mines to the enzyme influences many of the properties of the enzyme, including its catalytic activity, the affinity for iron, and the enzyme secondary structure as determined by FT-IR spectroscopy, rate of denaturation, substrate binding properties, and rate of proteolysis (Haavik et al., 1991; Almis et al., 1992; A. Martinez, personal communication). The inhibition of TH by catecholamines, which is competitive with respect to the tetrahydropterin cofactor, is partially reversed by phosphorylation of Ser-40. It has been suggested that this is the major mechanism for short-term regulation of TH in vivo (Haavik et al., 1990).
Catechols can be very useful colorimetric probes for non- heme iron proteins and have been successfully used to study several non-heme iron proteins such as lipoxygenases (Cox et al., 1988; Nelson, 1988), catechol dioxygenases (Que, 1983; Tyson, 1975), and ribonucleotide reductase (Ling et al., 1994) (F208Y mutant of RNR R2 containing a catecho- late motif chelated to the iron). In most cases, the catechol has been proposed to be chelated to the iron based on UV- visible and resonance Raman spectra and crystallographic data obtained on model compounds (Cox et al., 1988; Heistand et al., 1982). The blue-green catecholamine-TH complexes of the bovine (Andersson et al., 1988) and rat (Andersson et al., 1992) isolated enzymes have previously been studied by resonance Raman spectroscopy. The spectra exhibit characteristic features of catecholate-iron complexes with three bands around 600 cm-' attributed to Fe-0 stretching vibrations (Cox et al., 1988), and two bands at 1272 and 1320 cm-' assigned to C-0 stretching vibrations (Cox et al., 1988). However, a detailed isotopic labeling study has not been carried out to assign these resonance Raman vibrations. In this paper, we report resonance Raman studies of the recombinant human tyrosine hydroxylase isoform 1 (hTH 1) complexed to dopamine, noradrenaline, catechol, and tyramine. We also describe an isotopic labeling study of the dopamine-hTH1 complex and the assignment of the vibration bands using enzymatically synthesized dopamine with l80 either at position 3 or at positions 3 and 4 and enzyme containing j4Fe, 56Fe, or j7Fe. These data allow a more precise assignment of the vibrational features arising from a catecholate complex and should be useful in interpreting the ligation modes of catechols bound to other non-heme iron metalloproteins.
MATERIALS AND METHODS Human tyrosine hydroxylase isoform 1 (hTH1) was
expressed in E. coli and purified to homogeneity as previ- ously described (Haavik et al., 1991). The purified prepara- tions of hTHl apoenzyme used in the present study contained 0.02 & 0.01 atom of irodsubunit, as determined by atomic absorption spectroscopy. The concentration of purified hTHl was determined by the absorbance at 280 nm (e1% = 10.4 cm-') at neutral pH (Haavik et al., 1988). Tyrosine hydroxylase activity was assayed at 30 "C or 37 "C with ~-[~H]tyrosine and 6-methyltetrahydrobiopterin as the sub- strates as previously described (Haavik et al., 1991). The phosphorylated hTHl was prepared as previously described ( A l m t et al., 1992). For the inhibition studies of hTHl by tyramine and octopamine, the enzyme (3 pg/mL,) was incubated with 100 pM iron(I1) ammonium sulfate in 100
Biochemistry, Vol. 34, No. 16, 1995 5505
mM HEPES, pH 7.0, and either no inhibitor or 10 or 20 mM inhibitor. The initial rates were determined from the amount of tritiated water formed during a 6 min incubation time at 30 "C with either 25 pM [3,5-3H]tyrosine and 20- 125 pM 6(R)-tetrahydrobiopterin or 10-40 pM [3,5-3H]- tyrosine and 500 mM 6(R)-tetrahydrobiopterin.
Preparation of Labeled Compounds. [3-'80,4-'60]Dopam- ine was prepared by incubating L-tyrosine (Sigma) with 1 8 0 2
(96% lSO; Cambridge Isotope Laboratories, Wobum, MA), 6-methyltetrahydropterin (Schircks Laboratories, Jona, Swit- zerland), dithiothreitol (Sigma), hTHl, catalase (Sigma), and tyrosine decarboxylase (Sigma) at pH 7.0 and isolating the product by HPLC, using a Partisil M9 (60 x 0.9 cm) strong cation-exchange column. [3-180,4-180]Dopamine was pre- pared similarly, but with L-phenylalanine (Sigma) as the amino acid substrate. [3-180, 4-'80]Noradrenaline was prepared by incubating [3-'80,4-180]dopamine with bovine adrenal dopamine /3-hydroxylase (Sigma), ascorbate, catalase, dithiothreitol, and 1 6 0 2 at pH 6.0 and isolating the product as described above. The identity and isotopic purity of the 180-labeled compounds were verified by HPLC-mass spectrometry analysis. Catechol was sublimed prior to use, and all other materials were reagent grade and used without further purification. Deuterated catechol (catechol-&) was obtained via base exchange (0.5 equiv of potassium tert- butoxide) at 140 "C for 20 h in a sealed tube. The reaction was monitored by 'H-NMR spectroscopy and terminated when the spectrum showed '90% deuteration of the ring protons.
Preparation of Iron Isotopes. The 54Fe11C12 was prepared from 54Fe203 (95% 54Fe) by heating the oxide with 50% HC1 at 120 "C for 14 h, followed by drying under nitrogen, lyophilizing, dissolving in water, and reducing with 1 .O- 1.36 equiv of ascorbate. The 57FeC12 used was prepared from metallic j7Fe (95% 57Fe).
Preparation of the UV- Visible and Resonance Raman Samples. The apoenzyme (1 mM in subunits) was first reconstituted with stoichiometric amounts of Fe(I1). Then the substituted phenols were added from concentrated buffered stock solution, and the complexation was followed by UV-visible spectroscopy. The Fe(II1)-catecholate complexes formed spontaneously under aerobic conditions, as indicated by the appearance of the characteristic blue- green color, while the red-colored phenolate complexes were formed after the addition of hydrogen peroxide (added to about 2.5 mM from a 100 mM stock solution).
Resonance Raman Conditions. Resonance Raman spectra were obtained using a Spex Model 1403 spectrometer interfaced with a microcomputer for data collection and processing. Laser excitation was provided by a Spectra Physics Model 171 argon ion and 375B dye (Rhodamine 6G) lasers. The Raman scattering was collected at 90" with a slit width of 4 cm-'. The samples were placed in a quartz spinning cell which was cooled to ca. 5 "C by blowing cold nitrogen gas on the cell. A typical sample consisted of 120 pL of an hTHl solution (1 mM in subunits, 60 mg/mL) with 0.03-0.1 M sodium sulfate added as an internal standard. All data were referenced to the sulfate signal at 983 cm-'. Samples were typically irradiated with ca. 50 mW of laser power. Excitation profiles were constructed by comparing peak heights relative to the sulfate standard.
5506 Biochemistry, Vol. 34, No. 16, 1995 Michaud-Soret et al.
h
0.0 ' I 300 400 500 600 700 800
Wavelength (nm)
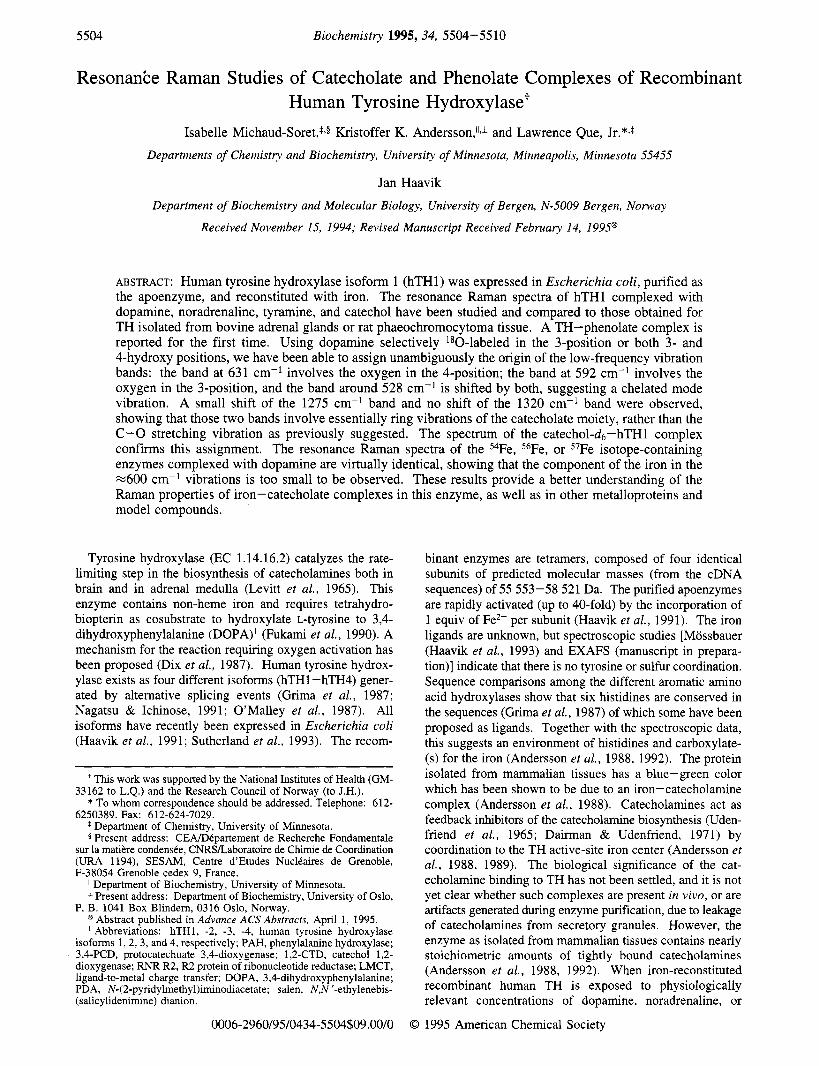
FIGURE 1: Visible absorption spectra of (a) the hTHl apoprotein at 1 mM in the presence of 10 mM tyramine, (b) the hTH1- tyramine complex obtained from 1 mM hTHl solution containing 10 mM tyramine, 1 mM iron(I1) ammonium sulfate salt, and 2.5 mM H202, and (c) the hTH1-catechol complex obtained by stoichiometric addition of catechol to the 1 mM hTHl solution. These spectra were recorded at room temperature in 50 mM phosphate buffer at pH 7.3.
0.2 $ 1 0.0 I I I
0 10 20 30 [ligand] (mM)
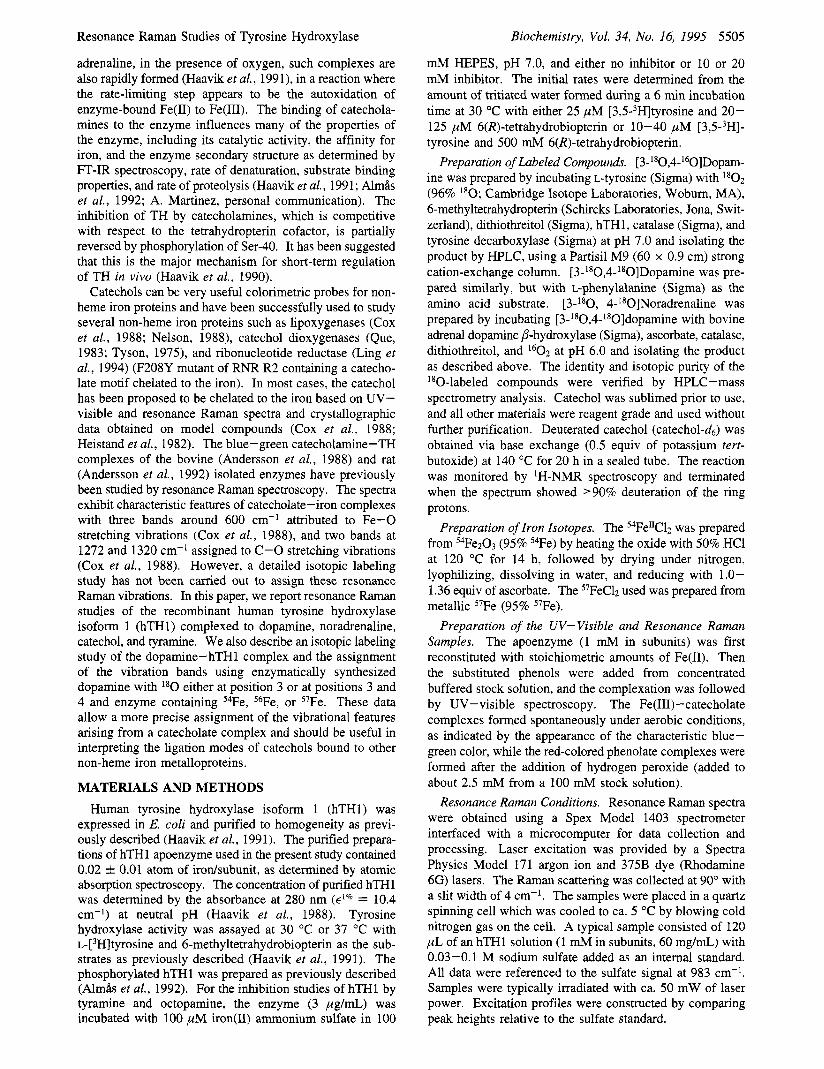
FIGURE 2: Titration of hTHl with octopamine (A) or tyramine (0) monitored at 520 nm using apoenzyme (1.25 mM in subunits) incubated with 1.25 mM iron(I1) ammonium sulfate and 1.25 mM hydrogen peroxide in 20 mM HEPES buffer, pH 7.2. The absorbance at 416 nm as a function of added tyramine was also measured (m).
RESULTS
Complexes of hTHl with Phenolates. Recombinant TH cloned and overexpressed in E. coli is purified as a colorless apoprotein (Haavik e? al., 1992) (Figure la). No new visible chromophore is observed after the addition of Fe(I1) to the protein (Haavik e? al., 1992), but a faint yellow color appears after treatment with H202 to oxidize the Fe(II) to Fe(II1) (data not shown). The Fe(II1) enzyme becomes more strongly colored after binding phenols (red) or catechols (blue-green). Spectra for the hTHl complexed with tyramine and catechol are shown in Figure lb,c, respectively.
The red chromophore can be obtained with phenol, as well as aminoalkylphenols such as p-tyramine and p-octopamine. The latter compounds are trace amines present in the nervous system of many organisms (Nguyen & Juorio, 1989; Andrew e? al., 1993) and are substrate analogs of TH. Steady-state kinetic studies show that both compounds inhibit TH competitively with respect to the pterin cofactor and non- competitively with respect to L-tyrosine (Ki = 3 mM for both compounds, Figure 2) . Furthermore, the binding of the phenols and catechols to TH was shown to be mutually
1280 I I I 1606 1
300 500 700 900 1100 1300 1500 1700
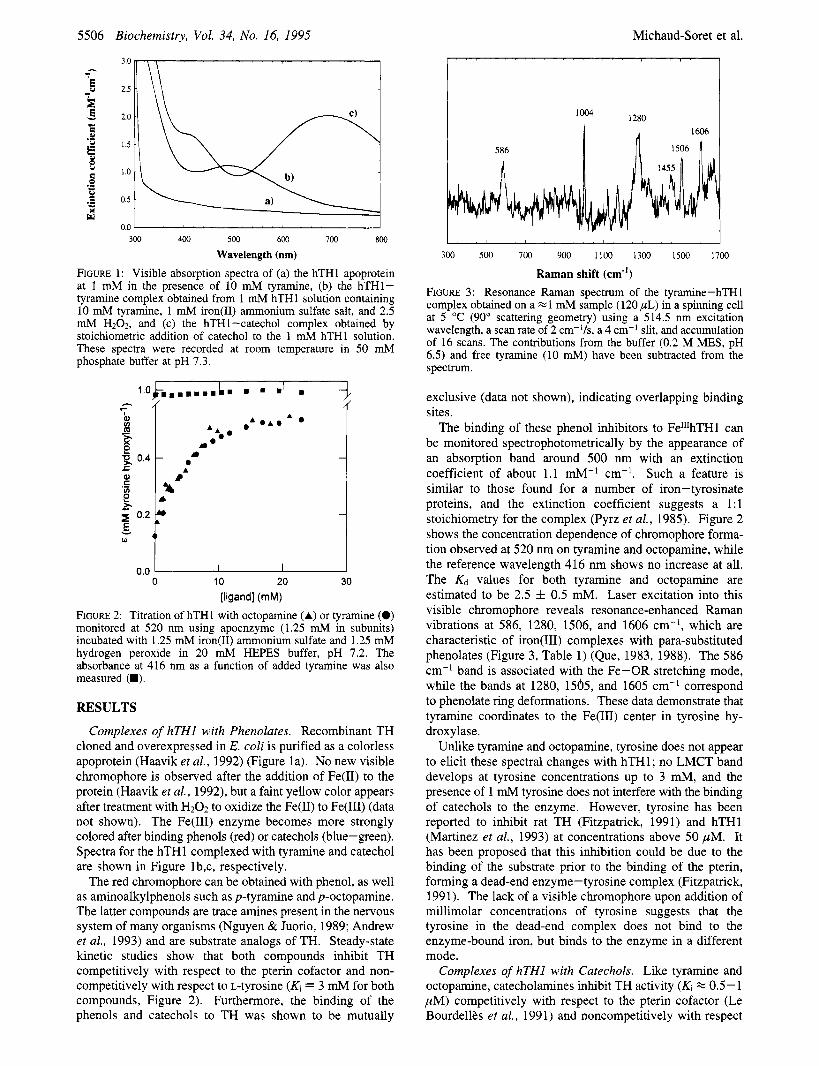
Raman shift (cm") FIGURE 3: Resonance Raman spectrum of the tyramine-hTH1 complex obtained on a 1 mM sample (120 pL) in a spinning cell at 5 "C (90' scattering geometry) using a 514.5 nm excitation wavelength, a scan rate of 2 cm-]/s, a 4 cm-' slit, and accumulation of 16 scans. The contributions from the buffer (0.2 M MES, pH 6.5) and free tyramine (10 mM) have been subtracted from the spectrum.
exclusive (data not shown), indicating overlapping binding sites.
The binding of these phenol inhibitors to Fe"'hTH1 can be monitored spectrophotometrically by the appearance of an absorption band around 500 nm with an extinction coefficient of about 1.1 mM-' cm-'. Such a feature is similar to those found for a number of iron-tyrosinate proteins, and the extinction coefficient suggests a 1:l stoichiometry for the complex (Pyrz et al., 1985). Figure 2 shows the concentration dependence of chromophore forma- tion observed at 520 nm on tyramine and octopamine, while the reference wavelength 416 nm shows no increase at all. The Kd values for both tyramine and octopamine are estimated to be 2.5 f 0.5 mM. Laser excitation into this visible chromophore reveals resonance-enhanced Raman vibrations at 586, 1280, 1506, and 1606 cm-', which are characteristic of iron(II1) complexes with para-substituted phenolates (Figure 3, Table 1) (Que, 1983, 1988). The 586 cm-I band is associated with the Fe-OR stretching mode, while the bands at 1280, 1505, and 1605 cm-' correspond to phenolate ring deformations. These data demonstrate that tyramine coordinates to the Fe(II1) center in tyrosine hy- droxylase.
Unlike tyramine and octopamine, tyrosine does not appear to elicit these spectral changes with hTH1; no LMCT band develops at tyrosine concentrations up to 3 mM, and the presence of 1 mM tyrosine does not interfere with the binding of catechols to the enzyme. However, tyrosine has been reported to inhibit rat TH (Fitzpatrick, 1991) and hTHl (Martinez et al., 1993) at concentrations above 50 pM. It has been proposed that this inhibition could be due to the binding of the substrate prior to the binding of the pterin, forming a dead-end enzyme-tyrosine complex (Fitzpatrick, 1991). The lack of a visible chromophore upon addition of millimolar concentrations of tyrosine suggests that the tyrosine in the dead-end complex does not bind to the enzyme-bound iron, but binds to the enzyme in a different mode.
Complexes of hTHl with Catechols. Like tyramine and octopamine, catecholamines inhibit TH activity (Ki M 0.5-1 pM) competitively with respect to the pterin cofactor (Le Bourdellks et al., 1991) and noncompetitively with respect

Resonance Raman Studies of Tyrosine Hydroxylase Biochemistry, Vol. 34, No. 16, 1995 5507
Table 1 : Resonance Raman Vibrations of Iron-Catecholate and Iron-Phenolate Chromophores in Proteins
complexes excitation wavelength (nm) Raman vibrations (cm-I)
TH-dopamine"sb 606 528 592 631 1275 1320 1425 1475 phosphorylated TH-dopamineb 606 531 584 638 1270 1320 1424 1478 TH-noradrenalineb 606 530 624 636 1171 1271 1328(br) 1428 1476 TH-catecholb 606 528 619 1150 1257 1314 1466 1566 rat tumor TH' 605 527 589 633 1272 1321 1426 1475 bovine THd 605 527 604 635 1130 1271 1320 1426 1476 PAH-catechol' 620.5 53 1 621 1151 1257 1313 1470 1568 TH - tyramine" 514.5 589 1175 1281 1507 1605 1 ,2-CTD 514.9 1174 1255-1274 1506 1605
6479 1173 1293 1505 1605
Sample prepared with 56Fe. Sample prepared with 54Fe. Andersson et al. (1992). Andersson et al. (1988). e Cox et al. (1988). f Michaud- Soret, I., unpublished results on purified 1,2-CTD isozymes. 8 Que et al. (1980).
I " ' ~ ' " / ' " " " J ' ' ' I ' "
983 1475
300 500 700 900 llD0 1300 1500 1700
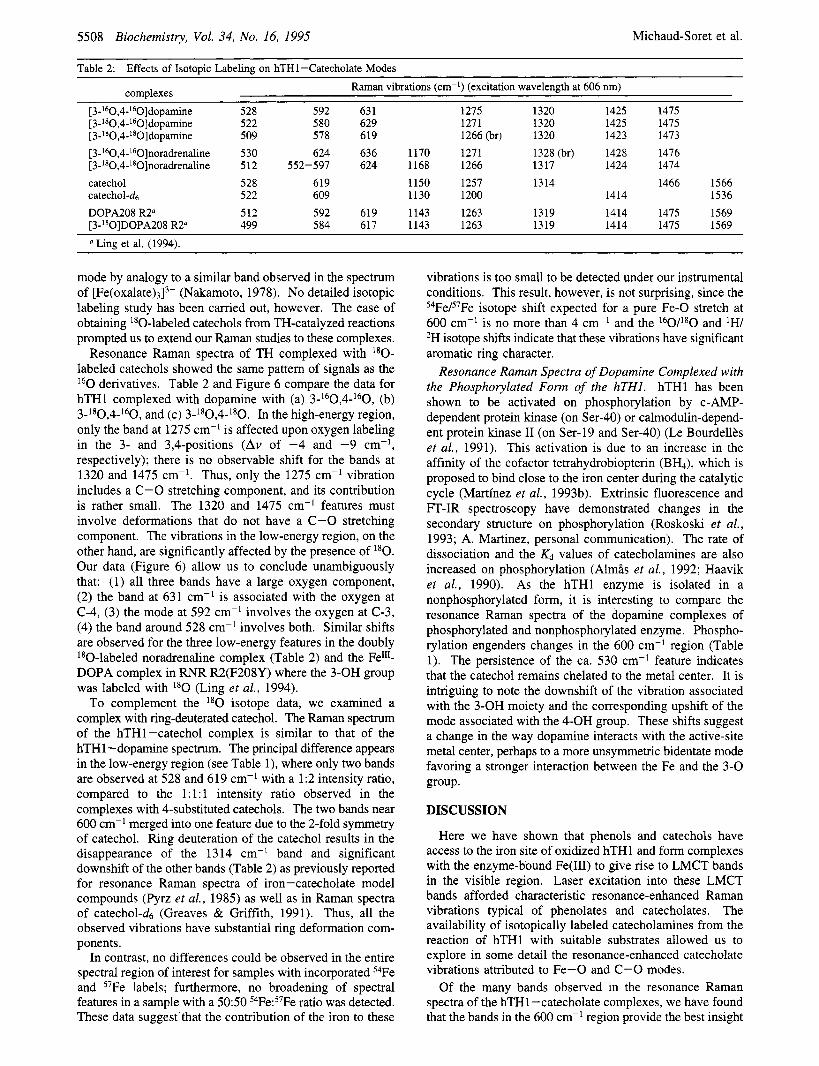
Raman shift (cm-') FIGURE 4: Resonance Raman spectrum of the dopamine-hTH1 complex obtained on a E 1 mM sample ( 120 pL) in a spinning cell at 5 "C (90' scattering geometry) using a 606 nm excitation wavelength, a scan rate of 2 cm-'/s, a 4 cm-l slit , and accumulation of 40 scans.
to the substrate (Almis et al., 1992). The Kd for dopamine binding to the iron-reconstituted hTHl is in the 2-3 pM range (Almis et al., 1992).
The visible spectrum of FemhTH1 complexes with catechol is almost identical to that previously described for the complex with dopamine (Haavik et al., 1991). Catechol, dopamine, and noradrenaline all form 1 : 1 complexes with hTHl with absorption maxima at 415-420 and 695-700 nm (Figure IC) due to catecholate LMCT bands. The spectra of the enzyme-catecholate complexes are also very similar to those of the catechol complex of the rat liver phenylalanine hydroxylase and tyrosine hydroxylases as isolated from rat phaeochromocytoma and bovine adrenal glands (Haavik et al., 1988; Andersson et al., 1992).
The resonance Raman spectrum of the hTH1-dopamine complex (Figure 4) has the characteristic signature of an iron-catecholate species (Cox et al., 1988; Pyrz et al., 1985) with bands at 528, 592, 631, 1275, 1320, 1425, and 1475 cm-'. The spectrum is almost identical to the one obtained from the isolated PC12 TH (Andersson et al., 1992). These spectral features are also similar to the Fe-DOPA complex recently described in the mutant F208Y ribonucleotide reductase (RNR) R2 protein (Ling et al., 1994). The Raman spectrum of the hTHl complex with noradrenaline (Table 1) shows subtle differences from that of the dopamine complex in the region around 600 cm-'. The same differ- ences are observed in the spectra of Fe(PDA) complexed with dopamine and noradrenaline (data not shown), suggest- ing that these differences are derived from the presence of the hydroxyl substituent on the side chain. The excitation profile of the hTH1-dopamine complex (Figure 5 ) confirms
0 . 0 0 " ' "
450 500 550 600 650
Excitation wavelength (nm) FIGURE 5: Excitation profiles for the dopamine-hTH1 complex sample relative to the sulfate standard. The spectra were obtained on a el mM sample (120 pL) in a spinning cell at 5 "C (90' scattering geometry) using 457.9, 514.5, 571, 606, and 627 nm excitation wavelengths ( ~ 5 0 mW), a scan rate of 2 cm-'/s, a 4 cm-' slit, and accumulation of 7-40 scans.
that all the bands except those at 1005 and 1450 cm-' are related to the catecholate-iron LMCT band at 700 nm (Cox et al., 1988). The 1005 cm-' band is not Raman-enhanced and is assigned to a phenylalanine ring mode from the protein (Lord & Yu, 1970). Since the 1450 cm-* band appears to increase in intensity with 457.9 nm excitation, it might be associated with the higher energy absorption band at 420 nm, as has been observed in model compounds (Cox et al., 1988).
Isotopic Labeling Studies of hTHl - Catechol Complexes (I8O, j4Fe, 57Fe, and 2H). In the resonance Raman studies on iron(II1)-catecholate complexes thus far published, the assignments for most of the observed vibrations have been assumed to follow assignments made on the corresponding phenolate complexes. Thus, the bands in the 1200-1500 cm-' region are associated with ring deformation modes, the ca. 1270 cm-' band in particular being assigned to the catecholate C-0 stretch. The bands around 600 cm-', on the other hand, are associated with metal-ligand vibrations, the 528 cm-' band in particular being assigned to a chelate
5508 Biochemistry, Vol. 34, No. 16, 1995 Michaud-Soret et al.
Table 2: Effects of IsotoDic Labeling on hTH1-Catecholate Modes Raman vibrations (cm-') (excitation wavelength at 606 nm) complexes
[3-160,4-160]dopamine [ 3- l80 ,4- 60] dopamine [ 3 - ,4- '*O]dopamine [3-160,4-'60]noradrenaline [3-'80,4-'80]noradrenaline catechol catechol-d6 DOPA208 R2" [3-'*0]DOPA208 R2"
528 592 522 580 509 578 530 624 512 552-597 528 619 522 609 512 592 499 584
63 1 1275 1320 1425 1475 629 1271 1320 1425 1475 619 1266 (br) 1320 1423 1473 636 1170 1271 1328(br) 1428 1476 624 1168 1266 1317 1424 1474
1150 1257 1314 1466 1566 1130 1200 1414 1536
619 1143 1263 1319 1414 1475 1569 617 1143 1263 1319 1414 1475 1569
Ling et al. (1994).
mode by analogy to a similar band observed in the spectrum of [Fe(oxalate)3I3- (Nakamoto, 1978). No detailed isotopic labeling study has been carried out, however. The ease of obtaining 180-labeled catechols from TH-catalyzed reactions prompted us to extend our Raman studies to these complexes.
Resonance Raman spectra of TH complexed with l80-
labeled catechols showed the same pattern of signals as the l60 derivatives. Table 2 and Figure 6 compare the data for hTHl complexed with dopamine with (a) 3-l6O,4-l60, (b) 3-180,4-160, and (c) 3-l8O,4-l80. In the high-energy region, only the band at 1275 cm-' is affected upon oxygen labeling in the 3- and 3,4-positions (Av of -4 and -9 cm-', respectively); there is no observable shift for the bands at 1320 and 1475 cm-'. Thus, only the 1275 cm-' vibration includes a C-0 stretching component, and its contribution is rather small. The 1320 and 1475 cm-l features must involve deformations that do not have a C-0 stretching component. The vibrations in the low-energy region, on the other hand, are significantly affected by the presence of l80.
Our data (Figure 6) allow us to conclude unambiguously that: (1) all three bands have a large oxygen component, (2) the band at 631 cm-' is associated with the oxygen at C-4, (3) the mode at 592 cm-' involves the oxygen at C-3, (4) the band around 528 cm-' involves both. Similar shifts are observed for the three low-energy features in the doubly I80-labeled noradrenaline complex (Table 2) and the Fen'- DOPA complex in RNR R2(F208Y) where the 3-OH group was labeled with l80 (Ling et al., 1994).
To complement the l80 isotope data, we examined a complex with ring-deuterated catechol. The Raman spectrum of the hTHl-catechol complex is similar to that of the hTHl -dopamine spectrum. The principal difference appears in the low-energy region (see Table l), where only two bands are observed at 528 and 619 cm-' with a 1:2 intensity ratio, compared to the 1:l : l intensity ratio observed in the complexes with 4-substituted catechols. The two bands near 600 cm-' merged into one feature due to the 2-fold symmetry of catechol. Ring deuteration of the catechol results in the disappearance of the 1314 cm-' band and significant downshift of the other bands (Table 2) as previously reported for resonance Raman spectra of iron-catecholate model compounds (Pyrz et al., 1985) as well as in Raman spectra of catechol-d6 (Greaves & Griffith, 1991). Thus, all the observed vibrations have substantial ring deformation com- ponents.
In contrast, no differences could be observed in the entire spectral region of interest for samples with incorporated 54Fe and 57Fe labels; furthermore, no broadening of spectral features in a sample with a 5050 54Fe:57Fe ratio was detected. These data suggest'that the contribution of the iron to these
vibrations is too small to be detected under our instrumental conditions. This result, however, is not surprising, since the 54Fe/57Fe isotope shift expected for a pure Fe-0 stretch at 600 cm-' is no more than 4 cm-' and the l60/l8O and 'W 2H isotope shifts indicate that these vibrations have significant aromatic ring character.
Resonance Raman Spectra of Dopamine Complexed with the Phosphorylated Form of the hTH1. hTHl has been shown to be activated on phosphorylation by c-AMP- dependent protein kinase (on Ser-40) or calmodulin-depend- ent protein kinase I1 (on Ser-19 and Ser-40) (Le Bourdellbs et al., 1991). This activation is due to an increase in the affinity of the cofactor tetrahydrobiopterin (BH4), which is proposed to bind close to the iron center during the catalytic cycle (Martinez et al., 1993b). Extrinsic fluorescence and FT-IR spectroscopy have demonstrated changes in the secondary structure on phosphorylation (Roskoski et al., 1993; A. Martinez, personal communication). The rate of dissociation and the & values of catecholamines are also increased on phosphorylation (AlmHs et al., 1992; Haavik et al., 1990). As the hTHl enzyme is isolated in a nonphosphorylated form, it is interesting to compare the resonance Raman spectra of the dopamine complexes of phosphorylated and nonphosphorylated enzyme. Phospho- rylation engenders changes in the 600 cm-' region (Table 1). The persistence of the ca. 530 cm-l feature indicates that the catechol remains chelated to the metal center. It is intriguing to note the downshift of the vibration associated with the 3-OH moiety and the corresponding upshift of the mode associated with the 4-OH group. These shifts suggest a change in the way dopamine interacts with the active-site metal center, perhaps to a more unsymmetric bidentate mode favoring a stronger interaction between the Fe and the 3-0 group.
DISCUSSION
Here we have shown that phenols and catechols have access to the iron site of oxidized hTHl and form complexes with the enzyme-bound Fe(II1) to give rise to LMCT bands in the visible region. Laser excitation into these LMCT bands afforded characteristic resonance-enhanced Raman vibrations typical of phenolates and catecholates. The availability of isotopically labeled catecholamines from the reaction of hTHl with suitable substrates allowed us to explore in some detail the resonance-enhanced catecholate vibrations attributed to Fe-0 and C-0 modes.
Of the many bands observed in the resonance Raman spectra of the hTHl -catecholate complexes, we have found that the bands in the 600 cm-' region provide the best insight

Resonance Raman Studies of Tyrosine Hydroxylase
63 1 592 A
B
I . . . , , ,
450 500 550 600 650 700 750
Raman shift (cm")
4 1320 II I
I100 1200 1300 1400 1500
Raman shift (cm") FIGURE 6: Raman spectra of 180-labeled dopamine-hTH1 com- plex. Stoichiometric amounts of 180-labeled dopamine were com- plexed to hTH1. The spectra were obtained on xl mM samples (120 pL) in a spinning cell at 5 "C (90" scattering geometry) using a 606 nm excitation wavelength, a scan rate of 2 cm-l/s, a 4 cm-l slit, and accumulation of 60 scans.
into the coordination chemistry of the bound catecholate. This region has not previously been investigated in detail. Iron- tyrosinate proteins exhibit a band in this region that is associated with the v(Fe-0) vibration. Examples include mutant hemoglobins where the proximal histidine has been replaced by tyrosine (HbM Iwate, 589 cm-l, HbM Boston,
Biochemistry, Vol. 34, No. 16, 1995 5509
603 cm-'; Nagai et al., 1983) and purple acid phosphatases (575 cm-'; Antanaitis et al., 1982; Averill et al., 1987). These are similar to the 567 cm-l band corresponding to the v- (Fe-02) stretch of oxyhemoglobin which has been unequivo- cally assigned by its shift to 540 cm-I upon l 8 0 2 substitution (Brunner, 1974). A detailed Raman study on the model compound Fe(Salen)-OC6&-4-CH3 using 180-labeled or ring-deuterated p-cresol has assigned the observed 570 cm-' band to v(Fe-OAr), Le., a combination of the Fe-0 stretch and v12 of a para-disubstituted benzene ring (Pyrz et al., 1985). In the TH-tyramine complex, this vibration is found at 586 cm-l.
With the availability of specifically 180-labeled dopamine, we can unequivocally assign the features in the 600 cm-l region of the hTHl -catechol complexes to deformations associated with the Fe-enediolate unit. In contrast to the solitary band observed in the tyramine complex, two bands at 528 and 619 cm-' are found in the TH-catechol complex; these bands have a 1:2 relative intensity ratio. On the other hand, three bands of equal intensity are seen in the TH complexes of catecholates with 4-substituents. Our l80-
labeling studies show that the ca. 520 cm-I feature shifts when either catecholate oxygen is labeled. This confirms the assignment of this vibration to a five-membered ring chelate mode made earlier on the basis of comparisons of the spectra of [Fe(cat)3I3- (Salama et al., 1978) and [Fe(oxalate)3I3- (Nakamoto, 1978). A normal coordinate analysis of the oxalate complex has assigned this band as a mode intrinsic to the five-membered ring upon chelation of the oxalate to the iron (Nakamoto, 1970), and this assignment has been extended to the catecholate complexes (Salama et al., 1978). Similarly, the presence of this band in the spectra of the TH complexes with dopamine, catechol, and norad- renaline allows us to conclude that they are chelated to the iron in the enzyme. Our 180-labeling studies also demon- strate unequivocally that the remaining two vibrations near 600 cm-I correspond to modes that involve one catecholate oxygen or the other but not both. Our observations are corroborated by the results of Ling et al. (1994) on the Fe"'- DOPA complex in RNR R2(F208Y) with l 8 0 on the 3-OH of DOPA208. These results indicate that this region can be useful for deducing the catecholate coordination mode in other enzymes such as the catechol dioxygenases.
Our results call into question the nature of the 1260 and 1320 cm-l vibrations which are commonly attributed to the catecholate v(C-0) modes. The small shift observed for the 1260 cm-I band and the lack of one for the 1320 cm-l band upon l 8 0 incorporation into the catecholate oxygens argue against such an assignment. Indeed, the nearly 60 cm-l shift observed when ring-deuterated catechol was used in the study of [Fe(cat)3I3- strongly suggests that these bands are in fact ring vibrations of ortho-disubstituted benzenes, with at best a small contribution from the catecholate C-0 stretches. For example, there are three ring vibrations (v3, v7a, and v13) for o-xylene, catechol, or o-cresol which occur in the 1200-1300 cm-I range, where v7a is usually a strong polarized band and v3 and v13 are medium or weak intensity bands (VarsBnyi, 1974). These bands have been called the C-X bands of substituted benzenes in the literature (Var- sBnyi & Szoke, 1969) and subsequently became mistakenly associated solely with the v(C-0) (Wilson, 1974). Despite this misconception, these bands remain a characteristic spectroscopic signature for metal-catecholate coordination, being resonance-enhanced when the catecholate-to-iron(II1)
5510 Biochemistry, Vol. 34, No. 16, 1995 Michaud-Soret et al.
charge-transfer chromophore is excited. The 1320 cm-' band in particular is distinct from any feature observed for the iron-tyrosinate chromophore and thus useful for distinguish- ing phenolate from catecholate coordination.
The binding of both phenols and catechols to hTHl to form these complexes with LMCT bands depends on the rate of oxidation of Fe(II) to Fe(II1). While catechols can catalyze this autoxidation at neutral pH and under aerobic conditions, phenols cannot. In the latter case, the Fe(I1) must first be oxidized by H202 in order for the LMCT complexes with phenols to form. We have previously shown that the binding of tyrosine to bovine TH causes subtle changes in the EPR spectra of the enzyme-bound Fe(II1) (Andersson et al., 1989). Thus, one could speculate that tyrosine, the normal amino acid substrate of TH, also binds to the iron center during the catalytic cycle. This hypothesis would be in accordance with the recently proposed mechanism for phenolate hy- droxylation with model compounds (Kitajima et al., 1993). However, this hypothesis does not explain the comparable rates of hydroxylation of phenylalanine and tyrosine by TH (Fukami er al., 1990; Martinez et al., 1993a). Moreover, steady-state kinetic analyses showed that the phenols tested (tyramine and octopamine) were noncompetitive inhibitors with respect to tyrosine and competitive inhibitors with respect to tetrahydrobiopterin, and no LMCT- band was observed at tyrosine concentrations up to 3 mM (concentra- tion limited by the solubility of tyrosine). Recent 'H-NMR data have also shown that the ring protons of phenylalanine are 6.6-6.8 8, from the metal center of Co(I1)-substituted hTHl (Martinez et al., 1993a), while those of 6-methyltet- rahydropterin are only 3.8-4.6 8, from the metal center, allowing direct coordination of the pterin to the metal center (Martinez et al., 1993b). Thus, the inhibition observed at high concentrations of tyrosine is very likely not due to direct interaction with the iron center.
ACKNOWLEDGMENT
We thank E. C. Willcinson and T. E. Elgren (University of Minnesota) for their assistance in the use of the Raman spectrometer, Dr. Einar Solheim (Department of Pharmacol- ogy, University of Bergen) for performing the high- performance liquid chromatography and mass spectrometry analysis of the 180-labeled compounds, and Dr. Jacques Mallet (CNRS, Gif-sur-Yvette, France) for providing the bacterial strain for expressing hTH1.
REFERENCES
Almls, B., Le BourdellBs, B., Flatmark, T., Mallet, J., & Haavik, J. (1992) Eur. J. Biochem. 209, 249-255.
Andersson, K. K., Cox, D. D., Que, L., Jr., Flatmark, T., & Haavik, J. (1988) J. Biol. Chem. 263, 18621-18626.
Andersson, K. K., Haavik, J., Martinez, A,, Flatmark, T., & Peterson, L. (1989) FEBS Lett. 258, 9-12.
Andersson, K. K., Vassort, C., Brennan, B. A., Que, L., Jr., Haavik, J., Flatmark, T., Gros, F., & Thibault, J. (1992) Biochem. J. 284, 687-695.
Andrew, R., Best, S. A,, Watson, D. G., Midgeley, J. M., Reid, J. L., & Squire, I. B. (1993) Neurochem. Res. 18, 1179-1182.
Antanaitis, B. C., Strekas, T., & Aisen, P. (1982) J . Biol. Chem. 257, 3766-3770.
Averill, B. A., Davis, J. C., Burman, S., Zirino, T., Sanders-Loehr, J., Loehr, T. M., Sage, J. T., & Debrunner, P. G. (1987) J. Am. Chem. SOC. 109, 3760-3767.
Brunner, H. (1974) Natunvissenschaften 61, 129.
Cox, D. D., Benkovic, S. J., Bloom, L. M., Bradley, F. C., Nelson, M. J., Que, L., Jr., & Wallick, D. E. (1988) J. Am. Chem. SOC. 110, 2026-2032.
Dairman, W., & Udenfriend, S. (1971) Science 171, 1022-1024. Dix, T. A., Kuhn, D. M., & Benkovic, S. J. (1987) Biochemistry
Fitzpatrick, P. F. (1991) Biochemistry 30, 3658-3662. Fukami, M. H., Haavik, J., & Flatmark, T. (1990) Biochem. J. 268,
525-528. Greaves, S. J., & Griffith, W. P. (1991) Spectrochim. Acta 47A,
1 33 - 140. Grima, B., Lamouroux, A., Boni, C., Julien, J. F., Javoy-Agid, F.,
& Mallet, J. (1987) Nature 326, 707-711. Haavik, J., Andersson, K. K., Peterson, L., & Flatmark, T. (1988)
Biochim. Biophys. Acta 953, 142. Haavik, J., Martinez, A., & Flatmark, T. (1990) FEBS Lett. 262,
363-365. Haavik, J., Le Bourdellbs, B., Martinez, A., Flatmark, T., & Mallet,
J. (1991) Eur. J. Biochem. 199, 371-378. Haavik, J., Martinez, A., Olafsdottir, S., Mallet, J., & Flatmark, T.
(1992) Eur. J. Biochem. 210, 23-31. Haavik, J., Bill, E., Lengen, M., Martinez, A., Flatmark, T., &
Trautwein, A. X. (1993) in Chemistry and Biology of Pteridines and Folates, pp 1-6, Plenum, New York.
Heistand, R. H., 11, Lauffer, R. B., Fikrig, E., & Que, L., Jr. (1982)- J. Am. Chem. SOC. 104, 2789-2796.
Karpishin, T. B., Gebhard, M. S., Solomon, E. I., & Raymond, K. N. (1991) J. Am. Chem. SOC. 113, 2977-2984.
Kitajima, N., Ito, M., Fukui, H., & Moro-oka, Y. (1993) J. Am. Chem. SOC. 115, 9335-9336.
Le Bourdellbs, B., Horellou, P., Le Caer, J.-P., DenBfle, P., Latta, M., Haavik, J., Guibert, B., Mayaux, J.-F., & Mallet, J. (1991) J. Biol. Chem. 266, 17124-17130.
Levitt, M., Spector, S., Sjoerdsma, A., & Udenfriend, S. (1965) J. Pharmacol. Exp. Ther. 148, 1-8.
Ling, J., Sahlin, M., Sjoberg, B.-M., Loehr, T. M., & Sanders- Loehr, J. (1994) J. Biol. Chem. 269, 5595-5601.
Lord, R. C., & Yu, N. T. (1970) J . Mol. Biol. 50, 509-524. Martinez, A,, Abeygunawardana, C., Haavik, J., Flatmark, T., &
Mildvan, A. S. (1 993a) Biochemistry 32, 638 1-6390. Martinez, A., Abeygunawardana, C., Haavik, J., Flatmark, T., &
Mildvan, A. S. (199313) in Chemistry and Biology of Pteridines and Folates, pp 77-80, Plenum, New York.
Nagai, K., Kagimoto, T., Hayashi, A., Taketa, F., & Kitagawa, T. (1983) Biochemistry 22, 1305-131 1.
Nagatsu, T., & Ichinose, H. (1991) Comp. Biochem. Physiol. 98C, 203-210.
Nakamoto, K. (1978) Infrared Spectra of Inorganic and Coordina- tion Compounds, p 234, Wiley-Interscience, New York.
Nelson, M. J. (1988) Biochemistry 27, 4273-4278. Nguyen, T. V., & Juorio, A. V. (1989) Cell. Mol. Neurobiol. 9,
297-311. O'Malley, K. L., Anhalt, M., Martin, B. M., Kelsoe, J. R., Winfield,
S. L., & Ginns, E. I. (1987) Biochemistry 26, 6910-6914. Pyrz, J. W., Roe, A. L., Stem, L. J., & Que, L., Jr. (1985) J. Am.
Chem. SOC. 107, 614-620. Que, L., Jr. (1983) Coord. Chem. Rev. 50, 73-108. Que, L., Jr. (1988) in Biological Applications of Raman Spectros-
copy (Spiro, T. G., Ed.) Vol. 111, pp 491-521, Wiley, New York. Roskoski, R., Jr., Gahn, L. G., & Roskoski, L. M. (1993) Eur. J.
Biochem. 218, 363-370. Salama, S., Stong, J. D., Neilands, J. B., & Spiro, T. G. (1978)
Biochemistry 17, 378 1-3785. Spiro, T. G. (1974) Acc. Chem. Res. 7 , 339-344. Sutherland, C., Alterio, J., Campbell, D. G., LeBourdelles, B.,
Mallet, J., Haavik, J., & Cohen, P. (1993) Eur. J. Biochem. 217, 715 -722.
26, 3354-3361.
Tyson, C. A. (1975) J. Bid. Chem. 250, 1765-1770. Udenfriend, S., Zatzman-Nirenberg, P., & Nagatsu, T. (1965)
Biochem. Pharmacol. 14, 837-845. VarsAnyi, G. D. (1969)Vibrational Spectra of Benzene Derivatives,
Wiley, New York. VarsAnyi, G. D. (1974) Assignments for Vibrational Spectra of
Seven Hundred Benzene Derivatives, Vol. 1, Wiley, New York. Wilson, H. W. (1974) Spectrochim. Acta 30A, 2141-2152.
BI9426524