resource adequacy constructs in organized …
TRANSCRIPT

RESOURCE ADEQUACY CONSTRUCTS IN
ORGANIZED WHOLESALE MARKETS
April 30, 2021
Prepared for:
Prepared by:
Christopher A. Parent
Matthew T. Hoyt
Cali C. Clark
Resource Adequacy Constructs in Organized Wholesale Markets
EXETER ASSOCIATES, INC. Page | ii
NOTICE
This report reflects the perspectives and opinions of the authors and does not necessarily
reflect those of Exeter Associates, Inc., its clients, or other consultants. Opinions expressed
in this report, as well as any errors or omissions, are the authors’ alone. The examples,
facts, results, and requirements summarized in this report represent the authors’
interpretations. Nothing herein is intended to provide a legal opinion.
This report is intended to provide a high-level perspective on different resource adequacy
constructs and, as a result, simplifies the complexities associated with how these various
constructs are approached in different regions to facilitate comparison and discussion.
Copyright © 2021 Exeter Associates, Inc.

Resource Adequacy Constructs in Organized Wholesale Markets
EXETER ASSOCIATES, INC. Page | iii
TABLE OF CONTENTS
Page
Executive Summary .................................................................................................... v
Resource Adequacy Constructs................................................................................. v
Evaluation Approach ............................................................................................. vii
1 Introduction ........................................................................................................... 1
2 Electricity Market Structure...................................................................................... 3
2.1 Energy Markets ................................................................................................ 5
2.2 Ancillary Service Procurement ........................................................................... 6
2.3 Regulatory Programs ........................................................................................ 7
2.4 Resource Adequacy Constructs .......................................................................... 7
2.5 Investment in Electricity Markets ..................................................................... 16
3 Evaluation Approach ............................................................................................. 18
3.1 Evaluating Resource Adequacy Constructs ......................................................... 19
3.2 Evaluation Metrics .......................................................................................... 29
4 Recent Resource Adequacy Proposals ...................................................................... 37
4.1 MOPR Background .......................................................................................... 38
4.2 MOPR-Targeted Proposals ............................................................................... 41
4.3 MOPR-Framed Proposals ................................................................................. 43
4.4 Non-MOPR-Related Proposals .......................................................................... 48
Appendix A – PJM Resource Adequacy Constructs ......................................................... 51
ORDC and Scarcity Pricing ..................................................................................... 51
Capacity Market ................................................................................................... 53
Fixed Resource Requirement .................................................................................. 55
Capacity Market Participation versus FRR Election .................................................... 56
Appendix B – Other Region’s Resource Adequacy Constructs ......................................... 66
Energy-Only ........................................................................................................ 66
Capacity Markets .................................................................................................. 67
Capacity Demonstration ........................................................................................ 69
Appendix C – Capacity Pay-for-Performance and Shortage Pricing .................................. 73
Appendix D – Reliability and Cost Trade-off ................................................................. 76
Appendix E – Reserve Margin Metric ........................................................................... 78

Resource Adequacy Constructs in Organized Wholesale Markets
EXETER ASSOCIATES, INC. Page | iv
LIST OF TABLES
Page
Table 1. Resource Adequacy Constructs in ISOs/RTOs ................................................... vi
Table 2. Resource Adequacy Constructs in ISOs/RTOs .................................................... 9
Table 3. VRR Capacity Clearing Results with and without the MOPR ................................ 40
Table 4. FRR and VRR Capacity Clearing Results with MOPR........................................... 61
Table 5. FRR and VRR Capacity Clearing Results with and without MOPR ......................... 62
Table 6. Example UCAP for Potential MOPRed-out Resources ......................................... 64
LIST OF FIGURES
Page
Figure 1. VRR Capacity Clearing with and without the MOPR .......................................... 40
Figure 2. PJM’s Current Synchronized Reserve Demand Curve ....................................... 51
Figure 3. PJM’s Future Synchronized Reserve Demand Curve ......................................... 52
Figure 4. VRR Capacity Clearing with a Capacity-Long or -Short System ......................... 55
Figure 5. Variable and Fixed Requirement Capacity Clearing .......................................... 58
Figure 6. RTO Capacity Auction DY 2021/22 Clearing (with Load Forecast and Reliability
Required added for context) ........................................................................ 59
Figure 7. VRR and FRR Capacity Clearing with Economic Resources ................................ 60
Figure 8. VRR and FRR Capacity Clearing with Uneconomic (or MOPRed-out) Resources .... 60
Figure 9. VRR Capacity Clearing with and without the MOPR .......................................... 61

Resource Adequacy Constructs in Organized Wholesale Markets
EXETER ASSOCIATES, INC. Page | v
EXECUTIVE SUMMARY
There are many different constructs that are used by the independent system operators and
regional transmission organizations (ISOs/RTOs) to meet resource adequacy requirements.
No one resource adequacy construct in use today is necessarily better or worse than
another, as its performance is a function of the design decisions made for the construct.
This does not mean that all constructs are equal. There are trade-offs, most notably around
assignment of stranded cost risk and how an investment signal is achieved, and certain
constructs are better aligned with different regions (e.g., single-state ISOs/RTOs,
ISOs/RTOs that remain largely comprised of vertically integrated utilities or are deregulated
more fully) or design objectives (i.e., what is trying to be achieved). Different decisions,
both from an objective perspective and a design approach (e.g., market-based versus
controlled) can also result in different outcomes. To understand how a resource adequacy
construct is performing is not a comparison exercise, but rather an analysis exercise
focused on key interrelated areas—reliability requirement determination, reliability
valuation, resource performance, competition, and cost allocation—to determine whether
the design, as structured, achieves its intended overall objective in a cost-effective manner.
Similarly, when making changes to these constructs, understanding how a change in one
area is impacting other areas is important to ensuring any changes achieve their desired
outcomes.
This report provides perspective on how to think about different existing resource adequacy
constructs and how to evaluate their performance. This report does not make any specific
recommendations on the best resource adequacy path, nor does it perform a prospective
analysis on constructs that may work better in a future-state power system beyond brief
discussion of proposals that have been raised recently in various stakeholder forums.
Resource Adequacy Constructs
ISOs/RTOs use a variety of constructs in addition to the core energy and ancillary service
(EAS) markets to create the signals necessary to incentivize efficient entry, operation,
and/or retirement of the resources to serve load. Longer-term planning reliability standards,
considered in this report, provide guidelines designed to minimize service disruptions due to
inadequate installed resources.
Resource adequacy constructs are required because prices in EAS markets are set based on
short-run costs and may not provide adequate revenues for the resources needed to meet
resource adequacy requirements to recover their fixed costs. This gap in revenue adequacy
is largely a result of the lack of elastic demand in the energy market and supply-side offer
caps that limit how high prices may rise. The inability of prices to rise to the level necessary
to incent investment is termed the “missing money” problem and has resulted in the
creation of different resource adequacy constructs.
The four primary resource adequacy constructs in use in the U.S. ISOs/RTOs today are:

Resource Adequacy Constructs in Organized Wholesale Markets
EXETER ASSOCIATES, INC. Page | vi
1. Operating Reserve Demand Curve (ORDC): Establishes demand and prices
associated with ancillary services, generally beyond the minimum requirements in
the market, which can increase EAS revenues available to certain resources and
incentivize investment in specific technologies that are able to reliably perform to
earn these revenues.
2. Shortage Pricing: Establishes minimum prices reflected in the market when the
system is unable to meet EAS requirements. Shortage pricing works closely with the
ORDC, and again can incentivize investment in specific technologies.
3. Capacity Demonstration: Establishes capacity requirements that must be
demonstrated by load-serving entities (LSEs) through contracting or ownership of
supply, usually with some form of penalty for not meeting the specified
requirement.1
4. Capacity Market: Procures capacity from suppliers on behalf of load based on a
reliability requirement established for the region, usually represented through a
demand curve reflecting the willingness of load to pay for different levels of
reliability.
Table 1 provides an overview of the resource adequacy constructs used in each of the
ISO/RTO regions.
Table 1. Resource Adequacy Constructs in ISOs/RTOs
ISO/RTO ORDC
Shortage Pricing
Capacity Demonstration
Capacity Market
CAISO No Yes Yes No[1]
ERCOT Yes Yes No No
ISO-NE No[2] Yes No[3] Yes
MISO Yes Yes Yes Yes[4]
NYISO Yes Yes No[3] Yes
PJM Yes Yes Yes[3],[5] Yes
SPP Yes Yes Yes No
[1] CAISO runs a deficiency auction in cases where LSEs do not demonstrate their sufficient bilaterally contracted capacity, but this could be viewed as more of back-stop mechanism.
[2] ISO-NE includes a replacement reserve requirement, but this has minimal impact on market outcomes and is not a demand curve in the sense being discussed in this report.
[3] Mandatory capacity markets allow for entities to self-supply their capacity requirements subject to any limitation of the minimum offer price rule (MOPR).
[4] MISO’s capacity market uses a residual capacity market construct. [5] PJM includes the fixed resource requirement (FRR) construct which enables a
party to exit the PJM capacity market and instead bilaterally contract with capacity (or demonstrate ownership in resources) to meet its PJM-imposed requirements or pay a penalty.
1 A residual capacity market could be viewed as a capacity demonstration construct with a voluntary capacity
market that provides another option for LSEs to acquire capacity besides direct contracting or ownership.

Resource Adequacy Constructs in Organized Wholesale Markets
EXETER ASSOCIATES, INC. Page | vii
Evaluation Approach
The biggest driver of reliability and cost is not the construct itself, but rather the
expectations of load and other planning reliability standards as well as how the cost of new
entry (CONE) and net CONE values are established and represented in the market and how
resource performance is handled.
▪ All constructs can over- or under-buy installed capacity relative to the expected need
and can result in high or low costs (independent of the level of reliability).
▪ Capacity constructs often provide more visibility into what resources have forward
obligations as compared to an energy-only construct where forward arrangements
are handled outside the ISO/RTO-administered markets.
▪ All constructs are prone to changes that create uncertainty in the market. This is
often a function of the region more than the construct itself. However, capacity
constructs inherently have many rules (e.g., eligibility, penalties) so are more
sensitive to the stakeholder process and special interests impacting outcomes. EAS
constructs put more responsibility on suppliers and load to make these
determinations and generally see less change in their designs and parameters, so
are often viewed as more stable.
▪ All resource adequacy constructs can be aligned with state policy goals or consumer
preferences. Recent minimum offer price rule (MOPR) changes have created a
notable exception to this in capacity market constructs. However, there is nothing
inherent in capacity market constructs that prevents state or consumer resource
preferences from being reflected in the market.
▪ Rules that limit participation in capacity constructs attempt to establish reasonable
limitations based on a resource’s expected performance when needed. Forward
contracting for energy has limitations as well, but the limitations are managed by the
supplier and LSE through their arrangements (e.g., a supplier would likely not sell a
forward energy contract that they did not believe they could deliver against).
▪ Capacity demonstration likely places increased investment risk on consumers (by the
nature of the arrangements). Other constructs do not prevent LSEs from choosing to
take on similar risk, but may provide more options for merchant development.
▪ All constructs have the potential for weak or strong performance incentives. This is a
function of how the construct is designed.

Resource Adequacy Constructs in Organized Wholesale Markets
EXETER ASSOCIATES, INC. Page | viii
This report proposes five interrelated areas of evaluation to assist with the analysis of a
resource adequacy construct. Ideally, this analysis would be conducted in the context of a
clear objective and product definition. Even in the absence of a clear objective and product
definition, these evaluation areas can be used to better understand both of these items.
1. Reliability Requirement Determination: All constructs have some level of
expectation of future need generally based on forecasted load. There are also
numerous adjustments and assumptions (e.g., resource performance) applied in the
formation of this expectation that can have a material impact on the quantity of
capacity required.
2. Reliability Valuation: All constructs have a proxy for how much load is willing to
pay for reliability. These values are established through studies and a stakeholder
process. In capacity constructs, the implied value of lost load (VOLL) is calculated
based on the net CONE of a dispatchable technology (e.g., combustion turbine).
Scarcity prices in the EAS market can be set using a calculated VOLL or on the ability
of the ISOs/RTOs to redispatch the system to meet EAS requirements.
3. Resource Performance: Resource performance assumptions impact both supply
(e.g., by affecting competition) and demand (e.g., by adjusting the reliability
requirement). Inconsistent application of these assumptions can artificially inflate
capacity procured or inappropriately indicate resource sufficiency. Further, resource
performance requirements can shift costs between load and suppliers, depending on
the structure.
4. Competition: Achieving market outcomes depends on a construct’s ability to
facilitate an equal playing field across all technologies, new entrants and incumbents,
and supply- and demand-side resources, all while also having appropriate market
power protections.
5. Cost Allocation: Costs should be allocated to the parties that cause the costs to be
incurred and benefit from the byproducts of those costs (e.g., provision of ancillary
services). As the resource mix and, inherently, the product being procured through
capacity constructs evolve, it is critical that cost allocation provides similar incentives
to (or at least not counter to) supply-side resources. Cost allocation structures
should ensure that, when consumers act, these actions result in reductions in cost
over time and do not simply avoid costs that have to be paid by other consumers.

Resource Adequacy Constructs in Organized Wholesale Markets
Confidential Page | 1
Exeter Associates, Inc.
1 INTRODUCTION
At the request of the Consumer Advocates of PJM States (CAPS), Exeter Associates, Inc.
(Exeter) evaluated existing resource adequacy constructs and recommended a set of
evaluation criteria that CAPS can use to assess the performance of existing constructs,
recent modifications, and proposed enhancements to these constructs. This report is
intended to provide perspective on different ways to evaluate and think about resource
adequacy based on the constructs that are in use today. This report does not make any
specific recommendations about the best resource adequacy path, nor does it perform a
prospective analysis on constructs that may work better in a future-state power system
beyond brief discussion of proposals that have been raised recently in various stakeholder
forums. Further, while challenges with different resource types are discussed, this report
does not take a specific position on preferred resource types for resource adequacy or
whether one resource type may be better or worse than another at achieving resource
adequacy.
Resource adequacy is achieved by acquiring new resources and/or maintaining existing
resources to reduce the risk of unserved firm load. Markets, regulatory requirements, and
state/utility or independent system operator/regional transmission organization (ISO/RTO)
programs work collectively to achieve resource adequacy by simultaneously promoting
investment and retirement of electricity resources. There are a number of constructs used
across the United States to achieve resource adequacy, from integrated resource planning
(IRP) to centralized market procurement structures (i.e., capacity markets) to markets that
allow supply/demand to drive reliability decisions (i.e., energy-only markets), with
variations in between.
Resource adequacy constructs have recently faced challenges resulting from the increased
penetration of variable, limited, and distributed energy resources and the growing
prominence of state-sponsored programs/contracts targeting the development or continued
operation of clean or renewable resources. While these programs/contracts alter the
economics of investment in the electricity markets, they are often not specifically targeting
resource adequacy, but rather other objectives.2 The resultant potential mismatch between
these other objectives and resource adequacy creates tension between how resource
adequacy constructs may create a merchant investment signal while also allowing state and
consumer preferences to be reflected.
This report addresses the structure of electricity markets, how resource adequacy fits into
the broader market structure, and how changes to resource adequacy constructs can affect
outcomes. An initial overview is followed by a discussion of considerations and metrics to
use when assessing resource adequacy constructs, including trade-offs and interactions
between certain aspects of these constructs. Finally, the report provides an overview of
recent resource adequacy modifications and proposals.
2 States, municipalities, and cooperatives may also have many different objectives (e.g., economic,
environmental, or social goals) that drive programs targeting specific types of resources or contracting needs.

Resource Adequacy Constructs in Organized Wholesale Markets
EXETER ASSOCIATES, INC. Page | 2
All sections of the report consider the question of how different approaches to resource
adequacy address or leverage changing market conditions and state policy. The complete
report is broken down into the following three major sections:
1. Electricity Market Structure – An introduction to electricity market structures
including energy and ancillary services (EAS), federal/state/utility programs
(regulatory programs), and different resource adequacy constructs used in the
United States. This section discusses key concepts such as inframarginal and scarcity
rents, the missing money problem, and investment in electricity markets.
2. Evaluation Approach: A discussion of how to approach the evaluation of different
resource adequacy constructs. This section includes additional perspective regarding
how different resource adequacy constructs interact and some considerations of the
trade-offs in approaches.
3. Recent Resource Adequacy Proposals: An overview of the problems with the
minimum offer price rule (MOPR) and a brief assessment of recent modifications and
proposals impacting resource adequacy constructs. This section includes a review of
the context and drivers of different modifications and proposals as well as intended
outcomes.
Following the main body of the report, separate appendices include further information
regarding the current resource adequacy approaches applied in several regional electricity
markets.

Resource Adequacy Constructs in Organized Wholesale Markets
EXETER ASSOCIATES, INC. Page | 3
2 ELECTRICITY MARKET STRUCTURE
ISOs/RTOs administer electricity markets which, together with financial and bilateral or
over-the-counter (OTC) markets, address long-term and short-term reliability criteria.
Although each ISO/RTO approaches reliability in different ways, all must meet the same
general reliability requirements as defined by the North American Electric Reliability
Corporation (NERC).3
▪ Longer-term planning reliability standards, considered in this report, provide
guidelines designed to minimize service disruptions due to inadequate installed
resources.4 NERC recommends sufficient resources to support one loss-of-load event
every 10 years (“1-in-10 standard”) which is often translated into a planning reserve
margin level.5 This standard implies that installed capacity is adequate if service
interruptions caused by supply shortages occur less often than once every decade.
▪ Shorter-term operational reliability standards provide requirements intended to
minimize the potential for cascading events that cause uncontrolled blackouts by
ensuring adequate resources are committed to meet near-term load and/or are
available to respond to near-term uncertainties. Short-term uncertainties include a
loss of resources (i.e., contingency response), load forecast error, and variable
resource performance and may have different time horizons over which they
materialize (ranging from seconds to hours). These standards form the basis for the
ancillary service products and requirements in each ISO/RTO and also influence
transmission system operation (e.g., how transmission interface limits are
established).
To meet these reliability standards, all of the ISOs/RTOs have:
▪ Energy markets and ancillary service procurements that utilize resources in a least-
cost, security-constrained economic dispatch.6 These constructs focus on allowing
resources to recover their short-run costs (e.g., variable operating expenses, fuel
costs) and serving load and other reliability requirements at least cost.
▪ Resource adequacy constructs that influence investment in resources to meet peak
demand, provide energy to meet expected demand, and provide flexibility to respond
to uncertainties on the system that may materialize. Resource adequacy constructs
3 NERC, United States Mandatory Standards Subject to Enforcement.
4 While not discussed in this report, transmission, especially for constrained locations, can also be an important component of resource adequacy. In general, this report focuses on system resource adequacy and does not discuss the locational aspects of these constructs. However, in many cases, the discussion on the system aspects of resource adequacy largely covers the locational aspects.
5 For purposes of this report, the term “resource” refers to existing resources and proposed projects. The term “existing resource” refers to existing operating facilities including demand control technologies and energy efficiency. The term “project” refers to new proposed facilities including demand control technologies and energy efficiency. Also, for ease of writing, the report generally speaks in terms of supplying energy, rather than supplying energy and/or reducing demand; however, this should not be read as assuming that demand responsiveness does not play a critical role in well-functioning markets.
6 For purposes of this report, uplift is ignored; however, uplift is an important part of the marginal incentive structure in the EAS markets to ensure that resources have the proper incentives to follow dispatch instructions.

Resource Adequacy Constructs in Organized Wholesale Markets
EXETER ASSOCIATES, INC. Page | 4
are focused on allowing suppliers to recoup fixed costs that may not be recovered
through the EAS markets.
▪ ISO/RTO-administered programs that target specific technologies or resource types
for a specific reliability or policy reason. These programs may have market-like
properties but usually, by nature, limit who can participate and usually are
established either because of challenges within market design or requirements
making it difficult to establish a competitive market structure. Examples include
black-start programs,7 demand response programs,8 and fuel procurement (winter
reliability) programs.9 These programs can influence investment decisions and
market prices.
Finally, investment decisions are further influenced by state and federal programs (e.g., the
regional greenhouse gas initiative [RGGI], renewable portfolio standards [RPS], and
investment tax credits [ITCs]). These programs can reduce suppliers’ fixed or operating
costs and/or increase revenue opportunities. They can also influence how resources
participate in EAS markets or resource adequacy constructs and the resulting market
prices.10,11
7 Black-start programs provide compensation (costs plus) to specific resources that are required to restore the
system in case of a full or partial system blackout. Black-start service is difficult to provide through a market construct because the resources that can provide this service within the system restoration plan are often very limited and specific.
8 Demand response programs provide compensation to providers and participating customers that can commit to reducing load in response to a signal. In addition to the reduction in costs associated with the action (e.g., reduced energy costs due to lower consumption), these programs can also compensate demand response providers as a form of dispatchable supply. Programs are often required because of the wholesale-retail interaction challenges with demand participation.
9 ISO New England (ISO-NE), for example, has maintained various winter reliability programs that provide compensation for resources that are able to demonstrate on-site stored energy. These programs effectively compensate generators to maintain fuel inventories at levels above what suppliers may have done without the program and are a form of insurance for the market for cold weather operation. These types of programs are often stop-gaps until more complete market solutions can be developed to create incentives to support reliability needs.
10 For example, production tax credits (PTCs) and renewable energy credits (RECs) can allow certain renewable resources to offer negative prices into energy markets. RGGI, meanwhile, results in suppliers with emitting resources offering a higher price for their energy based on the cost of emissions.
11 While not discussed in this report, siting and environmental requirements also provide specific obligations, often around location and operational parameters, for resources on the basis of social, economic, or environmental impacts. These can influence the type and location of investments. Examples include limiting the ability to use backup fuel to specific conditions, requiring scrubbers for various emissions, or limiting the run times of a resource in some way.

Resource Adequacy Constructs in Organized Wholesale Markets
EXETER ASSOCIATES, INC. Page | 5
2.1 Energy Markets
Energy markets are designed to ensure that there is adequate supply to meet demand on a
5- to 15-minute basis in real-time. Offers in the energy markets are formulated based on
the short-run, variable operating costs of resources, mostly input fuel costs. Offers can also
reflect costs associated with long-term service agreements, emissions, or the opportunity
cost of providing energy and/or not consuming energy.12
The marginal resource for each interval in the energy market (i.e., the resource that is
setting the price) earns no inframarginal rents through the markets (i.e., it just covers its
short-run costs), while all other resources earn some level of inframarginal rents based on
their variable operating costs and the energy price. Further, resources that are used
infrequently (e.g., only to serve load during peak days of the year or in response to system
contingencies) may earn little revenues through the energy markets—even if there are
inframarginal rents when dispatched. Load generally does not participate in the real-time
energy markets beyond a limited amount of demand response (usually participating on the
supply side).
ISOs/RTOs complement real-time energy markets with additional short-term forward
markets that coordinate the commitment of the system for the upcoming operating day. A
day-ahead market construct commits participating generators the day prior to the operating
day based on bid in demand (i.e., load-serving entity [LSE] submitted expectation of
demand). Each ISO/RTO also runs processes (e.g., reserve adequacy analysis [RAA]) after
clearing the day-ahead market to ensure supply is available to meet expected demand and
ancillary service requirements. Timing of the day-ahead market and the RAA is somewhat
coordinated with the gas scheduling nomination windows to facilitate nomination and
scheduling of natural gas to meet expected gas-fired generation demand. Additionally, there
are forward energy markets of exchange-traded and OTC products that are outside of the
ISO/RTO-administered markets, but are nonetheless complementary to ensuring supply is
positioned to meet expected demand. Most exchange or OTC products settle against the
day-ahead energy market prices, even though some can settle against the real-time energy
prices.
Resources that expect to be able to perform consistently, especially during periods of higher
prices, have the potential to earn more inframarginal rents than those that perform in
periods when energy is not as valuable or that have inconsistent performance. The energy
market is a pay-for-performance construct that inherently links the value of energy and
reliability (i.e., as the system is less reliable or more constrained, prices should rise).
12 Market mitigation rules generally limit the ability of a resource to offer above its short-run costs beyond certain
thresholds.

Resource Adequacy Constructs in Organized Wholesale Markets
EXETER ASSOCIATES, INC. Page | 6
2.2 Ancillary Service Procurement
Ancillary service markets are designed to procure services required to maintain
shorter-term operational reliability from resources with compatible capabilities.
These include:
▪ Fast-response (i.e., 10- to 30-minute) reserves that help manage the uncertainties
(e.g., loss of a large resource, under-forecasting load, variable energy resources)
that may materialize during real-time operations.
▪ Even faster-responding (i.e., 4- to 10-second) regulation resources that address
second-to-second imbalances in supply and demand and maintain system frequency
at 60 Hz in real-time.
▪ Resources capable of providing reactive power or black-start capability.
Compensation is often based on cost-of-service principles and is not valued through
the energy market.
Ancillary services (reserves and regulation) procured in conjunction with the energy
markets have prices comprised generally of two components: cleared ancillary
service offer price and lost opportunity cost for not providing energy.13
Regulation and reserves are generally co-optimized in real-time (and, for certain
ISOs/RTOs, in the day-ahead market as well) with energy dispatch to achieve the least-cost
outcome for energy, regulation, and reserve requirements. When the normal economic
dispatch for energy does not result in sufficient reserve capability, higher-cost resources are
dispatched “up” to provide energy and lower-cost resources are dispatched “down” to
provide ancillary services. The difference in energy cost between the lower-cost resource
providing the ancillary service and the higher-cost resource providing energy forms the
basis for the lost opportunity cost included in the ancillary service price. The energy price is
based on the offer of the higher-cost resource. The resultant EAS prices should make
resources indifferent to providing energy versus ancillary service.14
Ancillary services provide another mechanism for suppliers to earn inframarginal
rents to offset fixed costs. These services value specific capabilities required to
maintain system reliability beyond just energy and, therefore, provide an investment
signal to the market around the value of these types of capabilities. However, these
requirements generally reflect a very small portion of the overall installed capability
of the system and generally do not result in significant costs to load, even if they
may reflect a large portion of inframarginal rents for certain resources.
Similar to energy markets, resources that expect to be able to provide ancillary services
consistently, especially during periods of higher prices, have the potential to earn more
13 Not all ISOs/RTOs acquire ancillary services through a market or allow suppliers to offer to provide these
services. Rather, the value of some ancillary services may only reflect the lost opportunity of not providing energy.
14 While in concept the ISOs/RTOs price EAS in a similar manner, there are many different approaches to how EAS prices are established which can result in significantly different outcomes from region to region.

Resource Adequacy Constructs in Organized Wholesale Markets
EXETER ASSOCIATES, INC. Page | 7
inframarginal rents than those resources that may perform in periods where ancillary
services are not as valuable or have inconsistent performance. Ancillary services are also a
pay-for-performance construct that links the value of ancillary service with reliability benefit
to the system.15
2.3 Regulatory Programs
There are numerous federal, state, and utility programs (i.e., regulatory programs) that
affect electricity markets, including tax incentives, attribute credits, and long-term
contracts, that are established to accomplish various objectives (e.g., meeting clean energy
standards or reducing demand at specific times). In most cases, regulatory programs have
the effect of providing revenues (or reducing costs) to specific resource types or categories.
For example, certain states establish requirements for LSEs to acquire energy attributes for
a portion of their load as part of a clean energy standard or RPS. States (often through
distribution utilities) may also enter into contracts with resources to support their
development and/or operation. Federal programs usually focus on specific tax incentives
such as the ITC for solar or production tax credit (PTC) for wind.
Many regulatory programs tie incentives to overall production rather than performance
during targeted periods, which can create a disconnect between the supply that is being
acquired through resource adequacy constructs and the supply being acquired/targeted
through these programs. The production encouraged by these programs may not align with
reliability needs on an hourly basis and, in some circumstances, may create new challenges
(e.g., increased evening ramping requirements when solar production decreases).
2.4 Resource Adequacy Constructs
While inframarginal rents through the EAS and regulatory programs are sufficient to
promote some investment in resources, it is generally accepted that these structures, on
their own, are not sufficient to achieve longer-term reliability requirements. That is, the
“marginal resource” in the energy market or the resource just providing reserves would
likely not earn sufficient revenues to cover their fixed costs.
This revenue deficiency is caused by a combination of price and offer caps, mitigation of
supply offers, and lack of a robust demand participation, all of which limit the ability for (the
expectation of) EAS prices to rise to the level to support the investments necessary to meet
longer-term planning reliability targets (or consumers’ willingness to pay for reliability).
The absence of market incentives to develop sufficient installed capacity for longer-term
planning reliability requirements is often referred to as the missing money problem. This
problem can be thought of simply as the difference between a resource’s expected EAS
revenues and either an existing resource’s expected going-forward cost (i.e., fixed costs
15 Since some ancillary services such as reserves do not necessarily require performance, but rather a
demonstration of capability, rules must ensure that there are proper incentives for suppliers to reflect their true capability and for the market to select resources with the greatest probability of performance. ISOs/RTOs have established different penalty and quantity eligibility rules to manage this dynamic.

Resource Adequacy Constructs in Organized Wholesale Markets
EXETER ASSOCIATES, INC. Page | 8
plus the return required for the resource to continue to remain operational) or a new
project’s expected capital costs and going-forward costs.16 The missing money for a new
project is also referred to as the net cost of new entry (CONE).17
In the absence of additional compensation, suppliers that do not expect sufficient
inframarginal rents to meet their costs may retire existing resources and/or fail to propose
new projects—to the detriment of reliability. Insufficient inframarginal rents can result in
lack of investment in existing resources, which over time can also result in resources not
being able to perform when the system requires them.
While each of the ISOs/RTOs have constructs in place to address the missing money
problem, there are significant differences between how each ISO/RTO addresses resource
adequacy, even among those that employ similar approaches. There are four constructs
used by the ISOs/RTOs for resource adequacy: (1) Shortage Pricing;18 (2) Operating
Reserve Demand Curves (ORDCs); (3) Capacity Demonstration; and (4) Capacity Markets.19
Most regions also include some form of a back-stop mechanism that allows the ISO/RTO to
procure new projects or retain existing resources under limited circumstances where the
market does not achieve the outcome on its own and the reliability risk of not taking action
is deemed too great.20
Table 2 provides an overview of the constructs used in each of the ISO/RTO regions as their
resource adequacy approach.21,22
16 While this report refers to EAS revenues as being the primary drivers for revenue and associated investment
decisions, these market structures establish the spot price, which then drives forward trading and hedging by parties. Many suppliers and buyers have forward arrangements that provide them less volatile revenue streams, so while the basis for the decisions is the spot price, very few suppliers are paid and very few LSEs are charged the spot price.
17 Net CONE is the difference between the revenues and costs, usually calculated on a levelized basis over the expected economic life of a facility (i.e., the average annual value required over time to recover costs).
18 The terminology “shortage pricing” and “scarcity pricing” are used interchangeably.
19 While some of these constructs also improve short-run incentives (e.g., procure fuel at high prices, return early from an outage, cancel an outage), the focus of this report is on the long-run investment incentives.
20 For new projects, this is often done through some sort of request for proposal and would likely result in a longer-term arrangement being put into place. For existing resources, this is accomplished by requesting that a resource continue operation for a certain period under a cost-of-service agreement. The use of these back-stop mechanisms generally reflects a market failure to obtain adequate investment. These approaches, which are generally used infrequently, are not discussed further in this report.
21 Although many observers describe the Electric Reliability Council of Texas (ERCOT) as an “energy-only” market, it is more accurately characterized as depending on shortage pricing and ORDC constructs to allow for the recovery of the missing money. A pure, energy-only market construct depends on a significant amount of price-sensitive demand and would not require administrative price caps for energy (these would still exist for ancillary services at some level). This approach is not used in any of the U.S. ISOs/RTOs.
22 “Resource adequacy approach” refers to the collection of resource adequacy constructs used within a region.
Resource Adequacy Constructs in Organized Wholesale Markets
EXETER ASSOCIATES, INC. Page | 9
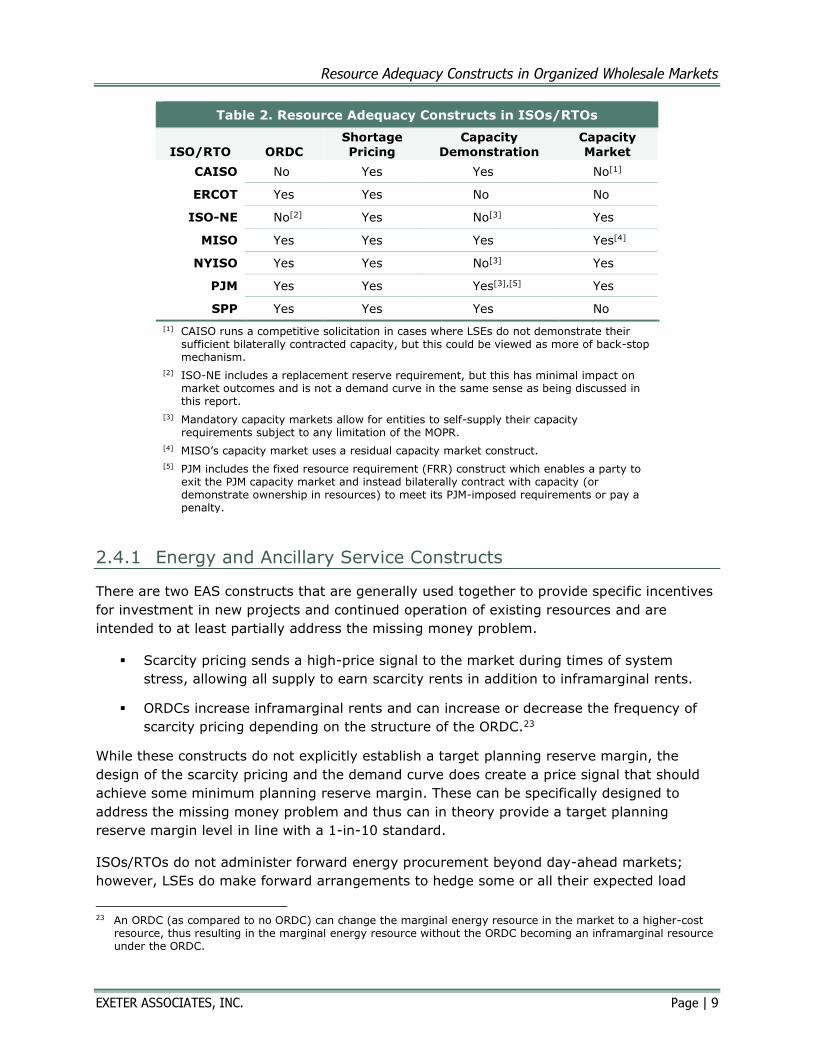
Table 2. Resource Adequacy Constructs in ISOs/RTOs
ISO/RTO ORDC
Shortage
Pricing
Capacity
Demonstration
Capacity
Market
CAISO No Yes Yes No[1]
ERCOT Yes Yes No No
ISO-NE No[2] Yes No[3] Yes
MISO Yes Yes Yes Yes[4]
NYISO Yes Yes No[3] Yes
PJM Yes Yes Yes[3],[5] Yes
SPP Yes Yes Yes No
[1] CAISO runs a competitive solicitation in cases where LSEs do not demonstrate their sufficient bilaterally contracted capacity, but this could be viewed as more of back-stop mechanism.
[2] ISO-NE includes a replacement reserve requirement, but this has minimal impact on market outcomes and is not a demand curve in the same sense as being discussed in this report.
[3] Mandatory capacity markets allow for entities to self-supply their capacity requirements subject to any limitation of the MOPR.
[4] MISO’s capacity market uses a residual capacity market construct.
[5] PJM includes the fixed resource requirement (FRR) construct which enables a party to exit the PJM capacity market and instead bilaterally contract with capacity (or demonstrate ownership in resources) to meet its PJM-imposed requirements or pay a penalty.
2.4.1 Energy and Ancillary Service Constructs
There are two EAS constructs that are generally used together to provide specific incentives
for investment in new projects and continued operation of existing resources and are
intended to at least partially address the missing money problem.
▪ Scarcity pricing sends a high-price signal to the market during times of system
stress, allowing all supply to earn scarcity rents in addition to inframarginal rents.
▪ ORDCs increase inframarginal rents and can increase or decrease the frequency of
scarcity pricing depending on the structure of the ORDC.23
While these constructs do not explicitly establish a target planning reserve margin, the
design of the scarcity pricing and the demand curve does create a price signal that should
achieve some minimum planning reserve margin. These can be specifically designed to
address the missing money problem and thus can in theory provide a target planning
reserve margin level in line with a 1-in-10 standard.
ISOs/RTOs do not administer forward energy procurement beyond day-ahead markets;
however, LSEs do make forward arrangements to hedge some or all their expected load
23 An ORDC (as compared to no ORDC) can change the marginal energy resource in the market to a higher-cost
resource, thus resulting in the marginal energy resource without the ORDC becoming an inframarginal resource under the ORDC.

Resource Adequacy Constructs in Organized Wholesale Markets
EXETER ASSOCIATES, INC. Page | 10
through exchanges, OTC products, and contracts. These arrangements shift risk from load
servers to suppliers and are comparable to some forward capacity constructs.24
Shortage Pricing
All of the ISOs/RTOs employ some form of shortage pricing in their real-time energy
market.25 Shortage pricing occurs when the power system experiences shortages (or
scarcity) of energy or ancillary services.
There are two types of shortage conditions that can occur:
1. Transient (or operational) supply shortages are usually related to unplanned events,
such as load or variable energy resource forecast errors or resources suddenly
becoming unavailable beyond what the system was positioned for during that
operating day. During a transient supply shortage, the system is under stress, but
there are other available resources that can come online in response to the shortage,
but likely will take time before they are providing energy. These events can occur
regardless of how much installed capacity there is on the system.
2. Inadequate (or planning) supply shortages occur when the total available installed
capacity on the system is not sufficient to meet energy demand and ancillary service
requirements because of high loads and/or significant resource unavailability. These
events are generally longer in duration and reflect conditions where there are no
other available resources that could be called upon to address the shortfall. The
probability of these events is usually what is analyzed when calculating the planning
reserve margin (e.g., 1-in-10 standard) under specific resource performance
assumptions.
Generally, scarcity of an ancillary service results in all providers of that ancillary service
being paid based on the price cap for that ancillary service. Increases in ancillary service
prices also increase energy prices. When there are shortages of ancillary service
products, these prices are conceptually added together since ancillary service constraints
are usually additive (e.g., resources providing 10-minute reserves can also provide
30-minute reserves). This can result in high prices for EAS when the system is
constrained. Shortage pricing results in EAS prices increasing to levels above the short-
run costs of supply. In concept, when a shortage price materializes, all resources
providing energy or ancillary services earn scarcity rents in addition to inframarginal
rents.
There are two approaches to setting the price caps that drive scarcity pricing in the
markets.
24 Forward energy contracts would likely be shaped based on the LSE’s expected load. Forward capacity
constructs, by contrast, procure “peak load” which may exceed the level of load an LSE would choose to hedge.
25 Generally, scarcity pricing is not observed in the day-ahead markets because, under most operating conditions, there are expected to be enough resources available to meet expected load and ancillary service requirements. Differences in scarcity prices between the day-ahead and real-time markets can create significant market problems; however, this is limited to more extreme conditions.

Resource Adequacy Constructs in Organized Wholesale Markets
EXETER ASSOCIATES, INC. Page | 11
▪ Most ISOs/RTOs set their ancillary service price caps (or penalty factors) at least
at a level that allows for redispatch to maintain the EAS requirements under most
conditions (e.g., $1,000-$2,000/MWh) when supply is available. This allows for
the dispatch to optimize all available resources to meet the EAS requirements,
and reduces the need for operators to take manual actions outside of the market
which can result in uplift and inappropriate price signals (e.g., prices decline
during times of shortages).26
▪ Certain ISOs/RTOs (e.g., the Electric Reliability Council of Texas [ERCOT]) set
price caps higher than required for redispatch to provide an additional signal to
the market during shortage conditions.27
Operating Reserve Demand Curves
As discussed above, most of the ISOs/RTOs co-optimize ancillary services and real-
time energy. However, how each region formulates its requirements for ancillary
services varies. NERC provides guidelines regarding what is required to manage area
control error (ACE) and frequency through regulation and contingency response
through operating reserves, but also provides latitude to ISOs/RTOs when
determining the quantity and types of ancillary service products. Ancillary service
requirements may be time-of-year dependent or event-driven.
ISOs/RTOs can reflect demand for these products in the market through two
approaches:
1. A fixed requirement can be thought of simply as vertical demand, meaning that the
ISO/RTO is willing to procure supply at prices as high as the cap until it meets a
specific, generally minimum, requirement.
2. A variable requirement, or demand curve, reflects sloped demand where a set of
prices and quantities is specified beyond, and possibly before, the fixed requirement,
thereby assigning value to providing ancillary services at quantities above and below
the minimum requirement.28
ORDCs are often established through a combination of analysis that is targeted to
achieve an objective (e.g., reduce probability of shortages of minimum ancillary
26 The Federal Energy Regulatory Commission’s (FERC’s) orders on shortage pricing
(https://www.ferc.gov/sites/default/files/2020-05/settlement825.pdf) and energy market offer caps (https://www.ferc.gov/sites/default/files/2020-06/RM16-5-000.pdf) required all FERC-jurisdictional ISOs/RTOs to have shortage pricing and increased the energy market offer cap to $2,000/MWh from $1,000/MW with review from the market monitor. Not all ISOs/RTOs have revisited their ancillary service price caps under the revised energy market offer cap.
27 These price caps can create seams issues between regions if one region has significantly higher prices than another region that is also in shortage. Power should generally flow to the higher-value region and prices may send the wrong signal about which region is under greater stress. There are usually operating protocols to manage this issue between regions.
28 Demand curves do not necessarily need to start at the fixed requirement. In concept, demand curves could reflect a willingness to procure less than the minimum requirement at certain prices; however, this is generally not the approach used in the ISOs/RTOs especially for contingency response which, if it cannot be maintained, could require the ISO/RTO to shed load pre-contingency.

Resource Adequacy Constructs in Organized Wholesale Markets
EXETER ASSOCIATES, INC. Page | 12
service requirement) and a stakeholder process. The total revenue impact is a
function of the demand curve structure.
Since ancillary services are often co-optimized with energy, the use of an ORDC that
extends beyond the fixed requirement increases the value of ancillary services
because the demand curve reflects a willingness to buy more ancillary services at
lower prices (as compared to a fixed requirement).29 While the higher ancillary
service requirements associated with an ORDC are expected to increase
inframarginal rents in the market (i.e., changes in the marginal resource for energy
and ancillary service), the ORDC may also reduce both the frequency of transient
supply shortages and general volatility in real-time market prices by making more
resources available to respond to unexpected system conditions (as compared to not
having an ORDC or smaller quantity requirement).
2.4.2 Capacity Constructs
Capacity constructs are a more direct, transparent structure (since forward requirements
are established and the obligated resources are generally known) to both target a certain
planning installed reserve margin to meet the 1-in-10 standard and address the missing
money problem (as compared to an energy-only approach). These structures are often
thought of as procuring insurance (e.g., a call option on energy at a high strike price) to
minimize the likelihood that load is not served. There are two approaches used to acquire
capacity and, to some degree, most ISOs/RTOs use aspects of both:
1. Capacity demonstration constructs place the requirement to show sufficient resource
adequacy on LSEs, even though capacity requirements are still established by a
regional entity. LSEs are responsible for meeting their obligations (either through
contracting or through resources they own) in whatever manner best suits them
(subject to state rules and requirements) and paying the accompanying costs.
2. Capacity markets procure resources to meet regional resource adequacy
requirements on behalf of LSEs through a competitive process. Thereafter, the costs
of procurement are assigned to LSEs based on the established rules.
The fundamental difference between the capacity constructs is the mechanism for how
capacity is acquired (auction versus ownership/contracting). Interestingly, most capacity
markets have some level of capacity demonstration (ownership/contracting) through the
LSE self-supply option or other out-of-market arrangements and, in the PJM Interconnection
[PJM], through the fixed resource requirement [FRR] option as well. Residual capacity
markets only procure an incremental requirement that LSEs did not demonstrate as meeting
through contracting or ownership. Other differences between these approaches include what
29 Defining the minimum amount of an ancillary service that is required is becoming more challenging for the
ISOs/RTOs as the power system continues to evolve to include more variable and distributed energy resources. The uncertainty associated with the performance of these resources and load has resulted in the ISOs/RTOs beginning to evaluate and adopt alternatives to traditional “contingency response” requirements such as procuring more ancillary services to manage general uncertainty or establishing ramping requirements.

Resource Adequacy Constructs in Organized Wholesale Markets
EXETER ASSOCIATES, INC. Page | 13
entity is responsible for the investment risk associated with acquiring supply and the ability
for resource selection to not be impacted by the MOPR.30
Capacity demonstration and capacity market constructs share many design elements and
may even result in similar outcomes in many ways. For example, a capacity market that is
dominated by self-supply would appear similar to a capacity demonstration approach.31 Both
constructs include assumptions for how to determine demand and the willingness to pay for
capacity, rules about eligibility to provide capacity, consequences for non-performance (or
not), and protections for market power. The assumptions that drive each construct influence
the quantity and price of capacity, and therefore entry and exit decisions in the market.
Both approaches can over- or under-acquire capacity, if parameters are not set properly, or
have strong or weak resource performance incentives.
Capacity Demonstration
Capacity demonstration is most common in markets served by vertically integrated utilities,
including fully regulated electricity markets (i.e., non-restructured states) and ISOs/RTOs
that defer to state- or utility-specific resource adequacy plans.
A capacity demonstration approach requires that LSEs demonstrate that they have
arrangements in place with supply resources based on the forecasted peak demand and a
reserve margin. The entity responsible for resource adequacy establishes the capacity
requirement that must be met by each LSE and a “penalty price” that an LSE would have to
pay if they cannot demonstrate this level of capacity, thereby creating a signal for
investment to meet capacity requirements. The penalty price is often derived from net
CONE and can be scaled at different levels based on the level of capacity shortfall. The
requirements are established through studies related to meeting a 1-in-10 standard which
generally is reflected as a fixed demand. The entity responsible for resource adequacy also
establishes the rules for how much capacity can be provided by each resource type. While
the actual demonstration of acquired capacity often occurs close to the delivery period, this
structure creates a strong incentive for LSEs to proactively act ahead of time to meet their
obligations.
The resources used to demonstrate capacity come from three sources: contracts with
merchant supply, contracts with other LSEs/utilities for their excess capability, or supply
that is owned by the LSE/utility. How each LSE provides or procures from each of these
pools depends on its specific resource adequacy needs, capacity costs, and state or market
requirements.
Payment for resource adequacy capacity under capacity demonstration is often subject to
direct cost recovery; LSEs make investments or enter contracts consistent with state
30 The MOPR has only been applied in regions with mandatory capacity markets and not areas like the
Midcontinent ISO (MISO), which runs a voluntary residual capacity auction.
31 If all LSEs chose to self-supply in a capacity market (either through the market or through arrangements outside of the market), then this is effectively a capacity demonstration approach or could be considered a residual capacity market as outcomes would largely mirror what would occur in a residual market construct (assuming no MOPR).

Resource Adequacy Constructs in Organized Wholesale Markets
EXETER ASSOCIATES, INC. Page | 14
requirements. These commitments guarantee supplier revenues, subject to regulatory
approval or compliance with contract terms and conditions.32 In this context, the onus to
manage consumer risk rests on regulators that oversee investment or procurement
decision-making.
Integrated resource planning (IRP) is a common approach used to ensure that the LSE has
adequate supply to meet defined capacity requirements. An IRP process includes both an
assessment of future electric needs (often 10 to 20 years out) and proposals on how to
meet these longer-term needs. The LSE usually oversees the preparation of an IRP subject
to state regulatory oversight and can incorporate any state/local requirements to identify
the least-cost mix of resources to meet not only resource adequacy requirements, but other
requirements (e.g., clean energy). Since there is no MOPR in these constructs, this provides
LSEs with flexibility. LSEs generally should be looking to determine the least-cost set of
resources to meet both resource adequacy and any other state requirements (e.g., clean
energy); they should not evaluate either of these requirements in isolation.
Capacity demonstration approaches can be complemented by a voluntary residual capacity
market construct which provides another mechanism to enable arrangements between LSEs
and suppliers to meet their capacity requirements. These have many of the properties of
capacity markets (discussed further in the next section), but are considered voluntary on
both the supply and demand side as LSEs can make other arrangements to meet their
requirements.
Most capacity demonstration constructs include obligations (e.g., offer into the day-ahead
market) and can include penalty constructs to influence availability and performance. These
vary significantly from region to region.
Reference Appendix A, “PJM Resource Adequacy Constructs” and Appendix B, “Other
Resource Adequacy Constructs” for additional discussion on how these approaches are used
in the Southwest Power Pool (SPP) and the California ISO (CAISO).
Capacity Markets
Capacity markets primarily exist in restructured electricity markets, meaning utility
generation (and sometimes retail services) are separate from transmission and distribution
services. ISOs/RTOs, subject to Federal Energy Regulatory Commission (FERC) oversight,
oversee region-wide resource adequacy. Requirements for participation in these markets
are mandatory on both the demand (who has to pay for whatever is procured) and supply
side (for those supply resources with capacity interconnection service).33
A capacity market procures the potential to provide energy or ancillary services from a
supplier based on the forecasted peak demand, a planning reserve margin, and a maximum
32 Not all arrangements may shift risk, as merchant investment can occur and be sold to LSEs using shorter-term
arrangements. This is more challenging for suppliers, though, unless the investment is cost-effective based on expected EAS revenues alone since there is no capacity market that provides some level of guaranteed revenue in the future to recover missing money.
33 This report does not discuss capacity interconnection service; however, the rules that establish how this is established and retained can have significant impacts on costs and location of resources.

Resource Adequacy Constructs in Organized Wholesale Markets
EXETER ASSOCIATES, INC. Page | 15
willingness to pay. Most ISOs/RTOs use a demand curve, which was created through a
combination of analysis and the stakeholder process, rather than a fixed requirement
approach. ISOs/RTOs serve as a central clearinghouse for all procured capacity and
generally require capacity-interconnected supply to participate in capacity auctions.
Capacity markets do allow for bilateral arrangements made outside of the market. These
arrangements can be reflected in the market through the self-supply option or just generally
through how supply participates if arrangements are made outside the market.34
Capacity markets create longer-term market signals to incentivize entry and exit behavior in
the market. The equilibrium capacity market price should, in theory, approach net CONE
over time which provides an incentive for new investors to enter the market once the level
of supply declines to a certain point or the cost of the existing supply begins to exceed a
project developer’s expectation of net CONE, since prices at this level would allow for the
recovery of their missing money. While prices may fluctuate above and below net CONE
over the expected life of a project, as long as they are, on average, around net CONE,
merchant investment should happen in the market when needed. This is why the demand
curve shape is often anchored around the reliability requirement and net CONE.
When a new project clears in the capacity market, it is not guaranteed to recover its costs
over the life of the project. Capacity markets are structured to place risk on merchant
investors rather than load (even though load can choose to self-supply through longer-term
arrangements subject to the MOPR). If a project becomes unprofitable due to declining
revenues, capacity market or otherwise, investors bear this risk.
Most capacity market constructs include obligations (e.g., offer into the day-ahead market)
and penalty constructs to influence availability and performance. These vary significantly
from region to region.
Finally, ISOs/RTOs assign the cost of capacity to LSEs based on their share of the procured
capacity and the location, generally using some form of peak load. LSEs who self-supply
only pay for the portion of their capacity obligation that is not self-supplied, while LSEs that
contract outside of the capacity market manage the financial arrangements directly with
their counterparties (similar to under a capacity demonstration construct).
Reference Appendix A, “PJM Resource Adequacy Constructs” and Appendix B, “Other
Resource Adequacy Constructs” for additional discussion on how these approaches are used
in PJM, ISO New England (ISO-NE), and the New York ISO (NYISO).
34 These arrangements could be the result of an IRP or a direct contracting process. When a demand curve is
used, it is more complicated for LSEs to self-supply since their final requirement is not known until after the auction clearing. The MOPR has disrupted the ability of the self-supply construct to be used in certain cases.

Resource Adequacy Constructs in Organized Wholesale Markets
EXETER ASSOCIATES, INC. Page | 16
2.5 Investment in Electricity Markets
Most investments in electricity markets have significant capital requirements.35
Consequently, it is important to consider the interaction between electricity market
structures and the basis for investment. The structure and stability of resource adequacy
constructs contribute to the attractiveness and total cost of investment by impacting
revenue quantity and consistency. The nature of market revenues, in turn, affects the debt
and equity financing available to a project as well as the project’s overall cost.
Ideally, resource adequacy constructs (and other structures that generate revenues) should
attract sufficient investment to support the reliable delivery of power to serve load (but not
excessive investment). However, while these constructs are critical to sending the spot price
signal to promote necessary investment in long-lived electricity assets, very few projects
depend solely on spot market revenues (including a year-to-year capacity payment).
Rather, a combination of cost-of-service agreements, power purchase agreements (PPAs)
and financial hedges provide a fixed revenue stream that enables developers to finance
projects and cover the debt service.36
▪ Projects that are supported by longer-term arrangements (e.g., a 25-year PPA or a
cost-of-service arrangement) are not especially risky for the project developer as the
risk is transferred to the PPA counterparty.37 These projects are likely to carry more
financing through debt (e.g., 70%) and thus have a lower cost of capital.
▪ Projects being developed by larger corporations can leverage balance sheet financing
(i.e., corporate debt) rather than project finance debt. In these cases, a large
corporate entity is backing the debt (as opposed to a single, small project developer)
so lenders are more willing to provide debt financing because of the perceived lower
risk of the larger entity defaulting. This approach has a lower cost of capital as debt
and equity (e.g., 50/50 split).
▪ Projects that are supported through shorter-term financial hedges generally are
riskier. However, this risk is largely carried by the equity investors—rather than
being passed on to another counterparty—since the project is more dependent on
merchant revenues to justify the investment. These projects are likely to carry less
financing through debt and thus can have a higher cost of capital.
It is challenging for non-balance sheet financed projects to obtain debt financing without the
ability to reflect some level of certainty in payments that it can use to provide a guarantee
35 Daniel N. Budofsky, Michael T. Reese, Michael S. Hindus, and Olivia Matsushita, Financial Hedges for United
States Gas‐Fired Power Generation Facilities, Pillsbury White Paper, June 5, 2017;
Christine Brozynski and Connie Gao, Lending to hedged wind and solar projects, Norton Rose Fulbright, February 10, 2020.
36 The Brattle Group, ERCOT Investment Incentives and Resource Adequacy, June 1, 2012.
37 PPA counterparties range from equity investors looking to make a profitable investment to LSEs looking for a specific hedge, to meet specific environmental requirements or to make a profitable investment.

Resource Adequacy Constructs in Organized Wholesale Markets
EXETER ASSOCIATES, INC. Page | 17
to a lender over some term (generally at least five years). Without some debt financing,
most projects are not able to move forward.
Several capacity constructs allow “rate locks” that span multiple years specifically for the
purpose of supporting debt financing (i.e., they provide certainty). This feature is provided
by the ISOs/RTOs for effectively no cost. A rate lock generally reduces the CONE by
reducing the costs associated with getting into alternative arrangements (e.g., a financial
hedge) and removing potential volatility in future capacity prices that otherwise may drive
up new entrant offer costs.38 Recently, the FERC determined that the seven-year rate lock
offered by ISO-NE is not just and reasonable and eliminated this as an option because it
resulted in discriminatory pricing for new entrants.39 The rate lock in PJM only applies to
some new resources and is limited to three years.
38 This is the case for resources that may recover much of their costs through a capacity construct. For many
renewable resources that only recover a relatively small portion of their capital cost through the capacity market, the rate lock likely does not provide enough revenues to replace other arrangements needed to obtain necessary financing.
39 173 FERC ¶ 61,198, Docket No. EL20-54-000, ISO New England Inc., Order on Paper Hearing, issued December 2, 2020.

Resource Adequacy Constructs in Organized Wholesale Markets
EXETER ASSOCIATES, INC. Page | 18
3 EVALUATION APPROACH
All resource adequacy constructs attempt to achieve similar outcomes: acquire adequate
supply to reduce the risk of unserved load. While there are trade-offs between different
constructs, the results of any given resource adequacy approach are more a function of how
well it is designed and the ability to set the various administrative input parameters (e.g.,
demand, net CONE, value of lost load [VOLL]) properly than the actual construct (or overall
approach) selected. For this reason, resource adequacy constructs are often considered
administrative in nature. While all markets have administrative rules, resource adequacy
constructs go a step further in many ways by trying to control for a specific outcome
through the various demand parameters and, in many cases, limitations on which resources
can supply these products.40
Ideally, a resource adequacy approach’s performance could be measured based on their
observed information; however, it is difficult to measure the actual effectiveness or
performance of a resource adequacy approach ex-post because:
▪ Most regions employ multiple constructs in their overall resource adequacy approach
which, while having a primary construct that is focused on the missing money,
makes analysis of where a resource adequacy approach may not be performing
challenging.
▪ Load is not able to express its true willingness to consume, thereby requiring
administrative parameters as a proxy for load’s willingness to consume at various
levels of reliability.
▪ By design, the shedding of firm load is a low-frequency event and identifying and
measuring “near misses” can be challenging.
▪ Assumptions (e.g., expected load levels, expected resource performance) that the
system is planned for do not materialize in real-time operations, and therefore do
not allow for complete understanding of whether the resource adequacy construct is
performing properly.
▪ Regulatory programs (or other external action) may promote investment (or prevent
retirement) independent of the resource adequacy approach, making it difficult to
understand how well an approach is performing.
▪ Even when firm load shedding occurs, if the scenario that caused the event is beyond
the assumptions used when developing the resource adequacy construct, then the
event is not necessarily a failure of the resource adequacy construct. Instead, load
shedding in this case may reflect failure(s) when making the input assumptions used
for reliability (e.g., load forecast error, incorrect resource performance assumption)
or cost assumptions (e.g., did not provide for enough missing money to promote
40 Nearly all resource adequacy constructs are dependent on demand curves to achieve their outcomes. Demand
curves, albeit simpler that other administrative price schemes, are an administrative pricing construct.

Resource Adequacy Constructs in Organized Wholesale Markets
EXETER ASSOCIATES, INC. Page | 19
investment, did not reflect load’s true willingness to consume), or may simply be an
event that is beyond what the design was intended to cover.
▪ Constructs are designed to work over time (entry and exit is not smooth) and ideally
should be analyzed over many years. However, resource adequacy constructs are
constantly being tuned and changed, making analysis over a longer period difficult
due to fundamental changes in design that change results.
Given these challenges, the best way to evaluate the effectiveness of a resource adequacy
construct is through a review of the major components used by a region to confirm that
these appear to perform consistent with expectations (e.g., eliciting investment when
needed, incenting performance).
3.1 Evaluating Resource Adequacy Constructs
The most important elements needed when evaluating the performance of a resource
adequacy construct is an understanding of its objective and how the design is structured to
meet the objective (i.e., reflected through product definition). Without an understanding of
the objective and products, it is difficult to evaluate how well a construct is performing.
Product definitions identify the basis of demand (including cost allocation, if necessary),
eligible supply, and the consequences when the product is not delivered. These definitions
should complement the construct objectives (e.g., reduce probability of energy shortages,
serve load at least cost).
Resource adequacy constructs that have poorly defined products (e.g., inconsistent rules,
exemptions, special carve-outs, divergent performance assessment approaches by resource
type, different obligations, disconnects in rules from changes over time, consensus-driven
aspects of the design) are usually symptomatic of poorly defined or conflicting objectives.
That is, a product(s) that tries to address many objectives at once is unlikely to be
successful in achieving any one objective. Additionally, isolating the source of poor
performance in this circumstance is inherently difficult.
What follows is an overview of three lenses through which to view the decisions that
underpin product definitions and resource adequacy objectives for resource adequacy
constructs. The approach taken during selection and design of the resource adequacy
approach ultimately influences its final performance.
1. Design Approach: Tension exists in the design of resource adequacy constructs
between using a market-based approach and imposing specific rules that
guide/control resource adequacy outcomes. How various aspects of the resource
adequacy construct design are handled along these dimensions is important to
understanding the construct’s performance and how it achieves its objectives.
2. Resource Adequacy Components: All resource adequacy constructs can be
structured in ways that produce similar outcomes at similar costs. Certain constructs
may be better suited for achieving an objective, though. How a construct reaches
these objectives, however, introduces trade-offs, usually between cost and reliability

Resource Adequacy Constructs in Organized Wholesale Markets
EXETER ASSOCIATES, INC. Page | 20
and risk assignment that must be considered carefully. Further, since many regions
employ multiple resource adequacy constructs in their overall approach, the
interaction of these different constructs must be considered carefully.
3. Resource Adequacy and Energy Security: There has been much discussion
regarding both resource adequacy (i.e., having enough installed capacity to serve
uninterruptible load) and energy security (i.e., having enough energy to serve
uninterruptible load). While these terms are often used differently, they reflect the
same concept—sufficient energy production to serve firm load—with the only
difference being the time interval of focus. As the historical ability to distinguish
between resource adequacy and energy security disappears with the increased
penetration of price-responsive demand and variable and limited energy resources,
the need to design resource adequacy constructs to ensure that they help solve for
energy needs across all hours, and not just peak load, likely takes an increased
focus.
3.1.1 Design Approach
All resource adequacy constructs fall on a design spectrum. At one end of the spectrum is a
fully market-based approach and at the other end is a complete command and control
approach (e.g., cost of service). Most constructs are not at either end of this spectrum, but
fall somewhere in the middle (i.e., involving some degree of administrative input but also
allowing competition to drive results). The decisions on which design approach is used for
different aspects within each construct have meaningful impacts to the construct’s
performance.
• Market-based design: Provides a price signal and allows the market to respond. In
the extreme, this does not require any prescriptive rules; suppliers and consumers
respond to market price. In this model, the ISO/RTO would only operate spot EAS
markets which then drive behavior in the market. This design approach requires
some level of elastic demand to function properly.41
• Controlled design: Relies on established rules that define what resources are
required, how they are acquired, administers penalty parameters, etc. In the
extreme, rules drive all decisions and there is little market-based behavior driving
results.
While most resource adequacy constructs are viewed as more market-based than
controlled, there are many rules that define how (and which) resources participate and the
level of demand within the market-based framework. Target requirements, price caps,
penalty structures, quantity eligibility rules, interconnection requirements, and offer caps all
are forms of controlled design that may limit competition and impact costs and reliability
when designed incorrectly. Controlled design rules also provide important market power and
41 Even under a full market-based approach (like any commodity market), there are numerous controlled design
elements that govern the operation (e.g., environmental limitations) and interconnection of resources (e.g., minimum interconnection standards that must be met, provision of reactive power) that influence the market’s outcomes.

Resource Adequacy Constructs in Organized Wholesale Markets
EXETER ASSOCIATES, INC. Page | 21
reliability protections which can limit cost exposure (but also can have negative longer-term
impacts if the market is over-mitigated). Different regions, even using the same construct,
may strike a different balance between controlled and market-based design. The challenge
any region faces is striking a reasonable balance between these two design approaches to
achieve their resource adequacy objective.
Using a market-based design approach creates market signals to influence outcomes, but
perhaps not at the level desired because costs of actions are not easily recovered through
the market. More controlled design approaches may be able to achieve a specific reliability
outcome, but must be thought through completely to ensure the outcome is achieved
properly, other consequences are understood, and the approach reasonably approximates a
least-cost option.
There is always a controlled or a market-based design approach to any aspect of a resource
adequacy design.42 The fundamental difference between these two approaches is a function
of whether suppliers/demand can make the decision, or the ISOs/RTOs (and stakeholder
process) make the decision on their behalf. Both approaches can work but understanding
the basis for the decisions and their implications (including unintended cost and reliability
outcomes, as well as limitations to what can be achieved) is critical to evaluating how a
resource adequacy construct performs.
The following examples highlight the challenges with both a controlled and a market-based
design approach to achieve outcomes.
Example: Controlled Design Approach
Assume that, in response to concerns about winter operation, rules are established that
require all new thermal resources to provide backup fuel on site that can operate for a
minimum of three days. This could seem like a very sensible policy since it would better
position system resources during periods when there may be fuel supply interruptions.
However, this requirement would also make the installation of these types of new resources
more expensive and could deter investment in these resources in favor of lower-cost,
exempted resources which may not be able to perform during the type of event that the
original standard targeted.43
Further, these new resources would likely have lower heat rates than the existing resources,
increasing the likelihood that new resources could more easily access gas supply under
constrained conditions because they may clear in the day-ahead market or have a longer-
term arrangement reflecting expectations of running more frequently (thereby reducing the
need for backup supply) and would use less gas to produce the same amount of energy of
42 For example, an energy-only design could include a requirement that a certain percentage of load must be
under forward contracts ahead of a period, which begins to look more like a capacity construct and reflects a more controlled design approach to resource adequacy, as opposed to allowing LSEs to determine on their own how much to contract for ahead of a period.
43 If a separate requirement or tranche was created for these resource types, then this has the effect of lowering the price that would be paid to all other resources that do not provide this “premium” service. In many ways, this has the same impact as any subsidized resource in the market; the subsidy is simply hidden by the manner in which the requirement is formulated.

Resource Adequacy Constructs in Organized Wholesale Markets
EXETER ASSOCIATES, INC. Page | 22
other less efficient, gas-fired resources. Assuming this new resource does enter service and
meet the installation of backup fuel requirement, there is no certainty that these resources
would operate on the backup fuel or even maintain sufficient levels of backup fuel or
properly winterize the facility (absent additional rules).44
While increased costs are a near-certain outcome with these additional rules/limits, the
addition of backup fuel supply for new resources may or may not have a significant impact
to reliability (as opposed to not having backup fuel supply). It is possible this sort of rule
could hurt reliability (outside of winter periods or even during these periods) if the new
requirement prevents investment in more efficient resources (irrespective of on-site fuel)
and/or incentivizes the development of resource types that may be potentially less reliable
during these types of conditions. This is the challenge when trying to use a controlled design
approach to achieve an outcome; the market on its own with proper incentives might
achieve a lower-cost, more reliable outcome.
Example: Market-Based Design Approach
Instead of a controlled design approach, assume that the region allows the market to
address winter operation concerns. Suppliers might determine that potential scarcity pricing
(or capacity penalty risk) incentivizes them to invest in on-site fuel. They might also decide
to enter firm fuel contracts to increase their delivery priority or cultivate alternative fuel
providers, among an array of options with similar reliability outcomes (though potentially
lower costs). It is also possible that other types of fuel-diverse resources could enter the
market. However, if the market does not see significant risk in low-probability events (i.e.,
performance penalties or foregone revenue opportunities), then suppliers may not be willing
to undertake any of the above approaches to protect against what could be perceived as a
tail event risk. For example, if a supplier believes it has the potential to earn $100 million
over five years by performing during an extreme weather event, but only assigned a
probability of 1% to the event occurring, in concept, they would only be willing to spend
$1 million to take action. If installation of alternative fuel capability or weatherization and
maintaining this capability exceeded $1 million, the supplier may not be willing to make
such an investment.
Increasing performance consequences could increase the rents that could be earned, and
thus would increase the investment signal. It could also, however, result in significant cost
increases to try to motivate action around low-probability events, raising the question of
whether this is the best balance of reliability and cost.45
44 While actions can be taken to reduce non-performance risk, no action can guarantee performance under all
circumstances.
45 The probabilistic analysis used to determine the reliability required for the 1-in-10 standard uses a 50/50 weather forecast which, by definition, likely is not explicitly designed to procure resources and the necessary performance to cover more extreme weather events that may be viewed at a lower probability (i.e., 90/10 weather forecast).

Resource Adequacy Constructs in Organized Wholesale Markets
EXETER ASSOCIATES, INC. Page | 23
Example: Correlated Risks
Finally, handling cases where there may be correlated risks (or common mode failures) in
markets becomes even more challenging to design for, as the risk is not owned by any
single party. For example, a supplier may view the probability of an extreme weather event
causing very high prices at 1%. However, when looking at the correlated performance risk,
the probability of high prices could be much greater due to the potential for many resources
to not perform. In this situation, suppliers may undervalue the risk to the system within
their own individual risk calculations and actually should be willing to spend more to address
the risk. In a market, suppliers need more information to manage these risks and properly
reflect their ability to manage these risks. At the same time, addressing low-probability
events through markets may be very expensive and could be better suited to a more
controlled design approach.46
Managing correlated risk associated with extreme weather or variable energy resource
performance has become a focus for many regions. A controlled design approach limits the
amount of capacity counted upon from any resource based on some calculation applying
numerous assumptions around load, resource performance, and resource mix to set a cap
on the amount of capacity that a resource can provide. An alternative, more market-based
design approach to non-performance risk is to provide information on these limits (what
periods/hours the system is most at risk) to suppliers and allow suppliers to price this risk
into their determination of the quantity of capacity they are willing to provide (possibly at
different prices for different quantities). Inherently, scarcity pricing-only constructs push
these decisions more to the market (the risk is on suppliers who are selling forward energy
contracts), while capacity constructs have historically set the maximum limit on the amount
of capacity that can be sold (the risk is managed by both the ISOs/RTOs and suppliers
below this maximum limit).47
3.1.2 Key Resource Adequacy Components
Each construct is designed to create a signal for when new investment should occur and
when excess supply should exit the market based on the construct’s parameters and overall
design. No one resource adequacy construct in use today is necessarily better or worse than
another, as its performance is really a function of the design decisions made for the
construct. Constructs can have strong or weak performance incentives, allow for customers
to specify their resource preferences to varying degrees, assign responsibility for long-term
46 Investment in response to low-probability events can eliminate the potential for the event to occur which is a
positive outcome; however, it also may eliminate the potential for the supplier to recover cost depending on the arrangements they have in place and prevent other suppliers from taking actions related to low-probability events (if the other suppliers assume they would not be required anyway). Using cost-of-service approaches to target necessary supply in these cases may be a sensible way to reduce costs, but then effectively subsidizes the “favored” technology (e.g., backup fuel at a combined cycle plant versus a long-duration battery at a wind farm) to be able to perform and earn rents.
47 For example, ISO-NE currently allows storage to provide capacity with only two hours’ duration and depending on its capacity performance model to discipline clearing in the market rather than establishing other, more constraining limits.

Resource Adequacy Constructs in Organized Wholesale Markets
EXETER ASSOCIATES, INC. Page | 24
investment risk in different ways, result in different degrees of reliability risk and both
under- and over-procure.
Further, the stability of a resource adequacy construct is not associated with the type of
construct, but rather the region and the durability of design in the context of the changing
system. For example, even in a scarcity pricing/ORDC-only approach, persistent
modification to the ORDC and scarcity prices can create significant investor uncertainty.
Capacity constructs inherently provide more transparency because resources are specifically
identified to provide resource adequacy, as opposed to a scarcity pricing/ORDC-only
construct which is driven more by bilateral arrangements between parties.
Investment Signal
Each construct is designed (and tuned on an ongoing basis) to create a signal that conveys
when new investment is required for resource adequacy and provide compensation to
needed resources sufficient to recover their missing money over time. These structures also
send a signal when it may be appropriate to retire existing resources that may no longer be
required (i.e., these suppliers no longer expect to recover their missing money, including
any anticipated capital investment, over time).48 Setting the reliability and/or financial
parameters too high or too low can inappropriately impact investment and retirement
decisions.
▪ ERCOT uses just scarcity prices (with an ORDC) that are set to a level intended to
influence investment and retirement. Scarcity prices (when there is an expectation of
occurrence) send a strong signal to technologies that can perform during scarcity
periods and therefore earn accompanying rents, and a weaker signal to technologies
that cannot perform during these periods.49 While the scarcity price does not have a
specific reliability target quantity, the level of scarcity price effectively controls the
level of the reserve margin relative to resource costs. In a long system, there should
be less scarcity (and thus a lower investment signal and a greater retirement signal).
In a short system, there should be more scarcity (and thus a greater investment
signal). Expectations around load forecast and expected plant retirements have a big
impact on investment decisions in this model.50
▪ SPP uses a capacity demonstration approach (and scarcity pricing/ORDC) that
includes target reliability requirement and a penalty price that reflects the maximum
cost the LSE should be willing to pay to meet their reliability requirement.51
48 While capacity markets clear from year to year, decisions about revenue sufficiency include future expectations.
49 Scarcity rents (with inframarginal energy rents) may be necessary to drive investment in certain technologies, while only inframarginal energy rents (not factoring in scarcity rents) can be enough to promote investment in other technologies. Suppliers with technologies in the former category would evaluate whether the costs associated with being available to obtain the scarcity rents are worth the incremental investment.
50 ERCOT was sued in 2016 by Panda PowerFund LP because of “false and misleading” market reports that reflected the need for investment that did not materialize. Source: S&P, “Panda Power sues ERCOT over 'false and misleading' market reports,” March 24, 2016.
51 SPP employs a form of demand curve in its penalty price approach by having an increasing price as excess systemwide supply declines that is differentiated at several levels, thus sending a stronger incentive for investment as available supply declines.

Resource Adequacy Constructs in Organized Wholesale Markets
EXETER ASSOCIATES, INC. Page | 25
Individual LSEs manage how they meet the reliability requirement, assuming that
meeting SPP’s requirement is otherwise economic (i.e., the penalty cost, over time,
is greater than the cost to act).
▪ PJM uses a capacity market (also with scarcity pricing/ORDC) that includes a target
reliability requirement and a penalty price if it is not achieved (i.e., demand curve
price cap). This is intended to maintain a specific reserve margin based on the shape
of the demand curve and its associated prices. PJM’s approach also promotes
investment when needed and retirement when a resource’s missing money exceeds
the willingness to pay for the level of reliability it provides (as reflected in the
demand curve).
Performance Incentives
Any construct can include a performance incentive, either through a consequence/penalty
for non-performance or through the potential to earn an incremental payment for
performance. Generally, forward sales are settled against a spot price (or have a penalty
structure in the case of many capacity constructs). Charges between the forward and spot
price are then assigned to non-performing suppliers. Spot sales generally reflect a lost
opportunity when a supplier cannot perform.
▪ ERCOT’s scarcity pricing can create a strong performance incentive depending on the
amount of forward sales by suppliers to LSEs.52 Scarcity pricing creates a strong
short-term incentive for performance as well, but potentially with a more limited set
of actions that can be taken by suppliers to perform.53
▪ SPP does not have a performance incentive structure related to its capacity
demonstration approach that creates a specific consequence for non-performance.
SPP has scarcity pricing and ORDC constructs which provide similar incentives to
ERCOT, albeit with lower price caps.
▪ PJM has a number of penalties associated with non-delivery of capacity including the
pay-for-performance construct which incents performance in times of system
emergencies. PJM also has scarcity pricing and ORDC constructs which provide
similar incentives to ERCOT, although again with lower price caps.
Reference Appendix C, “Capacity Pay-for-Performance and Shortage Pricing” for additional
discussion on how different pay-for-performance designs can influence performance
incentives and outcomes.
52 If LSEs are not making forward arrangements with suppliers, they have the performance incentive to reduce
consumption and face the consequences if they cannot respond to the price signal.
53 For example, a forward sale made ahead of a period allows a supplier to invest/upgrade their facility to improve performance, while a supplier reacting to a high expected price tomorrow would have much more limited options (e.g., delay scheduled maintenance, pay a higher price for fuel, use limited energy).

Resource Adequacy Constructs in Organized Wholesale Markets
EXETER ASSOCIATES, INC. Page | 26
Resource Preferences (including State Policy Goals)
Any construct can allow for an LSE or state to specify resource preferences and have these
reflected in the construct; however, the recent expansion of the MOPR in the capacity
markets interferes with the ability of consumers or states to reflect their preferences.
Capacity markets without the MOPR can allow for the same level of resource specification as
a capacity demonstration approach through self-supply and other bilateral arrangements
(both in and out of the market). Scarcity pricing models similarly do not preclude selection
of resources based on customer preferences. Rather, LSEs contract with suppliers based on
the suppliers’ expectations of their ability to perform during scarcity hours and provide
energy when it is expected to be needed by the LSE.
Vertically integrated utilities acquire resources based on cost and their respective state’s
requirements, and can reflect these arrangements in any resource adequacy construct.
Resources contracted with utilities to meet state requirements (even in deregulated areas)
can also be used to meet capacity requirements. Finally, municipals and cooperatives can
develop (or contract with) new projects and use these to meet capacity requirements as
well.
Stranded Cost (Investment) Risk Assignment
Among the biggest differences between each resource adequacy approach is risk
assignment. Unsurprisingly, constructs that are more market-based push more risk of
stranded costs to suppliers, while constructs that are less market-based place more risk on
consumers (i.e., require longer-term LSE contracting or cost-of-service arrangements to
promote investment or maintain existing resources).
▪ Capacity markets result in less risk to load by providing a revenue stream for
merchant investment and not requiring longer-term arrangements. However, there is
nothing within the capacity markets that inherently prevents customer preferences
for resources.
▪ Capacity demonstration approaches do not have a forward price signal in the same
sense as a capacity market, and are therefore more dependent on longer-term
arrangements to promote investment. However, other market signals (e.g., an ORDC
curve) can promote investment, and not every investment requires consumers to
carry the longer-term risk.
▪ Scarcity pricing approaches provide for a blend of both longer-term contracting and
merchant investment. Scarcity prices impact the price that load is willing to pay for
forward energy contracts. This structure can result in load getting into longer-term
arrangements, but also promotes merchant investment, which results in additional
supply for which LSEs can enter shorter-term arrangements to hedge load based on
market conditions.

Resource Adequacy Constructs in Organized Wholesale Markets
EXETER ASSOCIATES, INC. Page | 27
Level of Resource Adequacy
The final area of consideration is who is responsible for the level of resource adequacy risk
accepted.
▪ Capacity constructs all have reliability targets that effectively result in LSEs having to
cover a specified requirement (not based on the LSE’s preference, but based on the
requirements established in the construct to represent loads’ collective preference for
reliability and cost).
▪ Under a scarcity pricing/ORDC-only approach, LSEs have more flexibility with the
amount of forward contracting in which they engage and how they choose to manage
this risk. There is no requirement in a scarcity pricing construct for LSEs to
demonstrate that they have forward hedges in place to cover their load. However,
the parameters used to establish the scarcity prices influence LSEs’ forward
contracting, as increased risk should result in more forward contracting. While LSEs’
contracting behavior drives some investment decisions, investment can also occur
without LSE contracting based on merchant expectations of need of the market.
3.1.3 Resource Adequacy and Energy Security
Note: While this report does not propose a future state resource adequacy construct, there
is a shift in thinking in how resource adequacy constructs are designed—away from just
peak hour performance and toward more hourly performance, necessitated by the evolving
resource mix. This section provides some high-level considerations on potential future
direction of resource adequacy in the context of resource performance.
Grid reliability is again the focus of state and federal attention following the recent extreme
weather events in Texas and California as well as recent FERC action to open a proceeding
examining the threats that these events and climate change pose to electric reliability.54
Grid reliability is a complicated topic with many considerations spanning all aspects of the
energy industry (e.g., transmission and distribution, supply chain, generation). There are,
however, noteworthy aspects of this issue that are specific to resource adequacy and what
the term means.
Over the past several years, there has been much discussion around resource adequacy and
energy security. Historically, capacity constructs acquired installed capacity focused on
serving peak load (i.e., performance of supply in peak hours which reflected the hours with
the greatest probability of unserved load), and energy markets used these resources to
meet load requirements in all hours of the year. This provided a convenient, simple division
between the concepts of resource adequacy (through capacity constructs) and energy
security (through energy markets). In reality, resource adequacy and energy security have
never been separate constructs; rather, the historical resource mix (largely comprised of
controllable resources with minimal operating limitations and a smaller amount of variable
and limited energy resources) allowed for this separation to be created. Having energy
54 FERC, FERC to Examine Electric Reliability in the Face of Climate Change, February 22, 2021.

Resource Adequacy Constructs in Organized Wholesale Markets
EXETER ASSOCIATES, INC. Page | 28
security (defined as the ability to meet expected energy demand in all hours) should result
in resource adequacy. Resource adequacy, as currently approached, may not necessarily
result in energy security, though, especially as the mix of resources continues to change. A
broader focus on resource adequacy does not lessen, but rather increases, the importance
of EAS markets and the need to have the right products defined to manage system
reliability based on the available resources.
The transition in the resource mix is going to take time, so regions have a chance to
respond to these changing conditions and many already have, to some degree. Market
changes such as effective load carrying capability (ELCC), increased scarcity pricing, and
capacity pay-for-performance constructs are all efforts to shift the resource adequacy
constructs from a peak-hour focus to the concept of delivery to the system when required
(i.e., energy security) which may not align with the traditional peak hours.
▪ ELCC attempts to value the benefit to the system of resources with limited or
variable energy production (even though it can be used for all resource types). This
type of adjustment affects the amount of capacity for which a resource can be
counted upon to provide within the capacity constructs. ELCC has not been broadly
applied to thermal resources in areas with capacity constructs, which are generally
assumed to be able to perform in all hours based on their equivalent demand forced
outage rate (EFORd). However, ELCC could also be applied to these resource types if
fuel (i.e., making them limited energy) or weather-based performance constraints
continue to materialize. ELCC reflects a controlled design approach to the resource
adequacy versus energy security challenge since it begins to evaluate performance in
not just the peak hour but in all hours (i.e., hours with the greatest probability of
unserved load).
▪ Scarcity pricing/ORDC and capacity pay-for-performance constructs do not set a
specific amount of capacity/energy that can be provided, but rather send a targeted
price signal when the system is under stress. These signals should influence
investment decisions and encourage the development of resources that are expected
to be able to perform during shortage/performance periods, and result in resources
not able to perform during these periods to sell less capacity or reflect this dynamic
in any forward energy arrangements. This is a market-based approach to target
resources that are most valuable (and least-cost) to meeting reliability requirements.
Each of the above approaches attempts to better align the procurement of capacity
resources (and their ability to perform) with the hourly load on the system (i.e., energy
security). In other words, the concept of a planning reserve margin may no longer
necessarily be a peak concept, but rather an hourly concept where the tightest reserve
margin in the year could happen in an overnight hour or in a shoulder month during periods
of planned maintenance. The tightest reserve margin period effectively becomes the binding
constraint that should drive the type of resources required (i.e., which resource provides the
most incremental value in the hours needed for energy security, rather than the peak hour).
Both ELCC and performance incentive-based approaches have the potential to value many
state-sponsored resources less than other resource types within resource adequacy

Resource Adequacy Constructs in Organized Wholesale Markets
EXETER ASSOCIATES, INC. Page | 29
constructs. The reduction in eligible capacity and/or the increase in cost (relative to other
resources) related to performance risk may result in a smaller share of each variable and
limited energy resources providing resource adequacy as the system continues to evolve.
3.2 Evaluation Metrics
The objective of resource adequacy has been thought of historically as something similar to:
Promoting cost-effective investment and retirement decisions that reduce the risks
associated with unserved firm load.
This objective includes (or implies) five key, interrelated evaluation areas:
1. Reliability Requirement: Expected level of reliability is simply a measure of the
probability (based on a set of assumptions about a future period) that there will be
sufficient supply (quantity) available to serve an expected level of future, non-
interruptible load. The ability to serve load is a function of both the quantity of
supply and its ability to perform.
2. Resource Performance: Resource performance constructs focus on suppliers
having appropriate financial incentives to take reasonable actions to perform when
required and that the system has adequate capability to cover certain levels of non-
performance. Suppliers should be able to account for their risk during the acquisition
process to ensure that cost-effectiveness is balanced with the ability to perform.
3. Reliability Valuation: In the absence of load’s ability to reflect its willingness to pay
for reliability, regions use proxy constructs to approximate the VOLL at various levels
of reliability. This is based on the principle that as reliability degrades, loads’
willingness to pay for reliability increases, and as reliability improves, loads’
willingness to pay for incremental improved reliability decreases.
4. Competition: Resource adequacy should allow for cost-effective investment,
enabling reasonably smooth coordination between new entry and exit. These
constructs should not limit participation unnecessarily and must ensure that, when
conditions are not competitive, appropriate protections are in place to prevent non-
competitive outcomes.
5. Cost Allocation: In many cases, load is not able to participate directly in the
resource adequacy construct. Under these conditions it is important that any cost
allocation approaches do not create skewed investment signals that advantage or
disadvantage investment in load control or behind-the-meter (BTM) generation. This
is really an extension of the competition evaluation area, as many consumers have
significant options for responding to price signals that have not been historically
available.
Appendix D, “Reliability and Cost Trade-off” provides an example of the relationship
between reliability, cost, and performance.

Resource Adequacy Constructs in Organized Wholesale Markets
EXETER ASSOCIATES, INC. Page | 30
3.2.1 Reliability Requirement
There are numerous assumptions that influence the final determination of what the
appropriate target reserve margin should be; however, the biggest driver is the expected
level of demand. The ability to forecast peak load and load shape is critical to ensuring that
resource adequacy constructs achieve their objectives, and arguably has the biggest impact
on cost.55 Important assumptions in this process include expected weather patterns,
economic growth, and expectations about the factors driving investment in electrification
and BTM generation. Over-forecasting loads can result in excess procurement (with
accompanying costs) and, when resulting in new entry, can have long-lasting impacts on
market outcomes. Under-forecasting can force premature retirements, defer needed
investment, and increase overall reliability risk on the system.56
Other assumptions layer on top of the demand assumption. These include how each region
defines and applies the 1-in-10 standard, adjusts for interregional tie-benefits, accounts for
energy efficiency and BTM generation, and credits emergency actions (e.g., voltage
reduction, voluntary appeals). All these factors can have noticeable effects on the final
reliability requirement. Resource performance assumptions (discussed further in the next
section) also play a significant role.
Comparing each region’s reliability requirement and planned (or actual) reserve margin
provides some perspective on differences. However, it is difficult to draw conclusions
without an understanding of the reasons for these differences and the underpinning
assumptions.
Appendix E, “Reserve Margin Metric” provides some discussion/perspective on the use of
reserve margins as the measure of a resource adequacy construct.
3.2.2 Resource Performance
Resource performance assumptions are likely the next-biggest driver of cost associated with
resource adequacy after expected demand. Resource performance can be reflected on either
the demand or supply side of a resource adequacy requirement (or a combination of both)
and must be thoughtfully coordinated.
Accounting for resource performance on the demand side generally results in the quantity of
resources required being increased based on some level of assumed resource non-
performance. Demand-side resource performance adjustment is the basis for a target
planning reserve margin. That is, the planned reserve margin factors in some level of
forced, maintenance, and planned outages into the quantity of resources required above the
expected demand. Weather patterns and load shape also play an important role in
55 Even in an approach without a capacity construct, it is likely that the load forecast (and resource performance
assumptions) produced by the ISO/RTO drive the level of demand that LSEs are expected to meet.
56 This assumes that the market does not foresee that the ISO/RTO expectation of load is too low to respond to the potential for a reduced actual reserve margin.

Resource Adequacy Constructs in Organized Wholesale Markets
EXETER ASSOCIATES, INC. Page | 31
evaluating limited and variable energy resource performance and then factoring it into the
amount of supply required above expected demand.
Accounting for resource performance on the supply side generally results in:
▪ The maximum quantity associated with a resource being reduced (regardless of
price) or, in certain cases, being set to zero if supply is deemed ineligible (i.e.,
provides no resource adequacy value). This is most often accomplished by using
EFORds, capacity benefit factor determinations (under an ELCC or other approach),
or eligibility rules (including interconnection requirements).57
▪ The obligated quantity from a resource being less than the maximum quantity based
on the supplier’s perceived risk of non-performance, as is done by suppliers
participating at levels or prices affected by a capacity performance risk premium.
This is most effective when non-performance risk is not correlated or dependent on
other resource performance, and risk can largely be assessed by an individual
supplier based solely on the operation of their facility. A key component to
understand in evaluating the performance of a resource adequacy construct is the
amount of investment a party is willing to undertake (and that the construct
supports) to improve the probability that they can perform in response to the
risk/incentive and whether the construct allows for a reasonable opportunity to
recover these costs.
Resource performance risk managed through demand-side adjustments increases cost to
consumers and must be counterbalanced with a combination of limitations and incentives on
the supply side. Supply-side adjustments increase the probability that suppliers with better
performance provide resource adequacy. Supply-side measures are intended to minimize
the increases in demand associated with non-performance over time. Some level of non-
performance is expected even in a usually well-performing system when factoring in
planned and maintenance outages.
A properly designed resource adequacy mechanism should balance these levers to achieve
the desired outcome. Inappropriately limiting a supplier’s quantity by making a resource
type ineligible, increasing performance risk beyond a reasonable level, or artificially
constraining what a supplier can sell into the market can increase costs and negatively
impact reliability over time. Conversely, not having sufficient performance incentives for a
supplier can result in increases in demand-side non-performance adjustments and
potentially increase costs without any material change in reliability (e.g., buying more of the
same performing resources at the same or higher price).
Forecasting Resource Performance
Historically, the resource mix was largely comprised of resources that have minimal
operating limits, and the quantity of resources that were less controllable or more limited in
57 Capacity constructs have generally moved away from preventing participation through eligibility rules and,
rather, use analysis to establish limits; however, this is just a different form of eligibility rules above zero, but can still be very limiting.

Resource Adequacy Constructs in Organized Wholesale Markets
EXETER ASSOCIATES, INC. Page | 32
operation did not exceed the incremental quantity required to serve a limited set of
seasonal peak hours. This allowed ISOs/RTOs to largely focus on the peak hours in
determining resource eligibility and load that needs to be served, including attention to both
the probability of forced outages removing capacity from the system unexpectedly and the
uncertainty of the forecasted peak load. However, as the power system evolves, the
summer peak hour may no longer be the primary source of resource adequacy risk. Rather,
ISOs/RTOs need to account for new risks including winter peak hours (in summer peaking
systems), planned outage season unavailability and ramping (up and down) challenges. This
new paradigm shifts the question from whether there is enough installed capacity to meet
peak demand to whether there is enough energy supply to serve load in all hours and the
types of capability installed on the system. It also raises questions as to what the planning
reserve margin means and makes the load shape and weather model assumption even
more critical during the load and resource performance forecasting process.
Each resource has a probability of being able to perform in each hour of a period based on
assumed weather and EFORd, among other metrics. Weather patterns have significant
impacts to the operation of many resources. For example, assuming an extreme two-week
cold snap with significant snow and ice may produce very different resource performance
(and thus LOLE) outcomes than a two-day cold snap with no snow. These different
assumptions could require different resource mixes to mitigate associated risk.
It is the collective performance of resources that determines the reliability of the system.
Not every resource needs to perform in every hour, but collectively, the resource mix should
be capable of meeting energy and some level of ancillary service demand across all hours
(assuming cost-effective). Changing the load shape or weather pattern can result in a
relatively high-performing resource mix becoming less reliable.
This creates a challenging problem insofar as evolving demand patterns and resource mixes
introduce significant uncertainty, further complicated by forecasting loads in a changing
power system.
Load Forecasting and Resource Performance Assumptions
It is important that resource performance and load forecasting assumptions align. For
example, if an ISO/RTO determines eligible supply for variable and limited energy resources
using a 90/10 weather forecast pattern, but then bases expected demand upon a 50/50
load forecast, the two forecasts send conflicting signals. The capacity benefit values of
resource would be constrained due to the 90/10 forecasted weather, while the demand
expectation would be more relaxed due to the load forecast. Assuming supply would
perform better under a 50/50 weather pattern, this approach may artificially constrain
supply. This could impact cost and the level of reliability in a non-transparent manner.
3.2.3 Reliability Valuation
In a market where load is elastic (i.e., responsive to changes in price) and able to
distinguish levels of reliability, load could specify its willingness to consume at various levels
of reliability relative to the price. However, in the absence of elastic demand participation,

Resource Adequacy Constructs in Organized Wholesale Markets
EXETER ASSOCIATES, INC. Page | 33
ISOs/RTOs must establish a proxy for the willingness of load to pay for reliability based on
analysis/studies.58
There are three common approaches used to establish a proxy for the willingness of load to
pay for reliability.
1. Calculate the cost recovery necessary for a proxy unit, usually in the form of an
estimated CONE for a specific technology. This approach, which is most common for
capacity constructs, results in an implied VOLL when it is used as part of the
reliability standard.
2. Establish a set of scarcity prices based on the VOLL (from an average customer’s
perspective). This approach, which is usually included with an ORDC, provides an
investment signal when there are increased levels of scarcity in the market.
3. Establish a set of scarcity prices that allows for the system to reasonably redispatch
in real-time to maintain supply and meet EAS requirements. This inherently assumes
that load is willing to pay at least the designated price to maintain operating reserves
and avoid load shedding.59
For markets with a capacity construct, it may be appropriate to calculate the implied VOLL
not based on the net CONE, but rather CONE. The CONE, in concept, is what consumers
would pay to add incremental capability for reliability purposes. The use of CONE in the
context of the resource adequacy approach (e.g., demand curve structure) potentially
provides a comparable metric to understand how each region estimates the expected value
of making investments necessary to maintain a preferred level of reliability.
3.2.4 Competition
The constructs supporting resource adequacy generally should be open and allow for all
resources to compete to provide necessary reliability services based on least cost and
alignment with customer preferences. These conditions should be combined with
appropriate market power protections when competition on its own cannot discipline
behavior. As noted above, reasonable performance expectations should be included to allow
suppliers to reflect their willingness to sell services, not just based on cost, but on their
ability to perform when needed.
58 Since demand is typically viewed as inelastic, when situations do arise when load cannot be served, consumers
are not rationed based on their economic preferences. Instead, rationing is based on protocols established by the utilities which may have objectives like limiting shutoffs of critical facilities (e.g., hospitals, police stations, fire stations). Since actual preferences cannot be expressed to the market, load that places a high value on service often acts on its own to install backup generation (which reflects the high value it places on being served).
59 This is an accepted practice because: (1) operators will generally take actions, if available, to preserve reliability even if the markets did not produce this result, which can create uplift and hides the true value of the service; and (2) these prices are neither set at a level that exceeds necessary missing money nor approach the lower levels associated with VOLL (even though some administrative prices begin to approach this level under more extreme scenarios).

Resource Adequacy Constructs in Organized Wholesale Markets
EXETER ASSOCIATES, INC. Page | 34
Participation and Performance
Ideally, resource adequacy constructs should allow all resources on the supply and demand
side to compete to provide a well-defined product(s). Allowing robust supply and demand
participation with similar obligations and performance incentives should result in the
selection of the least-cost set of resources to achieve targeted outcomes. This type of
construct would promote cost-effective investment and retirements. By contrast, rules that
inappropriately limit participation, favor one resource class over another, provide
protections for incumbents, or promote unnecessary new investment over time can raise
costs and increase reliability risk—even if near-term effects may result in reduced costs or
improved reliability.
Competition and resource performance are tightly coupled, as the resource performance
construct drives how a supplier reflects its costs to the market and the level that can be sold
from a resource into the market (i.e., maximum quantity).
Market Power
Market power protections are important in EAS constructs to prevent suppliers from
manipulating prices by offering above an economic level or physical withholding. Similar
market power concerns also apply to capacity constructs, especially in constrained areas,
and can have bigger impacts because of the relative size of the market associated with the
capacity clearing (seasonal or annual) as compared to the energy market (hourly).
▪ Local areas are suspectable to market power, especially portfolio market power.60
Centralized capacity constructs inherently deal with market power better than
capacity demonstration mechanisms that may require direct LSE contracting to meet
local requirements.61
▪ Portfolio market power can be exercised through physical exit (e.g., retirement) from
the market.
▪ While new entry can mitigate market power, the high capital requirements around
new entry of many technologies as well as developmental challenges in many
constrained locations can limit the ability for new entry to truly mitigate market
power.
▪ Demand is not responsive and does not participate in a meaningful way in most
resource adequacy constructs (thus the need for a demand curve to mitigate market
power by setting price constraints).
60 For example, a company that owns a portfolio of multiple resources might choose to withhold (or retire) one
resource in order to cause capacity to clear at a higher overall price, thereby increasing the value of all other resources and offsetting any costs (opportunity or actual) associated with the withheld resource.
61 This is discussed further in Appendix A, “PJM Resource Adequacy Constructs” in the “Capacity Market Participation versus FRR Election” section.

Resource Adequacy Constructs in Organized Wholesale Markets
EXETER ASSOCIATES, INC. Page | 35
▪ Capacity constructs often clear over periods of six months to a year—as opposed to
the energy market where market power may only impact an hour or two—which
potentially magnifies any market power consequences in the capacity market.
Market power protections, although intended to protect load, can also over-mitigate supply
and thus limit competition. In the extreme, over-mitigation can force unnecessary
retirements and as a result increase costs. Lack of market power protections, on the other
hand, can result in load paying unnecessarily high prices and seeing lower levels of
reliability (or no change in reliability).
3.2.5 Cost Allocation
Ideally, resource adequacy constructs should create similar incentives on the supply and
demand sides of the market. The energy pricing aspects of shortage pricing constructs
generally do a good job of providing balanced incentives; supply and demand are both
exposed to the same, potentially very volatile, prices. This creates strong incentives for load
to get into forward arrangements to hedge spot prices, effectively shifting the volatility risk
to suppliers who have physical resources that they can use to manage this risk. Load, in this
case, should only take action to change demand when doing so is cost-effective based on
the costs of forward arrangements and/or spot prices.
Ancillary services and capacity market costs do not provide the same degree of balance
since load does not reflect its direct preference for these reliability services. Rather, costs
must be allocated to LSEs either using a beneficiary pays approach (i.e., whoever generally
benefits from the procurement of the service pays for it) or cost causation approach (i.e.,
whichever party is most responsible for the cost pays for it), or a combination of both.
▪ Ancillary services have historically been allocated on an hourly basis to load based on
a beneficiary pays approach. This applies the assumption that the load consuming in
the hour benefits from the level of reliability provided by the ancillary services. While
this is a sensible approach, the nature of ancillary services is difficult for LSEs to
hedge because load is allocated a share of the overall requirement which can change
from hour to hour based on system conditions; however, the costs of these are
usually relatively small when divided across all of the load.
▪ Capacity costs are allocated through a combination of both principles: load is the
final beneficiary of capacity, so bears the costs; however, capacity has generally
been procured for a specific reason (i.e., peak load), so may not benefit all load
equally.62 The challenge with capacity is that it does not necessarily just procure for
the peak hour, but rather to cover a specific set of operating conditions reflected in
the planning models (e.g., multiple peak hours). Disconnects between the cost
allocation approach and drivers for costs can result in inefficient investment signals
for load to take action to avoid these costs (e.g., targeted reductions during the
62 Passing on the cost of non-performance to suppliers results in increased costs. However, if properly designed,
this pass-through should also result in general improvements in performance, which reduces costs.

Resource Adequacy Constructs in Organized Wholesale Markets
EXETER ASSOCIATES, INC. Page | 36
predicted annual peak period) without providing a true capacity benefit.63 In this
case, a cost allocation approach can promote inefficient investment and shift costs to
other customers who are not as well positioned to respond to this price signal since
the actions on the demand side are not necessarily reducing the quantity of capacity
to be purchased.
The alignment of cost allocation and performance incentives is an increasingly important
aspect of the performance of capacity constructs, especially with increased BTM resources.
BTM resources outside the market do not have any specific performance risk and can
increase overall risk to the system when not able to perform. How these are counted upon
in the load forecasting process and formulation of capacity requirements is likely to evolve
in the future. Further, rules such as the MOPR, which only apply to the supply side, can
result in unintended encouragement for customers to invest more in BTM technologies,
which may be more costly (smaller economies of scale) and create more reliability risk
because the ISO/RTO has less visibility into the resource’s operation. Separate incentives
for the same resource type, whether it participates in a market in front of or behind the
meter, can distort efficient investment decisions.
63 A simple example of this is a two-hour battery storage device or a generator with significant run-time limits,
which while being very effective at reducing peak demand for customers for its full nameplate capacity, on the supply side of the capacity market may only qualify for or chose to participate with a small portion of its nameplate capacity on the supply side.

Resource Adequacy Constructs in Organized Wholesale Markets
EXETER ASSOCIATES, INC. Page | 37
4 RECENT RESOURCE ADEQUACY PROPOSALS
With the expansion of the MOPR in PJM and NYISO, stakeholders are considering various
proposals to facilitate the participation of state-sponsored resources in the capacity markets
as well as address the problems with MOPR discussed in the next section.
While the MOPR is not the only driver for recent proposals related to resource adequacy,
many of these proposals are framed as allowing for additional revenues to be counted in the
MOPR calculations. Such changes would, in effect, allow the MOPR to approach zero for
many state-sponsored resources and thus effectively eliminate this as a limitation to
capacity market participation.
Recent proposals fall into three categories:
1. MOPR-Targeted Proposals: Potential solutions that could work in conjunction with
the MOPR.
2. MOPR-Framed Proposals: Proposals that could be replacements for the MOPR, but
also possibly have value for other reasons.
3. Non-MOPR-Related Proposals: The proposal is largely unaffected by whether the
MOPR policy is continued or replaced, even though the proposals may be driven by
the evolving resource mix.
Stakeholder discussions in both New England and PJM appear to be focused on amending
the objective for resource adequacy (or adding a new objective for the ISOs/RTOs) to
something like:
▪ Promoting cost-effective investment and retirement decisions that reduce the risks
associated with unserved firm load while respecting state and LSE resource
preferences; or
▪ Promoting cost-effective investment and retirement decisions that reduce the risks
associated with unserved firm load and meet state clean/renewable energy
requirements while also respecting LSE resource preferences.
These two alternative objectives are similar, but potentially very different in the final
solution constructs. The first alternative objective can, to some degree, be met by
eliminating the MOPR (assuming the market can still obtain necessary merchant
investment), even without shifting to a residual capacity market construct. The second
alternative objective requires that the ISOs/RTOs select the least-cost set of resources to
meet both the resource adequacy requirements and clean/renewable energy requirements.
Before detailing potential modifications to resource adequacy, a brief background on the
MOPR is useful for understanding proposals that fall under either category 1 or 2. While the
focus in many stakeholder discussions has been, minimally, on allowing state-sponsored

Resource Adequacy Constructs in Organized Wholesale Markets
EXETER ASSOCIATES, INC. Page | 38
resources to participate in capacity markets without limitations, the impacts to the ability of
the capacity markets to attract merchant investment must also be considered.64
4.1 MOPR Background
First, it is important to recognize that the MOPR itself is not a problem. Rather, the MOPR is
intended to try to ensure that capacity markets could continue to provide a merchant
investment signal when needed. However, the consequences of having the MOPR may
outweigh the benefits, especially with the large influx of state-sponsored resources that are
expected to enter the market.65
The MOPR effectively tries to balance two positions:
1. Consumer: With the MOPR, state-sponsored resources (and other contracted
resources) are potentially limited in their ability to clear in capacity markets,
effectively eliminating one source of revenue and thereby increasing costs and
causing the capacity market to procure unnecessary capacity from other resources.
2. Investor: Without the MOPR, the entry of subsidized resources can discourage
investment in the resources when required to meet reliability requirements. In other
words, subsidized resources may distort merchant investment price signals.
Both positions are correct to some extent; buying capacity when it is not needed is costly
and inefficient, while not sending a merchant investment signal when capacity is required
could also be costly and result in lower levels of reliability. However, it is unclear how much
the lack of the MOPR could reduce long-term investment in resources necessary to meet
resource adequacy requirements, or how many state-sponsored resources are prevented
from clearing in the capacity market due to the MOPR.66
4.1.1 Consumer Perspective
With the expansion of the MOPR to new renewable resources (and existing operating
resources) in PJM, the MOPR may prevent many state-sponsored resources from clearing in
the PJM capacity market by establishing a floor price that can exceed the market’s clearing
price.67 Consequently, state-sponsored resources subject to the MOPR cannot clear their
64 If the capacity market is no longer considered the mechanism to attract merchant investment and, rather, is
used to allow existing resources to recover their missing money, then other mechanisms may need to be considered when new merchant investment is required (e.g., use back-stop resource adequacy mechanisms).
65 Discussion in this section is focused on explaining the problem that resulted in the expanded MOPR being implemented, and is not advocating for continuation of the MOPR. Evaluation of the magnitude of the impact to the investment signal without the MOPR requires careful consideration to determine whether any action is required.
66 A recent MOPR review in New England resulted in a proposed default price of $45/MW-day for photovoltaic solar and $0/MW-day for onshore wind. Further, the stakeholder-supported proposal included a $0/MW-day default price for offshore wind and photovoltaic solar.
67 State-sponsored resources are technologies that are specifically identified by a state through programs/markets or contracts that provide incremental revenues not broadly available to other technologies.

Resource Adequacy Constructs in Organized Wholesale Markets
EXETER ASSOCIATES, INC. Page | 39
resource’s capacity in the market and earn associated revenues. There are two related
impacts to consumers:
1. Buying the same capacity twice. Other non-state-sponsored resources may clear
in the capacity market unnecessarily, even though the state-sponsored MOPRed-out
resources (i.e., those resources that cannot clear in the capacity market due to a
high minimum offer floor price) can contribute similar capacity. This is a waste of
societal resources since multiple projects are being developed to meet the same
capacity requirement, albeit in response to other requirements.68 Buying the same
capacity twice increases the actual reserve margin (both resources that cleared in
the capacity market and resources not in the capacity market) as compared to the
planning reserve margin (only capacity market resources). In this circumstance,
consumers are paying more, but also get a higher level of reliability (at least in the
near term). Further, higher reserve margins reduce the potential for scarcity in the
energy market and unserved load, which over time reduces average energy prices
and increases capacity market prices (which makes up for missing money in the
other markets). This increases the out-of-market revenues required for state-
sponsored resources. An expanded MOPR ultimately results in excess capacity,
potentially higher levels of reliability, and increases in consumer electricity costs.69
2. Paying higher capacity prices. Since the state-sponsored resources are generally
price-takers in the capacity market (as they often have other arrangements to
recover their costs), requiring them to offer at higher prices under the MOPR
changes the capacity market supply curve and may result in higher capacity clearing
prices.70 These higher capacity prices are paid to all suppliers in the market and thus
can have a significant impact on the total market cost and the merchant investment
signal.
Figure 1 provides a simple example of how the MOPR impacts outcomes in the PJM
capacity market construct. The example assumes a peak load forecast of 500 MW, a
target installed reserve margin of 15.8%, and a target unforced capacity (UCAP) reserve
margin of 8.98% (target installed reserve margin adjusted for pool-wide EFORd of
5.89%). The fixed requirement is calculated as the peak load forecast multiplied by the
target UCAP reserve margin, or 545 MW. The variable resource requirement (VRR) curve
is set using the same three-point parameter structure as PJM has today. When supply
has the MOPR applied to it, this supply is assumed to not clear (very high on the supply
curve), while when supply is subject to the MOPR, it is assumed to offer at zero and thus
clear.
68 For example, a state-sponsored resource may be developed to comply with a requirement (e.g., an RPS) or
support a particular aim (e.g., jobs/local economy). Reliability benefits, in this circumstance, are incidental but nonetheless valuable and should not be ignored.
69 Siting and interconnecting new renewable resources can be more challenging and/or require the transmission system to be sized to support multiple resource operations under scenarios with higher reserve margins. This can also increase costs.
70 In other words, the revised MOPR reduces the amount of supply to the left of the demand curve, causing supply and demand to intersect at a more expensive clearing price.

Resource Adequacy Constructs in Organized Wholesale Markets
EXETER ASSOCIATES, INC. Page | 40
Figure 1. VRR Capacity Clearing with and without the MOPR
Table 3 summarizes the two scenarios from Figure 1 showing both the price and quantity
associated with the clearing and highlights that while there is minimal change in quantity in
this example, there is potentially a larger change in price.
Table 3. VRR Capacity Clearing Results with and
without the MOPR
Scenario
Cleared
Capacity
(MW)
Clearing
Price
($/MW-day)
Supply with MOPR 572 MW $128.60
Supply without MOPR 573 MW $113.74
4.1.2 Investor Perspective
The MOPR was put into place to solve a problem (the second aspect of the consumer
perspective): reduce the exercise of buyer-side market power and allow the market to
produce a capacity price that does not reflect the impacts of out-of-market revenues or
subsidies. Installing related protections, in theory, enables the selection and development of
a set of resources to meet reliability requirements and provides the appropriate long-term
investment signal for these resources. PJM justified the MOPR in a similar fashion in a
previous FERC filing:
To ensure continued economic investment in existing and new
resources, RPM must continue to send accurate price signals.
Accurate price signals, correctly indicating where new entry is
needed on the system, and accurately conveying the cost of
$113.74
$128.60
$-
$40
$80
$120
$160
$200
0 100 200 300 400 500 600 700 800
/MW-day
MW
VRR Curve Supply /MOPR Supply w/o MOPR

Resource Adequacy Constructs in Organized Wholesale Markets
EXETER ASSOCIATES, INC. Page | 41
that new entry, provide information that is essential both for
private bilateral contracts and for public policy initiatives.
[Reliability Pricing Model]’s market rules therefore must ensure
that new entrants are not permitted to exercise market power
to increase clearing prices above the competitive cost of new
entry. Those rules also must ensure that market participants
cannot use uncompetitively low new entry offers to suppress
clearing prices, which can deter new entry even in parts of the
system where it may be required.71
The underlying concern with the capacity market outcomes without the MOPR is that the
increase in supply willing to enter the market as a price-taker or at very low prices reduces
capacity prices, on average and over time, below a level that supports investment (net
CONE)—especially in cases where the amount of capacity entering the market exceeds load
growth and/or retirements. If capacity prices are persistently below net CONE, then
merchant investment may not occur when prices rise to the level of net CONE due to
concerns that, in future years, entry of additional subsidized resources would drive capacity
prices down. In this circumstance, new entry would potentially only occur at prices well
above net CONE (i.e., at levels that recover a high portion of missing money in relatively
fewer years) and/or during periods when there may be lulls in the entry of state-sponsored
resources that might allow for higher expected capacity prices.
The above scenario could potentially increase both reliability risk to the system and costs
since higher market prices may not elicit a market response. However, when load growth is
flat or increasing slowly with limited retirements and state-sponsored resource entry is
meeting any incremental resources adequacy requirements, this scenario may not be a
significant system reliability concern (even though locationally this could create challenges).
4.2 MOPR-Targeted Proposals
4.2.1 Fixed Resource Requirement (PJM)
Since the inception of its reliability pricing model (RPM), PJM has maintained the FRR as an
alternative option. The FRR allows vertically integrated utilities to exit the capacity market
and, in its place, use a capacity demonstration approach to meet their share of PJM’s
resource adequacy obligations. The FRR has been framed as a way for states to work
around the MOPR since the entity that elects the FRR can acquire capacity based on its
interests and avoid any MOPR-related issues altogether. While it is unclear whether the FRR
would be a more cost-effective solution than remaining in the capacity market, the election
of the FRR is a workaround to the MOPR since it allows for the entity electing the FRR to
manage the portfolio of resources meeting its capacity requirements.
71 PJM Interconnection, L.L.C., Transmittal Letter, Docket No. ER11-2875, February 11, 2011, p. 2.

Resource Adequacy Constructs in Organized Wholesale Markets
EXETER ASSOCIATES, INC. Page | 42
Appendix A, “PJM Resource Adequacy Constructs” includes a more complete assessment of
the FRR and its benefits and risks.
4.2.2 Renewable Technology Exemption (ISO-NE)
The original application of the MOPR in New England applied the minimum offer price rules
to all new resources (not just combined cycles and combustion turbines).72 The
implementation, however, generally allowed revenues from state regulatory programs (e.g.,
renewable energy credits [RECs]) and tax credits (e.g., ITCs) to be included in the
assessment of the default MOPR price. As part of the introduction of a demand curve (and
moving away from a fixed requirement in their capacity market), a small exemption to the
MOPR equal to 200 MW per year was added for a limited set of renewable energy
technologies.73 The 200-MW exemption was indexed to expected load growth in an effort to
allow some entry, but not in excess of expected load growth. This approach was intended to
minimize potential impacts on clearing-price outcomes and merchant investment signal.
This mechanism was used by smaller projects until it was eliminated as part of ISO-NE-
proposed competitive auctions for subsidized policy resources (Competitive Auctions with
Sponsored Policy Resources [CASPR] or substitution auction), which is discussed below.
4.2.3 Substitution Auction (ISO-NE)
ISO-NE recently modified its capacity market by adding a substitution auction that would
allow the entry of state-sponsored resources. This change eliminated the renewable
technology exemption (discussed previously). The intent of the new construct is to
accommodate state-sponsored resources in the presence of MOPR requirements.
The substitution auction allows existing resources that are retiring from the market (through
a priced retirement bid) but are still economic (i.e., the capacity price still allows them to
recover their missing money) to sell their capacity position in a secondary substitution
auction to new, state-sponsored resources. The result is that retiring resources give up
some of their payment from the primary auction to the state-sponsored resource, exit the
market (i.e., retire), and are then replaced by the new, state-sponsored resource in that
auction and subsequent auctions.74 This approach has had mixed results since its
implementation, as there has been minimal demand in the secondary auction (i.e.,
resources requesting to retire, but still clearing in the primary auction).
72 In ISO-NE, the default minimum offer price is called the “offer review trigger price” (ORTP).
73 ISO-NE, Demand Curve Changes, Docket No. ER14-1639-000, April 1, 2014, https://www.iso-ne.com/static-assets/documents/regulatory/ferc/filings/2014/apr/er14_1639_000_demand_curve_chges_4_1_2014.pdf.
74 ISO-NE, ISO Discussion Paper - Competitive Auctions with Subsidized Policy Resources, April 2017.

Resource Adequacy Constructs in Organized Wholesale Markets
EXETER ASSOCIATES, INC. Page | 43
4.3 MOPR-Framed Proposals
All the MOPR-framed proposals create revenue opportunities for clean/renewable energy
technologies through market structures that then are assumed to be “counted” in the MOPR
calculations (i.e., netted out), thus enabling these resources to have a greater probability of
clearing in the capacity market. These proposals can complement or replace existing
regulatory programs with centralized procurement approaches that are assumed to be
competitive and more efficient (and thus reduce long-term costs).75
It is less clear how these proposals would impact investment signals for merchant
developers in the capacity market. Assuming the centralized clean/renewable energy
procurement approaches generally produce revenues for the affected resources in a similar
manner to existing state regulatory programs, these solutions would seem to create similar
risks to merchant investment in the capacity market as the risks present in the absence of
the MOPR. These proposals are not procuring for resource adequacy purposes, but rather
for other requirements which results in investment absent a direct signal from the capacity
market. The implications of these proposals on the merchant investment signal would need
to be reviewed in order to understand the full, long-term resource adequacy implications.76
If state-sponsored resources do not provide capacity because of performance risk or are
limited in quantity due to a constrained capacity value, the potential for double-procurement
of capacity could result even without the MOPR (i.e., consumer MOPR problem). Solutions
that target both state requirements and resource adequacy needs (e.g., procure
clean/renewable energy during times when the system needs energy) are best positioned to
achieve these combined objectives for the least cost. Solutions that target procurement of
state requirements without dimensioning this procurement to reliability needs would have
the tendency to increase overall costs and, in the extreme, could result in only a relatively
small portion of resources meeting both state requirements and providing capacity (e.g., at
some point installing more solar on the system just results in the need to curtail more solar
without investment in other technologies).
4.3.1 Incremental Carbon Pricing
There are two primary approaches to carbon pricing: cap and trade, and a carbon tax/fee.
Both approaches result in product (e.g., electricity, fuel) market prices reflecting the cost
assigned to carbon. Governing bodies are responsible for determining how to handle the
distribution of carbon pricing funds collected from affected parties. Carbon pricing already
exists in electricity markets (e.g., the RGGI, which includes several PJM states). However,
existing carbon prices are not set at a level that has a significant impact on market
outcomes.
75 The reviewed proposals do not go into detail about what would happen with the existing regulatory programs.
76 For example, the current process assumes that net CONE is based on a levelized calculation approach. This approach assumes that, on average and over time, a new resource would earn net CONE in the capacity market (sometimes above, sometimes below). However, because of the entry of state-sponsored resources (unrelated to a specific resource adequacy need), the capacity market prices, on average and over time, could be less than net CONE.

Resource Adequacy Constructs in Organized Wholesale Markets
EXETER ASSOCIATES, INC. Page | 44
Carbon pricing provides incremental revenues to low- and zero-emitting technologies in the
market insofar as it increases EAS prices. That is, low- and zero-emitting technologies can
capture additional inframarginal rents during periods when a resource that is subject to
incremental carbon pricing sets the clearing price.77 Carbon pricing also reduces the
operation of higher-emitting technologies (and thus their revenues) by pushing them further
up the supply-dispatch curve.
There are significant complexities inherent to the design of a carbon price construct,
especially when looking at the application of a carbon price on a sub-regional basis.
Nevertheless, overall, a carbon price would promote investment in zero-/lower-emitting
technologies as well as reduce the need for (and possibly eliminate) regulatory programs to
drive similar investment decisions.
The incremental revenues from a carbon price reduce/eliminate missing money for certain
resource types. Thus, assuming the carbon price is set at an appropriate level, deemed
competitive, and is allowed in the calculation of the MOPR default price, incremental carbon
pricing would result in significant market response and allow many state-sponsored
resources to clear in the capacity market. However, the driver for carbon pricing is not the
MOPR. Rather, advocates view carbon pricing as a more efficient way to acquire clean
energy. In the absence of the MOPR, carbon pricing would still influence market outcomes.
Although carbon pricing is not valuing reliability explicitly, there is some correlation between
when emitting technologies are on the margin in the energy market and when resources are
required for reliability. Since carbon pricing is hourly (as opposed to many regulatory
programs, which are focused on acquiring clean/renewable energy on an annual basis), an
incremental carbon price has the potential to increase inframarginal rents more for
clean/renewable resources that perform most frequently during times of system need.78,79
The FERC initiated a proceeding on carbon pricing in 2020 to determine jurisdictional
responsibilities and how carbon pricing could work in the ISO/RTO-administered markets.80
77 Exeter Associates, Inc. (on behalf of NESCOE), Analysis of Carbon Pricing Impacts to the New England Power
Sector, submitted in FERC Docket No. AD20-14, fall 2020.
78 While initially most regions would see emitting technologies on the margin in the energy market in every hour, it is expected that eventually lower-emitting resources will predominate the resource mix and increasingly operate on the margin. Despite this shift, higher-emitting technologies would still be expected to operate (and therefore send price signals inclusive of carbon pricing) during times of system stress. As the system transitions to lower- and zero-emitting technologies being on the margin, the revenues available through carbon pricing would begin to focus on hours in which the clean/renewable energy resources could not otherwise perform (i.e., more emitting resources are required). For example, if the amount of solar on the system required persistent curtailment because it exceeded the load on the system, the carbon price adder in these hours would be zero, dynamically signaling that additional solar has no/limited value in these hours (assuming that the price goes to zero in these hours).
79 It is unknown how the EAS pricing algorithms, ancillary service product structures, and commitment and dispatch practices may evolve with increases in zero-marginal-cost resources, which could have significant implications to resource adequacy constructs and inframarginal and scarcity rents. This is likely to become a focus of stakeholder discussions in the ISOs/RTOs in the coming years.
80 “FERC Proposes Policy Statement on State-Determined Carbon Pricing in Wholesale Markets,” Docket No. AD20-14-000, October 15, 2020.

Resource Adequacy Constructs in Organized Wholesale Markets
EXETER ASSOCIATES, INC. Page | 45
4.3.2 Renewable/Clean Energy Forward Market
There have been a number of proposals put forth over the past few years that attempt to
improve the ability of state-sponsored resources to directly clear in the capacity market.
While the MOPR is a recent driver for these proposed enhancements, these proposals stand
on their own as potentially more efficient mechanisms for states to acquire supply to meet
their respective statutes and requirements.
Three illustrative proposals of a renewable/clean energy forward market are included in this
report: the competitive carve-out auction (CCoA),81 the forward clean energy market
(FCEM),82 and the integrated clean capacity market (ICCM).83 While these proposals differ in
their details, they all attempt to achieve the same objective of allowing resources to be
exempted from the MOPR. Each of the proposals effectively creates a tranche requirement
in the capacity market that can only be met by certain resources. The ability of each of
these proposals to achieve the least-cost mix of resources to meet both state and resource
adequacy requirements depends on decisions surrounding the continuation of state
regulatory programs and how these interact with each proposal.
1. CCoA clears a portion of capacity requirements (based on state clean and renewable
energy requirements) without the limitation of the MOPR, effectively exempting
state-sponsored resources from the MOPR, and then clears incremental supply to
meet resource adequacy requirements. This proposal uses a capacity valuation
approach.
This approach would apply both the ELCC and performance incentives to state-
sponsored resources and thus has the potential to clear those state-sponsored
resources that provide the greatest reliability benefit in addition to providing clean
energy, depending on how state requirements are formulated. However, this
approach also runs the risk that those resources meeting state requirements may
not clear for capacity, depending on each resource’s perception of the related risk.
2. FCEM clears some (or all) of the state clean and renewable energy requirements on a
forward basis (in lieu of, or in conjunction with, the existing regulatory program
constructs). These revenues (which are assumed to be reflected in capacity market
offers) would cover much of the missing money applicable to these resources. This
proposal uses an energy valuation approach.
Since this approach does not necessarily require resources to take on a capacity
obligation, this could procure least-cost resources to meet state requirements, but
not necessarily procure the least expensive combination of resources to meet both
resource adequacy and state requirements, even though expectations of capacity
revenues should influence this clearing. It is possible that this construct could result
81 Maryland Public Service Commission, “Initial Comments of the Maryland Public Service Commission,” Docket
No. EL18-178-000, October 2, 2018.
82 The Brattle Group (on behalf of NRG), How States, Cities, and Customers Can Harness Competitive Markets to Meet Ambitious Carbon Goals through a Forward Market for Clean Energy Attributes, September 2019.
83 The Brattle Group (on behalf of the New Jersey Board of Public Utilities), Integrated Clean Capacity Market, Investigation of Resource Adequacy Alternatives February 19, 2021.

Resource Adequacy Constructs in Organized Wholesale Markets
EXETER ASSOCIATES, INC. Page | 46
in the need for existing state regulatory programs and direct contracting with
resources to be reduced or eliminated.
3. ICCM builds upon the FCEM construct and integrates the clearing of the FCEM with
the capacity market. In concept, the capacity market outcomes between the ICCM
and FCEM should be similar, assuming that the resources clearing in the FCEM also
clear in the capacity market, and make assumptions around expected capacity
revenues.84 This concept appears to use an energy valuation approach. Co-
optimization may result in the least-cost mix of resources, factoring in both state and
resource adequacy requirements. However, many details need to be ironed out for
this approach and it is unclear how successful it would be in achieving dual
objectives.
Providing a centralized, competitive forward procurement mechanism for states to acquire
capacity to meet their respective requirements may improve efficiency of their procurement.
These approaches may also simply shift existing state regulatory requirements to a forward
procurement basis, while still adhering to regulatory program constructs.
The product definitions in these proposals introduces several additional complexities and
raises questions as to the objective of the resource adequacy constructs—should the
construct procure resource adequacy and state requirements at least cost, or simply allow
state preferences to be reflected in the resource adequacy construct?
▪ The use of energy as the metric for valuing these resources is interesting because
resources that can produce more energy will have lower cost (as compared to using
a capacity metric). This dynamic is very different than the capacity market, which
does not differentiate costs in the context of annual delivered energy. Rather,
capacity markets differentiate costs based on potential energy output in a limited set
of hours (e.g., during peak demand periods). Thus, a renewable/clean energy
forward market could change how expensive different technologies appear based on
the ratio of energy to capacity. Resources with a greater ratio of energy to capacity
may appear cheaper, while resources with a smaller ratio of energy to capacity may
appear more expensive depending on how the clearing is performed.
▪ Many state regulatory programs are narrowly targeted and limit compensation to
certain clean or renewable energy resources. In concept, a market would provide
compensation to all resources capable of meeting some broader criteria. This could
significantly address the missing money of many resource types and thus have a
significant impact on the capacity market supply curve and related outcomes, but
also has the potential to increase the total costs of acquiring clean/renewable energy
(with an increase in eligible clean/renewable resources) so would need to be
considered carefully.
84 A properly designed co-optimized clearing between these requirements would produce a lower overall cost
solution, but likely does not have a material impact under most scenarios.
Resource Adequacy Constructs in Organized Wholesale Markets
EXETER ASSOCIATES, INC. Page | 47
4.3.3 Residual Capacity Market
Several stakeholders have advocated to replace PJM’s mandatory capacity market with a
voluntary residual market construct, akin to the market design in place in MISO (i.e.,
voluntary participation in central auctions, but mandatory reliability requirements through a
capacity demonstration-type approach). A major driver of this proposal is a desire to
exercise state, municipality, and cooperative resource preferences and bypass MOPR-caused
participation limits. In concept, the current PJM capacity market is already a residual
market, as the FRR option (which is a capacity demonstration construct) allows
utilities/LSEs to opt out of the PJM capacity market and meet their obligations outside of the
market.
In a residual capacity market construct, the expectation is that buyers exercise greater
responsibility over how they fulfill their resource adequacy obligations (following the
capacity demonstration construct). The residual capacity market provides another option for
LSEs and suppliers to make arrangements, but does not remove the responsibility of the
LSEs to demonstrate that they have met their obligations. The residual capacity market is
largely composed of existing resources that do not have arrangements to meet LSE capacity
requirements. These markets provide a competitive, transparent way to acquire capacity
when there is excess supply on the system as an alternative to building new resources or
direct contracting.
It is unclear how effective the market procurement, on its own, would be at attracting new
investment, as it is not clear whether capacity prices, on average and over time, would
support investment (i.e., net CONE). Rather, the potential for high prices in the residual
capacity auction could motivate LSEs without sufficient supply to contract with a new project
(or develop a new project for vertically integrated utilities) to meet their obligations. This
assumes the level of penalty for not meeting a capacity obligation is sufficient to motivate
the LSE to act.
How performance incentives are applied in a residual capacity market is also important.
Applying performance incentives only to resources clearing in the capacity auction undoes
the benefits that a strong performance incentive structure can achieve and effectively
creates two different products, and would likely push LSEs to contract to avoid incremental
costs. Assuming performance incentives are applied to all capacity resources, LSEs must
then decide how to assign risk in their arrangements (e.g., risk assigned to the supplier
increases contract prices, but risk assigned to the LSE could result in significant costs being
allocated to consumers and may not motivate suppliers to take appropriate action to
mitigate non-performance).

Resource Adequacy Constructs in Organized Wholesale Markets
EXETER ASSOCIATES, INC. Page | 48
4.4 Non-MOPR-Related Proposals
4.4.1 Effective Load Carrying Capability (PJM)
ELCC models are a logical extension of the historical peak-hour performance approach that
the ISOs/RTOs use to value variable energy resources.85 A peak-hour performance approach
evaluates the performance of any given resource during peak hours (i.e., the hours where
capacity is likely to be most valuable) and uses this performance to calculate a capacity
factor. However, with the growth of variable and limited energy resources, this simplistic
approach does not necessarily provide a good measure of the benefit these types of
resources can provide to the system. ELCC is effectively a more robust way to evaluate the
capacity benefits that involves looking across all hours in a designated period under
different conditions to develop a probabilistic value of a resource’s potential to perform
when required. ELCC approaches are highly sensitive to the resource mix, weather patterns,
and assumed load shape.
ELCC models evaluate the capacity contribution in a more dynamic way than the current
static assumptions used in many resource adequacy constructs. The models, however, are
complex, sensitive to input assumption and, when iterated over many scenarios,
computationally intensive. Further, ELCC modeling will likely become more complicated as
daily and seasonal load patterns continue to evolve; more variable, distributed, and limited
energy resources enter the system; and demand becomes more elastic.
Setting aside using ELCC models to set limits for supply eligibility, they also provide critical
information to the market regarding the aggregate performance of different resource types.
Conducting many scenarios under different assumptions captures a more complete risk
profile of a resource relative to the broader market. ISOs/RTOs are in many ways the actor
with sufficient information to look at this portfolio risk, and therefore serve a critical
information-broker role in the market when ELCC results are made public.
The challenge with ELCC modeling is converting probabilistic results from a variety of
scenarios into a single-capacity benefits factor, which is usually done by selecting a
representative ELCC scenario for capacity value purposes. Applied incorrectly or poorly, an
ELCC model can artificially limit competition in the market and increase costs. For example,
if an ELCC analysis provides more optimistic performance assumptions than actual
contribution, the assigned capacity value may overvalue the potential contribution of a
resource toward reliability, and risk insufficient resource adequacy.86 If, by comparison, an
ELCC analysis underestimates a resource’s performance, the market will undervalue its
capacity contribution and procure additional, excess capacity to fill anticipated gaps. ELCC is
85 Most ISOs/RTOs are adopting ELCC models that appear to reduce the capacity value of many intermittent,
state-sponsored resource types, thereby reducing the amount of capacity available from these resources. CAISO’s recent ELCC analysis for solar shows an annualized capacity value of 14%. (Source: California Public Utilities Commission, Energy Division Monthly ELCC Proposal for 2020 RA Proceeding, February 5, 2019, p. 14).
86 The potential for the market constructs to overvalue or undervalue resources is not a new problem. Metrics like EFORd have their own share of challenges.

Resource Adequacy Constructs in Organized Wholesale Markets
EXETER ASSOCIATES, INC. Page | 49
an approximation of performance, and actual performance could vary significantly,
especially if different conditions or resource mixes materialize.
ELCC models that limit a resource’s participation (at any price) in the capacity market do
not replace the need for suppliers to evaluate risk and properly reflect their non-
performance risk at a price. In theory, a market with adequate performance incentives
could pass through performance risk to the supplier in such a way that it incentivizes each
resource to bid its capacity at a level commensurate to its ELCC. That is, the supplier would
submit a risk-weighted bid that accounts for the probability of performance for a given
period.
4.4.2 Seasonal Capacity Markets (MISO)
The Midcontinent ISO (MISO) is in the early stages of contemplating a proposal to procure
capacity on a seasonal basis. The intent of this proposal is to better reflect differing
reliability requirements across the year and seasonal variation in resource performance.87
The proposal also considers shifting away from a UCAP construct to an available capacity
(ACAP) construct for how resources are limited. This change may have merit but is
independent of the seasonal proposal and could be considered with it or separately from it.88
MISO’s stakeholder process has just begun, and many details are expected to follow. Annual
market constructs often offer many sub-annual components to facilitate participation. While
moving to a seasonal construct simplifies sub-annual components managed through the
annual design, it also has the potential to add complexity to the design.
4.4.3 New Ancillary Service Products
There has been discussion at some level in most of the ISOs/RTOs around how new ancillary
services may be required to support the evolving power system. Traditionally, ancillary
service products focus on managing real-time system balance (i.e., regulation) or
contingency response (e.g., 10-minute or 30-minute reserves) needs. These requirements
are relatively modest when compared to the energy demand on the system. However, there
may be a future need for resources that can not only respond quickly, but also sustain
operation over some period of time (e.g., four hours).89 Further, new products/requirements
may be required to help manage new reliability changes like ramping requirements or
manage greater uncertainty in forecasted supply and demand.
87 MISO, RAN Reliability Requirements and Sub-annual Construct, February 25, 2021.
88 There are many ways to calculate the maximum quantity at which a resource can sell capacity into the markets. PJM, NYISO, and MISO have used UCAP historically; ISO-NE uses installed capacity (ICAP), but also applies the lower of the summer and winter rating (for most resources). Further, some markets have stronger consequences for non-delivery.
89 Reserve products have historically required at least one hour of energy to be eligible. This makes limited energy facilities like batteries and pumped storage hydropower ideal candidates, as they can respond quickly, but often have limited energy. However, in a changing power system, the ability to have resources that can come online to provide sustained replacement energy in an hour or 90 minutes may become a more valuable service that has to be specifically valued.

Resource Adequacy Constructs in Organized Wholesale Markets
EXETER ASSOCIATES, INC. Page | 50
New ancillary services can create new revenue streams that target specific resource
capabilities that benefit system reliability. These products help to offset the missing money
for the eligible technologies which, in turn, can make the affected technologies more cost-
effective in meeting overall resource adequacy requirements. In other words, resources that
can provide ancillary services or energy during times when these new products are most
valuable benefit the most from reduced missing money.
While new ancillary service products can increase inframarginal and scarcity rents
(associated with new services), they may also reduce scarcity rents (associated with other
services) and may lower inframarginal rents in general (depending on the quantity of the
products and how they are acquired, and how the ancillary services are reflected in the real-
time market prices). This is because (1) the additional ancillary service market signal may
attract additional resources that can also participate in the energy market; and (2) real-time
markets are operated with more reserve capability available. A more robust supply stack
available for purposes of energy dispatch generally reduces potential upward price volatility.

Resource Adequacy Constructs in Organized Wholesale Markets
EXETER ASSOCIATES, INC. Page | 51
APPENDIX A – PJM RESOURCE ADEQUACY CONSTRUCTS
ORDC and Scarcity Pricing
As discussed above, each market’s ORDC and scarcity prices contribute to resource
adequacy by affecting: (1) the resources that provide energy and ancillary services; and
(2) the clearing prices that are paid. These factors, in turn, influence the inframarginal and
scarcity rents available and the missing money for resources which can perform and earn
these rents. PJM recently proposed—and FERC approved—serval major changes to its
ancillary service ORDC and scarcity pricing.90 These reserve market reforms, which include
altered product offerings, increased scarcity prices, and a sloped (vs. stepped) demand
curve, will take effect on May 1, 2022.91
Currently, PJM’s ORDC uses stepped tiers to determine the applicable price cap (i.e., penalty
factor). Under this construct, a shortage condition applies when there is insufficient supply
to meet the minimum requirement (i.e., insufficient reserves to address the single largest
electric contingency). Another step precedes this point and takes effect when the level of
reserves equals the minimum reserve requirement plus 190 MW. The price paid for reserves
equals $0/MWh (i.e., indicative of sufficient reserves) beyond these two steps. The price cap
for these two steps is $300/MWh and $850/MWh, respectively. Figure 2 illustrates PJM’s
existing stepped demand curve for synchronized reserves.
Figure 2. PJM’s Current Synchronized Reserve Demand Curve
Source: https://pjm.com/directory/etariff/FercDockets/4036/20190329-el19-58-000.pdf.
The revised ORDC replaces the steps with a sloped demand curve. The slope of this curve is
based on the probability of PJM falling below its minimum reserve requirement, multiplied
by the price cap. Each increment of the curve represents PJM’s maximum willingness to pay
to maintain the specified quantity of reserve product. A sloped curve maintains additional
90 Enhanced Price Formation in Reserve Markets of PJM Interconnection, L.L.C., original filing dated March 29,
2019.
91 FERC, Docket Nos. EL19-58-002 and 003, Order on Compliance, issued November 12, 2020.

Resource Adequacy Constructs in Organized Wholesale Markets
EXETER ASSOCIATES, INC. Page | 52
reserves at reduced prices, effectively increasing the total amount of revenue available to
generators that can provide reserve products.
In addition to revising the curve shape, PJM also increased the maximum price cap to
$2,000/MWh, which applies in scarcity conditions (i.e., when reserves fall below the
minimum requirement).92 Figure 3 shows PJM’s forthcoming sloped demand curve for
synchronized reserves. Further, PJM consolidated its synchronized reserve products (settled
in both the day-ahead and real-time markets), created a secondary reserve product, and
tweaked the non-synchronized reserve product rules. Together, the changes proposed by
PJM are estimated to increase PJM-wide energy payments to generators by $366 million and
increase ancillary service payments by $190 million.93
Figure 3. PJM’s Future Synchronized Reserve Demand Curve
Source: https://pjm.com/directory/etariff/FercDockets/4036/20190329-el19-58-000.pdf.
Under the revised ORDC, the new price cap of $2,000/MWh applies separately for each
ancillary service product. If all system requirements are not being met, prices could reach
$8,000/MWh on an RTO-wide basis during a shortfall.94
Along with the above changes to the ORDC, the FERC instructed PJM to update its revenue
offsets for net CONE to use forward estimates of energy and fuel price data. This update is
intended to better reflect the expectations of suppliers when they bid into capacity auctions.
While there are many models used to estimate future potential revenues, when a significant
change like the ORDC is made in the market, using historical values with no adjustment for
the future impacts of this market change likely understates the EAS value.
92 In concept, anytime the reserve price is set based on the ORDC, rather than the lost opportunity cost to
maintain the requirement, this could be viewed as a scarcity price. However, it is difficult to distinguish this when the requirement is on the sloped portion of the demand curve.
93 Compliance filing dated July 6, https://www.pjm.com/directory/etariff/FercDockets/4617/20200706-el19-58-002.pdf, FERC Docket Nos. EL19-58-002 and ER19-1486-00.
94 This assumes that synchronized, secondary, and non-synchronized reserve products plus the real-time energy product simultaneously reach the cap. Prices could go even higher—as much as $12,000/MWh—in the event of local constraints.

Resource Adequacy Constructs in Organized Wholesale Markets
EXETER ASSOCIATES, INC. Page | 53
An indicative EAS revenue estimate for a combustion turbine (i.e., PJM’s reference resource)
using the updated offsets (as of August 19, 2020) produced a net CONE estimate of
$226/MW-day.95 This estimate is based on a gross CONE of $294/MW-day nameplate
capacity, a net EAS revenue offset estimate of $62/MW-day, and a net reactive services
revenue offset of $6/MW-day. This compares to the old, backwards-looking offset method
that yielded a net CONE of $268/MW-day.96
Capacity Market
The PJM capacity market (or RPM) is the mechanism used by PJM to acquire resources to
meet NERC resource adequacy requirements. PJM runs a probabilistic model that evaluates
resource outages and load conditions to establish a target reserve margin (i.e., how much
more capacity is required above the peak load forecast). The RPM supports PJM to meet its
resource adequacy requirement in a future delivery year.
PJM procures capacity on behalf of LSEs through their capacity market using a VRR that is
developed based on the forecasted load, target reserve margin, CONE of a new combustion
turbine (CT), and an agreed-upon demand shape. The VRR is a downward-sloping demand
curve for the system and each constrained location. In conjunction with the offered supply,
the curve helps determine the clearing price paid to capacity resources and charged to
LSEs. The VRR curve represents the trade-off between level of reliability and cost, and
allows PJM to procure more or less than the target reserve margin, depending on the
amount of capacity and price of this offered capacity. The VRR curve is tuned to ensure that
the 1-in-10 reliability standard is achieved over time.
The PJM capacity market procures unforced capacity (UCAP) as opposed to installed
capacity (ICAP) (i.e., nameplate capacity). UCAP reflects the ability of a capacity supplier’s
resource to perform, on average and over time. This value is calculated differently
depending on the type of resources, but generally falls into two categories: installed
capacity adjusted for forced outages (i.e., EFORd), which is generally applied to traditional
generation resources; or installed capacity adjusted for the benefit to the system (i.e.,
capacity factor or ELCC approach), which is generally applied to variable or limited energy
resources.
Capacity suppliers offer their resources into the capacity market based on their expectation
of their missing money, as described above. There are buyer-side (i.e., MOPR) and seller-
side market power provisions, both administered by PJM’s market monitor. The capacity
market clears the necessary UCAP in each location (both the system and constrained local
areas) to meet the requirement as reflected through the VRR curves. This process produces
different locational prices when local constraints are binding. Capacity suppliers are paid the
clearing price associated with the location their resources clear.
95 PJM, Informational Filing with Indicative Values for Energy and Ancillary Services Offset, August 19, 2020.
96 PJM, Preliminary Default MOPR Floor Offer Prices for New Generation Capacity Resources, February 28, 2020.

Resource Adequacy Constructs in Organized Wholesale Markets
EXETER ASSOCIATES, INC. Page | 54
The primary capacity auction, known as the base residual auction (BRA), is conducted three
years ahead of the delivery year (DY).97 Incremental auctions are run in each subsequent
year leading up to the delivery year. The incremental auctions allow PJM to acquire more or
less capacity and therefore also allow capacity suppliers to shed their obligations or increase
their capacity obligations. Prior to each auction, the VRR curve is revised based on the most
recent load forecast and other information that is available.
PJM has numerous interrelated penalty structures that are applied based on the type of
commitment, resource type (i.e., generation, demand resource, energy efficiency) and type
of technology.98 Having different penalty structures across different resource types can
inherently create different risk profiles and impact the ability for all resources to compete
equally in the market.
For purposes of allocating costs, the total UCAP obligation cleared in the market (“VRR UCAP
obligation”) is assigned to Locational Deliverability Areas (LDAs) based on a peak load
forecast. Using the peak load contribution from the prior year, LSEs are charged based on
their location and are then credited for the price difference between their location and the
location from which capacity is imported. This credit is known as a capacity transfer right
(CTR) and results in LSEs effectively paying the price outside their location for imported
capacity and the price inside their location for local, cleared capacity.
Capacity Clearing Example
Figure 4 shows a relationship between cost and reliability under an illustrative PJM demand
curve based on two different scenarios, one with lower-cost capacity (i.e., a more capacity-
long system) and one with higher-cost capacity (i.e., a more capacity-short system). This
example assumes a peak load forecast of 500 MW, a target installed reserve margin of
15.8%, and a target UCAP reserve margin of 8.98% (i.e., the target installed reserve
margin adjusted for pool-wide EFORd of 5.89%). The fixed requirement is calculated as the
peak load forecast multiplied by the target UCAP reserve margin, or 545 MW. The VRR
curve is set using the same three-point parameter structure as PJM has today.
Since the change in quantity as compared to the change in price is not the same ratio, total
costs increase as supply is more expensive (even though there is less quantity) and
reliability declines.99 The high price resulting from the shorter system provides an
investment signal to the market to bring in new, lower-cost capacity.
97 The delivery year is defined as the 12 month-period from June 1 through May 31.
98 PJM, RPM 301 Performance in Reliability Pricing Model, April 20, 2017.
99 Unless resources are mothballing or retiring, a resource that does not clear in the capacity market but continues to be available is really still contributing to the actual reserve margin. Thus, even if the market is clearing at lower levels of reliability, operating resources are still contributing to the actual reserve margin on the system. Scarcity pricing can create a strong incentive to perform regardless of whether a resource is in the capacity market. Also, bonus payments under pay-for-performance constructs can also provide an incremental incentive for performance, especially during very high load periods.

Resource Adequacy Constructs in Organized Wholesale Markets
EXETER ASSOCIATES, INC. Page | 55
Figure 4. VRR Capacity Clearing with a Capacity-Long or -Short System
Under the current version of the demand curve, purchasing more capacity results in lower
cost. Figure 5 in the next section shows the comparison of the market clearing with a fixed
requirement versus a VRR curve, which reduces the quantity and cost of the clearing when
looking at a single period snapshot.
Fixed Resource Requirement
An investor-owned utility (IOU), a rural electric cooperative, or a public power utility can
elect not to participate in the PJM capacity market and instead opt out by electing the FRR
alternative. Under the FRR, these utilities procure capacity on their own to meet PJM-
defined reliability requirements.100,101,102 The decision to elect the FRR can also be made at
the state level for all of the state’s utilities.
The initial election has a minimum term of five years (with some limited ability to terminate
early) and then can be extended year to year thereafter.103 The election of the FRR must be
made at least four months ahead of the primary capacity auction (i.e., BRA). The
designated party (i.e., FRR entity) must submit an initial FRR capacity plan on how it plans
to meet its preliminary FRR UCAP obligation (including its minimum internal resource
100 PJM, Reliability Assurance Agreement Among Load Serving Entities in the PJM Region, RAA Schedule 8.
101 PJM, Market Implementation Committee, Fixed Resource Requirement (FRR) Alternative, January 8, 2020.
102 Vertically integrated utilities that have elected the FRR would generally have most, if not all, of the necessary resources under contract to meet their obligations through a cost-of-service construct.
103 Once an entity elects to return to the PJM capacity market, it is unable to elect the FRR for five years.
$128.60
$308.89
$-
$50
$100
$150
$200
$250
$300
$350
300 350 400 450 500 550 600 650 700 750
/MW-day
MW
Supply (Long System) VRR Curve
Supply (Tight System) Fixed Requirement

Resource Adequacy Constructs in Organized Wholesale Markets
EXETER ASSOCIATES, INC. Page | 56
requirement [MIRR]) one month prior to the primary auction for the period for the five-year
minimum commitment period.104 Entities electing the FRR with excess capacity can elect, as
part of their initial FRR capacity plan to sell into the PJM capacity market, limited amounts of
this excess capacity based on minimum and maximum requirements. If the initial FRR
capacity plan is not sufficient to meet the preliminary FRR UCAP obligation calculated by
PJM, the FRR entity is charged a high replacement cost (i.e., 100% of the gross CONE) as
compared to what would be expected to be paid for capacity.105
The FRR UCAP obligation and MIRRs are adjusted (up or down) by PJM ahead of the delivery
year based on the revised load forecast and transmission limits. If the FRR entity does not
demonstrate that it can meet its final FRR UCAP obligation and MIRR ahead of the delivery
year, there is a replacement cost charge (equating to 20% more than the weighted average
resource clearing price from all auctions) for any shortfall.106
All resources included within an FRR capacity plan are obligated to participate in the other
PJM markets (e.g., energy, reserves) just as any other PJM capacity resource; however, the
FRR entity can elect to have physical performance penalties. These penalties can require the
FRR entity to cover any non-performing capacity in a subsequent delivery year’s FRR
capacity plan, or impose a financial performance penalty under the capacity performance
structure.
Capacity Market Participation versus FRR Election
The FRR has the potential to reduce aggregate costs to consumers; however, it also comes
with risks that could increase consumer costs, especially if the area electing the FRR is not
supported by vertically integrated utilities.
The FRR provides four distinct benefits:
1. Lower UCAP obligation based on a fixed versus variable resource requirement;
2. Use of MOPRed-out resources to provide capacity, lowering costs to procure capacity
by eliminating double-payment;
3. Lower PJM capacity market prices by using MOPRed-out resources (which could lower
contracting costs to acquire capacity under the FRR); and
4. Flexible capacity contracting options, which could reduce costs and should provide
more stable costs.
104 The minimum internal resource requirement is set for locations with VRR curves as a minimum amount of UCAP
that must be purchased from resources within the constrained location. The remainder of the FRR UCAP obligation can be purchased from resources within or outside of the constrained location.
105 Gross CONE for the RTO was set at $370.71/MW-day for the PJM capacity auction for DY 2021/22 that took place in 2018. By comparison, the capacity price for the Baltimore Gas and Electric Company (BGE) LDA in that same auction was $203.19/MW-day, for example.
106 The average resource clearing price reflects the prices from the primary and associated incremental auctions; however, it is largely driven by the primary auction (BRA) which transacts a majority of the capacity.

Resource Adequacy Constructs in Organized Wholesale Markets
EXETER ASSOCIATES, INC. Page | 57
When electing the FRR, there are risks that must be addressed to achieve the benefits:
▪ Market power related to the MIRR is the biggest challenge to overcome;
▪ Limited eligible capacity from MOPRed-out resources may mitigate the benefits
associated with an FRR election and could put non-performance risk on consumers;
and
▪ New infrastructure may be required to meet MIRR cost-effectively and manage
market power, therefore requiring some form of a longer-term planning process.
Finally, implementing a procurement structure to acquire capacity cost-effectively is
complicated even if the above risks are addressed.
FRR Results in a Lower UCAP Obligation
The FRR UCAP obligation is generally lower than the VRR UCAP obligation. An overview of
how, generally, capacity can be procured under a fixed requirement and under a variable
requirement explains why this occurs.
Fixed vs. Variable Requirement
Organized capacity markets (including PJM and ISO-NE) procure capacity on behalf of LSEs
based on the reliability requirements for their regions.
There are two predominant approaches used to reflect demand requirements in capacity
procurement: fixed (vertical demand) and variable (downward-sloping demand). A fixed
requirement is structured to always procure sufficient capacity to meet the designated
reliability requirement, limited only by the market price cap. In contrast, the variable
requirement, in concept, evaluates the tradeoff between cost and reliability, so more or less
capacity can be procured than the reliability requirement depending on the price of the
offered capacity (e.g., at higher prices less capacity is procured and at lower prices more
capacity is procured). Both of these approaches administratively represent what demand is
willing to pay for capacity (and, by extension, certain levels of reliability).
Most capacity markets use a variable requirement approach. The benefits of this approach
include its ability to mitigate market power, provide higher levels of reliability, lower cost
over time, eliminate/reduce the need for inefficient and complex administrative pricing
rules,107 and reduce year-to-year price volatility. The perceived downside (from a consumer
perspective) of the variable requirement approach is that more capacity can be procured
than the reliability requirement in any one year, increasing total cost in that year as
compared to just procuring the reliability requirement.
A fixed requirement (i.e., reliability requirement) is determined based on the forecasted
peak load multiplied by a target reserve margin. The target reserve margin reflects the
amount of ICAP that is required above the peak load forecast to meet the 1-in-10 standard.
Since PJM does not procure ICAP, but rather UCAP, the reserve margin is adjusted down
107 The demand curve is an administrative pricing rule itself.

Resource Adequacy Constructs in Organized Wholesale Markets
EXETER ASSOCIATES, INC. Page | 58
based on the average system EFORd to ensure that the procured UCAP associated ICAP is in
line with the target reserve margin.108 Since a fixed requirement is based on the peak load
forecast only, it does not reflect the tradeoff between reliability and cost by clearing
different quantities. Rather, the market clearing attempts to procure an exact quantity.
Example – Fixed vs. Variable Requirement Clearing
Building on the example from Figure 4, the following example (Figure 5), which compares
using a fixed versus variable requirement approach when clearing a capacity market,
explains how the market may clear more than the fixed requirement and provides additional
context for why the FRR UCAP obligation is usually less than the VRR UCAP obligation.109
Figure 5. Variable and Fixed Requirement Capacity Clearing
Figure 5 shows that the VRR curve clears 565 MW of UCAP (at a price of $126.22/MW-day),
while the fixed requirement clears only 545 MW of UCAP (at a price of $118.98/MW-day).
The cleared capacity on the VRR curve, which is 20 MW (or 3.8%) greater than the fixed
requirement, is the VRR UCAP obligation and effectively increases the installed reserve
margin from the initial target of 15.8% to 19.8% (and increases the UCAP reserve margin
from 8.98% to 13.31%). When clearing under a fixed requirement, the installed reserve
108 PJM refers to the UCAP reserve margin as the forecasted pool requirement.
109 While not shown in these figures, the point at which the VRR curve intersects with the price cap (higher of gross CONE or net CONE x 1.5) is 99.8% of the reliability requirement, or 544 MW. While it is possible that the market may clear less than the reliability requirement, this outcome would more likely be due to inadequate supply in the market (at any price) than a tradeoff between reliability and cost that causes the market not to clear available supply.
$128.60 $118.98
$60
$80
$100
$120
$140
$160
$180
$200
0 100 200 300 400 500 600 700 800
/MW-day
MW
Supply VRR Curve Fixed Requirement

Resource Adequacy Constructs in Organized Wholesale Markets
EXETER ASSOCIATES, INC. Page | 59
margin and UCAP reserve margin are constant at all prices (assuming adequate supply to
meet the fixed requirement) and do not change based on the market clearing.
This same dynamic occurred in the actual PJM capacity auction (DY 2021/22). Figure 6
shows that the reliability requirement (i.e., fixed requirement) for the RTO was 157,074 MW
(black line), but the market cleared 163,627 MW of UCAP (intersection of the red and blue
lines).110 This reflects an increase of 6,553 MW (or 4.2%) in purchased capacity above the
fixed reliability requirement. When the FRR is elected, the UCAP obligation is based on the
reliability requirement, not the VRR curve, and therefore is lower.
Figure 6. RTO Capacity Auction DY 2021/22 Clearing (with Load Forecast and Reliability
Required added for context)
Source: https://www.pjm.com/-/media/markets-ops/rpm/rpm-auction-info/2021-2022/2021-2022-bra-supply-curves.ashx.
PJM Capacity Clearing Prices are Lower when the FRR is Elected
Figure 7 builds on the prior example in Figure 5, but now shows an adjusted VRR curve with
50 MW of load electing the FRR (54-MW FRR UCAP obligation based on 50-MW load and the
UCAP reserve margin of 8.9%). The clearing results are nearly identical when assuming that
the same combined set of resources is meeting the VRR UCAP obligation and FRR UCAP
obligation. The difference in the clearing price is attributable to the VRR curve being
formulated based on a percentage of the reliability requirement (and not being adjusted for
the 54 MW of FRR UCAP obligation). Consequently, when the FRR is elected the curve does
not shift by 54 MW, but rather a slightly greater value (demand is reduced more than
supply), thus the slightly lower price under the example when the FRR is elected.
110 These values are adjusted for the energy efficiency being added back into the reliability requirement.

Resource Adequacy Constructs in Organized Wholesale Markets
EXETER ASSOCIATES, INC. Page | 60
Figure 7. VRR and FRR Capacity Clearing with Economic Resources
Continuing the same example from Figure 7, but now assuming that the entire FRR UCAP
obligation of 54 MW is met from resources that did not clear (i.e., uneconomic or MOPRed-
out) in the PJM capacity auction, the following example scenario in Figure 8 results in a very
different outcome. Since there is no shift in the supply curve, but a reduction in demand, a
lower PJM capacity clearing price is produced.
Figure 8. VRR and FRR Capacity Clearing with Uneconomic (or MOPRed-out) Resources
$128.60
$127.58
$60
$80
$100
$120
$140
$160
$180
$200
0 100 200 300 400 500 600 700 800
/MW-day
MW
VRR Curve w/o FRR Supply w/o FRR VRR Curve /FRR Supply w/FRR
$128.60
…
$-
$50
$100
$150
$200
$250
$300
0 100 200 300 400 500 600 700 800
/MW-day
MW
VRR Curve w/o FRR Supply w/o FRR VRR Curve /FRR Supply w/FRR

Resource Adequacy Constructs in Organized Wholesale Markets
EXETER ASSOCIATES, INC. Page | 61
This outcome demonstrates the impact to the PJM capacity market prices of resources that
are not clearing in the PJM capacity market to meet the FRR UCAP obligation. Table 4
provides a comparison of the three scenarios presented in Figure 5, Figure 7, and Figure 8.
Table 4. FRR and VRR Capacity Clearing Results with MOPR
Scenario
Cleared Capacity (MW)
Clearing Price ($/MW-day)
VRR (with MOPR) 571 MW $128.22
FRR (using economic resources)
570 MW (516 VRR MW +54 FRR MW)
$127.58
FRR (using uneconomic resources)
569 MW (515 VRR MW + 54 FRR MW)
$113.19
MOPRed-out Resources Meeting FRR Capacity Requirements Lowers PJM
Capacity Prices
Increased capacity prices are another concerning issue from a consumer perspective of the
MOPR. Resultant higher capacity prices are paid to all resources in the market, resulting in
incremental costs, depending on the quantity of MOPRed-out resources that are not able to
be price-takers.
Continuing the examples from Figure 5, Figure 7, and Figure 8, but now focusing on the
clearing outcomes with and without the MOPR in place, Figure 9 provides a useful
comparison to market outcomes when the FRR is, or is not, elected. Similar to the prior
examples where the FRR UCAP obligation was 54 MW, this example assumes 54 MW of
MOPRed-out resources are in the supply curve as price-takers in the “Supply w/o MOPR”
case.
Figure 9. VRR Capacity Clearing with and without the MOPR
$113.74
$128.60
$60
$80
$100
$120
$140
$160
$180
$200
0 100 200 300 400 500 600 700 800
/MW-day
MW
Supply /MOPR Supply w/o MOPR VRR Curve

Resource Adequacy Constructs in Organized Wholesale Markets
EXETER ASSOCIATES, INC. Page | 62
Table 5, which expands on Table 4 to include the VRR clearing without the MOPR, shows
how the PJM capacity market clears with and without the MOPR and how the election of the
FRR produces similar outcomes.
Table 5. FRR and VRR Capacity Clearing Results with and without
MOPR
Scenario
Cleared Capacity (MW)
Clearing Price ($/MW-day)
VRR (w/MOPR) 572 MW $128.60
FRR (using economic resources)
569 MW (515 VRR MW + 54 FRR MW)
$127.58
VRR (w/o MOPR) 573 MW $113.74
FRR (using MOPRed-out
resources)
570 MW
(516 VRR MW + 54 FRR MW) $113.19
When the FRR is elected, this allows MOPRed-out resources to provide capacity. Allowing
resources that otherwise did not clear in the PJM capacity market to provide capacity,
whether in the PJM capacity market or through an FRR procurement mechanism, changes
the balance between supply and demand. When the supply increase is greater than the
reduction in demand, the net effect of the FRR is that the PJM capacity clearing prices are
reduced as though the MOPRed-out resources did clear in the PJM capacity market.
FRR consumers may not directly benefit from a reduction in PJM capacity market prices (as
the consumers that remained in the PJM capacity market do) from the election of the FRR.
However, the lower prices in the PJM capacity market over time should be reflected in the
prices for capacity under an FRR procurement mechanism (described below), thereby
allowing consumers under an FRR to indirectly benefit from changes to the PJM capacity
clearing prices. The reduction in the PJM capacity market prices would occur over time as a
function of both the number of entities electing the FRR and the amount of MOPRed-out
resources meeting FRR UCAP obligations.
The reduction in the amount of capacity that would be procured, combined with the
potential for a lower cost to contract for capacity under the FRR, is the financial driver for
electing the FRR.
Flexible, Competitive Capacity Procurement Mechanism
An FRR capacity procurement mechanism, if properly designed, should generally elicit offers
to provide capacity that are generally in line with suppliers’ expectations of PJM capacity
prices (i.e., the alternative to not providing capacity to the location of the resource) for at
least the portion of the FRR UCAP obligation not associated with MIRR. Achieving this
expected outcome would result in a lower cost for the FRR option (as opposed to the
counterfactual of staying in the PJM capacity market) when also accounting for the benefits
associated with the lower FRR UCAP obligation and the ability to use MOPRed-out resources
to meet the FRR capacity requirements (which would reduce the expected capacity cost).

Resource Adequacy Constructs in Organized Wholesale Markets
EXETER ASSOCIATES, INC. Page | 63
However, a properly designed capacity procurement mechanism has the potential itself to
further lower costs and should provide more stable costs associated with the procurement of
capacity. The FRR is not constrained by PJM’s “one-year, marginal clearing price”
construct,111 and therefore provides greater flexibility with how arrangements are made with
capacity suppliers than what is available through the PJM capacity market.
The PJM capacity market only provides a one-year commitment for previously cleared
resources and a three-year commitment for certain new resources meeting a reliability
need, and can be volatile from auction to auction. An FRR capacity procurement construct
does not require all entities to be paid the same price (even though there may be benefits in
using this type of approach), therefore providing the potential for additional costs
reductions.
Under the FRR, contract options include:
▪ Multi-year contracts (required for the first five years) which may provide for more
stable rates and greater revenue certainty to suppliers (potentially allowing them to
trade off reduced volatility with lower cost).
▪ Laddered contracts (after the initial five-year period) would allow different durations
and procurement timing that stagger rates to reflect changing market conditions,
therefore providing more rate stability.
▪ Pay-as-bid contracts do not require all parties to be paid the same price, which can
reduce costs.
Market Power Has the Potential to be a Challenge under the FRR
The FRR construct has no specific market power protections (which are really a function of
MIRR as opposed to the FRR UCAP obligation) besides the high penalty price (e.g., two
times CONE) assessed to an FRR entity for not meeting the FRR capacity requirements. This
provides little market power protections and highlights one of the biggest challenges with a
capacity demonstration approach to resource adequacy: how to manage market power
through a bilateral market construct that does not have specific rules approved by the FERC
or a state regulatory agency (e.g., cost of service) to govern resource participation. This is
further complicated by the suppliers’ option to choose to sell into the PJM capacity market
and not meet the MIRR for an FRR entity. The ability of these suppliers to exercise power
through physical withholding, but still get paid the market price in PJM, may create a
challenging environment for an FRR entity to contract for capacity to meet the MIRR.
MOPRed-out Resources may be Limited in Meeting FRR Requirements
While one of the big concerns with the MOPR is that consumers are buying the same
capacity twice (and thus paying twice), the potential double-procurement of capacity is a
function of the amount of eligible capacity available from MOPRed-out resources. Many
111 Certain resources that are required for reliability can receive up to a three-year obligation. Source: PJM, Manual
18: PJM Capacity Market, Section 5.4.3 New Entry Pricing Adjustment, pp. 118-120.

Resource Adequacy Constructs in Organized Wholesale Markets
EXETER ASSOCIATES, INC. Page | 64
MOPRed-out resources are only eligible to provide a relatively small percentage of their
overall ICAP to meet the FRR capacity requirements, even though they may be providing
significant energy to meet other state requirements.
Resources with the potential to be MOPRed out generally have a relatively low UCAP value
as compared to their ICAP.112
▪ For the variable resource types of solar, onshore wind, and offshore wind, their UCAP
is calculated using 42%, 14.7%, and 26%, respectively, of their ICAP.
▪ For limited energy storage resources, their UCAP is derated depending on the
duration of the storage.
▪ Nuclear and coal resources are not generally limited to the same degree as other
potentially MOPRed-out resources since they have their UCAP established based on
their ICAP and an EFORd (class average EFORd for nuclear is 1.301% and coal is
12.145%).
Many of these values could decline further in the future with the application of an ELCC
approach, which may further limit the benefits associated with electing the FRR as the
quantity of MOPRed-out resources declines.113
Table 6 uses information from PJM’s MOPR filing to demonstrate the UCAP value of various
proxy resource types as compared to their ICAP.
Table 6. Example UCAP for Potential MOPRed-out Resources
Resource Type
Installed
Capacity (MW)
Adjustment Factor
Unforced
Capacity (MW)
Reduction (MW)
Onshore Wind 50 15% 7 43
Offshore Wind 400 26% 104 296
Solar 150 42% 63 87
Nuclear 2,156 99% 2,128 28
Coal 650 88% 571 79
Battery Storage 50 MW / 200 MWh N/A 33[1] 17
[1] PJM recently filed an approach to value storage of different durations. This is currently pending before the FERC.
Performance risk adds another element of complexity to how much capacity can be counted
upon from various resource types. The FRR entity could pass along non-performance risk to
individual suppliers, but this could increase the cost of acquiring resources, especially if
different suppliers exhibited concern about their ability to perform when needed. It could be
112 PJM, 2019 PJM Reserve Requirement Study, October 8, 2019, p. 29.
113 At this time, it is unclear how many resources may be limited in their clearing because of the MOPR. If many resources that were believed to be MOPRed out are able to clear in the capacity market due to the resource-specific exemption, then this also reduces the benefits associated with electing the FRR.

Resource Adequacy Constructs in Organized Wholesale Markets
EXETER ASSOCIATES, INC. Page | 65
cheaper to acquire capacity from other resources (not MOPRed out) that have a higher
performance expectation. Non-performance costs could also be passed through to
consumers (through direct allocation of penalties or through increased FRR UCAP obligations
in future periods). The trade-off of performance-related costs and how much certain
resources are counted upon would need to be reviewed carefully.
New Infrastructure May be Required to Meet MIRRs
Under the FRR, the need for new infrastructure should be fairly limited because of the ability
to contract with resources located both in and out of a state, including new projects that
cleared in prior years. However, there does remain the potential that new transmission or
generation projects (or demand response or energy efficiency) could be required to address
shortfalls in the MIRRs or to most cost-effectively meet the MIRRs. If new infrastructure is
required, some level of longer-term planning is likely needed to determine what
investments are necessary and when these investments should be made. This form of
planning would avoid the state becoming dependent on PJM to develop transmission
solutions to local problems (assuming other options are cost-effective) as well as potentially
limit the potential for worsened market power issues.
Any new infrastructure projects are likely going to result in longer-term arrangements.
Under the FRR, the risk associated with these longer-term arrangements becoming
uneconomic is most likely placed on consumers.

Resource Adequacy Constructs in Organized Wholesale Markets
EXETER ASSOCIATES, INC. Page | 66
APPENDIX B – OTHER REGION’S RESOURCE ADEQUACY
CONSTRUCTS
Energy-Only
The most prominent and oft-cited example of a market that relies on scarcity pricing and an
ORDC for resource adequacy is ERCOT.114 The ORDC is set equal to an administratively
determined VOLL relative to the loss of load probability (LOLP) at various quantities of
reserves. This construct assumes that ERCOT will shed load to maintain a minimum amount
of reserves (i.e., 100% LOLP). The VOLL, currently set at $9,000/MWh by the Public Utility
Commission of Texas (PUCT), represents how, on average, consumers value the first
megawatt-hour of electricity lost due to load shedding.115 Unlike the implementation of
energy and reserves in real-time in most ISOs/RTOs, ERCOT does not co-optimize these
products.116
In most circumstances, the market clearing price in ERCOT reflects short-run marginal costs
to meet the EAS requirements. As the quantity of available reserves decreases, however,
energy market prices can rise to as high as $9,000/MWh. This reflects the fact that, as
reserve levels decrease, the LOLP increases, thereby increasing the incremental value of
additional reserves.
The scarcity pricing and ORDC construct allows suppliers to recover both their variable and
fixed costs through EAS payments (inframarginal and scarcity rents) for their resources).
Expectations of shortages at sufficient frequency and/or duration create a long-term signal
of a need for additional supply to enter the market, motivate customers and suppliers to
enter contracts to lock in prices (which, in turn, encourages financing of investments in new
supply), and support financing of demand management capabilities. These prices also
create strong, short-term incentives for generators to maximize output (e.g., shift outages
to low-risk periods) and for demand to reduce consumption.117
The available reserve margin in ERCOT fluctuates each year based on customer and supplier
decisions in response to the forward expectation of ERCOT’s market prices. ERCOT’s Board
of Directors established a reserve margin target of 13.75% of peak demand in October 2016
114 ERCOT is often referred to as an “energy-only” market insofar as it does not have a formal capacity construct
(discussed below) in place to support long-term resource adequacy on a forward basis.
115 The PUCT directed ERCOT to set the VOLL at $9,000 in 2013 (Source: http://www.puc.texas.gov/agency/rulesnlaws/subrules/electric/25.505/25.505.pdf). The PUCT updated the ORDC construct in January 2019 (fully effective March 2020) to cause prices to rise faster during shortages (Source: http://www.ercot.com/mktrules/issues/OBDRR011).
116 There are ongoing discussions on this topic. Source: http://www.ercot.com/mktrules/puctDirectives/rtCoOptimization.
117 Participants manage variable market outcomes in a variety of ways. Sellers can hedge using their own generation, bilateral contracts, positions in day-ahead markets, etc. Buyers can also take positions in day-ahead markets, enter long-term contracts, utilize demand response, develop BTM generation, etc.

Resource Adequacy Constructs in Organized Wholesale Markets
EXETER ASSOCIATES, INC. Page | 67
but does not enforce the target through any mandatory procurement requirements.118
According to its market monitor’s 2019 State of the Market Report, ERCOT’s planning
reserve margin was 8.6% in 2019 and 12.6% in 2020.119
Supplier commitments in ERCOT are only financially binding on a market basis. Most
services are transacted through bilateral contracts. The prices of these contracts are
effectively driven by expectations of spot markets (EAS prices), which are also used to
settle differences. Forward hedges can create similar performance incentives and
investment signals to bolster resource adequacy as the incentives and signals from capacity
markets.
High scarcity prices raise the risk that the marginal generator could exercise market power
and unduly inflate costs through actions like physical withholding. ERCOT, like most
ISOs/RTOs, relies on a market monitor to ensure all suppliers participate in the market as
expected.120
A report issued by Dr. William Hogan in May 2017 provides a much more detailed discussion
on the ERCOT energy-only market construct.121
Capacity Markets
NYISO, PJM, and ISO-NE all have mandatory capacity markets.122 Mandatory capacity
markets target specific planning reserve margins to ensure that there are adequate
resources expected to serve load.
In NYISO, PJM, and ISO-NE, the ISO/RTO establishes load and generator requirements and
capacity contributions of different types of supply. PJM and ISO-NE set their own resource
adequacy requirements. NYISO, which is contiguous with the New York State, defers to
state regulators for the system requirement, but still establishes local requirements. In all
three regions, a loss of load expectation (LOLE) study forms the basis for resource adequacy
requirements.
All three regions establish eligibility and qualification rules for different types of supply (and
demand reductions). While these practices attempt to achieve a similar objective, they differ
from region to region. Further, regions buy different products; ISO-NE procures ICAP from
many conventional resources and then a capacity benefit product for variable energy
118 ERCOT undertakes various studies that support resource adequacy indirectly, including the Seasonal
Assessments of Resource Adequacy (determines forecasts of available reserves for each season); Planning Reserve Margin Analysis (estimates the economically optimal reserve margin and market equilibrium reserve margin); and Capacity, Demand and Reserves Report (forecasts summer/winter peak demand and expected generation over multiple years).
119 Potomac Economics, 2019 State of the Market Report for the ERCOT Electricity Markets, May 2020.
120 Market power mitigation, including an offer cap of $1,500/MWh, only applies to self-commitment or reliability unit-commitment resources dispatched to address a grid constraint.
121 William W. Hogan, Priorities for the Evolution of an Energy-Only Electricity Market Design in ERCOT, 2017.
122 MISO is similar to SPP and CAISO in that it requires LSEs to demonstrate compliance with requirements. However, MISO also offers a voluntary residual capacity market construct to acquire any residual requirement not procured ahead of the auction.

Resource Adequacy Constructs in Organized Wholesale Markets
EXETER ASSOCIATES, INC. Page | 68
resources. NYISO and PJM procure UCAP and then a capacity benefit value as a proxy for
UCAP for variable and limited energy resources.
PJM and ISO-NE both run a market three years ahead for an annual delivery period,123 while
NYISO runs seasonal auctions one month ahead of each seasonal period.124 Most merchant
development in markets occurs based on expectations of future capacity and EAS prices.
Thus, while the three-year forward construct provides more lead time for markets to
respond (especially around retirements, thereby smoothing exit and entry decisions), both
constructs provide price signals to the market and promote investment. Running the
auctions closer to the delivery period should allow for a more accurate load forecast of
system conditions, but also counters some benefits of the forward price signal.
The demand curve in all three of these markets starts at the estimated CONE (sometimes
subject to a multiplier). This value usually applies to all supply procurement up to the
planning reserve margin. Thereafter, the curve moves downwards at a slope that depends
on things like LOLE. The curve usually ends either where it reaches zero (for more linear
curves) or at a designated truncation point (near zero).
All of the demand curves are relatively steep and use the reliability requirement/ICAP
requirement and CONE/net CONE (established locationally as in PJM and NYISO or just for
the system as in ISO-NE). There are both system and local curves in all regions where some
regions have import-constrained locations and other include both import- and export-
constrained locations. Generally, these curves were established through analysis and a
stakeholder process. However, ISO-NE employs a marginal reliability impact set of demand
curves which reflects a departure from how the demand curves were established in PJM and
NYISO historically.
ISO-NE, NYISO, and PJM use various penalty constructs and requirements (e.g., must offer
into the day-ahead markets) to achieve the desired performance. These include specific
penalties for resources that cannot demonstrate they can provide their capacity, reductions
in the quantity eligible to be sold based on an EFORd, and specific performance penalties
when suppliers do not perform during times of system need. The structures of each
ISO/RTO are fairly complicated and continue to evolve over time in an effort to incent
appropriate behavior.
Market power concerns are a prominent issue for capacity markets, especially in constrained
areas; suppliers can exercise both individual and portfolio market power where the latter is
often much more difficult to mitigate. To address this issue, capacity markets include
specific supplier-side mitigation measures such as offer caps that require the market
123 The three-year forward period was structured specifically to allow natural gas plants to acquire financing and
proceed through siting and construction, effectively allowing the market to manage entry and exit more smoothly. For projects with shorter development windows, the timing can be more challenging but the market allows for projects that do not take years to develop to take on obligations in earlier periods (even though this may be at a significant discount).
124 The resource adequacy requirement and demand curve are the same for each season, even though the reliability value of incremental capacity differs by month and season. Shifting to monthly constructs creates numerous challenges with how the sum of all of the monthly demand curves would equal a seasonal (or annual) demand curve.

Resource Adequacy Constructs in Organized Wholesale Markets
EXETER ASSOCIATES, INC. Page | 69
monitor to review offers if costs exceed specific thresholds. Further, the inclusion of the
demand curve is an important component of market power protection (as compared to a
fixed requirement approach) insofar as demand decreases at increased price levels. Further,
efforts to be more inclusive on the supply side (including supply and demand reduction) of
the market and lower barriers for entry of new technologies increase competition, therefore
also mitigating market power.
All of these markets also include buyer-side market power protections which have been
discussed at length in the main body of the report. While the NYISO and PJM constructs are
very similar, the ISO-NE construct allows more out-of-market revenues to be included in its
calculation of default MOPR prices.
Capacity Demonstration
SPP and CAISO require some form of capacity demonstration for resource adequacy
purposes. In California, CAISO, the California Energy Commission (CEC), and the California
Public Utilities Commission (CPUC) jointly administer resource adequacy programs. SPP,
meanwhile, relies on states to oversee resource adequacy planning for the RTO’s member
utilities, most of which are vertically integrated utilities.125
While neither of these regions procures capacity through a market, there is still an
established reliability requirement that each region targets. The basis of SPP’s RTO-wide
planning reserve margin is a biannual LOLE study.126,127 The study uses forward planning
years with historical estimates of the forced outage rate for most resource types. For wind,
a method similar to ELCC is applied. The resource adequacy requirement is established
based on a 1-day-in-10-years standard versus the 1-event-in-10-years standard used in
many other ISOs/RTOs. The current resulting planning reserve margin based on this
standard is 12%.128
In CAISO, the CPUC oversees an umbrella IRP process. This biannual proceeding looks
forward ten years to assess the availability of three separate types of capacity: system,
local, and flexible (defined below). CPUC Staff evaluate the systemwide resource stack using
technology-specific net qualifying capacity multipliers for most resources and ELCC
calculations for wind and solar. CAISO’s planning reserve margin is based on a 1-in-10 LOLE
forecast which the CPUC defines as one firm load curtailment event due to resource
125 Public power utilities and electric cooperatives also participate in SPP and manage their own reliability
requirements subject to state regulation.
126 In August 2018, the FERC approved new SPP resource requirements intended to assure sufficient resource availability to meet the reliability needs of the broader SPP balancing authority area. Previously, SPP’s resource adequacy assurance efforts only applied to load-serving members. The new tariff applies to non-member LSEs, transmission customers, etc. and covers all balancing area load.
127 SPP, 2019 SPP Loss of Load Expectation Study Report, June 29, 2020.
128 For LSEs meeting their resource adequacy requirement with a majority (75% +) of hydro-based generation, SPP applies a reduced reserve margin of 9.89% reflecting the lower EFORd associated with hydropower.

Resource Adequacy Constructs in Organized Wholesale Markets
EXETER ASSOCIATES, INC. Page | 70
inadequacy (i.e., insufficient generation capacity to serve load or hold critical operating
reserves) every ten years. The current planning reserve margin is 15-17%.129
Both CAISO and SPP maintain detailed requirements on how much capacity can be provided
by supply and demand reduction resources. Separate standards apply for different types of
qualifying deliverable capacity, including registration of demand response program capacity,
BTM generation, bilateral contracts, and other sources of firm power. Both regions also use
an ELCC approach for certain variable and limited energy resources. This registration and
qualification process is performed annually in both markets, as well as monthly in CAISO.
These provisions are similar to what is done to qualify supply and demand to participate in
capacity markets.
The procurement obligation for each LSE in SPP is equal to forecasted load plus the planning
reserve margin. LSE’s that fail to demonstrate sufficient capacity in SPP are subject to a
deficiency payment equal to the amount of the deficient capacity multiplied by the CONE
and a penalty factor. The current CONE is $85.61/kW-year. This penalty factor increases as
total SPP Balancing Authority Area Planning Reserve levels decrease.130 Deficiency payments
are distributed to LSEs with excess capacity on a pro rata basis.
The determination of obligations in CAISO is more involved, primarily due to California
resource preferences (e.g., high renewable energy targets) that create additional system
demands.
▪ First, CAISO procures system resource capacity based on forecasted system-level
peak demand. The quantity of forecasted load is based on a 1-in-2-year (50/50)
peak demand forecast plus the planning reserve margin. LSEs file annual and
monthly system capacity plans with CAISO. In the annual plan, LSEs must
demonstrate procurement of at least 90% of their forthcoming summer obligation.
For monthly filings, they must demonstrate 100% procurement.
▪ Second, CAISO procures local resource capacity to address local reliability needs.
These requirements are determined through local capacity technical studies
performed by CAISO each year. The primary assessment standard employed by
CAISO is a 1-in-10-year (90/10) forecast combined with an evaluation of N-1-1
contingencies. In the annual demonstration for this requirement, CPUC-jurisdictional
LSEs must demonstrate 100% procurement for each month of the compliance
year.131
▪ Finally, CAISO recently began procuring flexible resource capacity based on ramping
needs. Each LSE’s requirement is, again, determined by an annual study performed
129 In addition to capacity, California’s IRP process assesses a planned minimum level of operating reserves of
4.5%—the level at which rotating outages begin. This requirement is in addition to the reserve margin and results in additional capacity.
130 The penalty factor, which is referred to as the “CONE FACTOR” in SPP’s tariff, equals 125% when the actual SPP reserve margin is greater than or equal to the planning reserve margin, plus 8%; 150% when greater than or equal to the Planning Reserve Margin (PRM), plus 3-8%; and 200% when less than the (PRM), plus 3%.
131 CAISO uses a hybrid central buyer for local resource adequacy capacity needs. Each LSE procures its own local resources, which they can sell to a central entity, voluntarily show as meeting system/flexibility needs (thereby offsetting the central entity requirements), or use the resource without reporting it.

Resource Adequacy Constructs in Organized Wholesale Markets
EXETER ASSOCIATES, INC. Page | 71
by CAISO that identifies a minimum capacity needed. The flexible ramping product
procures capacity capable of helping manage real-time balancing—an inherent need
of systems with a high penetration of variable energy resources. Monthly
requirements are based on the forecasted maximum three-hour net load ramp.132
Each of CAISO’s capacity requirements is assigned to LSEs proportionate to load served
(i.e., simple load share allocation). LSEs that do not procure adequate capacity are subject
to a charge.133 These charges for 2020 were $6.66/kW-month for system capacity,
$4.25/kW-month for local capacity and $3.33/kW-month for flexible capacity.134 In addition,
if CAISO identifies an unserved capacity need, it uses a back-stop Capacity Procurement
Mechanism (CPM). Under the CPM, CAISO directs an IOU to procure capacity on LSEs’
behalf and then allocate the costs to these LSEs. Resource owners can voluntarily submit
bids into the competitive CPM solicitation process. CPM compensation to suppliers is based
on the solicitation clearing price up to the soft offer cap. Over this offer cap, resources can
bid on a formula basis that is based on going-forward costs, plus an adder. The soft offer
cap is currently $76/kW-year, which is representative of the going-forward costs of a large
combined cycle resource.
Both SPP and CAISO allow participation by merchant suppliers. However, most resource
capacity is still procured or owned by IOUs. This includes over two-thirds of CAISO capacity
and over half of SPP capacity in 2019.135,136
Resources committed in CAISO’s system resource capacity process are subject to bidding
and scheduling obligations. That is, capacity resources must participate in day-ahead and
real-time markets. These commitments are intended to prevent the exercise of market
power. CAISO also maintains a resource adequacy availability incentive mechanism
(RAAIM). This incentive penalizes resources that are not made available at least 94.5% of
the time. RAAIM penalty payments are subsequently redistributed to resources that are
available at least 98.5% of the time. CAISO calculates RAAIM penalties and payments based
on performance during a limited number of hours, typically during peak periods.
Resources committed in SPP for capacity are expected to bid into the day-ahead market as
well. SPP does not have any consequences for non-performance or incentives for improved
performance associated with capacity obligations. That is, there is no compensation for
increased availability beyond the requirement that LSEs offer sufficient resource capacity to
132 In SPP, LSEs are not compensated to procure capacity to cover uncertainties from things like variable
generation. According to its market monitor, SPP is considering standby reserve or ramping products to address this need. This would represent an additional ancillary service. In the absence of such a product (or other performance requirements), SPP relies on the incentive provided by state-sponsored cost recovery to encourage LSEs to make just and reasonable resource investments whenever and wherever prudent.
133 There is a waiver process for LSEs that attempted to acquire capacity in good faith, but were unable to. Source: CPUC, Waivers and Penalties.
134 This includes a smaller penalty if the shortfall is corrected within a limited time. Source: CPUC, 2020 Filing Guide for System, Local and Flexible Resource Adequacy (RA) Compliance Filings, October 17, 2019, p. 41.
135 CAISO, 2019 Annual Report on Market Issues & Performance, June 2020.
136 SPP Market Monitoring Unit, State of the Market 2019.

Resource Adequacy Constructs in Organized Wholesale Markets
EXETER ASSOCIATES, INC. Page | 72
cover their forecasted load and reserves. Likewise, capacity accreditation is not adjusted
based on availability except relative to system peak.
By largely ceding resource adequacy to state regulators, SPP and CAISO give primacy to
state preferences in resource adequacy decisions.

Resource Adequacy Constructs in Organized Wholesale Markets
EXETER ASSOCIATES, INC. Page | 73
APPENDIX C – CAPACITY PAY-FOR-PERFORMANCE AND
SHORTAGE PRICING
Recent pay-for-performance modifications put into place in several capacity markets are
largely intended to align capacity markets with shortage pricing principles found in an
energy-only market design. For the purpose of discussion, ISO-NE’s version of the pay-for-
performance design is used since it does not include exemptions and therefore allows for
direct comparison to shortage pricing. This section also contrasts the PJM and ISO-NE pay-
for-performance designs.
Under the pay-for-performance design in ISO-NE, a portion of the shortage price in the EAS
market is pulled out as a separate “spot price” of capacity during shortage events (i.e., spot
capacity value is zero except during periods of shortages). These shortage events
correspond to when the market is deficient in reserves and/or energy (i.e., when the EAS
market reflects scarcity in its prices as well). All resources providing reserves or energy
during the event are paid the spot price for capacity.137 If, rather than defining a separate
spot price for capacity, the price caps for EAS included this incremental value, the spot price
of energy and reserves would reflect an equivalent value (in full) when deficient in reserves
and energy.
The spot market outcomes are identical between these two approaches and thus the
marginal incentive for performance and delivery are the same. However, the way these
structures impact forward markets is very different.
▪ In a scarcity-pricing-only model, expectations of scarcity are reflected in energy
prices and forward energy contracts. Suppliers make decisions based on expectation
of scarcity, plan to ensure their resources can perform during scarcity events, and
reflect anticipated scarcity rents in the costs of the contracts they offer. In concept, if
suppliers cannot procure a contract that reflects the potential scarcity price, they
would rather go to the spot market to earn these rents. This construct enables
hedging of energy costs, but not necessarily ancillary service-related costs.
▪ Under pay-for-performance, the expectation of scarcity impacts the forward sale of
capacity. Capacity prices should reflect the balancing ratio-adjusted expectation of
scarcity (i.e., a supplier should not be willing to sell capacity below the level of
expected scarcity that it would forgo in the spot capacity market).138 In these cases,
the ISO/RTO is buying a hedge for all load against high EAS prices. However, the
nature of capacity markets which procure on demand curves often result in the
missing money driving the price of capacity and not potential for scarcity. This is a
function of the demand curves often supporting procurement at levels that minimize
the risk of any significant number of scarcity events (i.e., higher reserve margins)
137 This is where the PJM and ISO-NE designs are fundamentally different. PJM exempts certain resources from
penalties, so cannot compensate performing resources at the spot price for capacity and, rather, allocates leftover funds back to performing suppliers which is often at a different, lower rate.
138 The balancing ratio is calculated as the total EAS requirement, divided by the total obligated capacity.

Resource Adequacy Constructs in Organized Wholesale Markets
EXETER ASSOCIATES, INC. Page | 74
occurring, so results in what is perceived as minimal risk being reflected in capacity
offers and only a small risk premium to load.
In both cases, load is largely protected from the volatility of scarcity prices and pays to
reduce exposure to volatility through forward arrangements. However, under the capacity
market construct, load also gets protection related to cost allocation associated with
ancillary services (paid through capacity prices as well) and has no quantity risk.
▪ The scarcity pricing-only model allows load to contract through forward energy
arrangements relative to what it believes to be its future need. These contracts can
be for a fixed or variable quantity depending on the arrangement. Fixed-quantity
contracts place the risk on load if their consumption is greater (or less) than what is
expected. This is not an option under the capacity market construct, which buys
future scarcity coverage for all expected demand and also some level of ancillary
services. The balancing ratio approach places risk related to the quantity of the
forward sale used under pay-for-performance on suppliers.
▪ The capacity market construct includes stop-loss provisions that limit the total risk to
suppliers. The costs of the stop-loss provisions are socialized across suppliers. These
provisions do not directly impact costs to load but do provide limits on how much risk
suppliers can face in the forward sale (which could result in an incremental cost
being included in capacity offers if this perceived risk was large). This is not
necessarily true in the case of forward energy contracts (even though there are ways
for suppliers to manage this risk through other arrangements).
Since the capacity market offers more coverage, it is possible that it will also cost more
because it is not an option, but rather an insurance policy that is shared by all parties and
cannot be opted out of or avoided. Some LSEs may prefer to manage this risk on their own
because they believe they can procure capacity more cost-effectively than other LSEs
(thereby giving them a competitive advantage in the market).139 The self-supply construct
enables LSEs to achieve this to some degree, but LSEs are still required to meet a specific
capacity requirement which is generally not included in a scarcity-pricing-only construct.
In concept, the ISO-NE and PJM pay-for-performance constructs produce similar
performance incentives. However, the PJM approach includes exemptions for resources that
are not committed during emergencies or are on approved outages. This approach has the
greatest impact during transient scarcity conditions.140 Exemptions reduce performance
risks for more expensive and/or slow-starting resources that sell capacity products, while
other resources that are more flexible are more exposed to the risk of non-performing since
they are always measured. Thus, exemptions effectively transfer risk and impose higher
139 This is one of the challenges of a scarcity pricing-only construct; there is not necessarily a requirement to take
action to hedge future load (even though a requirement could be added). If, in a scarcity pricing-only construct, many LSEs make arrangements on a forward basis but 20% choose not to make forward arrangements, and the system has to shed load, this load shedding is likely to impact all customers, not just those who are not in forward energy arrangements.
140 During an inadequate supply shortage condition which generally can be seen ahead of time based on weather and load forecasts, it is expected that all resources are committed; however, exemptions for approved outages still create differences between the ISO-NE and PJM approach.

Resource Adequacy Constructs in Organized Wholesale Markets
EXETER ASSOCIATES, INC. Page | 75
risk-adjusted costs on more flexible resources to the disadvantage of these resources. This
is a good example of unintended outcomes and shows where the PJM approach diverges
from a shortage pricing approach where these resources that were not performing would
miss the opportunity and other resources would benefit. The exemptions result in different
marginal incentives for energy-only and capacity resources. Energy-only resources that
perform during an event may only receive a modest payment, where capacity resources are
effectively receiving the full performance rate (for their balancing ratio adjusted obligation).

Resource Adequacy Constructs in Organized Wholesale Markets
EXETER ASSOCIATES, INC. Page | 76
APPENDIX D – RELIABILITY AND COST TRADE-OFF
A simple, stylized example provides a useful illustration of the relationship between three
metrics: reliability requirements, resource performance, and reliability valuation. This also
highlights some of the challenges with the concept of a reserve margin.
▪ Scenario 1: A resource adequacy construct that does not value performance should
select the set of resources with the least amount of missing money. This construct
would account for the potential lack of resource performance by acquiring more
capacity. The willingness of load to pay for reliability does not limit new investment
or existing supply.
▪ Scenario 2: A different resource adequacy construct that places a high value on
resource performance would select the set of resources with the greatest possibly to
perform when needed relative to their missing money. The added level of
performance in this scenario comes at an incremental cost through either additional
investment by each resource or a reduction in the amount of capacity provided by
each resource (scaled to its performance expectations). Similar to Scenario 1, the
willingness of load to pay for reliability does not limit new investment or existing
supply.
If the least-cost set of resources acquired in Scenario 1 is expected to only be able to
perform 50% of a 100-MW peak load need, then the overall procurement would be doubled
to a 200-MW reliability requirement. The additional procurement may be at a low cost, but
the increase in quantity to meet the target reliability level could make this approach costly.
In Scenario 2, the reliability requirement equals the peak load forecast of 100 MW and the
expectation is that, because of the strong consequences for non-performance, suppliers will
manage the non-performance risk. Assuming suppliers do not make any investment, but
rather simply reduce the capacity provided by the 50% non-performance probability, then
Scenario 2 results in the same total amount of resources and cost as Scenario 1. Scenario 1
would acquire 200 MW based on the cost of the missing money reflected for the full
resource capability. Scenario 2 would acquire 100 MW also based on missing money;
however, at double the cost (since the missing money needs to be recovered over 50% less
capacity). The reserve margins in both of these examples are 100%, as both approaches
acquire 100 MW more than the 100-MW load forecast.
From a planning perspective, both scenarios achieve the same level of reliability at the
same total cost; however, each structure fundamentally assigns risk differently. In both
cases, if the resources perform at less than 50%, then reliability is worse—load could go
unserved in both cases. However, in Scenario 1, the risk is passed on to load through
increased reliability requirement in future periods (with accompanying costs to purchase
another resource). In Scenario 2, suppliers could conceptually be obligated to refund to load
based on their poor performance, resulting in load only paying for the reliability they
received.
From an investment perspective, the incentives are also very different. In Scenario 1, there
is little incentive for supplier investment aimed at improving performance (either by

Resource Adequacy Constructs in Organized Wholesale Markets
EXETER ASSOCIATES, INC. Page | 77
developing new, higher-performing resources or by improving the performance of existing
resources). Over time, this could result in worse performance and increased cost to load.
This is because improving performance would actually reduce the amount of capacity
required with no commensurate benefit to the suppliers. In Scenario 2, a preference for
performance incentivizes improvements that allow resources to provide more capacity and
begin to displace other, poorer-performing resources.
These two examples show bookend approaches for how to think about the trade-off
between performance managed on the supply side versus demand side. Most applications of
these concepts reflect a blend of both supplier-side performance incentives with
adjustments on the demand side, reflecting overall probabilistic performance risk.

Resource Adequacy Constructs in Organized Wholesale Markets
EXETER ASSOCIATES, INC. Page | 78
APPENDIX E – RESERVE MARGIN METRIC
Reserve margins can be measured many ways, even today. Altered assumptions and
decisions about ICAP versus UCAP, inclusion of energy-only resources/capability, summer
versus winter ratings, and the load forecast that forms the basis for the comparison can all
change the nature of the actual and planning reserve margin.
For example, most resource adequacy processes use a 50/50 probability load forecast,
meaning that there is a 50% chance that the actual peak load exceeds the forecasted value
in a given year.141 However, ISOs/RTOs develop other probability load forecasts such as a
90/10 forecast, which can be thought of as the forecast only being exceeded once every ten
years. The 50/50 forecast is lower than the 90/10 forecast (which usually reflects more
extreme weather conditions) and the actual reserve margin would be different if loads
appeared at the level of the 90/10 load forecast, rather than the 50/50 load forecast.
For example, PJM’s 50/50 peak load forecast used in the capacity market for DY 2021/22
was 137,890 MW, while PJM’s equivalent 90/10 peak load forecast was 145,749 MW.142 The
clearing in the capacity market for this period was 163,627 MW which, when compared to
the 50/50 peak load forecast used in the capacity market, results in a (UCAP) reserve
margin of 16.7%. By comparison, the cleared amount reflects a (UCAP) reserve margin of
8.4% compared to the equivalent 90/10 load forecast.143 This could be interpreted as
meaning that the system could only absorb an 8.4% outage rate (plus what is assumed in
the EFORd) in a year where loads appear in the 90/10 forecast range.
How reserve margins are determined and resource adequacy is handled raises important
going-forward considerations such as:
▪ What happens if winter and summer forecasted loads invert, or the 90/10 winter
peak load exceeds the summer 50/50 peak load? For what period should resources
be acquired (summer or winter rating)?
▪ What is the more sensible load forecast to use in calculating the reliability
requirements and actual reserve margin?
▪ If the 90/10 forecast is used with a one-event-per-year reliability standard, would
the total reliability requirement remain the same? (Likely not, based on the nature of
these analyses, but an interesting question nonetheless.)
▪ Should the actual reserve margin be based on the ICAP (or maximum eligible
capacity or provided capacity) of all resources as compared to peak load? Should it
be measured in the peak hour of the year based on what resources are actually
available?
141 Put another way, it is expected that, on average, the forecast will be exceeded once every two years.
142 The 90/10 load forecast was adjusted based on an estimate of the FRR associated forecasted load. Source: PJM Resource Adequacy Planning Department, PJM Load Forecast Report, January 2018.
143 PJM Summary of 2021/2022 Base Residual Auction Results; PJM 2021-2022 RPM Base Residual Auction Planning Parameters.

Resource Adequacy Constructs in Organized Wholesale Markets
EXETER ASSOCIATES, INC. Page | 79
▪ How do resources without capacity interconnection rights get counted in this
measurement, as these resources do help to mitigate non-performance of capacity
resources?
▪ Should the most constraining hour (if different than the peak hour) in the analysis be
used to calculate the reserve margin?
▪ How are planned outages handled in calculating a reserve margin if the true resource
adequacy risk is falling outside of peak periods?
This discussion is not intended to imply that changes are required to how reserve margins
or reliability requirements are calculated. Rather, the above questions provide perspective
on different ways these could be evaluated from a reliability perspective, and the differences
in outcomes depending on how the question is asked and answered.