resource allocation study - alexandriava.gov allocation...theme e: implementation strategies ... i....
TRANSCRIPT
RESOURCE ALLOCATION STUDYCITY OF ALEXANDRIA DEPARTMENT OF RECREATION, PARKS & CULTURAL ACTIVITIES
MAY 2019

Resource Allocation Study i
ACKNOWLEDGEMENTS
Mayor Mayor Justin M. Wilson
City Council
Vice Mayor Elizabeth B. Bennett-Parker Councilman Canek Aguirre
Councilman John Taylor Chapman Councilwoman Amy B. Jackson
Councilwoman Redella S. “Del” Pepper Councilman Mohamed E. “MO” Seifeldein
Park and Recreation Commission
Jennifer Atkins, Chair Gina Baum
Stephen Beggs Liz Birnbaum
Judith Coleman Abby Froemming Barbara Marvin
Robert Brian McPherson Conner Rex
Matthew Walsh
City Manager Mark B. Jinks
Department of Recreation, Parks and Cultural Activities
James B. Spengler, Director
The Core Team Laura Durham - Team Leader
James Spengler, Director Jack Browand
William Chesley Barbara Farrington
Kelly Gilfillen Faye Maslaki
Margaret Orlando Diane Ruggiero Dinesh Tiwari
ii Alexandria Department of Recreation, Parks and Cultural Activities
Consultant Team GreenPlay, LLC ePrepSolutions
For more information about this document, please contact:
City of Alexandria Department of Recreation, Parks & Cultural Activities
1108 Jefferson Street-Alexandria, VA 22314 Office: 703.746.5501
www.alexandriava.gov/Recreation
GreenPlay, LLC 1021 E. South Boulder Road, Suite N, Louisville, Colorado 80027, Telephone: 303-439-8369
Email: [email protected] www.greenplayllc.com
Resource Allocation Study iii
TABLE OF CONTENTS Executive Summary ............................................................................................................................. 1
Welcome to the Resource Allocation Study 2019 Update ....................................................................... 1 How Does this Update Evolve the Results of the Original Study? ............................................................ 1 The Study .................................................................................................................................................. 1 How Did We Undertake the Study Update? ............................................................................................. 2 The Updated Model for Alexandria .......................................................................................................... 2 What Did We Learn? ................................................................................................................................. 4 Key Findings .............................................................................................................................................. 4 Where Do We Go from Here? ................................................................................................................... 5 Theme A: Policy Strategies ........................................................................................................................ 5 Theme B: Administrative Strategies ......................................................................................................... 5 Theme C: Revenue Enhancement ............................................................................................................. 6 Theme D: Cost Savings/Avoidance............................................................................................................ 6 Theme E: Implementation Strategies ....................................................................................................... 7 Theme F: Evaluation and Performance Measures .................................................................................... 7 Conclusion ................................................................................................................................................. 8
I. Resource Allocation Study ................................................................................................................. 9 About the Study ........................................................................................................................................ 9
II. About Alexandria Recreation, Parks, and Cultural Activities ........................................................... 12 Our Mission and Goals ............................................................................................................................ 12 Our Responsibilities ................................................................................................................................ 12 How the Public Perceives Us ................................................................................................................... 14
III. Project Approach .......................................................................................................................... 17 Project Team ........................................................................................................................................... 17 Project Schedule ..................................................................................................................................... 17 Staff and Stakeholder Engagement ........................................................................................................ 18
IV. The City of Alexandria RPCA Resource Allocation Cost Recovery Pyramid Model .......................... 19 The Alexandria RPCA Service Offering .................................................................................................... 19 The City of Alexandria Pyramid Model ................................................................................................... 19 Current Cost Recovery ............................................................................................................................ 19 Implication of Cost Recovery Targets ..................................................................................................... 22
V. Key Findings ................................................................................................................................... 23 This Project is Building on a Solid Foundation ........................................................................................ 23 The Community Supports A Fee Program and Accessibility ................................................................... 23 Staff Promotes Social Equity ................................................................................................................... 24 Appropriate “Relationship” Eligibility Needs to be Clarified .................................................................. 24 Categories of Service Must be Well Defined and Understood ............................................................... 25 New Community Benefit Programs Undertaken Must be Assured of a Subsidy Allocation ................... 25 Accounting Challenges Can Be Overcome .............................................................................................. 25 Use of Fees and Charges Could be More Strategic ................................................................................. 26 …And it isn’t Only About Program and Service Fees............................................................................... 26 Effective Performance Measurements Translates to Sustainability and Equity ..................................... 30 Understanding and Communication Must be Timely ............................................................................. 30 Key Elements of Fiscal Resource Allocation and Cost Recovery Policy................................................... 31
iv Alexandria Department of Recreation, Parks and Cultural Activities
VI. Strategic Recommendations ......................................................................................................... 33 Theme A: Policy Strategies ...................................................................................................................... 33 Theme B: Administrative Strategies ....................................................................................................... 34 Theme C: Revenue Enhancement ........................................................................................................... 34 Theme D: Cost Savings/Avoidance.......................................................................................................... 35 Theme E: Implementation Strategies ..................................................................................................... 35 Theme F: Evaluation and Performance Measures .................................................................................. 36
VII. Conclusion ................................................................................................................................... 37
Appendix A: Glossary of Key Cost Recovery Terms ............................................................................. 39 Appendix B: The Pyramid Methodology ............................................................................................. 43 Appendix C: Philosophy, a Model, and a Policy .................................................................................. 49 Appendix D: Alexandria RPCA Categories of Service ........................................................................... 53 Appendix E: Developing a Pricing Strategy ......................................................................................... 57 Appendix F: Existing Financial Assistance Policy ................................................................................. 61 Appendix G: Resource Allocation and Cost Recovery Policy ............................................................... 64
TABLE OF TABLES
Table 2: Current Cost Recovery by Select Categories of Service ................................................................ 22
TABLE OF FIGURES
Figure 1: The Alexandria Parks and Community Service Pyramid Model ..................................................... 3 Figure 3: City of Alexandria Pyramid Model ............................................................................................... 21 Figure 2: Sustainability Elements ................................................................................................................ 51
Resource Allocation Study 1
EXECUTIVE SUMMARY
WELCOME TO THE RESOURCE ALLOCATION STUDY 2019 UPDATE
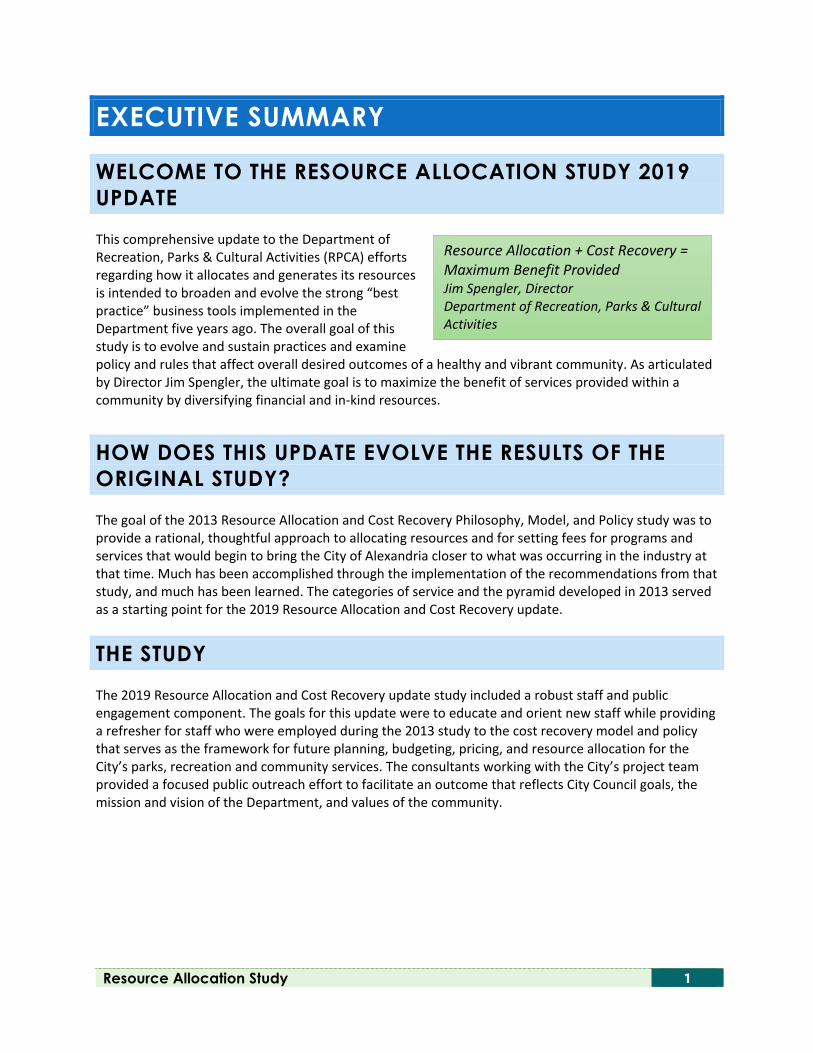
This comprehensive update to the Department of Recreation, Parks & Cultural Activities (RPCA) efforts regarding how it allocates and generates its resources is intended to broaden and evolve the strong “best practice” business tools implemented in the Department five years ago. The overall goal of this study is to evolve and sustain practices and examine policy and rules that affect overall desired outcomes of a healthy and vibrant community. As articulated by Director Jim Spengler, the ultimate goal is to maximize the benefit of services provided within a community by diversifying financial and in-kind resources.
HOW DOES THIS UPDATE EVOLVE THE RESULTS OF THE ORIGINAL STUDY?
The goal of the 2013 Resource Allocation and Cost Recovery Philosophy, Model, and Policy study was to provide a rational, thoughtful approach to allocating resources and for setting fees for programs and services that would begin to bring the City of Alexandria closer to what was occurring in the industry at that time. Much has been accomplished through the implementation of the recommendations from that study, and much has been learned. The categories of service and the pyramid developed in 2013 served as a starting point for the 2019 Resource Allocation and Cost Recovery update.
THE STUDY
The 2019 Resource Allocation and Cost Recovery update study included a robust staff and public engagement component. The goals for this update were to educate and orient new staff while providing a refresher for staff who were employed during the 2013 study to the cost recovery model and policy that serves as the framework for future planning, budgeting, pricing, and resource allocation for the City’s parks, recreation and community services. The consultants working with the City’s project team provided a focused public outreach effort to facilitate an outcome that reflects City Council goals, the mission and vision of the Department, and values of the community.
Resource Allocation + Cost Recovery = Maximum Benefit Provided Jim Spengler, Director Department of Recreation, Parks & Cultural Activities
2 Alexandria Department of Recreation, Parks and Cultural Activities
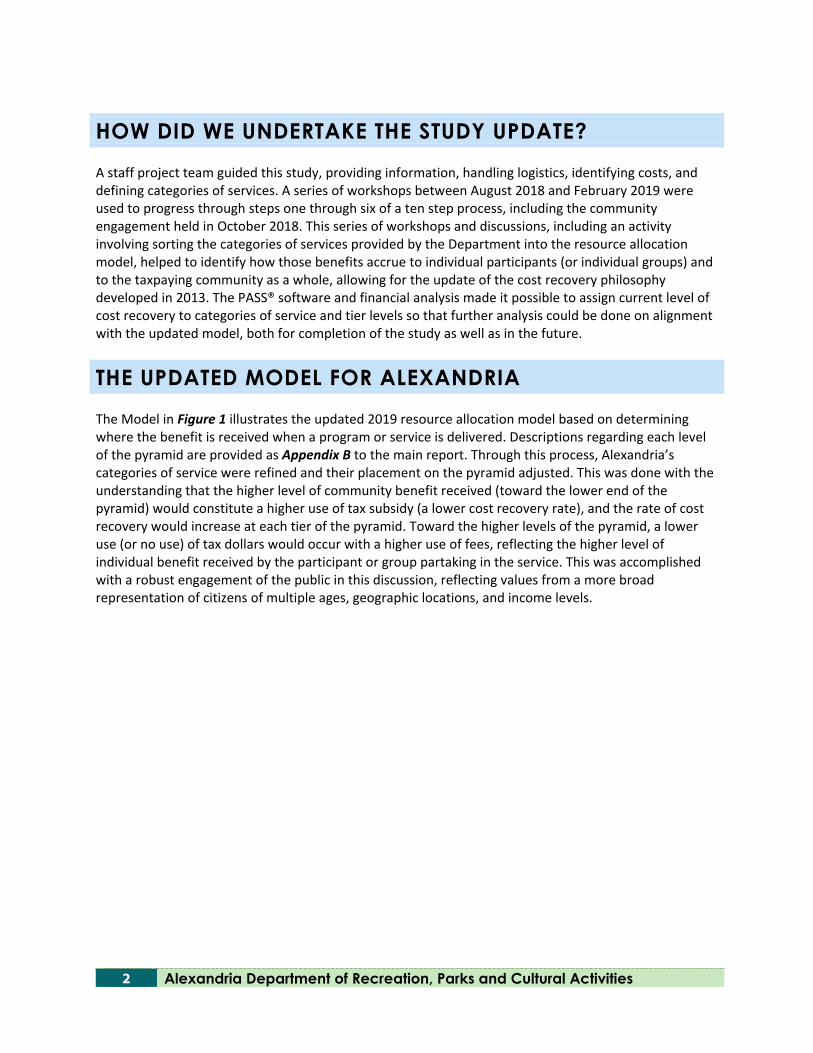
HOW DID WE UNDERTAKE THE STUDY UPDATE?
A staff project team guided this study, providing information, handling logistics, identifying costs, and defining categories of services. A series of workshops between August 2018 and February 2019 were used to progress through steps one through six of a ten step process, including the community engagement held in October 2018. This series of workshops and discussions, including an activity involving sorting the categories of services provided by the Department into the resource allocation model, helped to identify how those benefits accrue to individual participants (or individual groups) and to the taxpaying community as a whole, allowing for the update of the cost recovery philosophy developed in 2013. The PASS® software and financial analysis made it possible to assign current level of cost recovery to categories of service and tier levels so that further analysis could be done on alignment with the updated model, both for completion of the study as well as in the future.
THE UPDATED MODEL FOR ALEXANDRIA
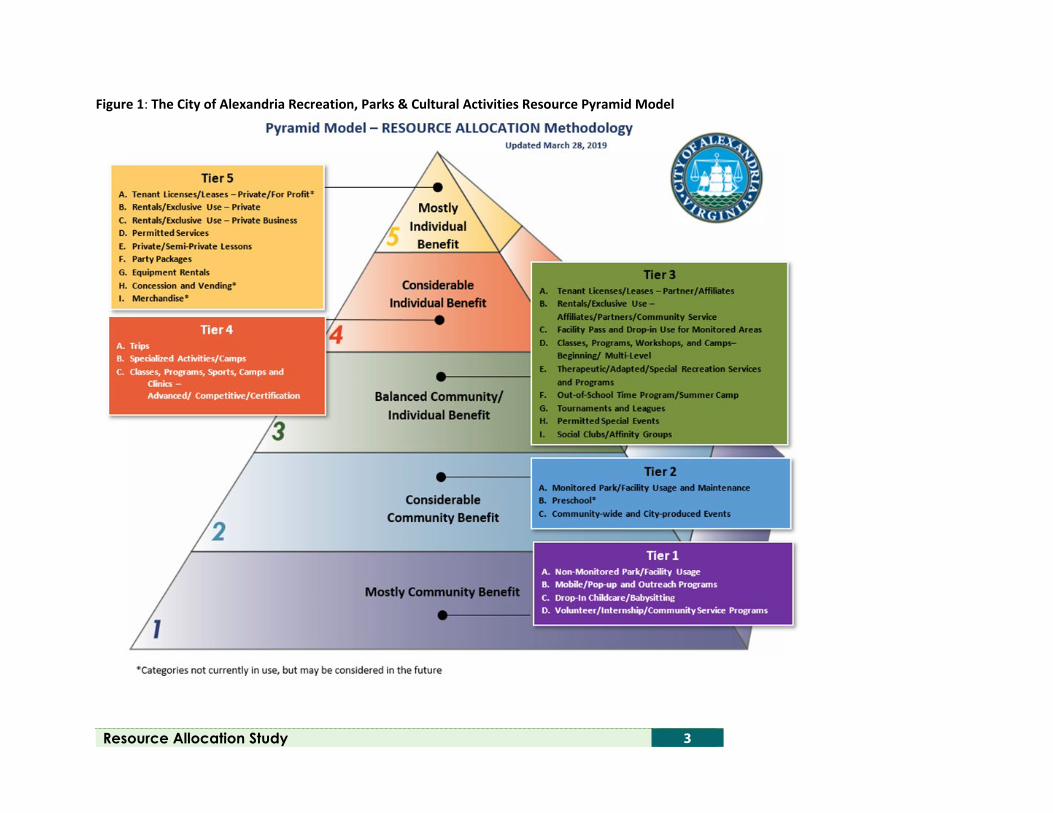
The Model in Figure 1 illustrates the updated 2019 resource allocation model based on determining where the benefit is received when a program or service is delivered. Descriptions regarding each level of the pyramid are provided as Appendix B to the main report. Through this process, Alexandria’s categories of service were refined and their placement on the pyramid adjusted. This was done with the understanding that the higher level of community benefit received (toward the lower end of the pyramid) would constitute a higher use of tax subsidy (a lower cost recovery rate), and the rate of cost recovery would increase at each tier of the pyramid. Toward the higher levels of the pyramid, a lower use (or no use) of tax dollars would occur with a higher use of fees, reflecting the higher level of individual benefit received by the participant or group partaking in the service. This was accomplished with a robust engagement of the public in this discussion, reflecting values from a more broad representation of citizens of multiple ages, geographic locations, and income levels.
Resource Allocation Study 3
Figure 1: The City of Alexandria Recreation, Parks & Cultural Activities Resource Pyramid Model
4 Alexandria Department of Recreation, Parks and Cultural Activities
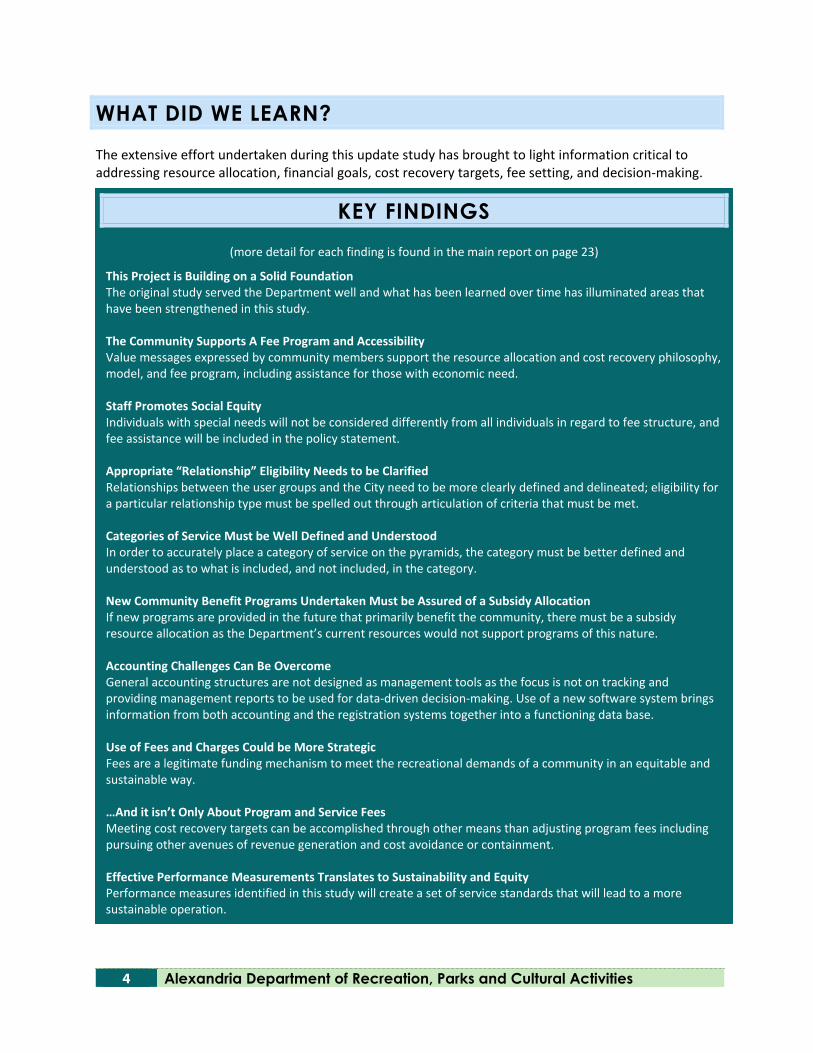
WHAT DID WE LEARN?
The extensive effort undertaken during this update study has brought to light information critical to addressing resource allocation, financial goals, cost recovery targets, fee setting, and decision-making.
KEY FINDINGS (more detail for each finding is found in the main report on page 23)
This Project is Building on a Solid Foundation The original study served the Department well and what has been learned over time has illuminated areas that have been strengthened in this study. The Community Supports A Fee Program and Accessibility Value messages expressed by community members support the resource allocation and cost recovery philosophy, model, and fee program, including assistance for those with economic need. Staff Promotes Social Equity Individuals with special needs will not be considered differently from all individuals in regard to fee structure, and fee assistance will be included in the policy statement. Appropriate “Relationship” Eligibility Needs to be Clarified Relationships between the user groups and the City need to be more clearly defined and delineated; eligibility for a particular relationship type must be spelled out through articulation of criteria that must be met. Categories of Service Must be Well Defined and Understood In order to accurately place a category of service on the pyramids, the category must be better defined and understood as to what is included, and not included, in the category. New Community Benefit Programs Undertaken Must be Assured of a Subsidy Allocation If new programs are provided in the future that primarily benefit the community, there must be a subsidy resource allocation as the Department’s current resources would not support programs of this nature. Accounting Challenges Can Be Overcome General accounting structures are not designed as management tools as the focus is not on tracking and providing management reports to be used for data-driven decision-making. Use of a new software system brings information from both accounting and the registration systems together into a functioning data base. Use of Fees and Charges Could be More Strategic Fees are a legitimate funding mechanism to meet the recreational demands of a community in an equitable and sustainable way. …And it isn’t Only About Program and Service Fees Meeting cost recovery targets can be accomplished through other means than adjusting program fees including pursuing other avenues of revenue generation and cost avoidance or containment. Effective Performance Measurements Translates to Sustainability and Equity Performance measures identified in this study will create a set of service standards that will lead to a more sustainable operation.
Resource Allocation Study 5
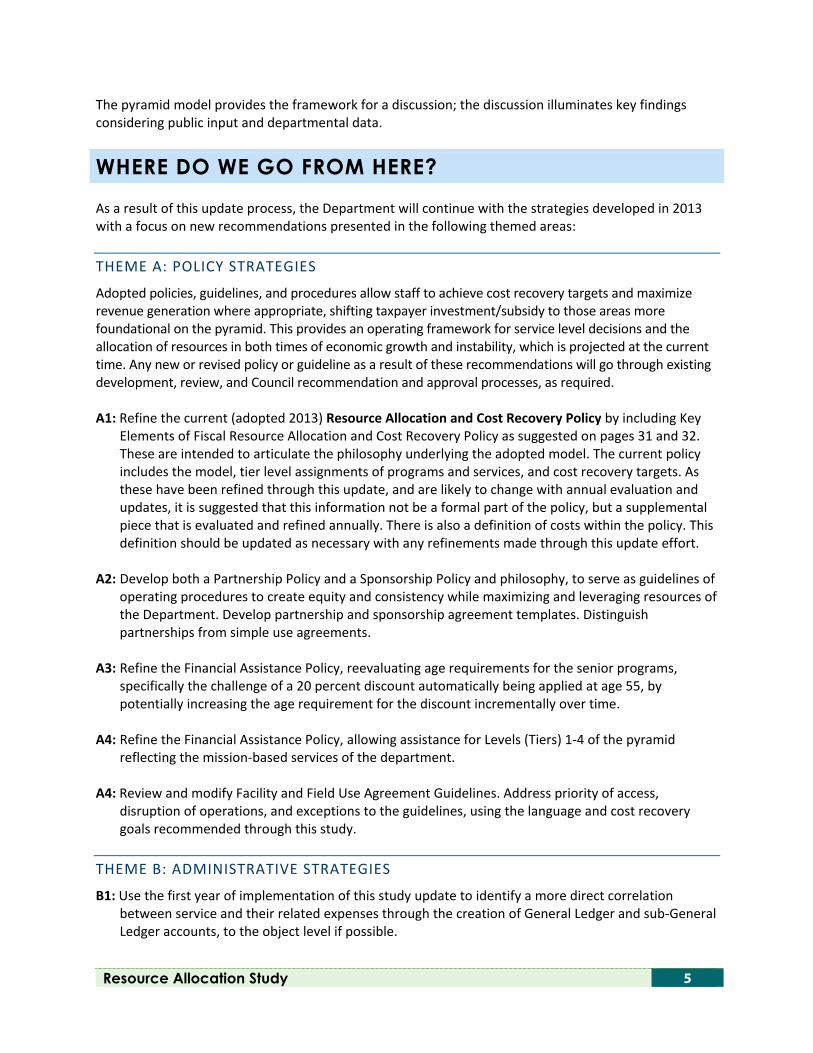
The pyramid model provides the framework for a discussion; the discussion illuminates key findings considering public input and departmental data.
WHERE DO WE GO FROM HERE?
As a result of this update process, the Department will continue with the strategies developed in 2013 with a focus on new recommendations presented in the following themed areas: THEME A: POLICY STRATEGIES
Adopted policies, guidelines, and procedures allow staff to achieve cost recovery targets and maximize revenue generation where appropriate, shifting taxpayer investment/subsidy to those areas more foundational on the pyramid. This provides an operating framework for service level decisions and the allocation of resources in both times of economic growth and instability, which is projected at the current time. Any new or revised policy or guideline as a result of these recommendations will go through existing development, review, and Council recommendation and approval processes, as required.
A1: Refine the current (adopted 2013) Resource Allocation and Cost Recovery Policy by including Key
Elements of Fiscal Resource Allocation and Cost Recovery Policy as suggested on pages 31 and 32. These are intended to articulate the philosophy underlying the adopted model. The current policy includes the model, tier level assignments of programs and services, and cost recovery targets. As these have been refined through this update, and are likely to change with annual evaluation and updates, it is suggested that this information not be a formal part of the policy, but a supplemental piece that is evaluated and refined annually. There is also a definition of costs within the policy. This definition should be updated as necessary with any refinements made through this update effort.
A2: Develop both a Partnership Policy and a Sponsorship Policy and philosophy, to serve as guidelines of
operating procedures to create equity and consistency while maximizing and leveraging resources of the Department. Develop partnership and sponsorship agreement templates. Distinguish partnerships from simple use agreements.
A3: Refine the Financial Assistance Policy, reevaluating age requirements for the senior programs,
specifically the challenge of a 20 percent discount automatically being applied at age 55, by potentially increasing the age requirement for the discount incrementally over time.
A4: Refine the Financial Assistance Policy, allowing assistance for Levels (Tiers) 1-4 of the pyramid
reflecting the mission-based services of the department. A4: Review and modify Facility and Field Use Agreement Guidelines. Address priority of access,
disruption of operations, and exceptions to the guidelines, using the language and cost recovery goals recommended through this study.
THEME B: ADMINISTRATIVE STRATEGIES
B1: Use the first year of implementation of this study update to identify a more direct correlation between service and their related expenses through the creation of General Ledger and sub-General Ledger accounts, to the object level if possible.
6 Alexandria Department of Recreation, Parks and Cultural Activities
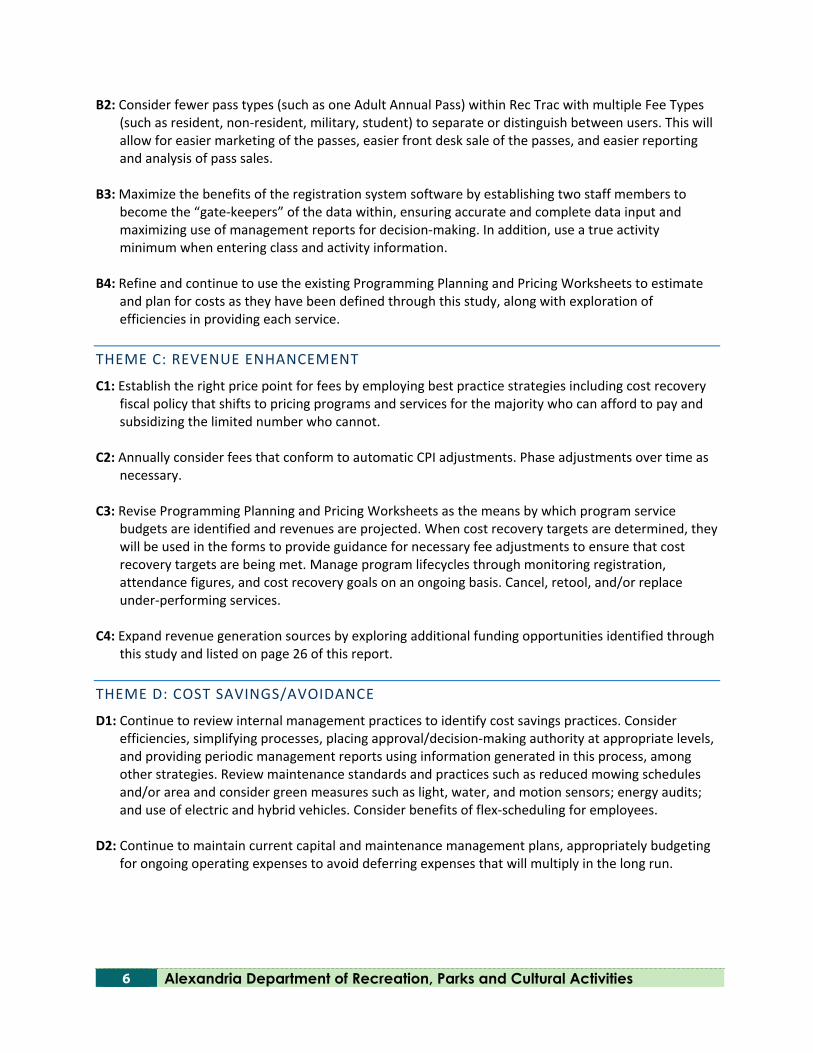
B2: Consider fewer pass types (such as one Adult Annual Pass) within Rec Trac with multiple Fee Types (such as resident, non-resident, military, student) to separate or distinguish between users. This will allow for easier marketing of the passes, easier front desk sale of the passes, and easier reporting and analysis of pass sales.
B3: Maximize the benefits of the registration system software by establishing two staff members to
become the “gate-keepers” of the data within, ensuring accurate and complete data input and maximizing use of management reports for decision-making. In addition, use a true activity minimum when entering class and activity information.
B4: Refine and continue to use the existing Programming Planning and Pricing Worksheets to estimate
and plan for costs as they have been defined through this study, along with exploration of efficiencies in providing each service.
THEME C: REVENUE ENHANCEMENT
C1: Establish the right price point for fees by employing best practice strategies including cost recovery fiscal policy that shifts to pricing programs and services for the majority who can afford to pay and subsidizing the limited number who cannot.
C2: Annually consider fees that conform to automatic CPI adjustments. Phase adjustments over time as
necessary. C3: Revise Programming Planning and Pricing Worksheets as the means by which program service
budgets are identified and revenues are projected. When cost recovery targets are determined, they will be used in the forms to provide guidance for necessary fee adjustments to ensure that cost recovery targets are being met. Manage program lifecycles through monitoring registration, attendance figures, and cost recovery goals on an ongoing basis. Cancel, retool, and/or replace under-performing services.
C4: Expand revenue generation sources by exploring additional funding opportunities identified through
this study and listed on page 26 of this report. THEME D: COST SAVINGS/AVOIDANCE
D1: Continue to review internal management practices to identify cost savings practices. Consider efficiencies, simplifying processes, placing approval/decision-making authority at appropriate levels, and providing periodic management reports using information generated in this process, among other strategies. Review maintenance standards and practices such as reduced mowing schedules and/or area and consider green measures such as light, water, and motion sensors; energy audits; and use of electric and hybrid vehicles. Consider benefits of flex-scheduling for employees.
D2: Continue to maintain current capital and maintenance management plans, appropriately budgeting
for ongoing operating expenses to avoid deferring expenses that will multiply in the long run.
Resource Allocation Study 7
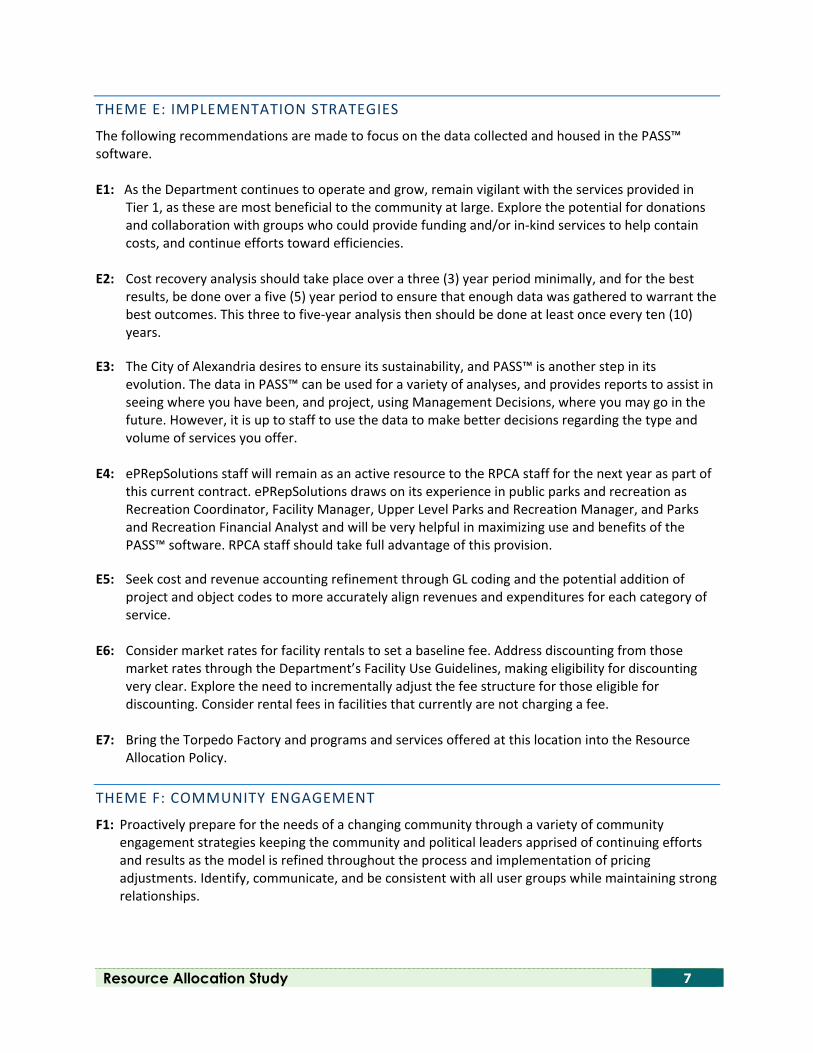
THEME E: IMPLEMENTATION STRATEGIES
The following recommendations are made to focus on the data collected and housed in the PASS™ software. E1: As the Department continues to operate and grow, remain vigilant with the services provided in
Tier 1, as these are most beneficial to the community at large. Explore the potential for donations and collaboration with groups who could provide funding and/or in-kind services to help contain costs, and continue efforts toward efficiencies.
E2: Cost recovery analysis should take place over a three (3) year period minimally, and for the best
results, be done over a five (5) year period to ensure that enough data was gathered to warrant the best outcomes. This three to five-year analysis then should be done at least once every ten (10) years.
E3: The City of Alexandria desires to ensure its sustainability, and PASS™ is another step in its
evolution. The data in PASS™ can be used for a variety of analyses, and provides reports to assist in seeing where you have been, and project, using Management Decisions, where you may go in the future. However, it is up to staff to use the data to make better decisions regarding the type and volume of services you offer.
E4: ePRepSolutions staff will remain as an active resource to the RPCA staff for the next year as part of
this current contract. ePRepSolutions draws on its experience in public parks and recreation as Recreation Coordinator, Facility Manager, Upper Level Parks and Recreation Manager, and Parks and Recreation Financial Analyst and will be very helpful in maximizing use and benefits of the PASS™ software. RPCA staff should take full advantage of this provision.
E5: Seek cost and revenue accounting refinement through GL coding and the potential addition of
project and object codes to more accurately align revenues and expenditures for each category of service.
E6: Consider market rates for facility rentals to set a baseline fee. Address discounting from those
market rates through the Department’s Facility Use Guidelines, making eligibility for discounting very clear. Explore the need to incrementally adjust the fee structure for those eligible for discounting. Consider rental fees in facilities that currently are not charging a fee.
E7: Bring the Torpedo Factory and programs and services offered at this location into the Resource
Allocation Policy. THEME F: COMMUNITY ENGAGEMENT
F1: Proactively prepare for the needs of a changing community through a variety of community engagement strategies keeping the community and political leaders apprised of continuing efforts and results as the model is refined throughout the process and implementation of pricing adjustments. Identify, communicate, and be consistent with all user groups while maintaining strong relationships.
8 Alexandria Department of Recreation, Parks and Cultural Activities
CONCLUSION
The City of Alexandria Department of Recreation, Parks & Cultural Activities originally implemented its Resource Allocation and Cost Recovery Policy in 2013-2014. The goals for the 2018-2019 update are to educate and orient new staff while providing a refresher for staff who were employed during the first study, to the cost recovery model and policy that serves as the framework for future planning, budgeting, pricing and resource allocation for the City’s parks, recreation and community services. This study included assistance in a more focused public outreach effort to facilitate an outcome that reflects City Council goals, the mission and vision of the Department, and values of the community. The study provides justifiable, articulated and agreed upon pricing rationale that can be used to allocate resources and establish pricing levels that most effectively meet community needs. Having established a well-defined Cost Allocation Policy in 2013 and refining the policy through community and staff input, and the addition off PASS® software, the Department’s future is well prepared to meet the goal of using resource allocation and cost recovery policies to provide maximum benefit of programs, facilities, and services for the residents of the City of Alexandria. The implementation of the recommendations contained in this study and the continued use of the PASS® software will help the Department determine how recreation programs and services can be priced and managed to operate cost effectively while ensuring that fees for programs and services are realistic. The outcome of following these recommendations will be improved operational efficiency, and policies which will be easy to follow and adhere to as well as being easy to explain to the public. It has been our pleasure to work with the City of Alexandria Department of Recreation, Parks & Cultural Activities to evolve its sustainability efforts.
Resource Allocation + Cost Recovery = Maximum Benefit Provided Jim Spengler, Director Department of Recreation, Parks & Cultural Activities
Resource Allocation Study 9
I. RESOURCE ALLOCATION STUDY
ABOUT THE STUDY
INTRODUCTION
This comprehensive update to the RPCA efforts regarding how it allocates and generates its resources is intended to broaden and evolve the strong “best practice” business tools implemented in the Department five years ago. Recreation, parks, and cultural services are varied and make up a lot of smaller “businesses” that each have their unique place in the market and appeal to the population in myriad ways. The overall goal of this study is to evolve and sustain practices and examine policy and rules that affect overall desired outcomes of a healthy and vibrant community. These evolved practices will allow the Department to allocate its resources wisely and provide valuable information for decision-making and setting priorities for improvements and changes to the system as it evaluates strategies for cost recovery. As articulated by Director Jim Spengler, the ultimate goal is to maximize the benefit of services provided within a community. This requires both the tax allocation and cost recovery strategies for other types of revenue to attempt to meet the desires of citizens and visitors. As previously discovered, cost recovery is a complex subject. Essentially, it represents a decision to generate revenues (outside of taxes) by charging fees, or through other means, for some, or all programs and services, relative to the total operational costs to provide them. Cost of Service is an identification and calculation of what is required financially to produce or operate a service. Cost recovery does not imply that the target is total recovery of the cost; however, a target is established according to a variety of considerations and may range from 0 percent to more than 100 percent of direct costs. As cost is defined differently in nearly every organization, this document discusses Cost Recovery as it relates to City of Alexandria RPCA. BACKGROUND
The City of Alexandria adopted a Resource Allocation and Cost Recovery Model and Policy for the Department of Recreation, Parks and Cultural Activities (RPCA) in 2013 as a result of a study intended to align the Department’s workplan with the City’s Strategic Plan strategies of promoting a culture of leadership and ownership at all levels of the organization, and promoting a culture of service excellence, creativity, and entrepreneurship. Green Play, LLC, led that study, which focused primarily on Recreation Services, in-and-of itself, a significant undertaking for the Department. The resulting policy has been used to determine updates to the recreation fee schedule presented during the annual budget process. These fees reflect a philosophy of supporting equity among the users of RPCA services. Those services that provide a mostly public benefit receive more tax dollar allocation versus those that primarily benefit individuals. In all cases, PRCA has continued to provide fee reductions to citizens for core services based on the economic needs under its “Financial Assistance Policy.”
Resource Allocation + Cost Recovery = Maximum Benefit Provided Jim Spengler, Director Department of Recreation, Parks & Cultural Activities
10 Alexandria Department of Recreation, Parks and Cultural Activities
This philosophy is implemented through a cost recovery model that has continued to evolve since that time, as methods for tracking and accounting for costs has improved. This five-year update makes use of those tools and takes the desired, more comprehensive approach to all of the Department’s services THE GOAL
Specific goals of this update include: • Aligning of this project with the Priority-based Budgeting initiative of the City • Broader and more diverse engagement of the public, considering more avenues for participation • Expanding the services addressed from Recreation only to all divisions of the Department • Refining of the tool and its understanding by strengthening the naming, definitions, and
examples for all categories of service, and defining additional categories as appropriate • Orienting and educating new staff while providing a refresher for staff employed during the
initial study • Providing options and identifying clarifications needed in the existing rental and facility use
policy to minimize confusion regarding the basis for appropriate fee reductions • Addressing appropriate methodology to account for volunteer efforts and other in-kind
contributions • Reviewing of pricing strategies
THE PROJECT
The resource allocation study involved two main components which occurred in parallel, carried out through the efforts of two consulting firms working closely with RPCA staff.
GreenPlay, LLC GreenPlay, LLC (GreenPlay), a nationally renowned parks and recreation consulting firm, was chosen to return to provide this update due to its expertise in developing and implementing resource allocation and cost recovery models. GreenPlay, now celebrating 20-years of helping agencies improve park and recreation services has provided over 500 assessments, plans, and resource allocation studies for parks and recreation departments around the country since 1999. GreenPlay selected ePReSolutions to assist with this project. ePRepSolutions, LLC Selected due to its extensive municipal finance experience and expertise with parks and recreation services, ePRepSolutions provided a technical analysis of the current financial condition of the Department relative to the goals of this study. This was accomplished through the use of its PASS ™ software.
The technical analysis provided much more accurate and detailed information than was possible in the first study. This information has been provided in a staff level technical report. This information has been used to make recommendations for specific actions in this study and provides a comprehensive data base for decision-making. The software will allow further refinements of the data over the next year as it is better understood through its use.

Resource Allocation Study 11
GreenPlay used a much-broadened strategy to engage the community, staff, and Park and Recreation Commission to gain an understanding of how residents view the larger number of programs and services run by the Department. Through community dialogue workshops, participants examined the community benefit and individual benefit received through the services offered and helped staff to update the pyramid model that aligns services on the basis of these benefits.
12 Alexandria Department of Recreation, Parks and Cultural Activities
II. ABOUT ALEXANDRIA RECREATION, PARKS, AND CULTURAL ACTIVITIES
OUR MISSION AND GOALS
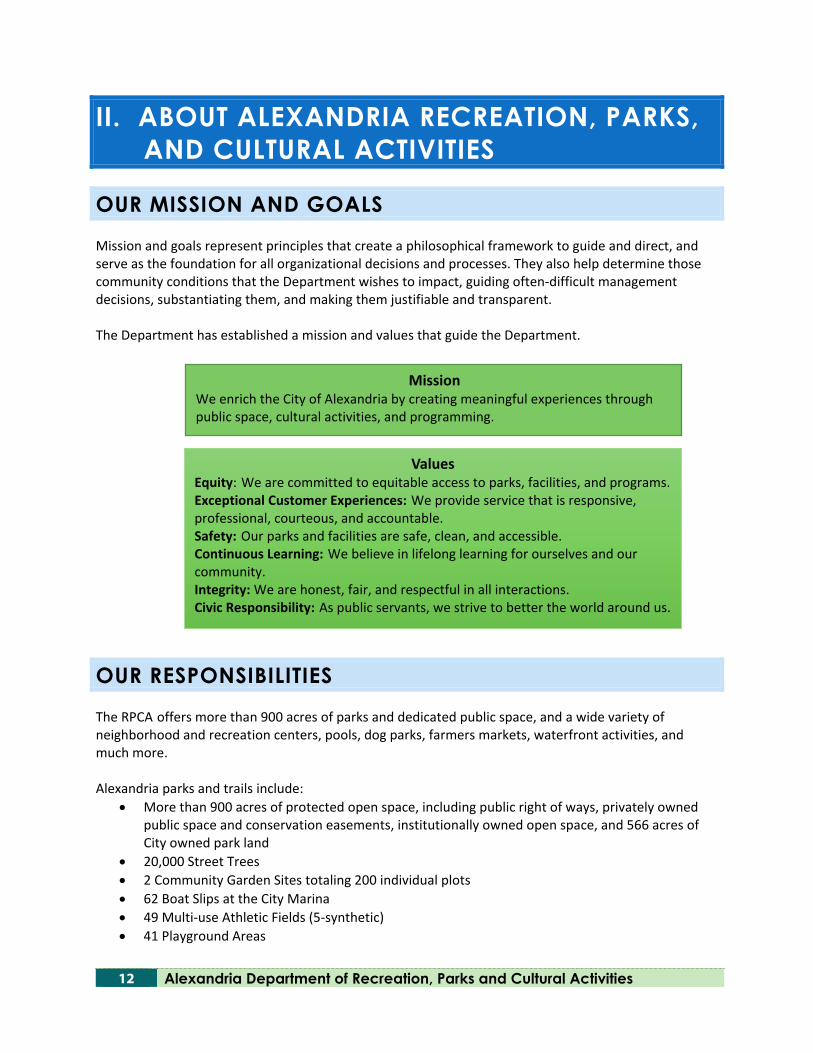
Mission and goals represent principles that create a philosophical framework to guide and direct, and serve as the foundation for all organizational decisions and processes. They also help determine those community conditions that the Department wishes to impact, guiding often-difficult management decisions, substantiating them, and making them justifiable and transparent. The Department has established a mission and values that guide the Department.
OUR RESPONSIBILITIES
The RPCA offers more than 900 acres of parks and dedicated public space, and a wide variety of neighborhood and recreation centers, pools, dog parks, farmers markets, waterfront activities, and much more. Alexandria parks and trails include:
• More than 900 acres of protected open space, including public right of ways, privately owned public space and conservation easements, institutionally owned open space, and 566 acres of City owned park land
• 20,000 Street Trees • 2 Community Garden Sites totaling 200 individual plots • 62 Boat Slips at the City Marina • 49 Multi-use Athletic Fields (5-synthetic) • 41 Playground Areas
Values Equity: We are committed to equitable access to parks, facilities, and programs. Exceptional Customer Experiences: We provide service that is responsive, professional, courteous, and accountable. Safety: Our parks and facilities are safe, clean, and accessible. Continuous Learning: We believe in lifelong learning for ourselves and our community. Integrity: We are honest, fair, and respectful in all interactions. Civic Responsibility: As public servants, we strive to better the world around us.
Mission We enrich the City of Alexandria by creating meaningful experiences through public space, cultural activities, and programming.
Resource Allocation Study 13
• 45 hard surface courts including basketball, futsal and tennis • 20 Miles of Trails • 18 Dog Parks (6 fenced and 12 unfenced) • 5 Picnic Shelters • 1 Indoor Pool • 3 Outdoor Pools • 7 Community Recreation Centers • 1 Nature Center • 1 Arts Center
The Park Operations Division of the RPCA manages and maintains the park system within the City of Alexandria.
The City has a number of neighborhood recreation centers and specialty centers located throughout the community. Recreation centers are available for use by residents, community groups, and organizations. Amenities at the different centers may include athletic fields, pools, meeting rooms, gymnasiums, dance studios, fitness rooms, and much more. Alexandria recreation centers include:
• Neighborhood Centers which offer a variety of programs and drop-in activities, as well as special events and special activities.
Alexandria specialty centers include:
• An all in one recreation and fitness centers that offer a variety of equipment and facilities for fitness, wellness, and recreational and sport activities, along with programs, leagues, and instructional classes.
• Cultural Arts Centers that provide facilities and equipment for a variety of cultural art programs as well as provide spaces for rent and lease.
• A Nature Center that allows visitors to see live animals up close and learn about the cultural and natural history of Dora Kelley Nature Park, with over 30 lives animals residing at the center, and a 50-acre park on site. The Nature Center provides year-round programs and interactive exhibits to children and adults of all ages.
• A Therapeutic Recreation Center which provides innovative, inclusive, accessible, and affordable programs which enhance the health, well-being, and quality of life for Alexandria residents of all abilities.
• Multiple aquatic facilities, both indoor and outdoor pools, and an interactive fountain that offer a variety of facilities and amenities including competitive swim, instructional programs, fitness, health and wellness programs, and drop-in, recreational and special event activities.
• Waterfront & Marina is Alexandria’s best place to take in picturesque views of the Potomac River and Washington, D.C. Enjoy walking and running along the waterfront, street performers, music, and dining or set sail with water taxis and river cruises, offering scenic commutes between Alexandria and the Georgetown waterfront, Mount Vernon, and National Harbor.
Alexandria Programs and Services include:
• Classes and Camps from aquatics programs, to creative and performing arts, to exercise and fitness, to youth and adult sports, the City of Alexandria offers a wide variety of programs, classes, and activities for all ages and interests.
14 Alexandria Department of Recreation, Parks and Cultural Activities
• The City provides eighteen dog exercise areas and fenced dog parks for the convenience and enjoyment of Alexandria residents.
• Facility and Park Rentals are available for parties, receptions, weddings, meetings, and more. Indoor facilities are available for rental year-round and picnic areas are available for rental April-October, beginning March 1.
• Farmer Markets are held each Saturday morning year-round, in Market Square plaza. The Old Town Farmers Market is the oldest farmers market in the country held continuously at the same site.
• Sports leagues and programs are offered for youth and adults.
HOW THE PUBLIC PERCEIVES US
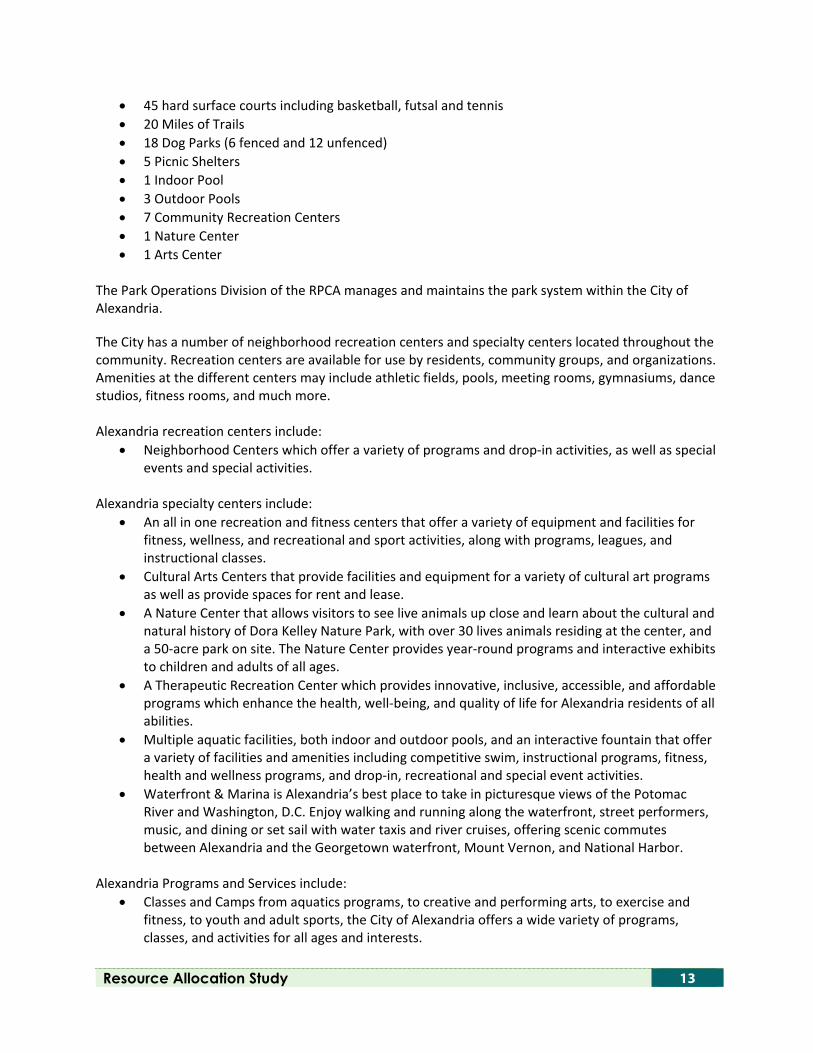
Alexandria participated in “The National Citizen Survey™” conducted by National Research Center Inc., in 2017 which resulted in the “Community Livability Report.” Almost all residents rated the quality of life in Alexandria as excellent or good, which was an increase since 2016. Alexandria residents gave favorable ratings to Recreation and Wellness. All items within Recreation and Wellness were rated strongly, with at least half of residents giving excellent or good ratings. How respondents rated recreation and wellness as aspects of community characteristics:
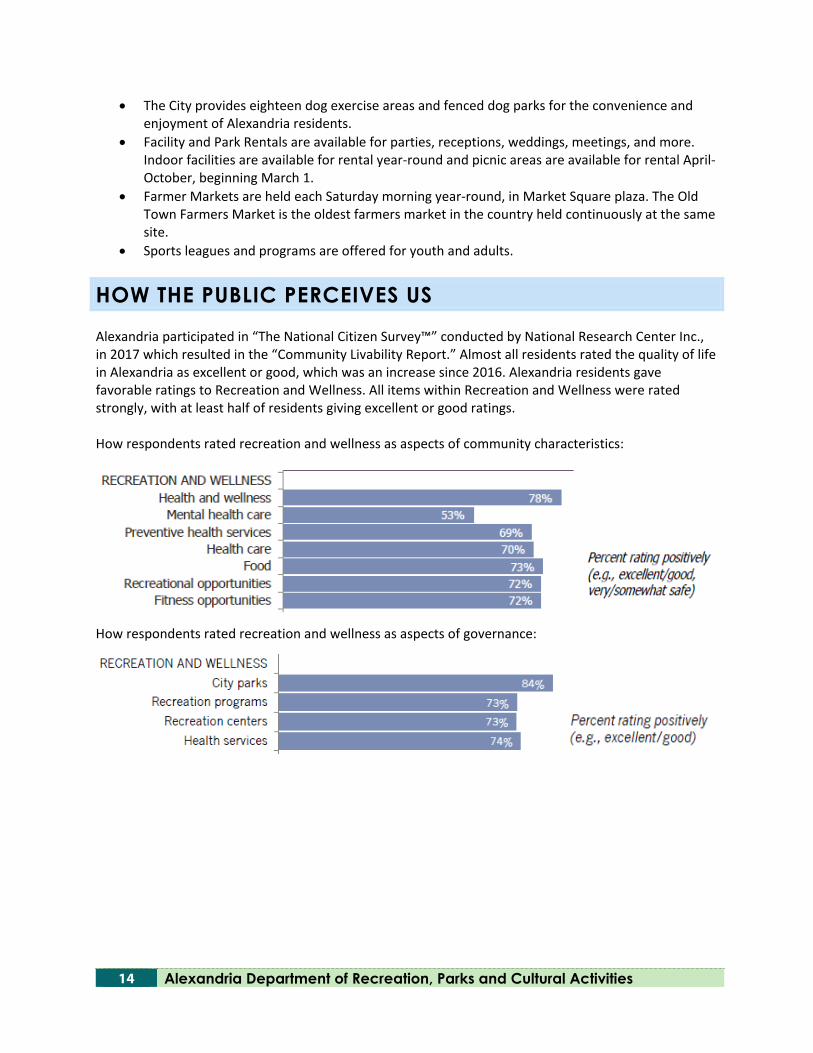
How respondents rated recreation and wellness as aspects of governance:
Resource Allocation Study 15
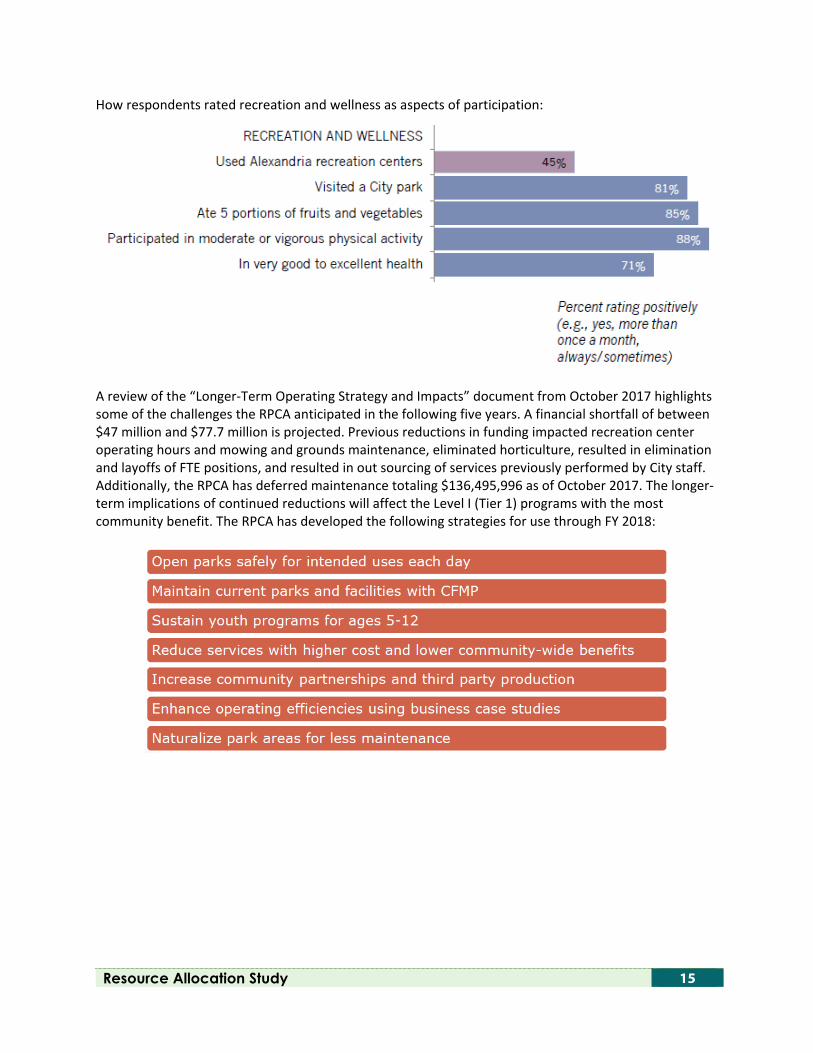
How respondents rated recreation and wellness as aspects of participation:
A review of the “Longer-Term Operating Strategy and Impacts” document from October 2017 highlights some of the challenges the RPCA anticipated in the following five years. A financial shortfall of between $47 million and $77.7 million is projected. Previous reductions in funding impacted recreation center operating hours and mowing and grounds maintenance, eliminated horticulture, resulted in elimination and layoffs of FTE positions, and resulted in out sourcing of services previously performed by City staff. Additionally, the RPCA has deferred maintenance totaling $136,495,996 as of October 2017. The longer-term implications of continued reductions will affect the Level I (Tier 1) programs with the most community benefit. The RPCA has developed the following strategies for use through FY 2018:
16 Alexandria Department of Recreation, Parks and Cultural Activities
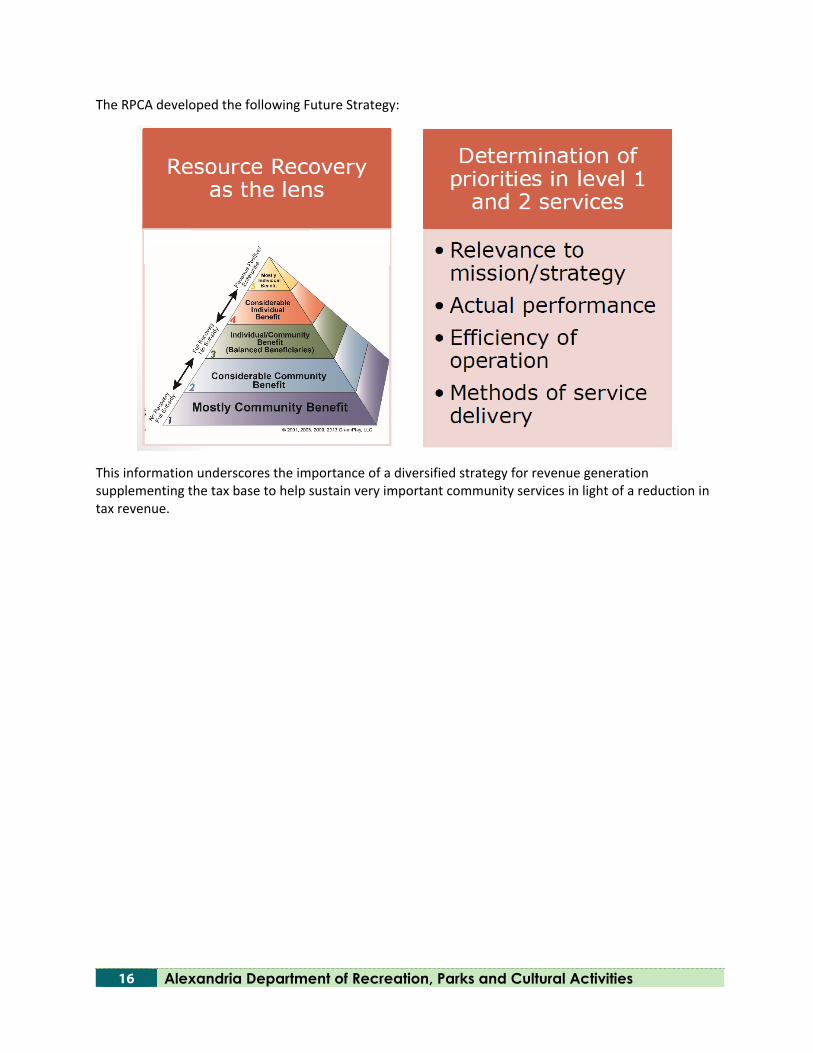
The RPCA developed the following Future Strategy:
This information underscores the importance of a diversified strategy for revenue generation supplementing the tax base to help sustain very important community services in light of a reduction in tax revenue.
Resource Allocation Study 17
III. PROJECT APPROACH
PROJECT TEAM
A project team was established to review existing policy, guidelines, and practices; to be sure new employees become familiar with the Pyramid Methodology; to work with a broader representation of citizen stakeholders to further understand community values; and to recommend the best cost recovery practices. This involved the refinement of all parts of the pyramid resource allocation and cost recovery model. The Project Team also worked with ePRepSolutions on the technical financial analysis including making determinations for a number of management decisions regarding the refinement of how costs are allocated among programs and services. The project team acknowledged current cost recovery levels and will use them to determine and recommend appropriate target cost recovery levels and pricing adjustments, where warranted.
PROJECT SCHEDULE
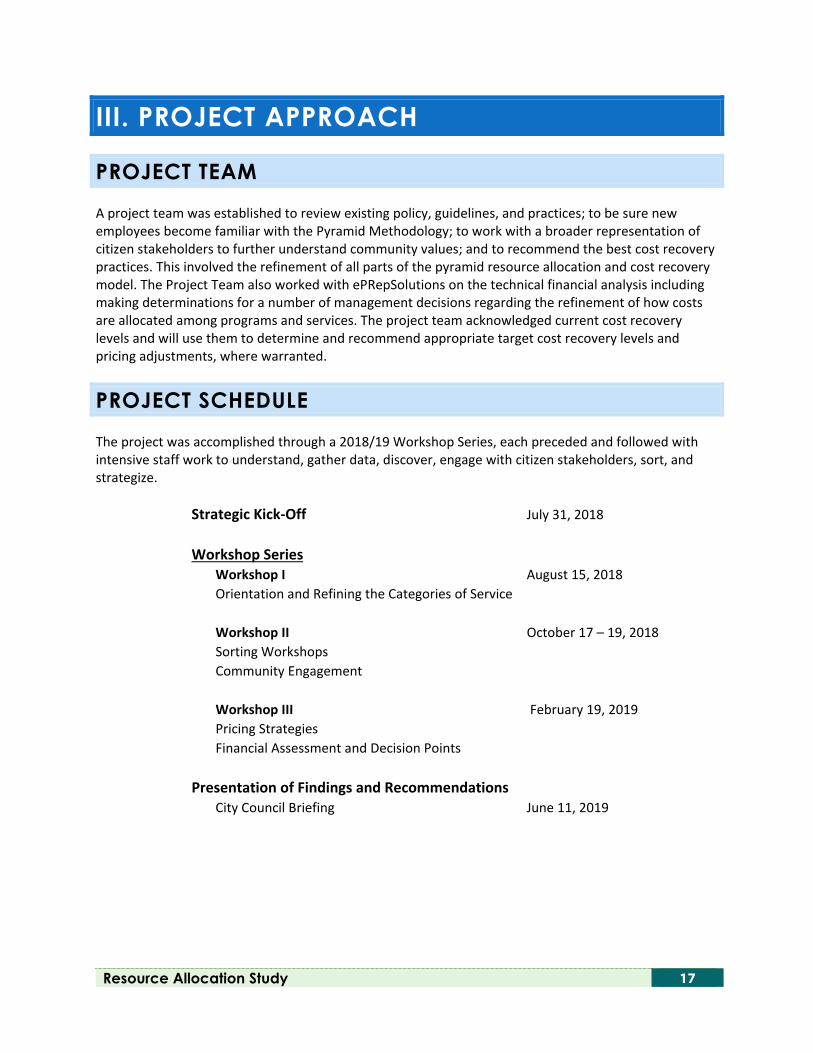
The project was accomplished through a 2018/19 Workshop Series, each preceded and followed with intensive staff work to understand, gather data, discover, engage with citizen stakeholders, sort, and strategize.
Strategic Kick-Off July 31, 2018
Workshop Series Workshop I August 15, 2018 Orientation and Refining the Categories of Service
Workshop II October 17 – 19, 2018 Sorting Workshops Community Engagement
Workshop III February 19, 2019 Pricing Strategies Financial Assessment and Decision Points
Presentation of Findings and Recommendations
City Council Briefing June 11, 2019
18 Alexandria Department of Recreation, Parks and Cultural Activities
STAFF AND STAKEHOLDER ENGAGEMENT
The Department hosted six workshops from October 17-19, 2018. • GreenPlay presented an information PowerPoint introduction/orientation to RPCA staff during a
staff town hall, followed by staff categories of service sorting exercise. • Five public meetings were held at locations throughout the City, where the information
PowerPoint was presented, followed by the sorting of the categories of service exercise by citizens. Participants in the conversations public dialogues represented ethnic diversity, age diversity (young families, senior citizens, adults), and gender diversity, and included stakeholders and affiliates along with the general public.
• The final public meeting included members of the Recreation Commission. The goal of these workshops was to build consensus amongst the staff, the public, and elected officials through listening to the as well as differences of opinion, and identifying areas of consensus, confusion, misinformation, or missing information.
In a follow up meeting, staff was presented with the “scoring sheets,” and, guided by GreenPlay, carried out the arduous exercise of making sense of it all using the numbers as general indications, but also considering the discussions, any confusion, misinformation, and missing information, and new opportunities. Preliminary representation of where each category falls on the pyramid model was determined and resulted in an updated Pyramid Model. Expanding the input sought from a more diverse group of representatives from all geographic areas of the community, looking at programs and services in this way, allowed staff to experience a higher comfort level for refining the categories of service, and appropriate placement on the updated model. More information regarding terminology, the Pyramid Model, and the philosophy underlying the Model and Methodology in use in the Department since 2013 can be found in Appendix A, B, and C respectively.
Resource Allocation Study 19
IV. THE CITY OF ALEXANDRIA RPCA RESOURCE ALLOCATION COST RECOVERY PYRAMID MODEL
THE ALEXANDRIA RPCA SERVICE OFFERING
The existing categories of service were refined and used as the basis of discussion by staff, stakeholders, and citizens. As a result of the discussion, the categories were adjusted and better defined, and thirty (30) are now present in the model. A full listing and description of each category is found in Appendix D, and examples of specific activities found within a category are provided.
THE CITY OF ALEXANDRIA PYRAMID MODEL
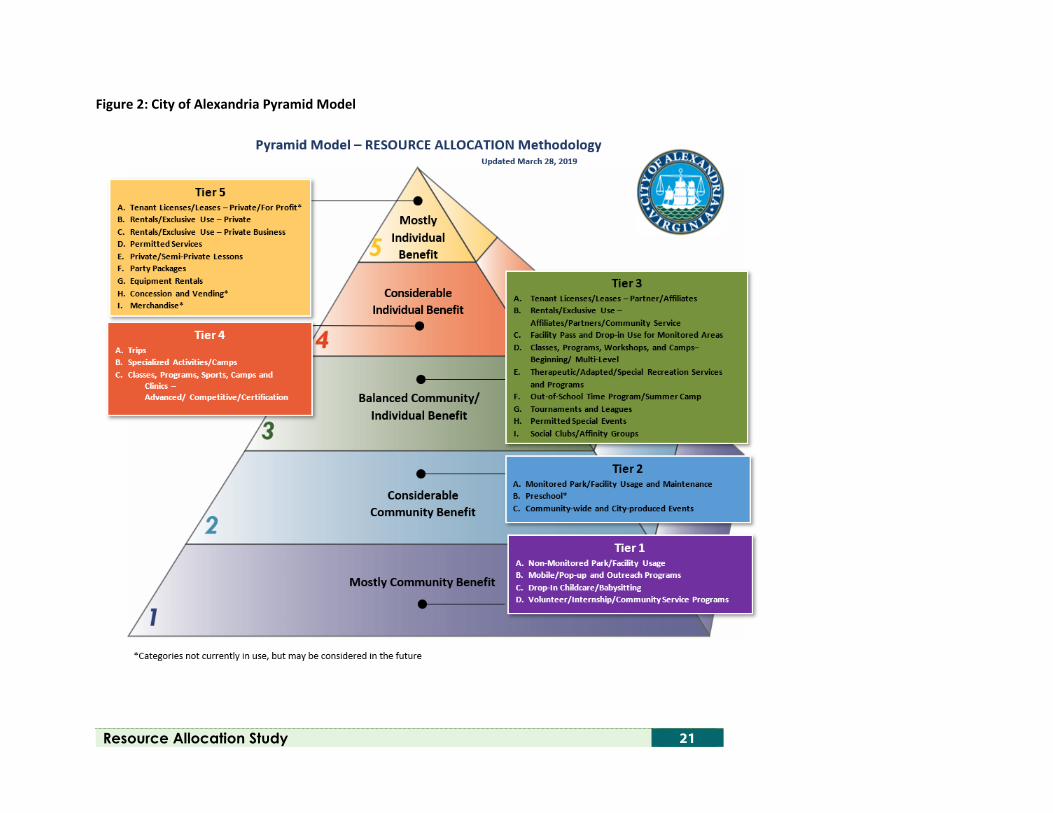
The pyramid model from the sorting discussion process was refined with each category of service placed in the appropriate tier of the pyramid based on the benefits filter and other filters (Figure 2). Current cost recovery percentages were calculated based on a more specific and consistent definition of direct, overhead, and indirect costs, along with other management decisions regarding the appropriate allocation of costs made possible through the use of the PASS™ software.
CURRENT COST RECOVERY
New with this update is the ability of the Department to do a much finer analysis of cost recovery through the use of PASS™ (Pricing and Service Sustainability) software. This tool assists an organization in aligning service philosophy and community priorities with fiscal reality. As “actual” financial data is entered into the system, the software provides the platform by which an organization can measure and understand the true cost of doing business and how it can successfully and economically serve constituents. A complete PASS™ technical findings and summary document was submitted to staff as a stand-alone document. PASS™ uses historical operational data along with desired allocation of subsidy and cost recovery levels to ultimately determine justifiable fees and charges for services including, but not limited to, recreation programs (courses), facility use opportunities (memberships) and facility rentals. PASS™ allows for measuring, planning, budgeting, and pricing decisions for an organization’s fiscal system. Certain items for specific reasons were not included as part of this study update: • Although capital development is not a part of this study and capital dollars are not being
addressed, operational costs associated with any capital development are part of the conversation.
• NOVA Parks (because it is a membership contribution and is not considered a cost of RPCA’s offerings), Public Art (because this is a capital item), and the Torpedo Factory (because of other work currently being undertaken) were not included in this study.
20 Alexandria Department of Recreation, Parks and Cultural Activities
Based on fiscal year (FY) 2018 year-end actuals, current cost recovery was measured by accounting for revenues associated with each category of service and dividing by the total cost-to-produce the activities within each of those categories of service, resulting in a percentage of cost recovery. The cost-to-produce includes the direct costs plus appropriate allocations of indirect and overhead costs for each category of service. The determinations of appropriate allocation of indirect cost were a result of management decisions reflecting how those indirect costs support each of the categories of service. Overall cost recovery for the RPCA Department, based on a budget of over $21.7M with non-tax revenues of almost $4.5M, measured at 20.6 percent for fiscal year 2018. For comparison purposes, a loosely calculated percentage provided through the 2018 National Recreation and Park Association (NRPA) “Agency Performance Review” indicates that the 2017 national “average” could be 28 percent; however, it is not clear what is, and is not, calculated in the figure, so it should be considered lightly. Preliminary measurement of current cost recovery percentage (the aggregate of each tier level) ranges from 0 percent on Tier 1 at the bottom of the pyramid including such services as general park and trail use and outreach programs, to 321 percent on Tier 5 at the top of the pyramid for facility rentals for exclusive private purposes. Decisions for cost recovery target adjustments will be made over the next year using the Pyramid Model and the detail provided through the PASS™ software. Specific examples of cost recovery analysis findings include:
• Tier 5 – Facility Rentals: Actual cost recovery for 2018 measures at 321 percent. This, and higher, is not uncommon for a Tier 5 service. Tier 5 services are often more reliant on market pricing rather than cost recovery pricing. With recommended changes that would affect rental revenue, including a fee adjustment, cost recovery could increase to 497 percent.
• Tier 3 – Courses (programs, workshops, OST, camps, leagues). Actual cost recovery for 2018 measures at 34 percent. Recommended fee adjustments could increase cost recovery to 65 percent.
• Tier 3 – Facility Pass and Drop-in Use for Monitored Areas (such as fitness, gym). Actual cost
recovery for 2018 measures at 25 percent. Recommended fee adjustments could increase cost recovery to 53 percent.
• Tier 1 – Non-monitored Park and Facility Use (trail use, playgrounds, passive and active park areas). Cost recovery is 0 percent for this type of service that has no intention of generating fees.
Resource Allocation Study 21
Figure 2: City of Alexandria Pyramid Model
22 Alexandria Department of Recreation, Parks and Cultural Activities
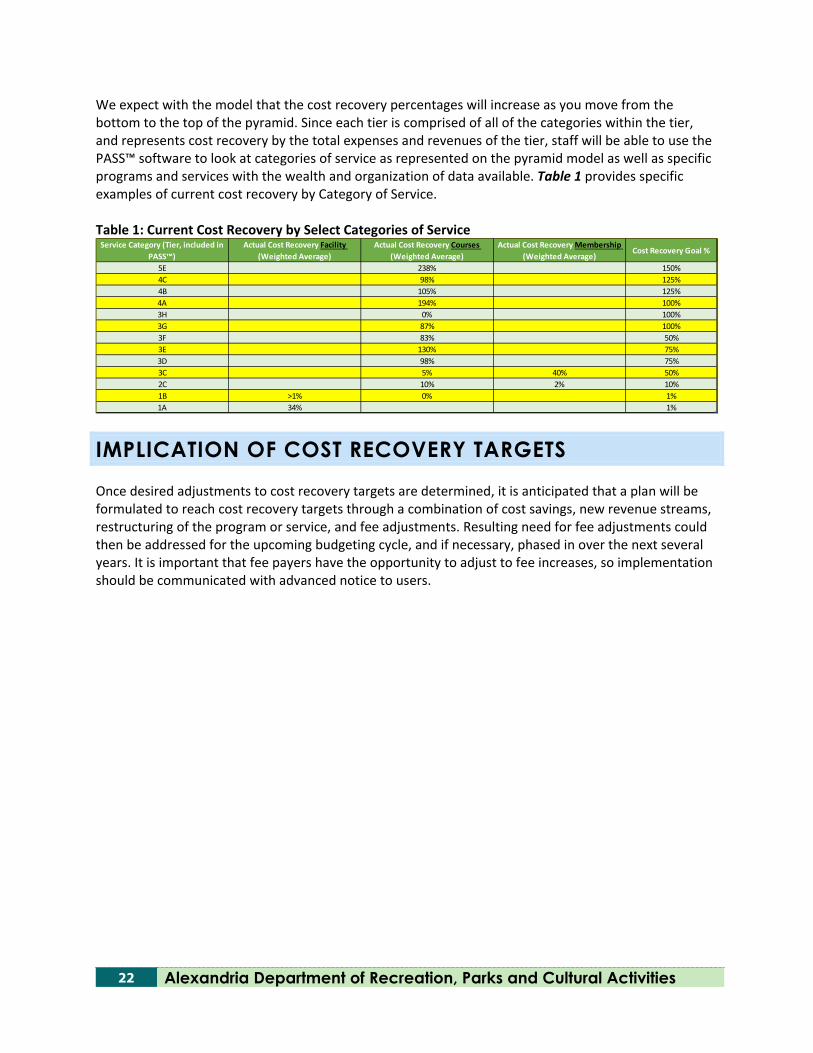
We expect with the model that the cost recovery percentages will increase as you move from the bottom to the top of the pyramid. Since each tier is comprised of all of the categories within the tier, and represents cost recovery by the total expenses and revenues of the tier, staff will be able to use the PASS™ software to look at categories of service as represented on the pyramid model as well as specific programs and services with the wealth and organization of data available. Table 1 provides specific examples of current cost recovery by Category of Service. Table 1: Current Cost Recovery by Select Categories of Service
IMPLICATION OF COST RECOVERY TARGETS
Once desired adjustments to cost recovery targets are determined, it is anticipated that a plan will be formulated to reach cost recovery targets through a combination of cost savings, new revenue streams, restructuring of the program or service, and fee adjustments. Resulting need for fee adjustments could then be addressed for the upcoming budgeting cycle, and if necessary, phased in over the next several years. It is important that fee payers have the opportunity to adjust to fee increases, so implementation should be communicated with advanced notice to users.
Service Category (Tier, included in PASS™)
Actual Cost Recovery Facility (Weighted Average)
Actual Cost Recovery Courses (Weighted Average)
Actual Cost Recovery Membership (Weighted Average)
Cost Recovery Goal %
5E 238% 150%4C 98% 125%4B 105% 125%4A 194% 100%3H 0% 100%3G 87% 100%3F 83% 50%3E 130% 75%3D 98% 75%3C 5% 40% 50%2C 10% 2% 10%1B >1% 0% 1%1A 34% 1%
Resource Allocation Study 23
V. KEY FINDINGS The extensive effort undertaken during this update study has brought to light information critical to addressing financial goals, cost recovery targets, fee setting, and decision-making. The pyramid model provides the framework for a discussion; the discussion illuminates key findings considering public input and departmental data.
THIS PROJECT IS BUILDING ON A SOLID FOUNDATION
The original study established the Pyramid Methodology and has served the Department well. The limited application addressing recreation programming provided the underlying philosophy which is now being applied across the broader department. The initial effort has also been a learning experience that over time has illuminated weak areas that can now be addressed. Staff has done an admirable job of planning and delivering, and creating collaborative relationships within the City and the community. With a solid foundation in place, the remainder of the findings of this study are focused on areas where the Department can address mechanisms that allow tracking and performance measurement; update and develop related policies, guidelines, and practices; clarify performance measurement; and identify efficiency strategies.
THE COMMUNITY SUPPORTS A FEE PROGRAM AND ACCESSIBILITY
Value messages expressed by community members during public engagement support the resource allocation and cost recovery philosophy and fee program supported by the Pyramid Model with appropriate assistance for those with economic need. They said:
• There is value in charging fees Fees generate revenue to provide quality services. People in general are in favor of fees if the money generated can be used to improve service
to them and/or to provide funding for “community good,” or to provide funding for scholarships for those with economic need.
Higher cost recovery is appropriate for exclusive services. • Accessibility is Important Scholarships must be available of those with economic need.
24 Alexandria Department of Recreation, Parks and Cultural Activities
STAFF PROMOTES SOCIAL EQUITY
• Individuals with special needs will not be considered differently from all individuals within the fee structure of the District; therefore, the therapeutics program falls on the same level of the pyramid as beginning/multi-level classes and programs, and the total additional cost of serving this population will be spread across all programs.
• Discounted fees are available through the Financial Assistance Policy (existing policy may be found as Appendix F). Adjustments should be made to the policy that assure consideration for those with economic need while increasing the age limit for senior citizens, currently based on age alone, and allowing discounted fees for those with demonstrated need in the mission-based categories of service in Levels (Tiers) 1-4.
APPROPRIATE “RELATIONSHIP” ELIGIBILITY NEEDS TO BE CLARIFIED
Facility/Field Use Guidelines are often confused with the concept of “Partnerships.” The Department currently employs various policies and guidelines for establishing fees and eligibility for fee discounting in regard to facility rentals, use of athletic fields, and services that benefit outside providers, users, and special events promoters in the community. These guidelines are intended to serve a different type of relationship than a true “partner.” A separate partnership policy would clearly identify a mutually beneficial relationship and differentiate partners from a simple use agreement, or any other type of affiliation. Partnership terms are negotiated to the benefit of each party. When partnerships are removed from use policies and guidelines in favor of a negotiated partnership agreement subject to a partnership policy, the use guidelines become much clearer and straightforward when determining eligibility for discounted fees and charges. Relationships between the user groups and the City need to be more clearly defined and delineated; eligibility for a particular relationship type must be spelled out through articulation of criteria that must be met.
• Relationships and eligibility to be considered to qualify for the relationship status need to be better defined, “non-profit” is not specific enough to be sole criteria for discounting. These relationships include: Partnership Park-ner-ship Affiliate
• Some groups who have a relationship with the Department actually relate to the Department through several different categories of service. Each of these must be addressed separately, and treated appropriately, by category of service, as defined through this process (examples: lease of space for office, facility rental, advance/competitive programs, beginner or multi-level programs).
• Criteria for determination of discounting by type of relationship should be based on the amount of control the RPCA has over the offering: The more control retained by RPCA in terms of conditions of the agreement regarding
desired outcomes, and how the service is delivered would warrant more support from the department, which may include discounts.
Less control by RPCA would result in no discounting and charging of full rates.
Resource Allocation Study 25
CATEGORIES OF SERVICE MUST BE WELL DEFINED AND UNDERSTOOD
In order to accurately place a category of service on the pyramids, the category must be well defined and understood as to what is included, and not included, in the category.
• Drop-in child care/babysitting was clarified to be only that service attached to the holding of public meetings, and is not a service available to participants partaking of recreational services; this was interpreted to best be placed on the bottom level of the pyramid.
• Merchandise refers to the sale of merchandise and does not include Departmental “give-aways” such as t-shirts and water bottles, or class or activities supply reimbursements.
• Real estate terms must be consistent with City standards to appropriately reflect the type of use, and any discounting for these arrangements must be based on type of relationship, must address Community Benefit, and must include performance measures. Suggested terms: License - Long Term Leases - Long Term Rental - Short Term
NEW COMMUNITY BENEFIT PROGRAMS UNDERTAKEN MUST BE ASSURED OF A SUBSIDY ALLOCATION
Preschool is not currently provided by the Department but appears to be a community need, and therefore was included as a category of service. If provided in the future, there must be a subsidy resource allocation, as the Department’s current resources would not support a program of this nature. Preschool would only be offered if a need was found that the private sector is not meeting.
ACCOUNTING CHALLENGES CAN BE OVERCOME
General accounting structures are not designed as management tools for parks, recreation, and cultural activities agencies as the focus is on keeping the integrity of the funds and not on tracking and providing management reports to be used for data-driven decision-making for effective operations. As a result, providing management information is often a tedious manual process requiring pulling of information from accounting software and from the Department’s registration software, two separate systems that do not talk to each other.
Use of the PASS™ software system is providing the opportunity to address this issue by bringing information from both systems together in a functioning data base. Fully recognizing the effort that staff has taken this first year to download and assign costs based on a variety of management decisions, this will be much easier in subsequent years. In the meantime, valuable, accurate data has provided a true cost of providing services, and cost recovery targets can be applied to project a much more accurate result of adjusting the targets.
26 Alexandria Department of Recreation, Parks and Cultural Activities
USE OF FEES AND CHARGES COULD BE MORE STRATEGIC
Fees are a legitimate funding mechanism to meet the recreational demands of a community in an equitable and sustainable way. Responsible use of fees:
• Allows the provision of services that would not exist with reliance solely upon tax payer revenue • Provides a financial resource to keep up with growing costs • Allows expansion of services to keep up with growing demand • Matches who pays for a service with who receives the benefit of the service • Demonstrates fiscal responsibility to the taxpayer by aligning taxpayer resources with services
that are of the most benefit to the community and individual contribution when the benefit is limited to an individual or an individual group (or combination thereof)
• Creates a commitment by the participant (i.e., market research demonstrates “free” services have a high no-show rate, which diminishes as fees are assessed)
• Correlates price with the value of the service (i.e., market research on the psychology of pricing or price perception)
• Helps balance amenity use (e.g., fee differential for peak times or amenities can shift some use to the off-peak times or other amenities)
Establishing the right price point for fees is often hampered by a desire to assure that no one is excluded due to an economic inability to pay. Best practice includes cost recovery fiscal policy that shifts to pricing programs and services for the majority who can afford to pay and subsidizing the limited number who can’t. More information, provided in a training session to the Department, regarding the development of a pricing strategy can be found in Appendix E.
…AND IT ISN’T ONLY ABOUT PROGRAM AND SERVICE FEES
Meeting cost recovery targets can be accomplished through other means than adjusting program fees. Other avenues of revenue generation and cost avoidance or containment in use by public park, recreation, and community services agencies across the country were considered as part of this study. Some of these strategies may help shift tax dollars to other priorities within the Department. The most promising strategies for further exploration include: Traditional Tax and Exactions-Based Funding Resources
• General or operating fund • Property tax
Fees and Charges • Daily admission, annual pass sales, and parking permits • Registration fees • Ticket sales/admission
Loan Mechanisms • General Obligation Bonds (currently used only for capital projects)
Resource Allocation Study 27
Partnership Opportunities • School Districts • Kiwanis, Optimists, VFWs, Elks, Rotary, and other service/civic organizations • Homeowner or Neighborhood Associations • Youth Sports Associations • Adult Sports Associations
Community Resources • Corporate sponsorships • Grants
Facilities and equipment grants General purpose or operating grants Matching grants Planning grants
• Land and Water Conservation Fund • Philanthropic
Friends associations Volunteers/In-Kind Services
Adopt-A-Park or Trail Neighborhood watch
Community Service Fees and Assessments • Equipment rental • Flexible fee strategies • Lighting fees • Parking fee • Security and clean-up fees (deposits)
Permits, Licensing Rights, and Use of Collateral Assets • Film rights • Surplus sale of equipment by auction
Funding Resources and Other Options • Land trusts
Cost Saving Measures • Changing maintenance standards and practices • Contract renegotiation • Cost avoidance
Green Trends and Practices• Rooftop gardens and park structures • Use light, water, and motion sensors • Conduct energy audits • Use electric and hybrid vehicles • Use greywater • Use solar and wind energy • Green operating practices • Recycle office trash • Virtual meetings • Preventative maintenance
• Eliminate environmentally negative chemicals and materials
• LEED® design principles • Purchase better equipment - less
maintenance • Re-analyze and revise practices and
standards • Monitor and report results • Lead by example • Public education
28 Alexandria Department of Recreation, Parks and Cultural Activities
Other strategies to be considered that may require a more significant effort to explore and pursue include: Development Funding
• Local improvement districts • Park lands dedication ordinance
Alternative service delivery and funding structures • Inter-local agreements • Privatization - outsourcing management
Partnership Opportunities • YMCA/YWCA • Medical centers/hospitals • Boys and Girls Club • Chamber of Commerce • Convention and Visitors Bureau • Neighboring counties/cities • Private alternative providers • Churches (Rentals, Leases) • Senior citizen groups (AARP, Silver Sneakers)
Community Resources • Corporate sponsorships • Fundraising/crowdfunding • Grants
Management or technical assistance grants Program-related investments Private grants and philanthropic agencies Program or support grants Seed money or start-up grants
• Philanthropic Conservancies Foundations/gifts Gift catalogs Irrevocable remainder trusts Life estates Maintenance endowments Recreational Trails Program (RTP)
Community Services Fees and Assessments • Dog park fees • Franchise fee on cable • Percent-for-art legislation
Contractual Services • Cell towers and Wi-Fi
Funding Resources and Other Options • Enterprise funds • Positive cash flow • Cost avoidance
Resource Allocation Study 29
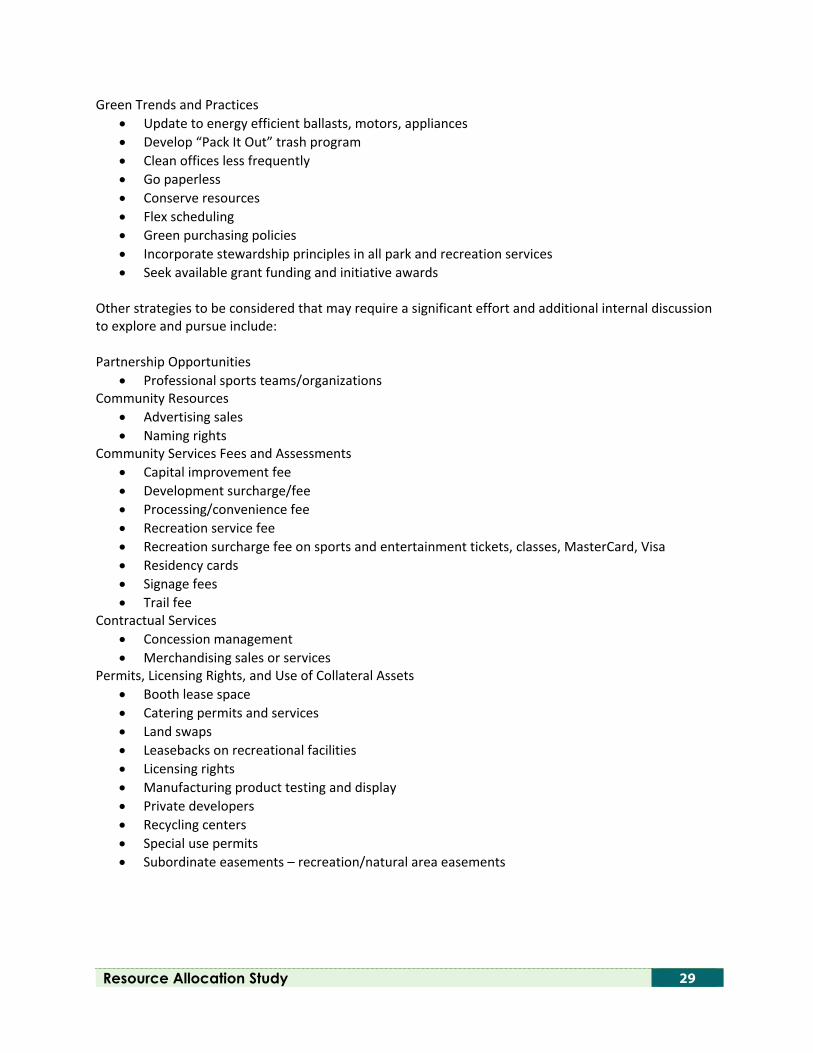
Green Trends and Practices • Update to energy efficient ballasts, motors, appliances • Develop “Pack It Out” trash program • Clean offices less frequently • Go paperless • Conserve resources • Flex scheduling • Green purchasing policies • Incorporate stewardship principles in all park and recreation services • Seek available grant funding and initiative awards
Other strategies to be considered that may require a significant effort and additional internal discussion to explore and pursue include: Partnership Opportunities
• Professional sports teams/organizations Community Resources
• Advertising sales • Naming rights
Community Services Fees and Assessments • Capital improvement fee • Development surcharge/fee • Processing/convenience fee • Recreation service fee • Recreation surcharge fee on sports and entertainment tickets, classes, MasterCard, Visa • Residency cards • Signage fees • Trail fee
Contractual Services • Concession management • Merchandising sales or services
Permits, Licensing Rights, and Use of Collateral Assets • Booth lease space • Catering permits and services • Land swaps • Leasebacks on recreational facilities • Licensing rights • Manufacturing product testing and display • Private developers • Recycling centers • Special use permits • Subordinate easements – recreation/natural area easements
30 Alexandria Department of Recreation, Parks and Cultural Activities
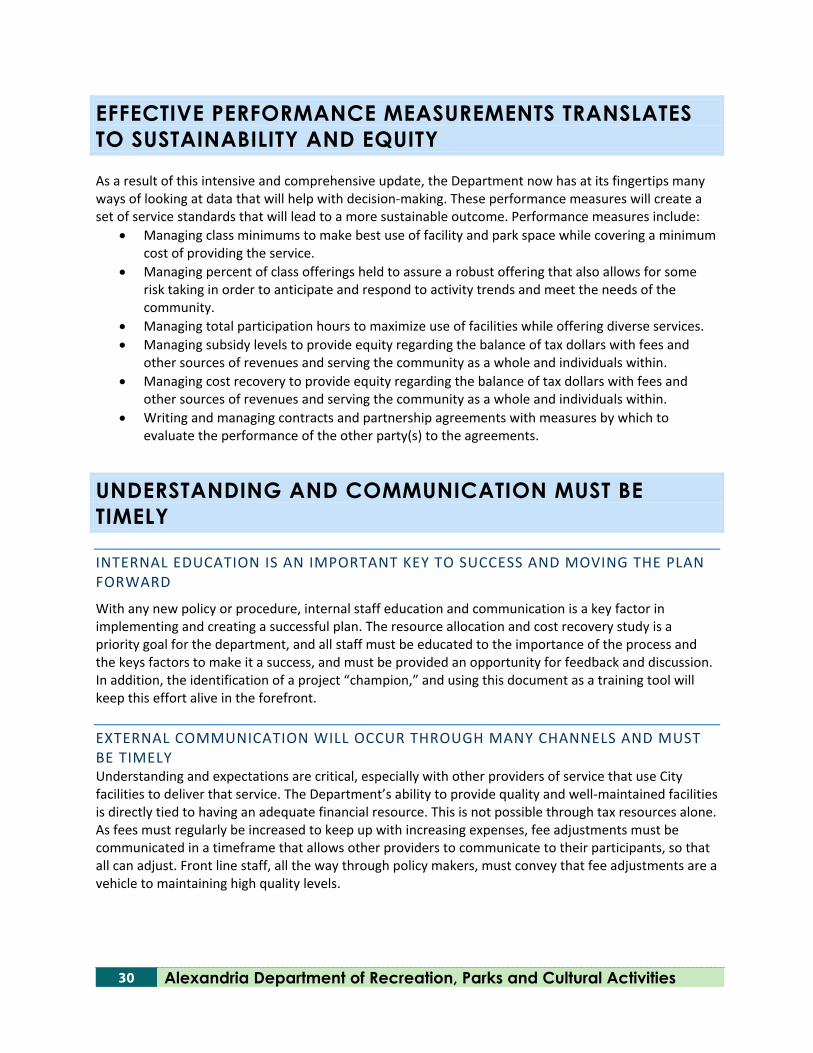
EFFECTIVE PERFORMANCE MEASUREMENTS TRANSLATES TO SUSTAINABILITY AND EQUITY
As a result of this intensive and comprehensive update, the Department now has at its fingertips many ways of looking at data that will help with decision-making. These performance measures will create a set of service standards that will lead to a more sustainable outcome. Performance measures include:
• Managing class minimums to make best use of facility and park space while covering a minimum cost of providing the service.
• Managing percent of class offerings held to assure a robust offering that also allows for some risk taking in order to anticipate and respond to activity trends and meet the needs of the community.
• Managing total participation hours to maximize use of facilities while offering diverse services. • Managing subsidy levels to provide equity regarding the balance of tax dollars with fees and
other sources of revenues and serving the community as a whole and individuals within. • Managing cost recovery to provide equity regarding the balance of tax dollars with fees and
other sources of revenues and serving the community as a whole and individuals within. • Writing and managing contracts and partnership agreements with measures by which to
evaluate the performance of the other party(s) to the agreements.
UNDERSTANDING AND COMMUNICATION MUST BE TIMELY
INTERNAL EDUCATION IS AN IMPORTANT KEY TO SUCCESS AND MOVING THE PLAN FORWARD
With any new policy or procedure, internal staff education and communication is a key factor in implementing and creating a successful plan. The resource allocation and cost recovery study is a priority goal for the department, and all staff must be educated to the importance of the process and the keys factors to make it a success, and must be provided an opportunity for feedback and discussion. In addition, the identification of a project “champion,” and using this document as a training tool will keep this effort alive in the forefront. EXTERNAL COMMUNICATION WILL OCCUR THROUGH MANY CHANNELS AND MUST BE TIMELY Understanding and expectations are critical, especially with other providers of service that use City facilities to deliver that service. The Department’s ability to provide quality and well-maintained facilities is directly tied to having an adequate financial resource. This is not possible through tax resources alone. As fees must regularly be increased to keep up with increasing expenses, fee adjustments must be communicated in a timeframe that allows other providers to communicate to their participants, so that all can adjust. Front line staff, all the way through policy makers, must convey that fee adjustments are a vehicle to maintaining high quality levels.
Resource Allocation Study 31
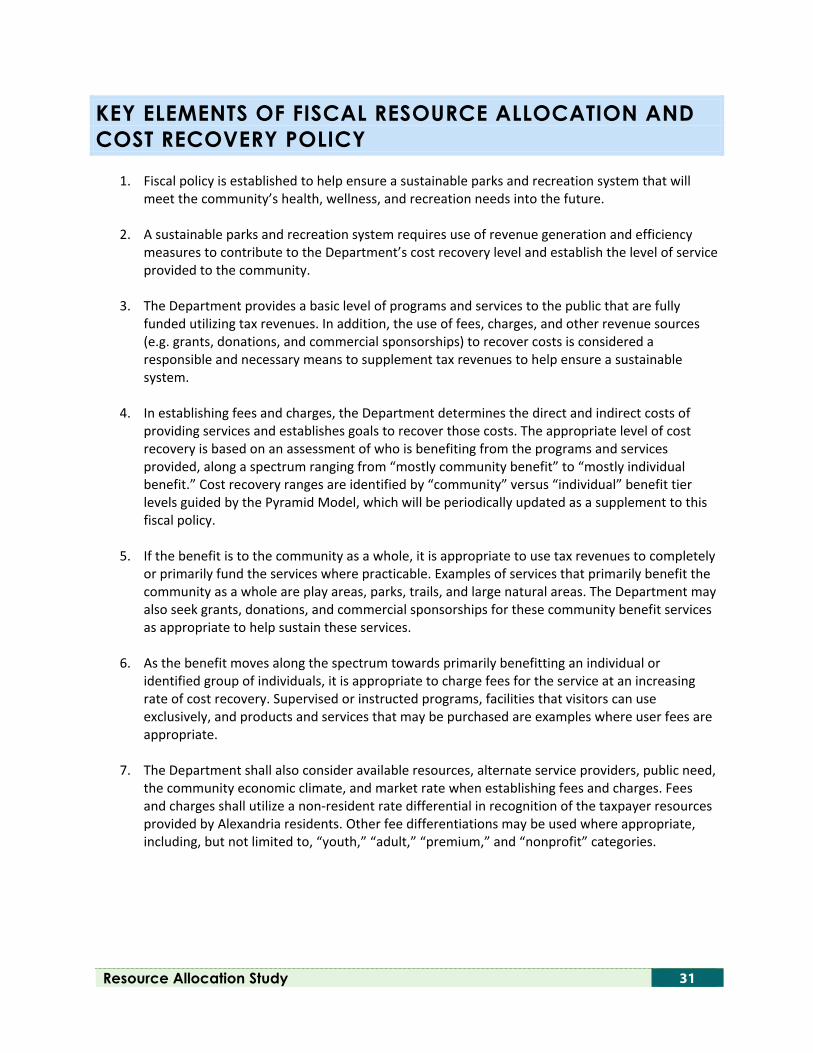
KEY ELEMENTS OF FISCAL RESOURCE ALLOCATION AND COST RECOVERY POLICY
1. Fiscal policy is established to help ensure a sustainable parks and recreation system that will meet the community’s health, wellness, and recreation needs into the future.
2. A sustainable parks and recreation system requires use of revenue generation and efficiency
measures to contribute to the Department’s cost recovery level and establish the level of service provided to the community.
3. The Department provides a basic level of programs and services to the public that are fully
funded utilizing tax revenues. In addition, the use of fees, charges, and other revenue sources (e.g. grants, donations, and commercial sponsorships) to recover costs is considered a responsible and necessary means to supplement tax revenues to help ensure a sustainable system.
4. In establishing fees and charges, the Department determines the direct and indirect costs of
providing services and establishes goals to recover those costs. The appropriate level of cost recovery is based on an assessment of who is benefiting from the programs and services provided, along a spectrum ranging from “mostly community benefit” to “mostly individual benefit.” Cost recovery ranges are identified by “community” versus “individual” benefit tier levels guided by the Pyramid Model, which will be periodically updated as a supplement to this fiscal policy.
5. If the benefit is to the community as a whole, it is appropriate to use tax revenues to completely
or primarily fund the services where practicable. Examples of services that primarily benefit the community as a whole are play areas, parks, trails, and large natural areas. The Department may also seek grants, donations, and commercial sponsorships for these community benefit services as appropriate to help sustain these services.
6. As the benefit moves along the spectrum towards primarily benefitting an individual or
identified group of individuals, it is appropriate to charge fees for the service at an increasing rate of cost recovery. Supervised or instructed programs, facilities that visitors can use exclusively, and products and services that may be purchased are examples where user fees are appropriate.
7. The Department shall also consider available resources, alternate service providers, public need,
the community economic climate, and market rate when establishing fees and charges. Fees and charges shall utilize a non-resident rate differential in recognition of the taxpayer resources provided by Alexandria residents. Other fee differentiations may be used where appropriate, including, but not limited to, “youth,” “adult,” “premium,” and “nonprofit” categories.
32 Alexandria Department of Recreation, Parks and Cultural Activities
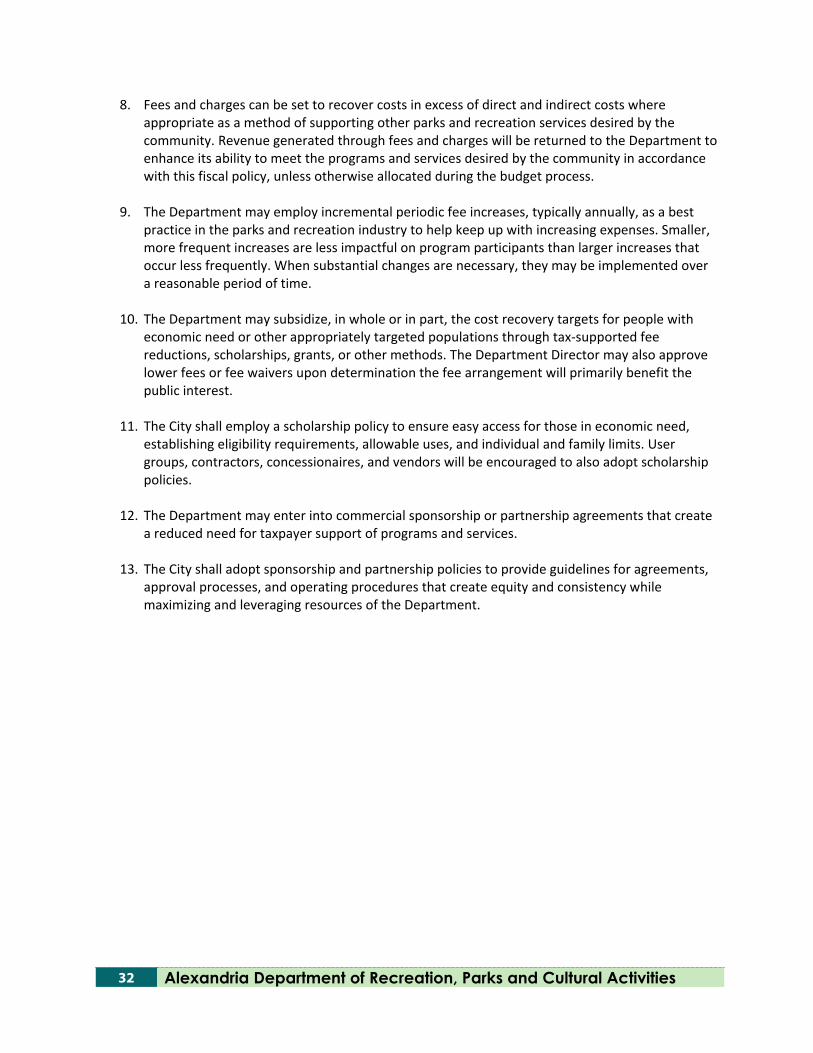
8. Fees and charges can be set to recover costs in excess of direct and indirect costs where appropriate as a method of supporting other parks and recreation services desired by the community. Revenue generated through fees and charges will be returned to the Department to enhance its ability to meet the programs and services desired by the community in accordance with this fiscal policy, unless otherwise allocated during the budget process.
9. The Department may employ incremental periodic fee increases, typically annually, as a best practice in the parks and recreation industry to help keep up with increasing expenses. Smaller, more frequent increases are less impactful on program participants than larger increases that occur less frequently. When substantial changes are necessary, they may be implemented over a reasonable period of time.
10. The Department may subsidize, in whole or in part, the cost recovery targets for people with economic need or other appropriately targeted populations through tax-supported fee reductions, scholarships, grants, or other methods. The Department Director may also approve lower fees or fee waivers upon determination the fee arrangement will primarily benefit the public interest.
11. The City shall employ a scholarship policy to ensure easy access for those in economic need, establishing eligibility requirements, allowable uses, and individual and family limits. User groups, contractors, concessionaires, and vendors will be encouraged to also adopt scholarship policies.
12. The Department may enter into commercial sponsorship or partnership agreements that create a reduced need for taxpayer support of programs and services.
13. The City shall adopt sponsorship and partnership policies to provide guidelines for agreements, approval processes, and operating procedures that create equity and consistency while maximizing and leveraging resources of the Department.
Resource Allocation Study 33
VI. STRATEGIC RECOMMENDATIONS Study recommendations are organized into the following themes.
THEME A: POLICY STRATEGIES
Adopted policies, guidelines, and procedures allow staff to achieve cost recovery targets and maximize revenue generation where appropriate, shifting taxpayer investment/subsidy to those areas more foundational on the pyramid. This provides an operating framework for service level decisions and the allocation of resources in both times of economic growth and instability, which is projected at the current time. Any new or revised policy or guideline as a result of these recommendations will go through existing development, review, and council recommendation and approval processes, as required.
A1: Refine the current (adopted 2013) Resource Allocation and Cost Recovery Policy by including
Key Elements of Fiscal Resource Allocation and Cost Recovery Policy as suggested on pages 31 and 32. These are intended to articulate the philosophy underlying the adopted model. The current Policy includes the model, tier level assignments of programs and services, and cost recovery targets. As these have been refined through this update, and are likely to change with annual evaluation and updates, it is suggested that this information not be a formal part of the Policy, but a supplemental piece that is evaluated and refined annually. There is also a definition of costs within the policy. This definition should be updated as necessary with any refinements made through this update effort.
A2: Develop both a Partnership Policy and a Sponsorship Policy and philosophy, to serve as
guidelines of operating procedures to create equity and consistency while maximizing and leveraging resources of the Department. Develop partnership and sponsorship agreement templates. Distinguish partnerships from simple use agreements.
A3: Refine the Financial Assistance Policy, reevaluating age requirements for the senior programs,
specifically the challenge of a 20 percent discount automatically being applied at age 55, by potentially increasing the age requirement for the discount incrementally over time, and seek opportunities to decrease expenses such as higher use of volunteer or contracted instructors and renegotiated contracts.
A4: Refine the Financial Assistance Policy, allowing assistance for Levels (Tiers) 1-4 of the pyramid
reflecting the mission-based services of the department.
A5: Review and modify Facility and Field Use Agreement Guidelines. Address priority of access, disruption of operations, and exceptions to the guidelines, using the language and cost recovery goals recommended through this study.
34 Alexandria Department of Recreation, Parks and Cultural Activities
THEME B: ADMINISTRATIVE STRATEGIES
B1: Use the first year of implementation of this study update to identify a more direct correlation between service and their related expenses through the creation of general ledger and sub-general ledger accounts, to the object level if possible.
B2: Consider fewer pass types (such as one Adult Annual Pass) within Rec Trac with multiple fee
types (such as resident, non-resident, military, student, etc.) to separate or distinguish between users. This will allow for easier marketing of the passes, easier front desk sale of the passes, and easier reporting and analysis of pass sales.
B3: Maximize the benefits of the registration system software by establishing two staff members to
become the “gate-keepers” of the data within assuring accurate and complete data input and maximizing use of management reports for decision-making. In addition, use a true activity minimum when entering class and activity information.
B4: Refine and continue to use the existing Programming Planning and Pricing Worksheets to
estimate and plan for costs as they have been defined through this study, along with exploration of efficiencies in providing each service.
THEME C: REVENUE ENHANCEMENT
C1: Establish the right price point for fees by employing best practice strategies including cost recovery fiscal policy that shifts to pricing programs and services for the majority who can afford to pay and subsidizing the limited number who can’t.
C2: Annually consider fee that conforms to automatic CPI adjustments. Phase adjustments over
time as necessary. C3: Revise Programming Planning and Pricing Worksheets as the means by which program service
budgets are identified and revenues are projected. When cost recovery targets are determined, they will be used in the forms to provide guidance for necessary fee adjustments to assure cost recovery targets are being met. Manage program lifecycles through monitoring registration, attendance figures, and cost recovery goals on an ongoing basis. Cancel, retool, and/or replace under-performing services.
C4: Expand revenue generation sources by exploring additional funding opportunities Identified
through this study and listed on page 26 of this report.
Resource Allocation Study 35
THEME D: COST SAVINGS/AVOIDANCE
D1: Continue to review internal management practices to identify cost savings practices. Consider efficiencies, simplifying processes, placing approval/decision-making authority at appropriate levels, and providing periodic management reports using information generated in this process, among other strategies. Review maintenance standards and practices such as reduced mowing schedules and/or area, and consider green measures such as light, water, and motion sensors; energy audits; and use of electric and hybrid vehicles. Consider benefits of flex-scheduling for employees.
D2: Continue to maintain current capital and maintenance management plans, appropriately budgeting
for ongoing operating expenses to avoid deferring expenses that will multiply in the long run.
THEME E: IMPLEMENTATION STRATEGIES
The following recommendations are made to focus on the data collected and housed in the PASS™ software. E1: As the Department continues to operate and grow, remain vigilant with the services provided in
Tier 1, as these are most beneficial to the community at large. Explore the potential for donations and collaboration with groups who could provide funding and/or in-kind services to help contain costs, and continue efforts toward efficiencies.
E2: Cost recovery analysis should take place over a three (3) year period minimally, and for the best
results, should be completed over a five (5) year period to ensure that enough data was gathered to warrant the best outcomes. This three to five-year analysis then should be done at least once every ten (10) years.
E3: The City of Alexandria desires to ensure its sustainability, and PASS™ is another step in its
evolution. The data in PASS™ can be used for a variety of analyses and provides reports to assist in seeing where you have been, and project, using Management Decisions, where you may go in the future. However, it is up to staff to use the data to make better decisions regarding the type and volume of services you offer.
E4: ePRepSolutions staff will remain as an active resource to the RPCA staff for the next year as part of
this current contract. ePRepSolutions draws on its experience in public parks and recreation as Recreation Coordinator, Facility Manager, Upper Level Parks and Recreation Manager, and Parks and Recreation Financial Analyst and will be very helpful in maximizing use and benefits of the PASS™ solftware. RPCA staff should take full advantage of this provision.
E5: Seek cost and revenue accounting refinement to more accurately express revenues and
expenditures for all categories.
36 Alexandria Department of Recreation, Parks and Cultural Activities
E6: Consider market rates for Facility Rental to set a baseline fee. Address discounting from those market rates through the Department’s Facility Use Guidelines, making eligibility for discounting very clear. Explore the need to incrementally adjust the fee structure for those eligible for discounting. Consider rental fees in facilities that currently are not charging a fee.
E7: Bring the Torpedo Factory and programs and services offered at this location into the Resource
Allocation Policy.
THEME F: COMMUNITY ENGAGEMENT
F1: Proactively prepare for the needs of a changing community through a variety of community engagement strategies keeping the community and political leaders apprised of continuing efforts and results as the Model is refined throughout the process and implementation of pricing adjustments. Identify, communicate, and be consistent with all user groups while maintaining strong relationships.
Resource Allocation Study 37
VII. CONCLUSION The City of Alexandria RPCA originally implemented its Resource Allocation and Cost Recovery Policy in 2013-2014. The goals for the 2018-2019 update are to educate and orient new staff while providing a refresher for staff who were employed during the first study, to the resource allocation model and policy that serves as the framework for future planning, budgeting, pricing for the City’s parks, recreation, and community services. This study included assistance in a more focused and robust public outreach effort to facilitate an outcome that reflects City Council goals, the mission and vision of the Department, and values of the community. The study provides justifiable, articulated, and agreed upon pricing rationale that can be used to allocate resources and establish pricing levels that most effectively meet community needs. Having established a well-defined Cost Allocation Policy in 2013 and refining the policy through community and staff input, and the addition of PASSTM software, the Department’s future is well prepared to meet the goal of using resource allocation and cost recovery policies to provide maximum benefit of programs, facilities, and services for the residents of the City of Alexandria. The implementation of the recommendations contained in this study and the continued use of the PASS® software will help the Department determine how recreation programs and services can be priced and managed to operate cost effectively while ensuring that fees for programs and services are realistic. The outcome of following these recommendations will be improved operational efficiency, and policies which will be easy to follow and adhere to as well as being easy to explain to the public. It has been our pleasure to assist the City of Alexandria RPCA in evolving its sustainability efforts.
Resource Allocation + Cost Recovery = Maximum Benefit Provided Jim Spengler, Director Department of Recreation, Parks & Cultural Activities

THIS PAGE INTENTIONALLY LEFT BLANK
Resource Allocation Study 39
APPENDIX A: GLOSSARY OF KEY COST RECOVERY TERMS Ability to Pay: wherewithal to exchange cash for service based on an individual’s financial circumstances; it is not related to who benefits from programs and services. Activity: specific program or service offered by the Department. Actual expenditures and revenues: fiscal year reporting from a completed fiscal year of operation. Alternative Funding: other ways to increase cost recovery in addition to fees and charges; may include grants, sponsorships, partnerships, fundraising, and volunteers. Benchmarking: comparison of certain attributes of the Department’s management practices, fee structure, and fees; also known as comparative analysis. Benefit: degree to which services (including programs, facilities and parks) impact the public (individual and community), or in other words, the results or outcomes of services.
• Community Benefit: economic, environmental, social value; maintains or improves quality of life for the taxpaying community in general
• Individual Benefit: skill building, entertainment, exclusive use, relationship building, financial gain, etc.
Benefits Filter: a set of criteria, used in cost recovery models to evaluate services, that delineates between the value that accrues to the community as a whole and the value that accrues to an individual or individual group when a service is received. Best Practice: professional procedures that are accepted or prescribed as being correct or most effective. Budgeted Expenditures and Forecast of Revenues: projection of anticipated expenditures and revenues for a fiscal year. Category of Service: a collection of activities offered through the Community Services Department combined based on similarity in type of activity, target market, and/or desired outcome. Comparative Analysis: comparison of certain attributes of the Department’s management practices, fee structure, and fees; also known as benchmarking. Competitive Pricing: setting the price of a product or service based on what the competition or alternative providers are charging. Core services: activities and services that satisfy an agency’s mission and vision, typically benefiting all community members.
40 Alexandria Department of Recreation, Parks and Cultural Activities
Cost: specific, identifiable expenses (fixed and variable) associated with providing a service. • Direct Costs: budgeted costs associated with providing programs including:
Instructor(s) or Program leader(s) (contract and/or staff) Supervision of the program staff and/or contractor(s) Supplies (office and disposable/consumable) Telephone, postage, and duplicating (specifically identified) Vehicle leases/rentals and local mileage reimbursement Division or section management Special training
• Indirect Costs: costs related to general support of programs within the section, and other general costs that are specifically related to program activities. Costs included at this level are allocated to each activity/program according to the size of the program’s budget based on the largest cost category of personnel (i.e., costs are allocated on a “percentage of budget” basis). Division or section administrative support staff Advertising and publications Public information and assistance Registration handling/processing Facility maintenance (including associated other Department costs)
• Overhead Costs: costs incurred by the Department or the City for the overall administration and management of the Department. These costs are allocated to all departmental programs and activities, based on size of the personnel budget, and might include: Department Director and Managers Department or City administrative support services (Clerical, Budget, Finance, HR
and Special Projects) Departmental portion of shared costs of the facilities fund and operations;
Telephone, postage, and duplicating; Strategic Technology Plan • Full Cost or True Cost Department’s direct, indirect, and overhead cost • Net Cost: a calculation of expenses minus revenue generated by a service or collection of
services Cost Recovery Model: a framework with a philosophical underpinning that guides the Department’s pricing for programs and services. Cost Recovery Rate: the performance metric for cost recovery, expressed as a percentage (revenue divided by expense). Cost Recovery Target: a goal set for the performance metric, such as percentage of cost recovery. Exclusive Use: scheduled, planned, or programmed use of a facility or space that is limited or restricted to an identified individual or group for a specified period of time. Fee or Price: the amount charged to the customer for the service. Fee Reduction: a waiver or discount in fee, allowed by policy, to best fulfill the mission of the City and its residents.
Resource Allocation Study 41
Gross Revenue: all of the income from a transaction or delivery of a service before any commission is recognized and/or before a supplier receives some of the sales revenue, such as when a contractor receives the total (gross) revenue and passes along the percent of that amount owed to the City by contract. Market Rate Fee: fee based on demand for a service or facility. One consideration for establishing a market rate fee is determined by identifying all providers of an identical service (i.e. private sector providers, other municipalities, etc.), and setting the highest fee. Another consideration is setting the fee at the highest level the market will bear. Marketplace Comparisons: identification of what other public agencies and/or private companies charge for the same or similar programs or activities. Mission: a clear and concise formal summary of the purpose, aims, and values of the organization. Non-Resident: A person who does not meet a verification qualification or test established by the jurisdiction. Non-Fee-Based Programs: activities for which it has been determined that no fee will be charged. Outcome-Based Activities: activities designed with goals to be achieved; by the end of the recreational or educational experience, each participant should have achieved the goals. Performance Measures: quantifiable evaluations of the organization's key performance areas on a pre-determined set of criteria measured over time. The agreed upon standard performance measures allows the organization to judge its progress over time (internal and external benchmarking) and identify areas of strength and weakness. Performance Metric: an agreed upon standard for measurement of performance such as a cost recovery rate. Pricing Philosophy: theoretical reasoning behind the structural model used to assign fees to activities. Resource Allocation: how appropriated tax dollars and alternative sources of funding are determined to be used by an agency in its delivery of services. Revenue Streams: the variety of sources from which revenue is generated to support all operations of an organization; may include property, sales, or other tax sources, as well as fees and charges, grants, donations, partnerships, and other alternatives. Scholarship: registration subsidies to income-eligible residents to facilitate their participation in limited programs and activities. Services Assessment: a detailed look at services and service delivery strategies to assist in determining what activities should be advanced, affirmed, changed, or divested (discontinued by the agency).
42 Alexandria Department of Recreation, Parks and Cultural Activities
Special Populations: groups of people with unique needs to which the Department may target services such as seniors, people with disabilities, economically disadvantaged, etc. Subsidy: taxes and other vehicles that are used to financially support Department services including programs, facilities, and parks. Subsidy dollars provide for service costs (direct and/or indirect) that are not covered by user or participant fees, or other forms of alternative funding. Subsidy Allocation: how appropriated tax dollars are determined to be used by an agency in its delivery of services. Target Market: a particular segment of the population at which a product or service is aimed. Tiers: levels that provide the framework for the cost recovery model that function to define categories of activities by outcomes or benefits and target markets.
Resource Allocation Study 43
APPENDIX B: THE PYRAMID METHODOLOGY The Pyramid methodology used in development of the Resource Allocation and Cost Recovery Model is built on a foundation of understanding who is benefiting from park and recreation services to determine how the costs for service should be paid. The model illustrates a pricing philosophy based on establishing fees commensurate with the benefit received. Descriptions regarding each level of the pyramid are provided; however, the model is intended as a discussion point and is very dependent on agency philosophies to determine which programs and services belong on each level. Cultural, regional, geographical, and resource differences play a large role in this determination. The resulting pyramid is unique to each agency that applies this methodology. Application of the pyramid methodology begins with the mission of the organization, but must also address other considerations:
• Who benefits from the service, the community in general or only the individual or group receiving the service?
• Does the individual or group receiving the service generate the need (and therefore the cost) of providing the service?
• Will imposing the full cost fee pose a hardship on specific users? (The ability to pay is different than the benefit and value of a program, activity, or service, and therefore, should be dealt with during the implementation phase of pricing, discounted fees, and marketing.)
• Do community values support taxpayer investment for the cost of service for individuals with special needs (for example, people with disabilities or low-income)?
• Will the level of the fee affect the demand for the service? • Is it possible and desirable to manage demand for a service by changing the level of the fee? • Are there competing providers of the service in the public or private sector?
The application of the model is broken down into the following steps:
Step 1: Building on your organization’s values, vision, and mission Step 2: Understanding the Pyramid Methodology, the benefits filter, and secondary filters Step 3: Developing the organization’s Categories of Service Step 4: Sorting the Categories of Service onto the Pyramid Step 5: Defining Direct and Indirect Costs Step 6: Determining (or confirming) current tax investment/cost recovery levels Step 7: Establishing cost recovery/tax investment goals Step 8: Understanding and Preparing for Influential Factors and Considerations Step 9: Implementation Step 10: Evaluation
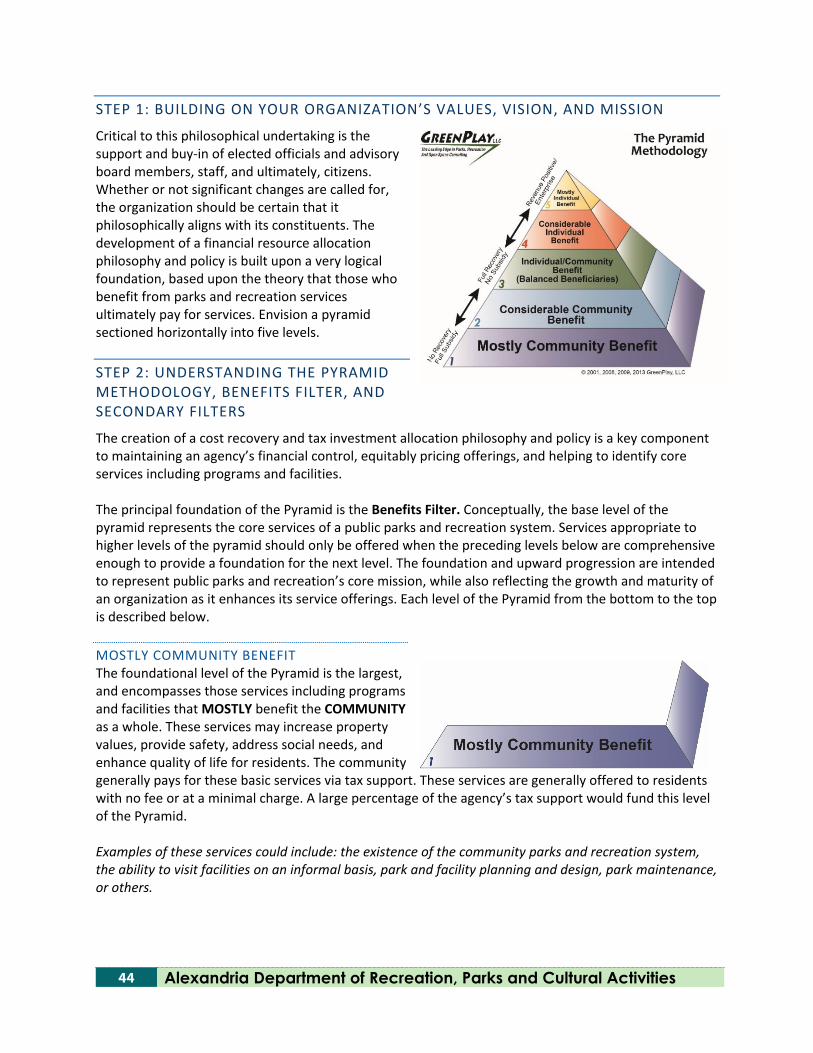
44 Alexandria Department of Recreation, Parks and Cultural Activities
STEP 1: BUILDING ON YOUR ORGANIZATION’S VALUES, VISION, AND MISSION
Critical to this philosophical undertaking is the support and buy-in of elected officials and advisory board members, staff, and ultimately, citizens. Whether or not significant changes are called for, the organization should be certain that it philosophically aligns with its constituents. The development of a financial resource allocation philosophy and policy is built upon a very logical foundation, based upon the theory that those who benefit from parks and recreation services ultimately pay for services. Envision a pyramid sectioned horizontally into five levels. STEP 2: UNDERSTANDING THE PYRAMID METHODOLOGY, BENEFITS FILTER, AND SECONDARY FILTERS
The creation of a cost recovery and tax investment allocation philosophy and policy is a key component to maintaining an agency’s financial control, equitably pricing offerings, and helping to identify core services including programs and facilities. The principal foundation of the Pyramid is the Benefits Filter. Conceptually, the base level of the pyramid represents the core services of a public parks and recreation system. Services appropriate to higher levels of the pyramid should only be offered when the preceding levels below are comprehensive enough to provide a foundation for the next level. The foundation and upward progression are intended to represent public parks and recreation’s core mission, while also reflecting the growth and maturity of an organization as it enhances its service offerings. Each level of the Pyramid from the bottom to the top is described below. MOSTLY COMMUNITY BENEFIT The foundational level of the Pyramid is the largest, and encompasses those services including programs and facilities that MOSTLY benefit the COMMUNITY as a whole. These services may increase property values, provide safety, address social needs, and enhance quality of life for residents. The community generally pays for these basic services via tax support. These services are generally offered to residents with no fee or at a minimal charge. A large percentage of the agency’s tax support would fund this level of the Pyramid. Examples of these services could include: the existence of the community parks and recreation system, the ability to visit facilities on an informal basis, park and facility planning and design, park maintenance, or others.
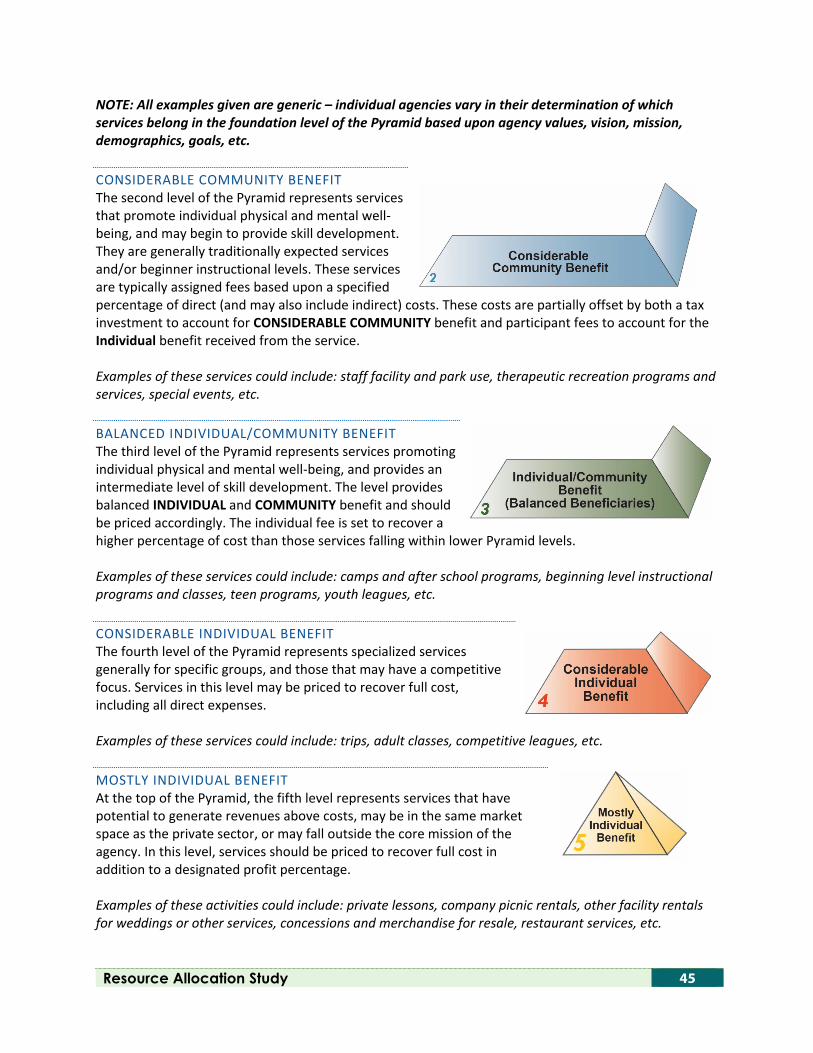
Resource Allocation Study 45
NOTE: All examples given are generic – individual agencies vary in their determination of which services belong in the foundation level of the Pyramid based upon agency values, vision, mission, demographics, goals, etc. CONSIDERABLE COMMUNITY BENEFIT The second level of the Pyramid represents services that promote individual physical and mental well-being, and may begin to provide skill development. They are generally traditionally expected services and/or beginner instructional levels. These services are typically assigned fees based upon a specified percentage of direct (and may also include indirect) costs. These costs are partially offset by both a tax investment to account for CONSIDERABLE COMMUNITY benefit and participant fees to account for the Individual benefit received from the service. Examples of these services could include: staff facility and park use, therapeutic recreation programs and services, special events, etc. BALANCED INDIVIDUAL/COMMUNITY BENEFIT The third level of the Pyramid represents services promoting individual physical and mental well-being, and provides an intermediate level of skill development. The level provides balanced INDIVIDUAL and COMMUNITY benefit and should be priced accordingly. The individual fee is set to recover a higher percentage of cost than those services falling within lower Pyramid levels. Examples of these services could include: camps and after school programs, beginning level instructional programs and classes, teen programs, youth leagues, etc. CONSIDERABLE INDIVIDUAL BENEFIT The fourth level of the Pyramid represents specialized services generally for specific groups, and those that may have a competitive focus. Services in this level may be priced to recover full cost, including all direct expenses. Examples of these services could include: trips, adult classes, competitive leagues, etc. MOSTLY INDIVIDUAL BENEFIT At the top of the Pyramid, the fifth level represents services that have potential to generate revenues above costs, may be in the same market space as the private sector, or may fall outside the core mission of the agency. In this level, services should be priced to recover full cost in addition to a designated profit percentage. Examples of these activities could include: private lessons, company picnic rentals, other facility rentals for weddings or other services, concessions and merchandise for resale, restaurant services, etc.
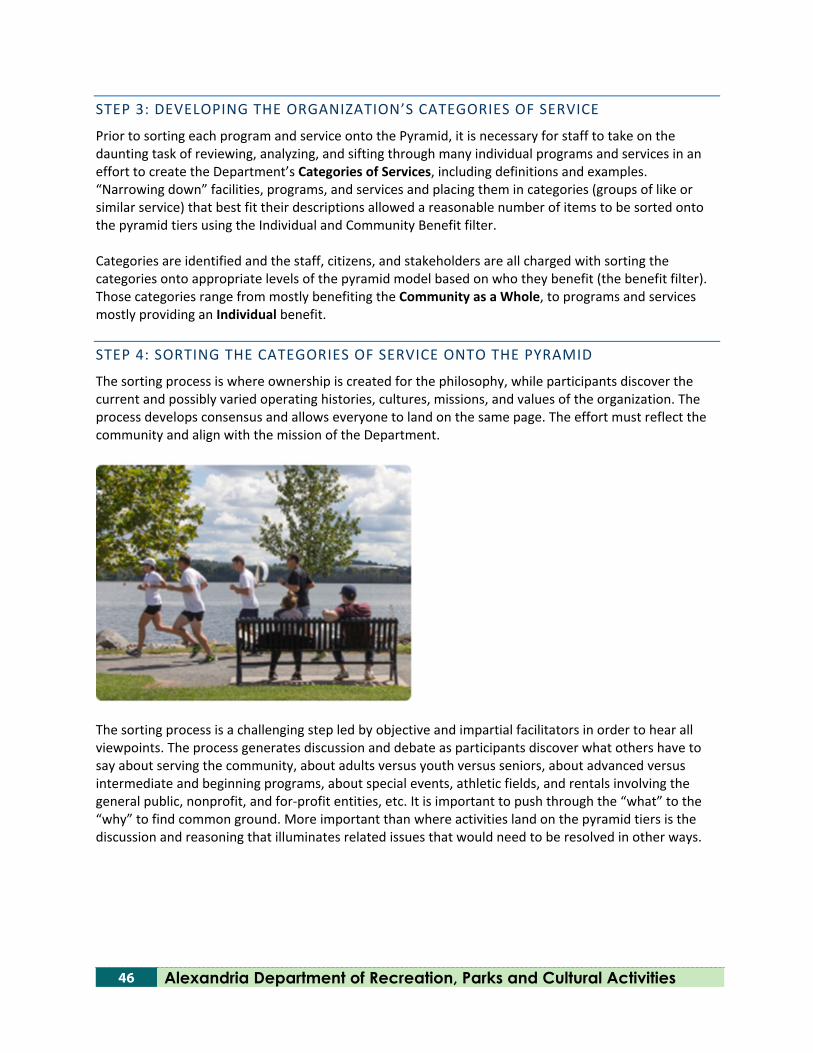
46 Alexandria Department of Recreation, Parks and Cultural Activities
STEP 3: DEVELOPING THE ORGANIZATION’S CATEGORIES OF SERVICE
Prior to sorting each program and service onto the Pyramid, it is necessary for staff to take on the daunting task of reviewing, analyzing, and sifting through many individual programs and services in an effort to create the Department’s Categories of Services, including definitions and examples. “Narrowing down” facilities, programs, and services and placing them in categories (groups of like or similar service) that best fit their descriptions allowed a reasonable number of items to be sorted onto the pyramid tiers using the Individual and Community Benefit filter. Categories are identified and the staff, citizens, and stakeholders are all charged with sorting the categories onto appropriate levels of the pyramid model based on who they benefit (the benefit filter). Those categories range from mostly benefiting the Community as a Whole, to programs and services mostly providing an Individual benefit. STEP 4: SORTING THE CATEGORIES OF SERVICE ONTO THE PYRAMID
The sorting process is where ownership is created for the philosophy, while participants discover the current and possibly varied operating histories, cultures, missions, and values of the organization. The process develops consensus and allows everyone to land on the same page. The effort must reflect the community and align with the mission of the Department.
The sorting process is a challenging step led by objective and impartial facilitators in order to hear all viewpoints. The process generates discussion and debate as participants discover what others have to say about serving the community, about adults versus youth versus seniors, about advanced versus intermediate and beginning programs, about special events, athletic fields, and rentals involving the general public, nonprofit, and for-profit entities, etc. It is important to push through the “what” to the “why” to find common ground. More important than where activities land on the pyramid tiers is the discussion and reasoning that illuminates related issues that would need to be resolved in other ways.
Resource Allocation Study 47
STEP 5: DEFINING COSTS
The definition of direct and indirect costs can vary from agency to agency. The most important aspect to understand is that all costs associated with directly running a program or providing a service are identified and consistently applied across the system. Direct costs typically include the specific, identifiable expenses (fixed and variable) associated with providing a service. These expenses would not exist without the service and may be variable costs. Indirect costs and Department overhead are costs that are shared among programs and services and are therefore allocated in an appropriate manner in order to identify the true cost of providing services. STEP 6: DETERMINING (OR CONFIRMING) CURRENT TAX INVESTMENT/COST RECOVERY LEVELS
This establishes the expectation that the agency will confirm or determine current cost recovery and subsidy allocation levels by category of services based upon the definition of costs. Consideration of revenue sources and services costs is included in this step. For example, in an agency the size of the City of Alexandria, staff may not be cost accounting consistently, and these inconsistencies become apparent. Results of this step identify what it costs to provide services to the community, whether staff has the capacity or resources necessary to account for and track costs, whether accurate cost recovery levels can be identified, and whether cost centers or general ledger line items align with how the agency may want to track these costs in the future. The overall tax investment/cost recovery level is comprised of the average of everything in all of the tiers together as a whole. This step identifies what the current tax investment level is for the programs sorted into each tier. There may be quite a range within each tier, and some programs could overlap with other tiers of the pyramid. This is rectified as implementation of recommendations occurs. STEP 7: ESTABLISHING COST RECOVERY/TAX INVESTMENT TARGETS
The project team has worked to align who is benefiting from programs and services with the sources of funding used to pay for them. The tax investment is used in greater amounts at the bottom levels of the pyramid, reflecting the benefit to the Community as a whole. As the pyramid is climbed, the percentage of tax investment decreases, and at the top levels, it may not be used at all, reflecting the Individual benefit. Targets take into account current cost recovery levels. As costing of services and matching revenues is a very revealing process, realistic and feasible targets will be recommended to align with the pyramid model and also to meet specific financial objectives for recovery of direct and indirect cost. STEP 8: UNDERSTANDING AND PREPARING FOR INFLUENTIAL FACTORS AND CONSIDERATIONS
Inherent to sorting programs onto the Pyramid model using the Benefits and other filters is the realization that other factors come into play. This can result in decisions to place services in other levels than might first be thought. These factors can aid in determining core services versus ancillary services. These factors include participant commitment, trends, political issues, marketing, relative cost to provide the service (cost per participant), current economic conditions, and financial goals.
48 Alexandria Department of Recreation, Parks and Cultural Activities
STEP 9: IMPLEMENTATION
The Department set its goals based upon values, vision, mission, stakeholder input, funding, and/or other criteria. Upon completion of steps 1-8 in 2013, the Department positioned itself to illustrate and articulate where it had been and where it was heading from a financial perspective. Evaluation of the past five years and examination of current conditions has resulted in new recommendations. Some are scheduled to occur immediately, and others will take time to put into place, while some will be implemented incrementally. It is important that fee change tolerance levels are considered. STEP 10: EVALUATION
This process was originally undertaken in order to articulate a philosophy, train staff on a best practice, ongoing approach to resource allocation and cost recovery in public parks and recreation, and enhance financial sustainability. Performance measures were established through cost recovery targets, specific recommendations made for services found to be out of alignment, and evaluation of goal attainment was recommended to take place annually. As this has been evaluated informally over the past five years and now formally through this study, new recommendations will be implemented and evaluation will need to continue to assure that the application of the philosophy and policy is consistent and productive.
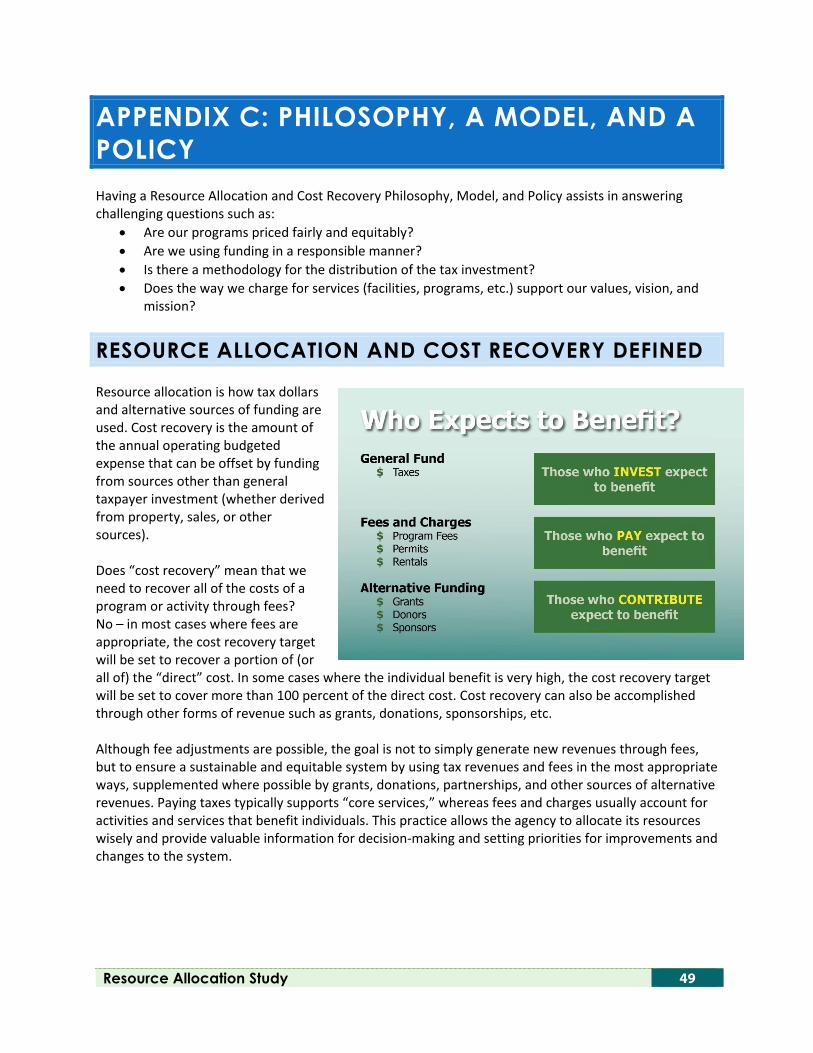
Resource Allocation Study 49
APPENDIX C: PHILOSOPHY, A MODEL, AND A POLICY Having a Resource Allocation and Cost Recovery Philosophy, Model, and Policy assists in answering challenging questions such as:
• Are our programs priced fairly and equitably? • Are we using funding in a responsible manner? • Is there a methodology for the distribution of the tax investment? • Does the way we charge for services (facilities, programs, etc.) support our values, vision, and
mission?
RESOURCE ALLOCATION AND COST RECOVERY DEFINED
Resource allocation is how tax dollars and alternative sources of funding are used. Cost recovery is the amount of the annual operating budgeted expense that can be offset by funding from sources other than general taxpayer investment (whether derived from property, sales, or other sources). Does “cost recovery” mean that we need to recover all of the costs of a program or activity through fees? No – in most cases where fees are appropriate, the cost recovery target will be set to recover a portion of (or all of) the “direct” cost. In some cases where the individual benefit is very high, the cost recovery target will be set to cover more than 100 percent of the direct cost. Cost recovery can also be accomplished through other forms of revenue such as grants, donations, sponsorships, etc. Although fee adjustments are possible, the goal is not to simply generate new revenues through fees, but to ensure a sustainable and equitable system by using tax revenues and fees in the most appropriate ways, supplemented where possible by grants, donations, partnerships, and other sources of alternative revenues. Paying taxes typically supports “core services,” whereas fees and charges usually account for activities and services that benefit individuals. This practice allows the agency to allocate its resources wisely and provide valuable information for decision-making and setting priorities for improvements and changes to the system.
50 Alexandria Department of Recreation, Parks and Cultural Activities
SUPPLEMENTING TAXES WITH FEES
Parks and Recreation services provide value to the community in terms of economic, environmental, and social benefits. Tax dollars support these “core services.” Beyond those benefits realized by all residents, the agency is also able to provide specific activities and services that benefit individuals. There are not adequate tax dollars to completely support this level of activity, and it is appropriate and common to charge at least minimally for these services. For example, if an individual takes a swimming lesson or participates in a senior trip, there are certain levels of skill building, social engagement, or entertainment that accrue to that person, but it can still be argued there is a benefit to the community as a whole by teaching people safety around water, and through the social capital and health gained by keeping seniors active and in touch. This warrants covering at least a portion of the cost of a program or activity through an individual fee. Other opportunities, such as the rental of a space for a private party, warrant a fee to cover the entire cost of providing that space.
CORE SERVICES
Core services satisfy an agency’s mission and vision, typically benefiting all community members. It is not necessary that an individual participate in a specific recreational or cultural activity, or even step into a park setting to receive benefit. For example, having a nice park and trail system with trees, open space, and recreational amenities available in the community adds to home values and a quality living environment. Core services also provide opportunity for partaking in activity, contribute to clean air, and provide relief from urban density. To achieve these and other outcomes, an agency invests its tax dollars in these core services.
A SUSTAINABLE AND EQUITABLE SYSTEM
The sustainability and equitability of RPCA is influenced by the ability to satisfy community demand, use tax revenues equitably, and provide specialized, high-quality services when they are justified by community participation. Sustainability is a very popular and perhaps overused word. Often, the users have in mind only one of the three basic elements of sustainability – Financial or Economic, Environmental, and Social or Recreational – making it very challenging to come to any kind of consensus when others may be focusing on one of the other elements. In order to manage the system of parks and recreation, all elements of sustainability must be balanced. The financial resources must be adequate to maintain the system into the future, the environment we love so dearly cannot be “loved to death,” and the people must be allowed appropriate use of the system to properly connect to and understand the value represented, creating stewardship while promoting the other benefits of physical activity and mental/emotional engagement. When all three are attended to, a dynamic, yet sustainable system is possible.
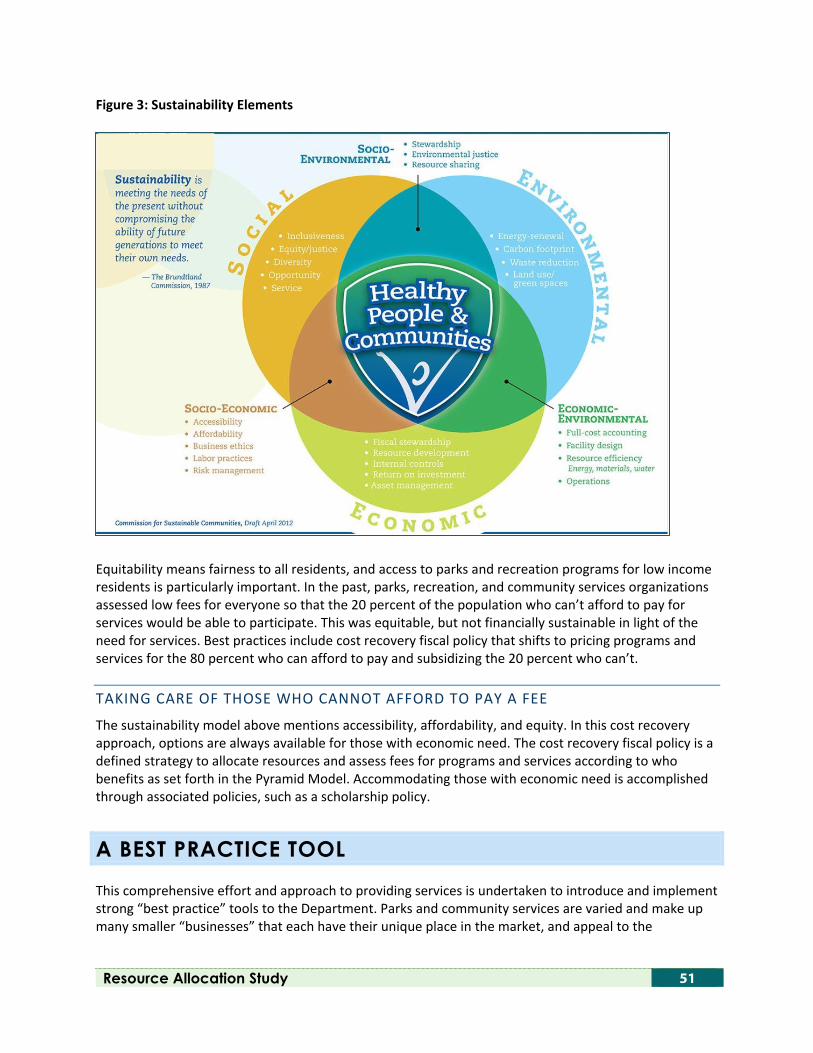
Resource Allocation Study 51
Figure 3: Sustainability Elements
Equitability means fairness to all residents, and access to parks and recreation programs for low income residents is particularly important. In the past, parks, recreation, and community services organizations assessed low fees for everyone so that the 20 percent of the population who can’t afford to pay for services would be able to participate. This was equitable, but not financially sustainable in light of the need for services. Best practices include cost recovery fiscal policy that shifts to pricing programs and services for the 80 percent who can afford to pay and subsidizing the 20 percent who can’t. TAKING CARE OF THOSE WHO CANNOT AFFORD TO PAY A FEE
The sustainability model above mentions accessibility, affordability, and equity. In this cost recovery approach, options are always available for those with economic need. The cost recovery fiscal policy is a defined strategy to allocate resources and assess fees for programs and services according to who benefits as set forth in the Pyramid Model. Accommodating those with economic need is accomplished through associated policies, such as a scholarship policy.
A BEST PRACTICE TOOL
This comprehensive effort and approach to providing services is undertaken to introduce and implement strong “best practice” tools to the Department. Parks and community services are varied and make up many smaller “businesses” that each have their unique place in the market, and appeal to the
52 Alexandria Department of Recreation, Parks and Cultural Activities
population in myriad ways. The goal of this plan is to provide a framework for allocation of resources, budgeting, pricing, and future planning for a vibrant community. Examining policies and rules that affect desired outcomes is necessary to achieve these goals. Having measures of performance are the indicator that you are accomplishing the goals you set out to achieve. A COMMON LANGUAGE
In order to fully understand and discuss the philosophy, model, and policy, we must have a common language. Definitions of key terms are found in Appendix A. DETERMINING THE COST OF A PROGRAM OR ACTIVITY
Dollars spent are accounted for specifically by programs and services offered. “Direct” costs include easily tracked expenses such as the cost of an instructor, including benefits, supplies needed, equipment rented, services needed for that particular service, etc. “Indirect” and “overhead” costs within the Department are shared among several programs or services within a division. Indirect costs are costs related to general support of programs within the section. Overhead costs are costs incurred by the Department or the City for overall administration and management of the Department. These costs are allocated to each activity/program according to the size of the program’s budget based on the largest cost category of personnel (i.e., costs are allocated on a “percentage of budget” basis).
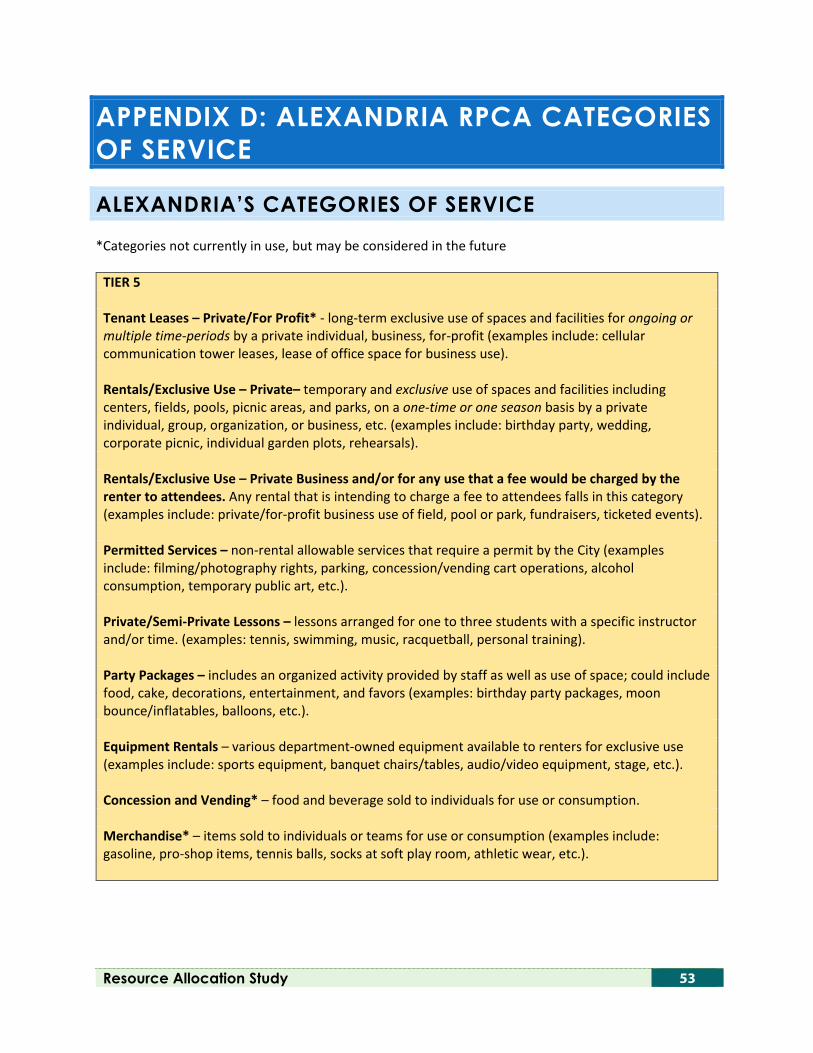
Resource Allocation Study 53
APPENDIX D: ALEXANDRIA RPCA CATEGORIES OF SERVICE
ALEXANDRIA’S CATEGORIES OF SERVICE
*Categories not currently in use, but may be considered in the future
TIER 5 Tenant Leases – Private/For Profit* - long-term exclusive use of spaces and facilities for ongoing or multiple time-periods by a private individual, business, for-profit (examples include: cellular communication tower leases, lease of office space for business use). Rentals/Exclusive Use – Private– temporary and exclusive use of spaces and facilities including centers, fields, pools, picnic areas, and parks, on a one-time or one season basis by a private individual, group, organization, or business, etc. (examples include: birthday party, wedding, corporate picnic, individual garden plots, rehearsals). Rentals/Exclusive Use – Private Business and/or for any use that a fee would be charged by the renter to attendees. Any rental that is intending to charge a fee to attendees falls in this category (examples include: private/for-profit business use of field, pool or park, fundraisers, ticketed events). Permitted Services – non-rental allowable services that require a permit by the City (examples include: filming/photography rights, parking, concession/vending cart operations, alcohol consumption, temporary public art, etc.). Private/Semi-Private Lessons – lessons arranged for one to three students with a specific instructor and/or time. (examples: tennis, swimming, music, racquetball, personal training). Party Packages – includes an organized activity provided by staff as well as use of space; could include food, cake, decorations, entertainment, and favors (examples: birthday party packages, moon bounce/inflatables, balloons, etc.). Equipment Rentals – various department-owned equipment available to renters for exclusive use (examples include: sports equipment, banquet chairs/tables, audio/video equipment, stage, etc.). Concession and Vending* – food and beverage sold to individuals for use or consumption. Merchandise* – items sold to individuals or teams for use or consumption (examples include: gasoline, pro-shop items, tennis balls, socks at soft play room, athletic wear, etc.).
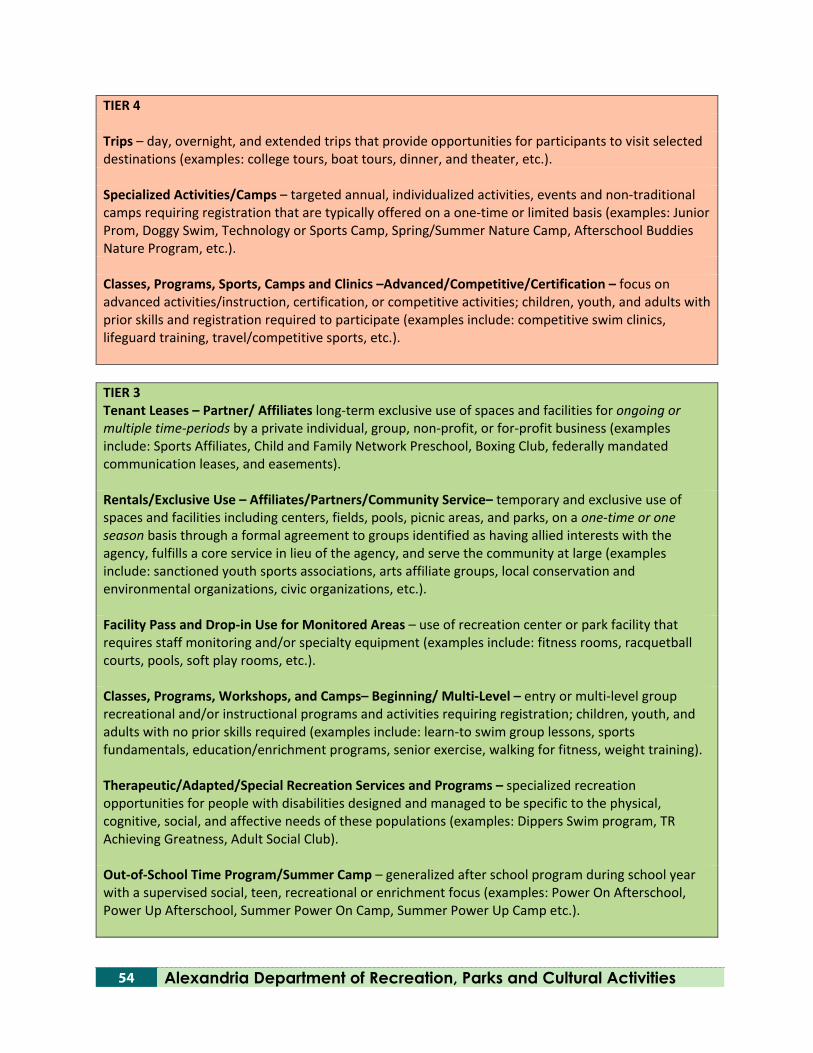
54 Alexandria Department of Recreation, Parks and Cultural Activities
TIER 4 Trips – day, overnight, and extended trips that provide opportunities for participants to visit selected destinations (examples: college tours, boat tours, dinner, and theater, etc.). Specialized Activities/Camps – targeted annual, individualized activities, events and non-traditional camps requiring registration that are typically offered on a one-time or limited basis (examples: Junior Prom, Doggy Swim, Technology or Sports Camp, Spring/Summer Nature Camp, Afterschool Buddies Nature Program, etc.). Classes, Programs, Sports, Camps and Clinics –Advanced/Competitive/Certification – focus on advanced activities/instruction, certification, or competitive activities; children, youth, and adults with prior skills and registration required to participate (examples include: competitive swim clinics, lifeguard training, travel/competitive sports, etc.).
TIER 3 Tenant Leases – Partner/ Affiliates long-term exclusive use of spaces and facilities for ongoing or multiple time-periods by a private individual, group, non-profit, or for-profit business (examples include: Sports Affiliates, Child and Family Network Preschool, Boxing Club, federally mandated communication leases, and easements). Rentals/Exclusive Use – Affiliates/Partners/Community Service– temporary and exclusive use of spaces and facilities including centers, fields, pools, picnic areas, and parks, on a one-time or one season basis through a formal agreement to groups identified as having allied interests with the agency, fulfills a core service in lieu of the agency, and serve the community at large (examples include: sanctioned youth sports associations, arts affiliate groups, local conservation and environmental organizations, civic organizations, etc.). Facility Pass and Drop-in Use for Monitored Areas – use of recreation center or park facility that requires staff monitoring and/or specialty equipment (examples include: fitness rooms, racquetball courts, pools, soft play rooms, etc.). Classes, Programs, Workshops, and Camps– Beginning/ Multi-Level – entry or multi-level group recreational and/or instructional programs and activities requiring registration; children, youth, and adults with no prior skills required (examples include: learn-to swim group lessons, sports fundamentals, education/enrichment programs, senior exercise, walking for fitness, weight training). Therapeutic/Adapted/Special Recreation Services and Programs – specialized recreation opportunities for people with disabilities designed and managed to be specific to the physical, cognitive, social, and affective needs of these populations (examples: Dippers Swim program, TR Achieving Greatness, Adult Social Club). Out-of-School Time Program/Summer Camp – generalized after school program during school year with a supervised social, teen, recreational or enrichment focus (examples: Power On Afterschool, Power Up Afterschool, Summer Power On Camp, Summer Power Up Camp etc.).
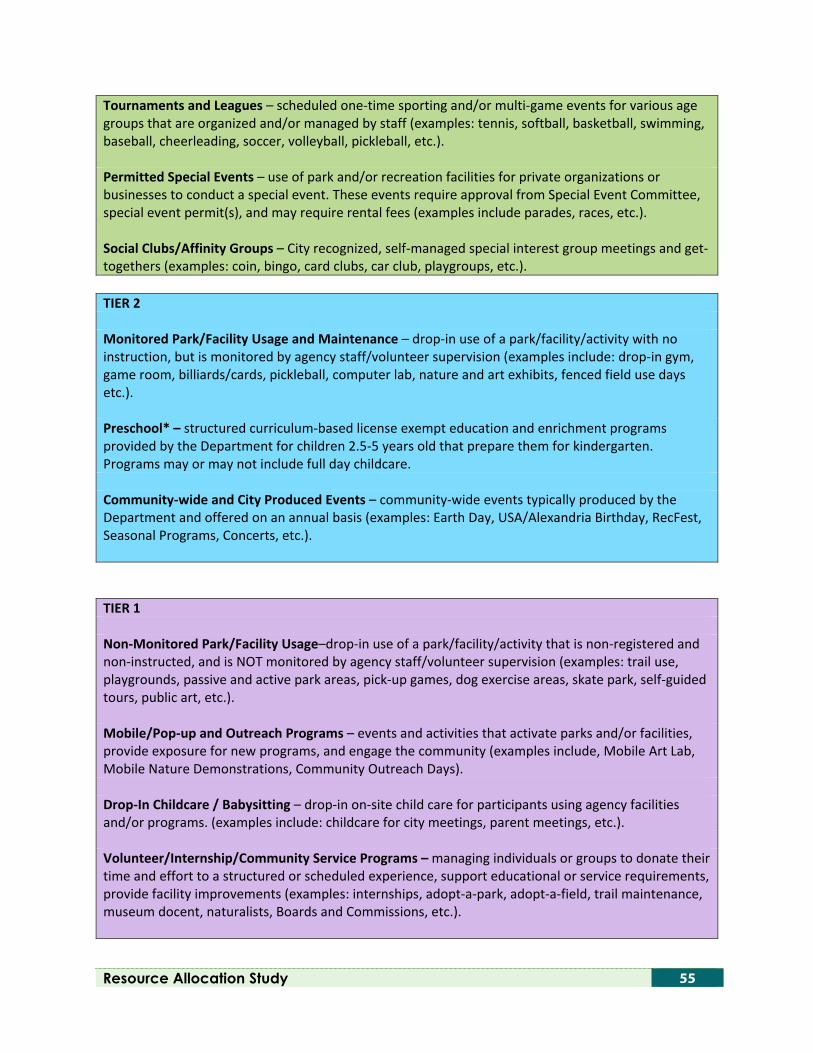
Resource Allocation Study 55
Tournaments and Leagues – scheduled one-time sporting and/or multi-game events for various age groups that are organized and/or managed by staff (examples: tennis, softball, basketball, swimming, baseball, cheerleading, soccer, volleyball, pickleball, etc.). Permitted Special Events – use of park and/or recreation facilities for private organizations or businesses to conduct a special event. These events require approval from Special Event Committee, special event permit(s), and may require rental fees (examples include parades, races, etc.). Social Clubs/Affinity Groups – City recognized, self-managed special interest group meetings and get-togethers (examples: coin, bingo, card clubs, car club, playgroups, etc.).
TIER 2 Monitored Park/Facility Usage and Maintenance – drop-in use of a park/facility/activity with no instruction, but is monitored by agency staff/volunteer supervision (examples include: drop-in gym, game room, billiards/cards, pickleball, computer lab, nature and art exhibits, fenced field use days etc.). Preschool* – structured curriculum-based license exempt education and enrichment programs provided by the Department for children 2.5-5 years old that prepare them for kindergarten. Programs may or may not include full day childcare. Community-wide and City Produced Events – community-wide events typically produced by the Department and offered on an annual basis (examples: Earth Day, USA/Alexandria Birthday, RecFest, Seasonal Programs, Concerts, etc.).
TIER 1 Non-Monitored Park/Facility Usage–drop-in use of a park/facility/activity that is non-registered and non-instructed, and is NOT monitored by agency staff/volunteer supervision (examples: trail use, playgrounds, passive and active park areas, pick-up games, dog exercise areas, skate park, self-guided tours, public art, etc.). Mobile/Pop-up and Outreach Programs – events and activities that activate parks and/or facilities, provide exposure for new programs, and engage the community (examples include, Mobile Art Lab, Mobile Nature Demonstrations, Community Outreach Days). Drop-In Childcare / Babysitting – drop-in on-site child care for participants using agency facilities and/or programs. (examples include: childcare for city meetings, parent meetings, etc.). Volunteer/Internship/Community Service Programs – managing individuals or groups to donate their time and effort to a structured or scheduled experience, support educational or service requirements, provide facility improvements (examples: internships, adopt-a-park, adopt-a-field, trail maintenance, museum docent, naturalists, Boards and Commissions, etc.).

THIS PAGE INTENTIONALLY LEFT BLANK
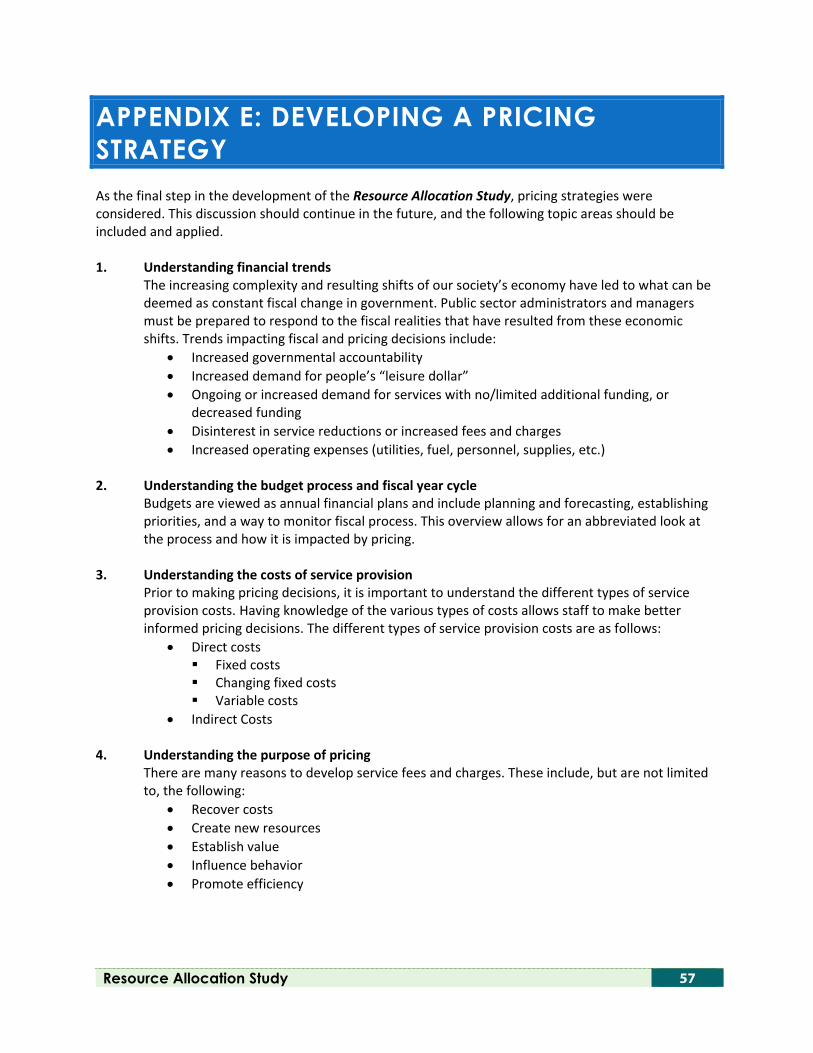
Resource Allocation Study 57
APPENDIX E: DEVELOPING A PRICING STRATEGY As the final step in the development of the Resource Allocation Study, pricing strategies were considered. This discussion should continue in the future, and the following topic areas should be included and applied. 1. Understanding financial trends
The increasing complexity and resulting shifts of our society’s economy have led to what can be deemed as constant fiscal change in government. Public sector administrators and managers must be prepared to respond to the fiscal realities that have resulted from these economic shifts. Trends impacting fiscal and pricing decisions include:
• Increased governmental accountability • Increased demand for people’s “leisure dollar” • Ongoing or increased demand for services with no/limited additional funding, or
decreased funding • Disinterest in service reductions or increased fees and charges • Increased operating expenses (utilities, fuel, personnel, supplies, etc.)
2. Understanding the budget process and fiscal year cycle Budgets are viewed as annual financial plans and include planning and forecasting, establishing priorities, and a way to monitor fiscal process. This overview allows for an abbreviated look at the process and how it is impacted by pricing.
3. Understanding the costs of service provision Prior to making pricing decisions, it is important to understand the different types of service provision costs. Having knowledge of the various types of costs allows staff to make better informed pricing decisions. The different types of service provision costs are as follows:
• Direct costs Fixed costs Changing fixed costs Variable costs
• Indirect Costs
4. Understanding the purpose of pricing There are many reasons to develop service fees and charges. These include, but are not limited to, the following:
• Recover costs • Create new resources • Establish value • Influence behavior • Promote efficiency
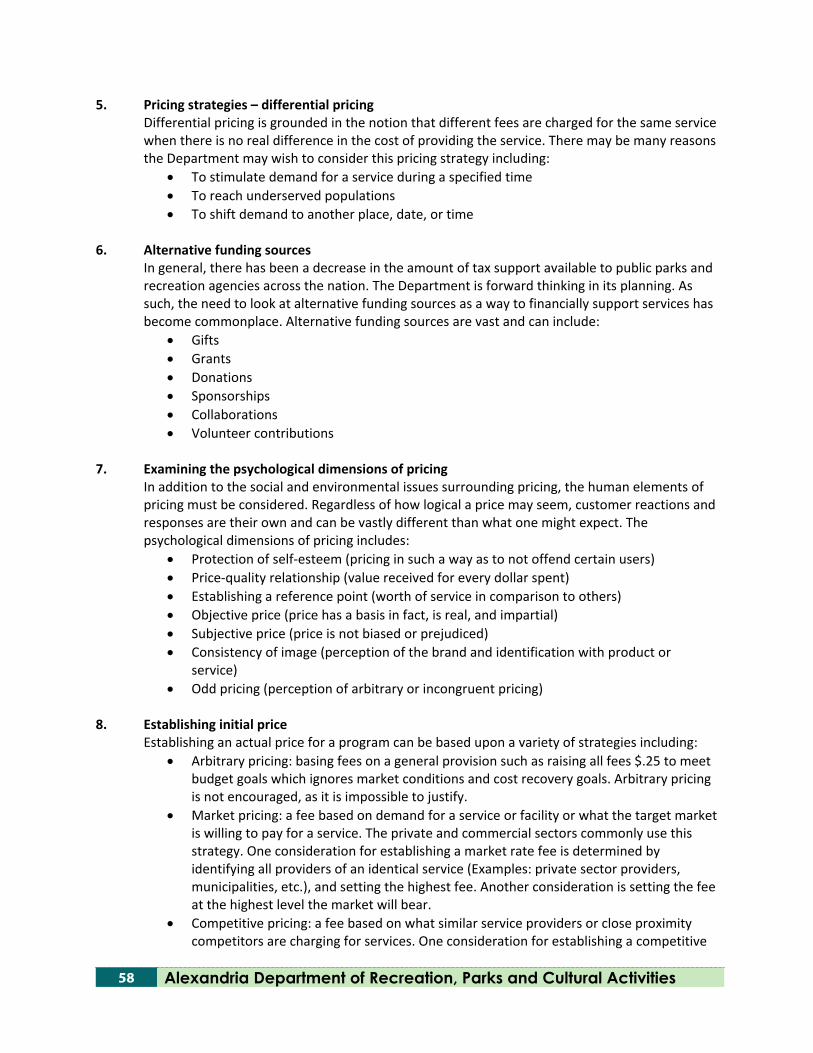
58 Alexandria Department of Recreation, Parks and Cultural Activities
5. Pricing strategies – differential pricing Differential pricing is grounded in the notion that different fees are charged for the same service when there is no real difference in the cost of providing the service. There may be many reasons the Department may wish to consider this pricing strategy including:
• To stimulate demand for a service during a specified time • To reach underserved populations • To shift demand to another place, date, or time
6. Alternative funding sources
In general, there has been a decrease in the amount of tax support available to public parks and recreation agencies across the nation. The Department is forward thinking in its planning. As such, the need to look at alternative funding sources as a way to financially support services has become commonplace. Alternative funding sources are vast and can include:
• Gifts • Grants • Donations • Sponsorships • Collaborations • Volunteer contributions
7. Examining the psychological dimensions of pricing In addition to the social and environmental issues surrounding pricing, the human elements of pricing must be considered. Regardless of how logical a price may seem, customer reactions and responses are their own and can be vastly different than what one might expect. The psychological dimensions of pricing includes:
• Protection of self-esteem (pricing in such a way as to not offend certain users) • Price-quality relationship (value received for every dollar spent) • Establishing a reference point (worth of service in comparison to others) • Objective price (price has a basis in fact, is real, and impartial) • Subjective price (price is not biased or prejudiced) • Consistency of image (perception of the brand and identification with product or
service) • Odd pricing (perception of arbitrary or incongruent pricing)
8. Establishing initial price
Establishing an actual price for a program can be based upon a variety of strategies including: • Arbitrary pricing: basing fees on a general provision such as raising all fees $.25 to meet
budget goals which ignores market conditions and cost recovery goals. Arbitrary pricing is not encouraged, as it is impossible to justify.
• Market pricing: a fee based on demand for a service or facility or what the target market is willing to pay for a service. The private and commercial sectors commonly use this strategy. One consideration for establishing a market rate fee is determined by identifying all providers of an identical service (Examples: private sector providers, municipalities, etc.), and setting the highest fee. Another consideration is setting the fee at the highest level the market will bear.
• Competitive pricing: a fee based on what similar service providers or close proximity competitors are charging for services. One consideration for establishing a competitive
Resource Allocation Study 59
fee is determined by identifying all providers of an identical service (Examples: private sector providers, municipalities, etc.), and setting the mid-point or lowest fee.
• Cost recovery pricing: a fee based on cost recovery goals within market pricing ranges. 9. Understanding price revisions
Once a price is established, there may be the need to periodically review it and examine the need for revision. In some cases, “revised” may be viewed as “increased”; therefore, a systematic approach to pricing revision is important. Factors to consider in pricing revision include:
• Customer tolerance: the degree to which small increases in price will not encounter client resistance.
• Adjustment period: the period of time where the value of the service is assessed by the customer in relation to the price increase. The value of the service from the customer’s perspective must meet or exceed the impact of the increased cost. Adjustment periods may lead to diminished participation or termination of participation altogether based upon customer loyalty and other factors.
• Customers’ perceived value of the service: the degree to which services including programs, facilities, and parks impact the public (individual and community), or in other words, the results or outcomes of services. Value is the judgment or perception of worth or the degree of usefulness or importance placed on a service by personal opinion. The intent or intention of a service is the purpose, aim, or end.
10. The pricing process – developing a method
Staff participating in the series of workshops engaged in interactive exercises that applied the cost recovery goals of their respective service areas. The workshops prompted discussions leading to recommended changes to selected current pricing practices with the intention of attaining recommended cost recovery and tax investment allocation goals and establishing a new method for setting fees and charges. This method is based upon using cost recovery goals as a primary pricing strategy, followed by either market pricing (for services with low alternative coverage – few if any alternative providers) or competitive pricing (for services with high alternative coverage – other alternative providers offer similar or like services).

THIS PAGE INTENTIONALLY LEFT BLANK

Resource Allocation Study 61
APPENDIX F: EXISTING FINANCIAL ASSISTANCE POLICY
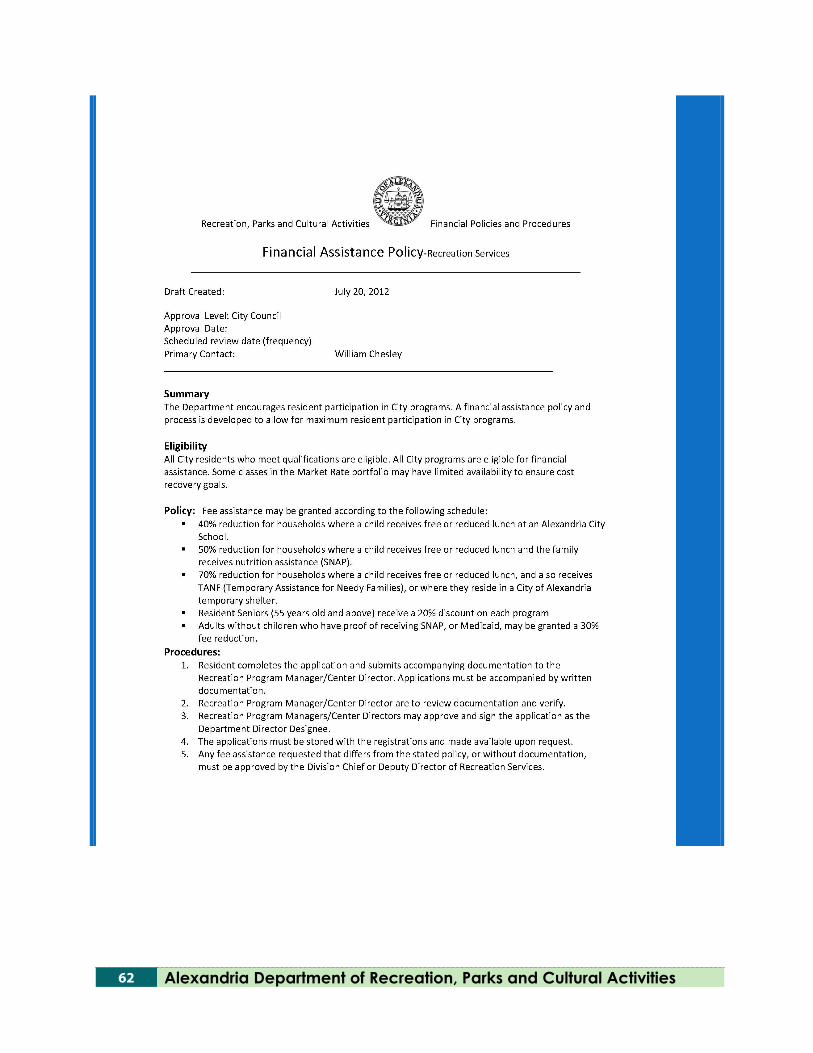
62 Alexandria Department of Recreation, Parks and Cultural Activities
Resource Allocation Study 63
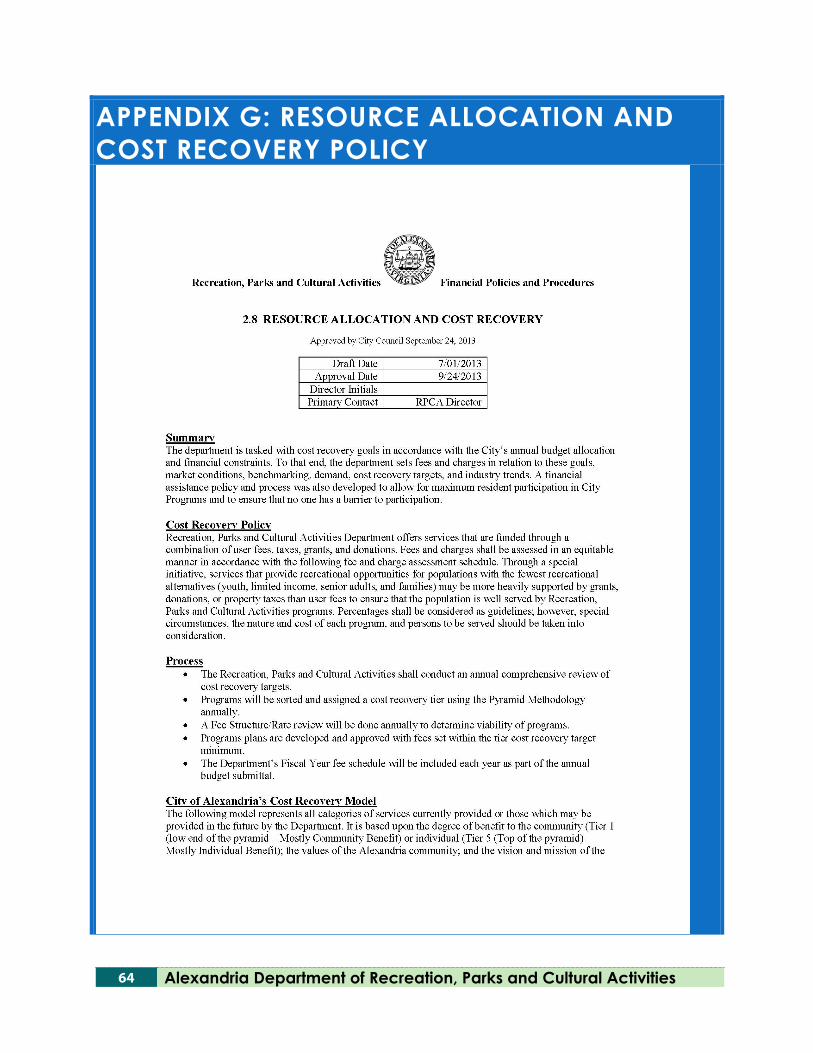
64 Alexandria Department of Recreation, Parks and Cultural Activities
APPENDIX G: RESOURCE ALLOCATION AND COST RECOVERY POLICY
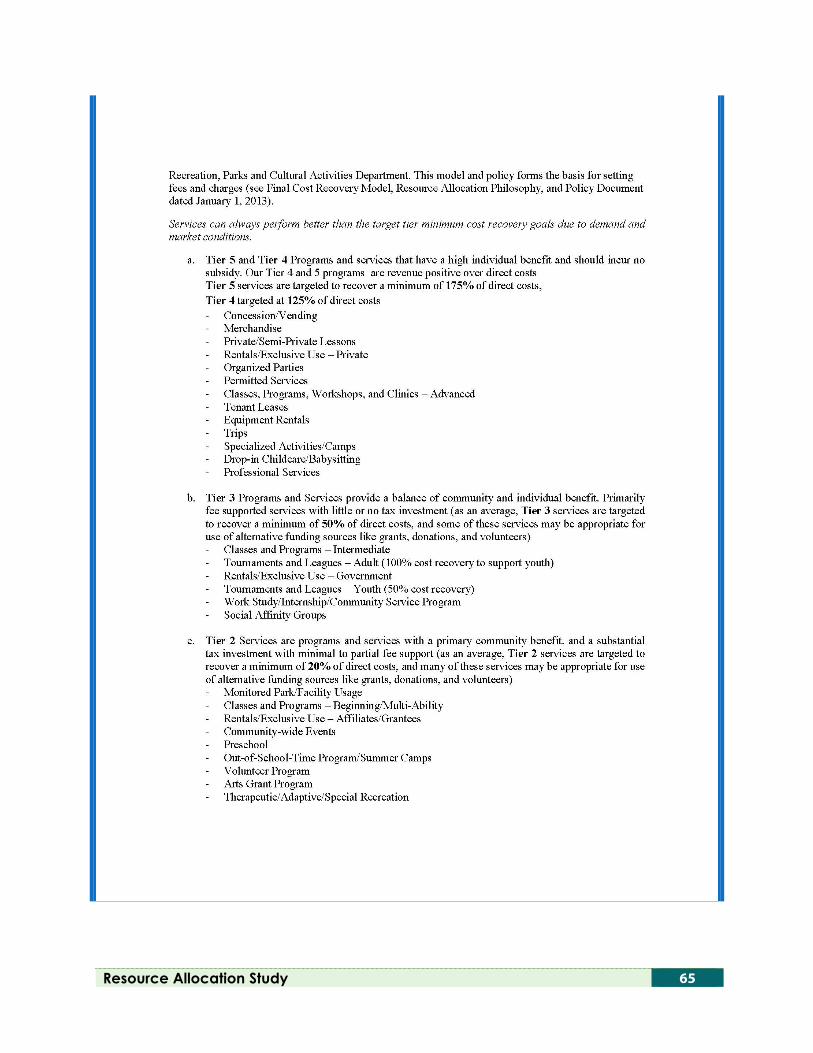
Resource Allocation Study 65
66 Alexandria Department of Recreation, Parks and Cultural Activities