resource estimation of the móngora gold-silver … 43-101_mongora_18apr2012...april 18, 2012 eco...
TRANSCRIPT

April 18, 2012
ECO ORO MINERALS CORP.
Resource Estimation of the Móngora Gold-Silver Deposit, Santander Department, Colombia
Prepared by:Golder Associates Perú S.A Edifício Miracorp. Av. La Paz 1049 - Piso 7 Miraflores - Lima 18, Perú Effective Date: April 18, 2012
TECH
NICA
L RE
PORT
Golder Report Number: 12-16-12_119_415_5030_IF
Qualified Person: Marcelo Godoy, MAusIMM (CP), Golder Associates. Contributors: Alfonso Silva Duarte, Geology Superintendent, Eco Oro Jorge Paulo Peres, MAusIMM, Golder Associates Frederick Felder, Consulting Geologist
Prepared for:Eco Oro Minerals Corp. Suite 1430 - 333 Seymour Street Vancouver, British Columbia V6B 5A6
RESOURCE ESTIMATION OF THE MÓNGORA GOLD-SILVER DEPOSIT
April 18, 2012 Report No. 12-16-12_119_415_5030_IF i
Table of Contents
1.0 SUMMARY .................................................................................................................................................................... 8
1.1 Scope ............................................................................................................................................................. 8
1.2 Property Location and Ownership .................................................................................................................. 8
1.3 Project History ................................................................................................................................................ 9
1.4 Deposit Geology ............................................................................................................................................ 9
1.5 Data Verification ............................................................................................................................................. 9
1.6 Mineral Resource Estimate .......................................................................................................................... 10
1.7 Community ................................................................................................................................................... 11
1.8 Qualified Person .......................................................................................................................................... 11
1.9 Conclusions and Recommendations ............................................................................................................ 12
2.0 INTRODUCTION ......................................................................................................................................................... 13
3.0 RELIANCE ON OTHER EXPERTS ............................................................................................................................. 13
4.0 PROPERTY DESCRIPTION AND LOCATION ........................................................................................................... 14
4.1 Location ....................................................................................................................................................... 14
4.2 Mineral Tenure ............................................................................................................................................. 16
4.3 Surface Rights, Easements and Rights of Way ........................................................................................... 20
4.4 Environment ................................................................................................................................................. 22
4.5 Water Rights ................................................................................................................................................ 24
4.6 Royalties ...................................................................................................................................................... 24
5.0 ACCESSIBILITY, CLIMATE, LOCAL RESOURCES, INFRASTRUCTURE AND PHYSIOGRAPHY ........................ 25
5.1 Accessibility ................................................................................................................................................. 25
5.2 Climate ......................................................................................................................................................... 25
5.3 Local Resources and Infrastructure ............................................................................................................. 25
5.4 Physiography ............................................................................................................................................... 25
6.0 HISTORY ..................................................................................................................................................................... 25
7.0 GEOLOGICAL SETTING AND MINERALIZATION .................................................................................................... 27
7.1 Regional Geology ........................................................................................................................................ 27
7.2 Deposit Geology .......................................................................................................................................... 27

RESOURCE ESTIMATION OF THE MÓNGORA GOLD-SILVER DEPOSIT
April 18, 2012 Report No. 12-16-12_119_415_5030_IF ii
7.2.1 Lithology ................................................................................................................................... 27
7.2.2 Geomorphology ........................................................................................................................ 29
7.2.3 Structural Geology .................................................................................................................... 29
7.2.4 Hydrothermal alteration ............................................................................................................. 30
7.3 Mineralization ............................................................................................................................................... 31
8.0 DEPOSIT TYPES ........................................................................................................................................................ 32
9.0 EXPLORATION ........................................................................................................................................................... 32
9.1 Grids and Surveys........................................................................................................................................ 33
9.2 Geological and Structural Mapping .............................................................................................................. 33
9.3 Geochemistry ............................................................................................................................................... 33
9.4 Drilling .......................................................................................................................................................... 34
9.5 Bulk Density ................................................................................................................................................. 34
9.6 Petrology, Mineralogy and Other Research Studies .................................................................................... 34
9.7 Exploration Potential .................................................................................................................................... 34
10.0 DRILLING .................................................................................................................................................................... 37
10.1 Drill Contractors and Methods ...................................................................................................................... 37
10.2 Core Logging ............................................................................................................................................... 37
10.3 Collar Surveys .............................................................................................................................................. 37
10.4 Down-Hole Surveys ..................................................................................................................................... 37
10.5 Recovery ...................................................................................................................................................... 38
10.6 Drilling Used to Support Mineral Resource Estimation................................................................................. 38
11.0 SAMPLE PREPARATION, ANALYSES, AND SECURITY ......................................................................................... 38
11.1 Sample Collection ........................................................................................................................................ 38
11.1.1 Surface Sampling ...................................................................................................................... 38
11.1.2 Core Samples ........................................................................................................................... 38
11.2 Analytical Laboratories ................................................................................................................................. 39
11.3 Density/Specific Gravity ............................................................................................................................... 39
11.4 Sample Preparation ..................................................................................................................................... 39
11.5 Sample Analysis .......................................................................................................................................... 39
11.6 Sample Security ........................................................................................................................................... 40
RESOURCE ESTIMATION OF THE MÓNGORA GOLD-SILVER DEPOSIT
April 18, 2012 Report No. 12-16-12_119_415_5030_IF iii
11.7 Sample Storage ........................................................................................................................................... 40
11.8 Quality Assurance and Quality Control ........................................................................................................ 41
11.9 Databases .................................................................................................................................................... 42
11.10 QAQC Golder Review, October 2011 .......................................................................................................... 42
11.10.1 Blank Samples .......................................................................................................................... 43
11.10.2 Standard Samples .................................................................................................................... 46
11.10.3 Duplicates Analysis ................................................................................................................... 47
11.11 Comment on Section 11 ............................................................................................................................... 48
12.0 DATA VERIFICATION................................................................................................................................................. 50
12.1 Metálica Consultores S.A., 2009 .................................................................................................................. 50
12.2 GRD Minproc Limited, 2009 ......................................................................................................................... 50
12.3 Smee Consultants, 2006–2010 .................................................................................................................... 50
12.4 NCL, 2010 .................................................................................................................................................... 50
12.5 Comment on Section 12 ............................................................................................................................... 51
13.0 MINERAL PROCESSING AND METALLURGICAL TESTING ................................................................................... 52
14.0 MINERAL RESOURCE ESTIMATES .......................................................................................................................... 52
14.1 Geological Model ......................................................................................................................................... 52
14.2 Database ...................................................................................................................................................... 52
14.3 3D Modeling ................................................................................................................................................. 53
14.4 Oxidation Model ........................................................................................................................................... 55
14.5 Compositing ................................................................................................................................................. 57
14.6 Outlier Treatment ......................................................................................................................................... 57
14.7 Exploratory Data Analysis ............................................................................................................................ 59
14.8 Specific Gravity Measurements ................................................................................................................... 64
14.9 Block Model Parameters .............................................................................................................................. 66
14.10 Spatial correlation and variography .............................................................................................................. 67
14.11 Kriging Strategy ........................................................................................................................................... 73
14.12 Estimation Procedure ................................................................................................................................... 73
14.13 Resource Classification ................................................................................................................................ 74
14.14 Model Validation .......................................................................................................................................... 74
14.14.1 Statistical comparison ............................................................................................................... 74

RESOURCE ESTIMATION OF THE MÓNGORA GOLD-SILVER DEPOSIT
April 18, 2012 Report No. 12-16-12_119_415_5030_IF iv
14.14.2 Visual validation ........................................................................................................................ 75
14.14.3 Swath plots ............................................................................................................................... 79
14.15 Resource Reporting Criteria ......................................................................................................................... 82
14.16 Results ......................................................................................................................................................... 82
15.0 ADJACENT PROPERTIES ......................................................................................................................................... 84
16.0 OTHER RELEVANT A DATA INFORMATION ........................................................................................................... 84
17.0 INTERPRETATION AND CONCLUSIONS ................................................................................................................. 84
18.0 RECOMMENDATIONS ............................................................................................................................................... 85
19.0 REFERENCES ............................................................................................................................................................ 86
20.0 DATE AND SIGNATURE PAGE ................................................................................................................................. 88
CERTIFICATE OF QUALIFIED PERSON ............................................................................................................................... 90
Marcelo Godoy, PhD ................................................................................................................................................... 90
APPENDICES
Appendix A Certificate of Qualified Person
Appendix B QAQC Results
Appendix C Exploratory Data Analysis
Appendix D Block Model Validation
RESOURCE ESTIMATION OF THE MÓNGORA GOLD-SILVER DEPOSIT
April 18, 2012 Report No. 12-16-12_119_415_5030_IF v
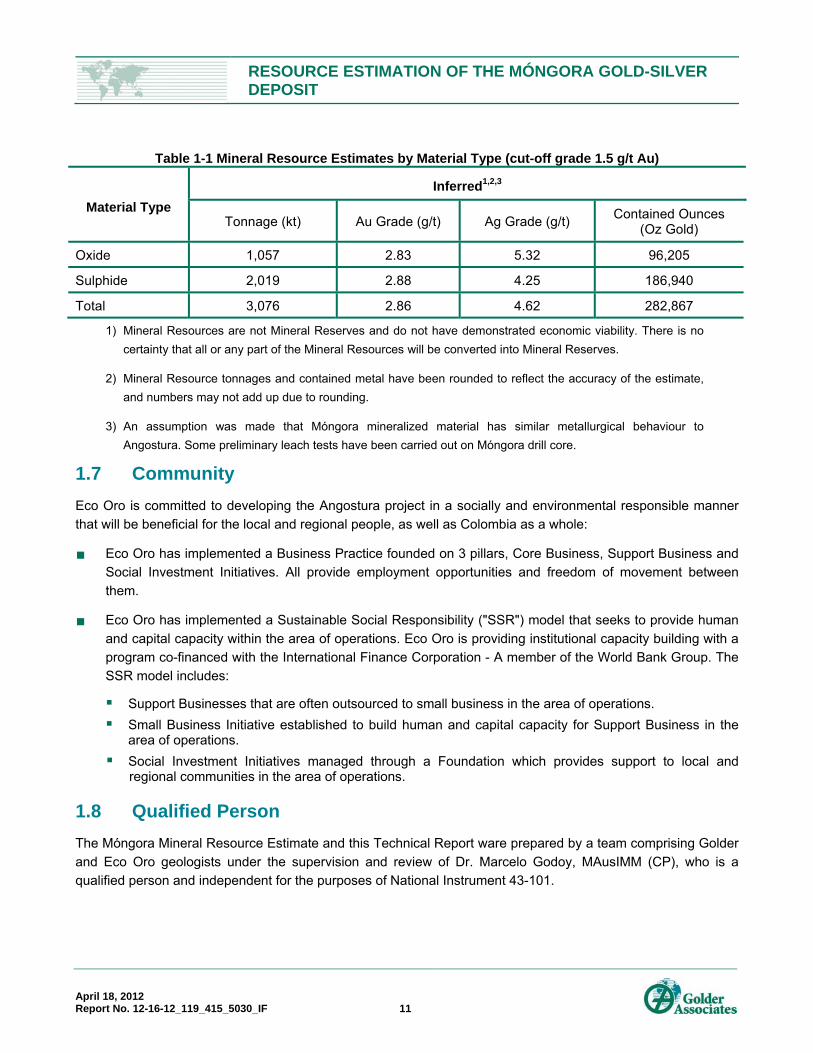
TABLES Table 1-1 Mineral Resource Estimates by Material Type (cut-off grade 1.5 g/t Au) ................................................................. 11
Table 4-1 Post List of Eco Oro`s Mining Titles ......................................................................................................................... 18
Table 4-2 Surface Rights Acquisition Summary Table ............................................................................................................. 20
Table 4-3 Water Rights granted by the CDMB ......................................................................................................................... 24
Table 11-1 Density Database used in Modeling ....................................................................................................................... 39
Table 11-2 Expected mean values and acceptable limits for Móngora standard samples ....................................................... 46
Table 14-1 Database Basic Statistics ....................................................................................................................................... 52
Table 14-2 Information Inside mineralized zone (High Grade Veins) ....................................................................................... 53
Table 14-3 Oxidation level criteria measured form drill hole cores. .......................................................................................... 55
Table 14-4 Thresholds defined for capping and high yield restriction ...................................................................................... 59
Table 14-5 Summary statistics for Au composites by vein ....................................................................................................... 59
Table 14-6 Density database used in modelling ....................................................................................................................... 64
Table 14-7 Procedure to provide density to Móngora model .................................................................................................... 66
Table 14-8 Móngora block model definition.............................................................................................................................. 66
Table 14-9 Adjusted variogram models. ................................................................................................................................... 67
Table 14-10 Samples limits for the estimation procedure. ....................................................................................................... 73
Table 14-11 Estimation plan for grade variables – Móngora Project. ....................................................................................... 73
Table 14-12 Global statistics comparison Composites x Blocks: Vein 1. ................................................................................. 75
Table 14-13 Global statistics comparison Composites x Blocks: Vein 2. ................................................................................. 75
Table 14-14 Global statistics comparison Composites x Blocks: Vein 3. ................................................................................. 75
Table 14-15 Eco Oro Mineral Resources @ 1.5 g/t COG. ....................................................................................................... 82
Table 14-16 Eco Oro Mineral Resources @ 2.0 g/t COG. ....................................................................................................... 82
Table 14-17 Eco Oro Mineral Resources @ 2.5 g/t COG. ....................................................................................................... 83
Table 14-18 Eco Oro Mineral Resources @ 3.0 g/t COG. ....................................................................................................... 83
Table 14-19 Eco Oro Mineral Resources @ 3.5 g/t COG. ....................................................................................................... 83

RESOURCE ESTIMATION OF THE MÓNGORA GOLD-SILVER DEPOSIT
April 18, 2012 Report No. 12-16-12_119_415_5030_IF vi
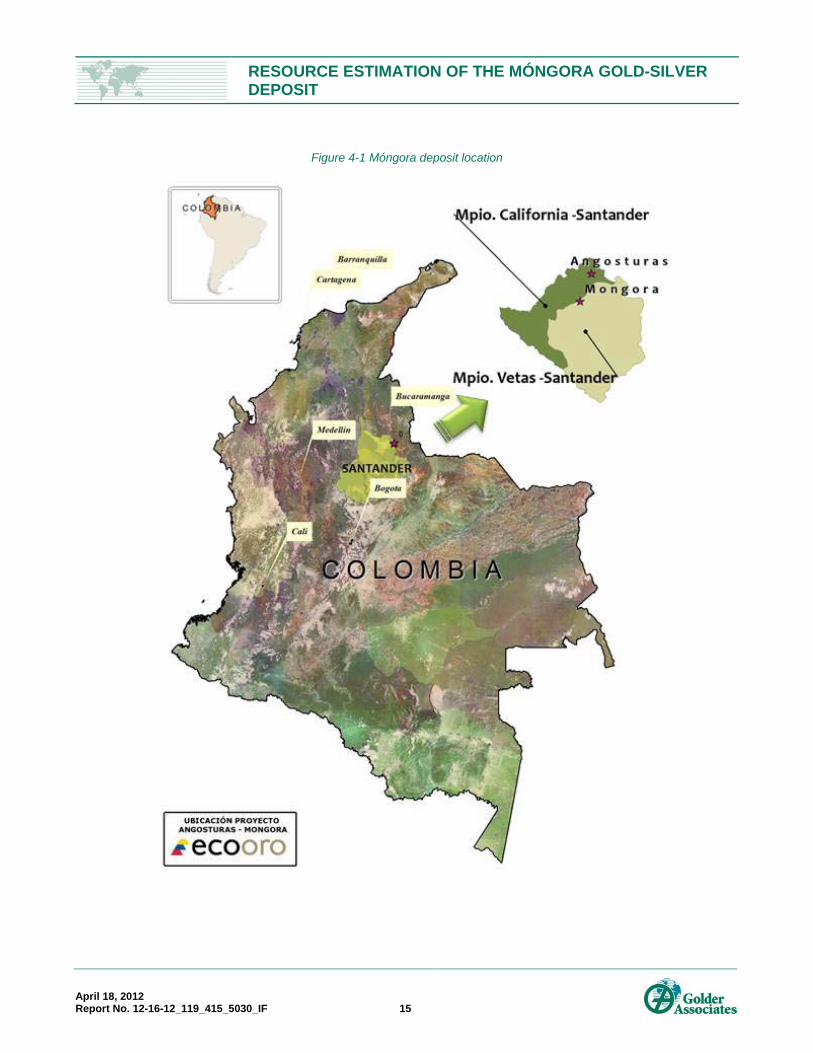
FIGURES Figure 4-1 Móngora deposit location ........................................................................................................................................ 15
Figure 4-2 Location of Eco Oro´s Mining Titles ........................................................................................................................ 19
Figure 4-3 Location of Eco Oro´s surface rights ....................................................................................................................... 22
Figure 7-1 Regional geological map. Móngora deposit highlighted in black-dotted line. .......................................................... 28
Figure 7-2 Aero photographic mosaic of Móngora sector. ....................................................................................................... 29
Figure 7-3 Stress diagrams for different types of faults, veins and fractures associated to Violetal, La Plata and Móngora areas and Angostura. Note the N-NE trend fault tensor for faults, veins and fractures (in red). ............... 30
Figure 7-4 Terraspec spectra for alteration minerals in Móngora sector: a) epidote, b) chlorite-illite, c) ankerite-epidote, d) gypsum. .............................................................................................................................................................. 31
Figure 9-1 Geochemical Sample Location Plan ....................................................................................................................... 35
Figure 9-2 Location Plan, Regional Exploration Targets .......................................................................................................... 36
Figure 11-1 A general view of core shed. ................................................................................................................................. 40
Figure 11-2 General view of drill hole core storage area and new facility. ............................................................................... 41
Figure 11-3 Angostura QAQC Protocol .................................................................................................................................... 44
Figure 11-4 Blank results for Au. .............................................................................................................................................. 45
Figure 11-5 Standards CDN-GS-P7A-Au and CDN-CGS-13-Au. ............................................................................................. 47
Figure 11-6 Field (core) and Pulp duplicates - Au. ................................................................................................................... 48
Figure 14-1 Aerial view of the Mongora Deposit. ..................................................................................................................... 54
Figure 14-2 Plan view of the Móngora geological model. ......................................................................................................... 55
Figure 14-3 Oxide-Sulphide surface limit in section X=130110. ............................................................................................... 56
Figure 14-4 Oxide-Sulphide surface limit in section X=130250. ............................................................................................... 56
Figure 14-5 Probability plot of sample length – drill hole samples (left) and composites (right). .............................................. 57
Figure 14-6 Probability Plots showing the threshold values defined for capping and High Yield Restriction. ........................... 58
Figure 14-7 Cumulative probability plot for Au – ore domain.................................................................................................... 63
Figure 14-8 Cumulative probability plot for Au – background domain. ..................................................................................... 64
Figure 14-9 Cumulative probability plot for the two density populations. .................................................................................. 65
Figure 14-10 Correlation for Au in Sulphides zone (left) and Oxide-Transition zone (right). .................................................... 66
Figure 14-11 Variogram model for Au. ..................................................................................................................................... 68
Figure 14-12 Variogram model for Ag. ..................................................................................................................................... 69
Figure 14-13 Variogram model for As. ..................................................................................................................................... 70
Figure 14-14 Variogram model for Cu. ..................................................................................................................................... 71
Figure 14-15 Variogram model for S. ....................................................................................................................................... 72
Figure 14-16 Vertical section (X=130205) showing drill hole grades against block model grades. .......................................... 76

RESOURCE ESTIMATION OF THE MÓNGORA GOLD-SILVER DEPOSIT
April 18, 2012 Report No. 12-16-12_119_415_5030_IF vii
Figure 14-17 Detail of the red square in Figure 14-16 indicating good adjustment between composites and block grades. .................................................................................................................................................................... 76
Figure 14-18 Detail of the yellow square in Figure 14-16 indicating good adjustment between composites and block grades. .................................................................................................................................................................... 77
Figure 14-19 Vertical section (X=129890) showing drill hole grades against block model grades. .......................................... 77
Figure 14-20 Detail of the red square in Figure 14-19 indicating good adjustment between composites and block grades. .................................................................................................................................................................... 78
Figure 14-21 Detail of the yellow square in Figure 14-19 indicating good adjustment between composites and block grades. .................................................................................................................................................................... 78
Figure 14-22 Swath plot for Au - vein 1. ................................................................................................................................... 80
Figure 14-23 Swath plot for Au - vein 2. ................................................................................................................................... 81

RESOURCE ESTIMATION OF THE MÓNGORA GOLD-SILVER DEPOSIT
April 18, 2012 Report No. 12-16-12_119_415_5030_IF 8
1.0 SUMMARY 1.1 Scope Eco Oro Minerals Corp. (Eco Oro) commissioned Golder Associates Peru S.A. (Golder) to undertake a Resource Estimation for the Móngora Silver-Gold Deposit in the northern region of Santander, Colombia, and to prepare a Technical Report as defined in Canadian National Instrument 43-101, Standards of Disclosure for Mineral Projects.
The Móngora deposit is one of five deposits (Angostura, Armenia, La Plata, Móngora and Violetal) that have been identified within the Eco Oro’s property in Santander, Colombia. An updated NI 43-101 Preliminary Economic Assessment (PEA) for the exploitation of the Angostura Deposit by an underground mining operation dated March 23, 2012 was filed on SEDAR (www.sedar.com) on March 27, 2012. Much of the context for the NI 43-101 Resource Estimation of the Móngora Gold-Silver Deposit is copied from the PEA as it applies equally to both reports. In particular, sections 4, 5, 6, 10, 11 & 12 are very similar in both reports.
The Effective Date of this Report is April 18, 2012 (“Effective Date”). This Technical Report discloses the results of the first resource estimation for the Móngora deposit. As part of the work Golder undertook a detailed review of data capture, sample storage, QAQC, core logging and geological modeling procedures carried out by Eco Oro and their agents.
This Report and the resource estimate have been prepared in compliance with the disclosure and reporting requirements set forth in the current Canadian Securities Administrator’s National Instrument 43-101, Companion Policy 43-101CP, and Form 43-101F1.
1.2 Property Location and Ownership Eco Oro’s wholly owned Móngora gold and silver deposit is located in northeastern Colombia near the border with Venezuela, some 400 km north–northeast of the capital city of Bogotá, and approximately 67 km northeast of the city of Bucaramanga in the Department of Santander.
The property is located in steep, mountainous and relatively rugged terrain at elevations ranging from 2,400 to 3,200 metres above sea level (m.a.s.l.). The geographic coordinates of the Móngora deposit are N7º 22’ Latitude and W72º 53’ Longitude.
Current Project access from Bucaramanga is via the partially-paved Matanza–Surata–California road, a distance of 67 km and travel time of two to three hours by car, depending on weather conditions. Within the Project area, access is by horse and foot trails.
Eco Oro initiated exploration at the Móngora target area in 2008 as part of the evaluation of the area south of the Angostura deposit that straddles the prospective Móngora – Romeral Fault.
The Móngora area is encompassed by former Mining Title 300-68, which was consolidated into the larger 3452 Mining Title. Over the past fifteen years Eco Oro has acquired outright ownership of 14 mining titles either by purchase or by application to governmental agencies (concession contracts, exploitation licenses, and exploration licenses) covering approximately 30,000 hectares in the municipalities of California, Vetas, Suratá, Charta and Tona in the Department of Santander and Cucutilla and Mutiscua in the Department of Norte de Santander. The Móngora deposit is located in the Vetas Municipality.

RESOURCE ESTIMATION OF THE MÓNGORA GOLD-SILVER DEPOSIT
April 18, 2012 Report No. 12-16-12_119_415_5030_IF 9
1.3 Project History Early gold mining activities are reported to have occurred in the general area of the Angostura deposit since pre-colonial times and continued during Spanish rule with the mining of high-grade veins and placers. After independence and throughout the last century, precious metals were mined on a small scale in the districts of Vetas and California.
1.4 Deposit Geology The Móngora deposit is located in the northern Andes ranges, within the western branch of the Eastern Cordillera in northeastern Colombia, and more specifically within the Santander Massif. The oldest rocks in the Massif are Precambrian gneisses and schists that were part of the Guyana Shield, and which have been regionally metamorphosed to upper amphibolite grade in the Palaeozoic.
Gold mineralization occurs within the Angostura–California gold province, a belt of epithermal gold occurrences that has developed along the regional-scale Rio La Baja fault in association with the Middle Miocene stocks.
The Móngora mineral occurrence extends over 1 km in a northeast direction and 700 meters in the WNW – ESE direction and has been drilled between 2,600 to 3,200 m.a.s.l. The deposit is delimited to the east by the Móngora–Romeral fault and is open to the west, southwest and north east.
A suite of porphyritic diorite to quartz monzonite bodies and dyke swarms of Triassic age, are intruded into the amphibolite facies Bucaramanga Gneiss, a series of meta-sediments of Proterozoic age. These rocks have been intersected by a swarm of generally east–northeast trending, steeply north-dipping structures. More than 100 individual veins and composite veins have been identified to date by means of surface mapping and interpretation of drill hole data.
Mineralization occurs in bands, veinlets, stringers, and silicified hydrothermal breccias within the structures. In the upper parts of the mineralized system, alteration and mineralization are stronger in the intrusive host rocks, and the meta-sediments appear to make a poorer host for the gold–silver mineralization.
Mineralized structure widths vary from less than 2 m for individual veins to over 5 m for composite structures, and strike lengths range from less than 250 m to over 400 m and down dip extensions to over 300 m. The intensity of fracturing, and the degree of secondary porosity and permeability of the host rocks controls the density of structures, and therefore the mineralization. Flexures along mineralized structures, vein–vein intersections, and vein–fault intersections are preferred mineralization sites typically displaying higher gold and silver grades.
1.5 Data Verification A number of data verification programs and audits have been performed for the Angostura project throughout the Project’s history that also emcopassed the Móngora deposit, primarily in support of compilation of technical reports on the Project. A reasonable level of verification has been completed, and no material issues would have been left unidentified from the programs undertaken.
Barry Smee (Smee and Associates Consulting Ltd) is an independent auditor of the preparation laboratory as well as QAQC practices reviewer and has made three visits to the Angostura Camp site since 2004 with the most recent review carried out in September 2010.
RESOURCE ESTIMATION OF THE MÓNGORA GOLD-SILVER DEPOSIT
April 18, 2012 Report No. 12-16-12_119_415_5030_IF 10
Eco Oro applied industry best practices to explore for gold and silver on the Angostura project. The exploration data was collected with care and is appropriately managed to ensure safeguard of exploration information. The same standard has been used for all drilling carried out at Móngora. The resulting exploration data was considered reliable for the purpose of resource estimation.
1.6 Mineral Resource Estimate The mineral resource estimation was carried out by Golder Associates Peru S.A. (Golder) and is dated January 14, 2012 and includes drilling and assay data up to February 2011. The mineral resource estimate includes information from 58 holes, 20,276.2 m of drilling and 9,673 gold samples of which 498 samples and 979.4 m are in structures.
Eco Oro’s geologists constructed mineralization wireframes using a cut-off grade of 2 g/t Au for structures up to 2 m thickness. For structures with thickness greater than 2 m, wireframes were snapped to a cut-off grade of 1.5 g/t Au bearing in mind the possibility of using different underground exploitation methods in different thicknesses of mineralized structures. The wireframes were projected 25 m to 50 m horizontally and vertically beyond the last vein intercept.
The spatial continuity of gold grades was inferred based on a single population of grades, which included all samples that intercepted the mineralized structures modeled by Eco Oro geologists. For the estimation procedure each structure was estimated separately.
Codes were assigned to each block to indicate the oxidation degree as oxide or sulphide material. Density values were assigned to each of the weathered zones using a metal content relationship for blocks located in the sulphide and a fixed mean value was applied to blocks located in the oxide zone.
Data inside the structures were composited to a standard 2.0 m length. Grade distributions were evaluated using probability plots for all structures. Grade caps and restrictions were applied to gold, silver, arsenic, copper and sulfur grades. Variograms were constructed to provide the appropriate distances for search ellipsoid radii for each variable. Ordinary Kriging was used to interpolate gold, silver, arsenic, copper and sulfur grades. Each vein was interpolated with its own data and using a search ellipse that follows its own spatial orientation (strike and dip).
The model was validated using visual methods, tabulations and comparison between floating window average grades of composites and block estimates to ensure no bias was present. Block estimates were classified as Inferred due to the preliminary analysis stage. Table 1-1 presents an estimate of mineral resources based upon the above mentioned methodology for a cut-off grade of 1.5 g/t Au.
The mineral resources disclosed in this Technical Report were estimated using the Canadian Institute of Mining, Metallurgy and Petroleum (CIM) Standards on Mineral Resources and Reserves, Definitions and Guidelines prepared by the CIM Standing Committee on Reserve Definitions.
RESOURCE ESTIMATION OF THE MÓNGORA GOLD-SILVER DEPOSIT
April 18, 2012 Report No. 12-16-12_119_415_5030_IF 11
Table 1-1 Mineral Resource Estimates by Material Type (cut-off grade 1.5 g/t Au)
Material Type Inferred1,2,3
Tonnage (kt) Au Grade (g/t) Ag Grade (g/t) Contained Ounces (Oz Gold)
Oxide 1,057 2.83 5.32 96,205
Sulphide 2,019 2.88 4.25 186,940
Total 3,076 2.86 4.62 282,867
1) Mineral Resources are not Mineral Reserves and do not have demonstrated economic viability. There is no certainty that all or any part of the Mineral Resources will be converted into Mineral Reserves.
2) Mineral Resource tonnages and contained metal have been rounded to reflect the accuracy of the estimate, and numbers may not add up due to rounding.
3) An assumption was made that Móngora mineralized material has similar metallurgical behaviour to Angostura. Some preliminary leach tests have been carried out on Móngora drill core.
1.7 Community Eco Oro is committed to developing the Angostura project in a socially and environmental responsible manner that will be beneficial for the local and regional people, as well as Colombia as a whole:
Eco Oro has implemented a Business Practice founded on 3 pillars, Core Business, Support Business and Social Investment Initiatives. All provide employment opportunities and freedom of movement between them.
Eco Oro has implemented a Sustainable Social Responsibility ("SSR") model that seeks to provide human and capital capacity within the area of operations. Eco Oro is providing institutional capacity building with a program co-financed with the International Finance Corporation - A member of the World Bank Group. The SSR model includes:
Support Businesses that are often outsourced to small business in the area of operations. Small Business Initiative established to build human and capital capacity for Support Business in the
area of operations. Social Investment Initiatives managed through a Foundation which provides support to local and
regional communities in the area of operations.
1.8 Qualified Person The Móngora Mineral Resource Estimate and this Technical Report ware prepared by a team comprising Golder and Eco Oro geologists under the supervision and review of Dr. Marcelo Godoy, MAusIMM (CP), who is a qualified person and independent for the purposes of National Instrument 43-101.

RESOURCE ESTIMATION OF THE MÓNGORA GOLD-SILVER DEPOSIT
April 18, 2012 Report No. 12-16-12_119_415_5030_IF 12
1.9 Conclusions and Recommendations Golder has reviewed the project data and the drill hole database and has visited the project site. Golder believes the data provided by Eco Oro, as well as the geological interpretations Eco Oro and their agents have derived from the data, are generally an accurate and reasonable representation of the Angostura’s mineralized structures.
The block grade estimates have been derived using methodology and parameters that are appropriate for the observed spatial continuity of grades and style of mineralization. The mineral resources disclosed in this Technical Report were estimated using the Canadian Institute of Mining, Metallurgy and Petroleum (CIM) Standards on Mineral Resources and Reserves, Definitions and Guidelines prepared by the CIM Standing Committee on Reserve Definitions.
The Mongora deposit has the potential to enhance the value of the envisioned Angostura underground mine project. Not only are the prospects for further expansion of the mineralization at Mongora favourable but its close proximity to Angostura also opens up the possibility of developing Mongora as an early source of mineralized feed in the development of the project.
The following studies should be carried out to support the next phase of project development:
Infill drilling to confirm the continuity of the mineralized veins and improve grade estimation.
Metallurgical testing to confirm assumption that Móngora mineralized material has similar metallurgical behavior to that of Angostura.
Geotechnical characterization program including oriented drilling.
RESOURCE ESTIMATION OF THE MÓNGORA GOLD-SILVER DEPOSIT
April 18, 2012 Report No. 12-16-12_119_415_5030_IF 13
2.0 INTRODUCTION Eco Oro Minerals Corp. (Eco Oro) commissioned Golder Associates Peru S.A. (Golder) to undertake a resource estimation of the Móngora deposit and to prepare a Technical Report as defined in Canadian National Instrument 43-101, Standards of Disclosure for Mineral Projects.
The Móngora deposit is one of five deposits (Angostura, Armenia, La Plata, Móngora and Violetal) that have been identified within Eco Oro’s Angostura project target deposits in Santander, Colombia. An updated NI 43-101 Preliminary Economic Assessment (PEA) for the exploitation of the Angostura Deposit by an underground mining operation dated March 23, 2012 was filed on SEDAR (www.sedar.com) on March 27, 2012. Much of the context for the NI 43-101 Resource Estimation of the Móngora Gold-Silver Deposit is copied from the PEA as it applies equally to both reports. In particular, Sections 4, 5, 6, 10, 11 & 12 are very similar in both reports.
As part of the work Golder undertook a detailed review of data capture, sample storage, QAQC, core logging, geological modeling and grade estimation procedures carried out by Eco Oro and their agents.
This report and the resource estimate have been prepared in compliance with the disclosure and reporting requirements set forth in the current Canadian Securities Administrator’s National Instrument 43-101, Companion Policy 43-101CP, and Form 43-101F1.
Mineral resource disclosed in this document is classified as Inferred mineral resources.
The following professional served as the Qualified Person (QP) as defined in National Instrument 43-101, Standards of Disclosure for Mineral Projects and in compliance with Form 43-101F1. The QP responsible for the preparation of the Report is:
Marcelo Godoy, PhD, Principal Geostatistician and Mining Engineer with Golder Associates S.A. and Member of the AusIMM (CP) was responsible for the overall preparation of the report and takes responsibility as the author of this report. Dr. Godoy visited the property from 1 to 5 August 2011.
In preparing this report, Golder has relied on various reports, maps and technical papers listed in the References section and on experience gained from similar deposits. The professionals that participated in geological modelling, resource estimation and compilation of this report were Mr. Alfonso Silva Duarte, Geology Superintendent with Eco Oro, Mr. Jorge Paulo Peres, Senior Resource Geologist with Golder and Frederick Felder, Consulting Geologist.
All measurement units used in this Report are metric, and currency is expressed in US dollars unless stated otherwise.
3.0 RELIANCE ON OTHER EXPERTS The qualified person has relied on the information, opinions and statements of other experts most of whom are not qualified persons. Such reliance encompasses information concerning legal, environmental and political issues. All reasonable endeavours have been made to ensure the accuracy and reasonableness of the information supplied by other experts. No warranty or guarantee, be it express or implied, is made by Golder with respect to the completeness or accuracy of such information provided.
RESOURCE ESTIMATION OF THE MÓNGORA GOLD-SILVER DEPOSIT
April 18, 2012 Report No. 12-16-12_119_415_5030_IF 14
4.0 PROPERTY DESCRIPTION AND LOCATION 4.1 Location Eco Oro’s wholly owned Móngora gold and silver deposit is located in northeastern Colombia near the border with Venezuela, some 400 km north–northeast of the capital city of Bogotá, and approximately 67 km northeast of the city of Bucaramanga in the Department of Santander.
The property is located in steep, mountainous and relatively rugged terrain at elevations ranging from 2,600 to 3,200 metres above sea level (m.a.s.l.). The geographic coordinates of the Móngora deposit are N7º 22’ latitude and W72º 53’ Longitude.
Current Project access from Bucaramanga is via the partially-paved Matanza–Surata–California road, a distance of 67 km and travel time of two to three hours by car, depending on weather conditions. Within the Project area, access is by horse and foot trails.
Over the past fifteen years Eco Oro has acquired outright ownership of 14 mining titles either by purchase or by application to governmental agencies (concession contracts, exploitation licenses, and exploration licenses) covering approximately 30,000 hectares in the municipalities of California, Vetas, Suratá, Charta and Tona in the Department of Santander and in Cucutilla and Mutiscua in the Department of Norte de Santander. The Móngora deposit is located in the municipality of Vetas.
Figure 4-1 shows a map indicating the location of the property.
RESOURCE ESTIMATION OF THE MÓNGORA GOLD-SILVER DEPOSIT
April 18, 2012 Report No. 12-16-12_119_415_5030_IF 15
Figure 4-1 Móngora deposit location

RESOURCE ESTIMATION OF THE MÓNGORA GOLD-SILVER DEPOSIT
April 18, 2012 Report No. 12-16-12_119_415_5030_IF 16
4.2 Mineral Tenure Under Colombian mining law, generally, all minerals, whether they are located on the soil or subsoil, are the property of the State. Obtaining mining rights does not transfer ownership of the mineral estate, but creates a temporary right to explore and benefit from exploitation of the minerals in exchange for royalty payments as long as the mining title remains in good standing. In Colombia, mining titles are subject to the legal regime in force at the time they were granted. Colombia has several mining regimes that currently have application, including: Law 685, 2001 (the “2001 Mining Code”), amended by Law 1382, 2010 (the “2010 Amendment”); Decree 2655, 1988 (the “1988 Mining Code”); Law 20, 1969 and the Civil Code (prior to Law 20, 1969), which are applicable to privately owned minerals. Eco Oro holds mining titles under the 1988 Mining Code and 2001 Code with certain modifications of the 2010 Amendment. In May 2011, the Colombian Constitutional Court declared the 2010 Amendment unconstitutional and limited its enforcement to the following 2 years. Once that period has elapsed, the 2010 Amendment will be abolished. In the meantime, favorable aspects of the 2010 Amendment are applicable but whether they will continue to apply after this time is not clear.
The Ministry of Mines and Energy is the principal mining authority in Colombia and in charge of managing mining resources and formulating mining polices. Currently, the Ministry of Mines and Energy has delegated the administration of non-renewable resources to the Colombian Geological Service (Servicio Geológico Colombiano or “SGC”, which, prior to November 3, 2011, was known as Ingeominas) and some territorial entities until the new mining authority known as National Mining Agency is operational, which is expected to occur later this year. SGC currently has responsibility in the area of the Angostura Project.
Under the Colombian mining regime, exploration and exploitation activities require a mining license or concession. Except for activities done in ethnic minority areas, prospecting activities do not require authorization from the State.
Mining titles may be granted directly from the State or assigned from third parties who previously acquired title. Filing a mining title request does not grant mining rights, however it does grant a preferential right over any further filings in the same or overlapping areas. Mining title requests must be processed by the SGC or the corresponding territorial entity within 180 calendar days but, in practice, processing often takes considerably longer. Assignments of mining titles from third parties are deemed approved whenever the mining authority fails to issue a response within the following 45 business days after filing of the assignment notice. Once a mining title is granted or a mining title assigned, it must be registered before the national authority for the purpose of inscription, authenticity, validity and publicity.
The 1988 Mining Code establishes four types of mining titles: exploration licenses, exploitation licenses, public contributions and concession agreements. An exploitation license grants the right to exploit mineral resources for a term of 10 years, with a right to apply for an additional 10 year extension upon its expiry. It may also be converted into a concession agreement subject to the mining code in force. The conversion will be granted for a 20 year term, extendable according to the applicable regime (currently 20 years). 1988 Mining Code Concession agreements are granted for 30 year terms without the right to extension. Eco Oro holds exploitation licenses and concession agreements that are governed by the 1988 Mining Code.
The 2001 Mining Code provides for only one type of mining title, known as a concession, which is granted for a term of 30 years. The concession is divided into 3 phases: (i) exploration, with a 3 year term, which may be extended up to 8 years in 2 year extensions each, for a total of 11 years according to the 2010 Amendment; (ii)

RESOURCE ESTIMATION OF THE MÓNGORA GOLD-SILVER DEPOSIT
April 18, 2012 Report No. 12-16-12_119_415_5030_IF 17
construction and installation, with a 3 year term which may be extended for an additional year according to the 2010 Amendment; and (iii) exploitation, comprising the remainder of the 30 year term. The concession may be extended for an additional 30 years, unless granted under the 2010 Amendment, in which case it may only be extended for an additional 20 years. Under the 2001 Mining Code, the extension is deemed approved whenever the mining authority fails to issue a response before the termination of the phase. Eco Oro holds several concessions, including its principal mineral titles that are governed by the 2001 Mining Code.
Holders of mining titles are required to pay an annual surface tax (canon superficiario) depending on the number of hectares covered by each title and the mining regime applicable to the title ranging from a daily minimum wage (approximately $10) per hectare to three times the daily minimum wage per hectare. Pursuant to the 1988 Mining Code and 2001 Mining Code, surface taxes are as follows: (i) up to 2000 hectares, 1 daily minimum wage; (ii) above 2000 to 5000 hectares, 2 daily minimum wages; and (iii) above 5,000 and 10,000 hectares, 3 daily minimum wages. Pursuant to the 2010 Amendment, surface taxes are dependent upon the extension and time elapsed in the concession as follows: (i) years 1 to 5, 1 daily minimum wage; (ii) years 6 and 7, 1.25 daily minimum wages, and (iii) years 8 to 11, 1.5 daily minimum wages. Titles in the exploitation phase do not require payment of surface taxes. All Eco Oro’s surface tax obligations are governed by the provisions of the 2001 Mining Code.
The 2001 Mining Code requires an environmental mining insurance policy for each concession to ensure compliance with mining and environmental obligations as follows: (i) 5% of the budget for the annual investments during the exploration and the construction phases, and (ii) 10% of the result of multiplying the estimate of annual production (volume) and the price of the mineral at the mine head. The 2010 Amendment provides for the possibility of substituting the insurance with a personal guarantee.
Surface rights are not considered a part of the mining titles or rights and are not governed by mining laws even though the mining regime provides for expropriation of real property and the imposition of easements and rights of way. Surface rights must be acquired directly from the owners of such rights but it is possible to request that judicial authorities facilitate expropriation and/or grant easements or rights of way necessary for a mining operation.
In order to initiate the construction phase, a company must file a PTO within the final three 3 months of the exploration phase. The PTO is a technical document that describes, among others things, the area of operation, the characteristics of reserves to be exploited, the location of facilities and mining works, the mining plan of exploitation, the scale and duration of the expected production, the physical and chemical characteristics of minerals that are going to be exploited and the closure plan of exploitation and abandonment of the assemblies and the infrastructure. During the construction phase, the concessionaire may make changes and additions that are necessary prior to filing with the environmental and mining authorities. During this phase, the concessionaire is authorized to initiate anticipated exploitation and make use of provisional equipment and civil works.”
Once a new mining title is granted, or a mining title assigned, it requires registry before the national authority for the purpose of their inscription, authenticity, validity and publicity.
Over the past fifteen years, Eco Oro has acquired outright ownership of a total of 14 mining titles by purchase or by application to governmental agencies (concession contracts, exploitation licenses, and exploration licenses) covering approximately 30,000 hectares in the municipalities of California, Vetas, Suratá, Charta and Tona in the Department of Santander, where the Móngora Project is located and in Cucutilla and Mutiscua in the Department
RESOURCE ESTIMATION OF THE MÓNGORA GOLD-SILVER DEPOSIT
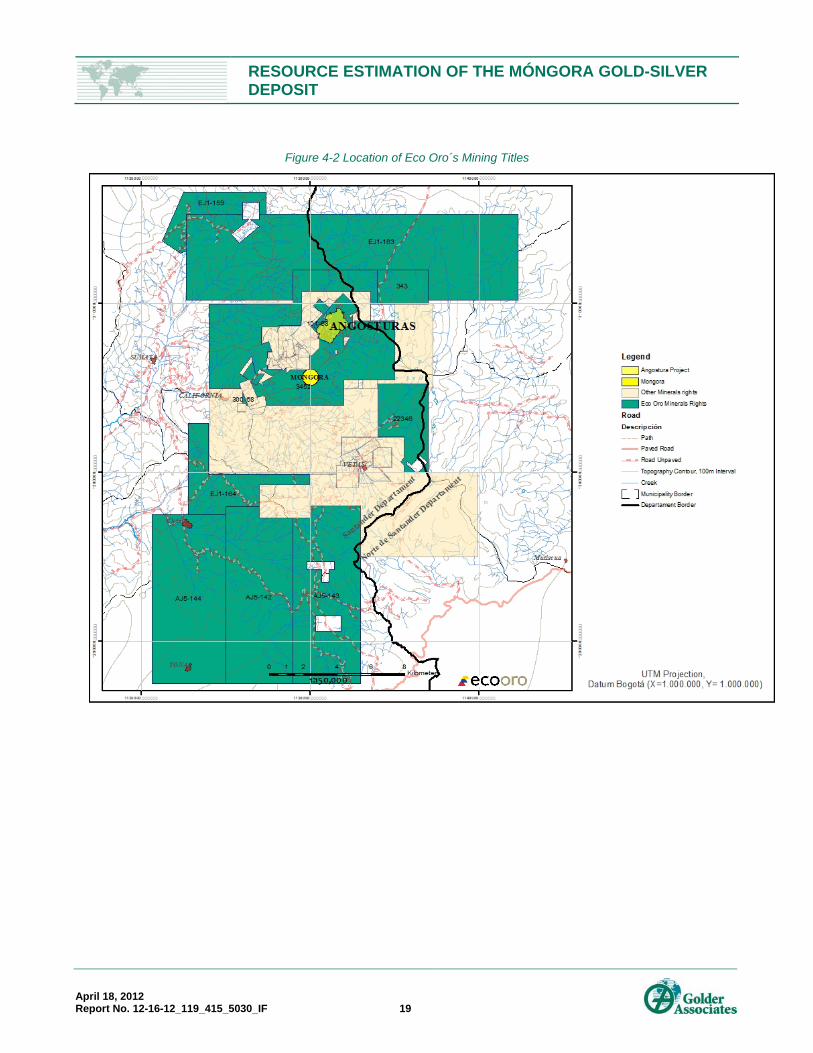
April 18, 2012 Report No. 12-16-12_119_415_5030_IF 18
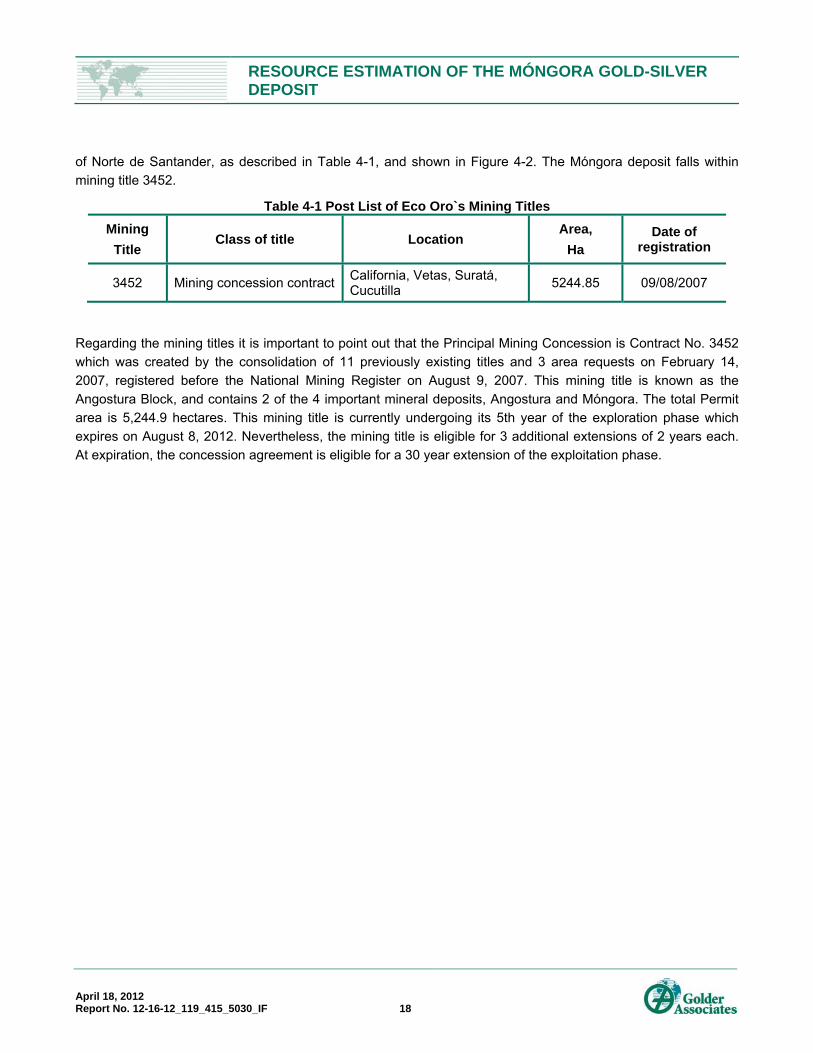
of Norte de Santander, as described in Table 4-1, and shown in Figure 4-2. The Móngora deposit falls within mining title 3452.
Table 4-1 Post List of Eco Oro`s Mining Titles Mining
Title Class of title Location
Area, Ha
Date of registration
3452 Mining concession contract California, Vetas, Suratá, Cucutilla 5244.85 09/08/2007
Regarding the mining titles it is important to point out that the Principal Mining Concession is Contract No. 3452 which was created by the consolidation of 11 previously existing titles and 3 area requests on February 14, 2007, registered before the National Mining Register on August 9, 2007. This mining title is known as the Angostura Block, and contains 2 of the 4 important mineral deposits, Angostura and Móngora. The total Permit area is 5,244.9 hectares. This mining title is currently undergoing its 5th year of the exploration phase which expires on August 8, 2012. Nevertheless, the mining title is eligible for 3 additional extensions of 2 years each. At expiration, the concession agreement is eligible for a 30 year extension of the exploitation phase.
RESOURCE ESTIMATION OF THE MÓNGORA GOLD-SILVER DEPOSIT
April 18, 2012 Report No. 12-16-12_119_415_5030_IF 19
Figure 4-2 Location of Eco Oro´s Mining Titles

RESOURCE ESTIMATION OF THE MÓNGORA GOLD-SILVER DEPOSIT
April 18, 2012 Report No. 12-16-12_119_415_5030_IF 20
4.3 Surface Rights, Easements and Rights of Way Land acquisition in Colombia is subject to the compliance of certain formalities according to the Colombian Civil Code, such as the execution of a public deed and further registry before the Public Acts Registry Office. Forms of acquisition include, amongst others, acquisition agreements, hereditary rights, foreclosures, or by way of prescriptive rights (statute of limitations on possession). Registry before the aforementioned office is required to consolidate property upon the holder.
Mining is considered of public utility and an activity of public interest, therefore the owner of a mining concession is also entitled to request from judicial authorities: (i) the imposition of easements or rights of way necessary for the operation, and (ii) request expropriation of lands needed for the project, when it is not possible to have an agreement with the land owner. In any case, Eco Oro has the obligation of paying the affected third party all amounts determined as compensation by administrative and/or judicial authorities for this purpose. Easement rights may be requested from the moment of the execution of the concession agreement. On the other hand, expropriation will require prior approval of the Civil Works Program (PTO) by the mining authority in order to be enforced.
The region in which the Móngora deposit will be developed is characterized by a high degree of informality in holding of land. Therefore, the most common forms of acquisition are acquisitions agreements with registered owner(s), assignment agreements over owners´ hereditary rights from next of kin, and agreements over material possession rights when there is informality in land property. To date Eco Oro has not filed for an imposition of an easement or right of way, nor has it initiated expropriation legal actions against third parties.
As a consequence of informality, the acquisition of surface rights, easements or rights of way, is often a lengthy process. Even though material possession of lands may be easily exercised, the process of property acquisition can take several years when the owners do not have proper registered titles over land. Nevertheless, Colombian law provides for the possibility of settling land titles by the application of a statute of limitations of prescriptive right based on material possession of lands.
Currently Eco Oro has outright ownership of approximately 3,700 ha subject to certain deferred payments being made. These are summarized in Table 4-2 and are shown in Figure 4-3 which shows the location of the Project in relation to the acquired surface rights. Eco Oro has also executed several private agreements with third parties for rights of way on to properties not owned by Eco Oro in order to perform exploration activities and geological scoping.
Table 4-2 Surface Rights Acquisition Summary Table # Land Property Name Area (ha) Municipality/Department 1 Angostura (consolidation of several lots) 736.09 California/Santander 2 Padilla 15.98 Suratá/Santander 3 La Herrera 18.52 California/Santander 4 La Casita 31.00 California/Santander 5 Romeral-Carrizal 383.50 Cucutilla/Norte de Santander 6 Romeral 535.55 Cucutilla/Norte de Santander 7 La Armenia 175.24 California/Santander 8 Miraflores 36.95 California/Santander

RESOURCE ESTIMATION OF THE MÓNGORA GOLD-SILVER DEPOSIT
April 18, 2012 Report No. 12-16-12_119_415_5030_IF 21
# Land Property Name Area (ha) Municipality/Department 9 La Casita 11.1 California/Santander 10 La Berenciana 16.23 California/Santander 11 Cruz 8.80 California/Santander 12 Los Llanitos 14.63 California/Santander 13 Esmeralda – DIVISO 8.89 California/Santander 14 El Cadillal 68.95 California/Santander 15 El Bosque 9.00 California/Santander 16 El Salibal 28.83 California/Santander 17 Las Pavas 89.98 Vetas/Santander 18 El carbon- Lagunas coloradas 6.19 Vetas/Santander 19 Los Robles 14.57 California/Santander 20 Las Puentes (*) 1,034.35 Vetas/Santander 21 La Esmeralda (*) 86.38 California/Santander 22 El Jordán-El Carbón 34.85 Vetas/Santander 23 Laguna la Virgen 188.7 Vetas/Santander 24 La Venezuela 15.9 Vetas /Santander 25 Pajarito 147.8 Vetas/Santander
TOTAL 3717.98 (*) Right over the land property as part of a process of succession Purchased Urban Land (In California Town) # Land Property Name Area (ha)
1 Lot Cra 4 No 3-10-California (Greystar’s House) 0.19 California/Santander
2 Lot San Francisco 6.37 California/Santander 3 Lot 6 0.07 California/Santander 4 Lot 7 0.07 California/Santander
5 Lot Cra 6 No. 3-26 and cll 4No. 5-41/45/49 (Core Shack) 0.3570 California/Santander
TOTAL 7.05 Agreement Signed – Pending Judicial Process # Land Property Name Area (ha) 1 El Alta - Deed 2176 Reg. 300-242 30.68 California/Santander 2 Padillo 3.54 Suratá/Santander 3 San Julian 18.00 California/Santander 4 La Rinconada 64.5 Vetas/Santander
TOTAL 116.72 |(*) Right over the land property as part of a process of succession

RESOURCE ESTIMATION OF THE MÓNGORA GOLD-SILVER DEPOSIT
April 18, 2012 Report No. 12-16-12_119_415_5030_IF 22
Figure 4-3 Location of Eco Oro´s surface rights
4.4 Environment Mining activities are subject to environmental regulations promulgated by government agencies from time to time. Environmental legislation generally provides for restrictions and prohibitions on spills, releases or emissions of various substances produced in association with certain mining industry operations, such as seepage from tailings disposal areas, which would result in environmental pollution. A breach of such legislation may result in imposition of fines and penalties. The Constitution, the National Code of Renewable Natural Resources and Protection of the Environment (Decree – Law 2811 of 1974) as well as Law 99 of 1993, form the basis of environmental regulations in Colombia.
Under the environmental legal regime, the use of water (superficial or underground), air, flora and fauna, as well as the generation of solid and liquid discharges and waste dumps are subject to prior licenses, permissions and concessions. Environmental legislation in Colombia is evolving and the general trend has been towards stricter standards and enforcement, increased fines and penalties for noncompliance, more stringent environmental assessments of proposed projects and increasing liability for companies and their officers, directors and employees.
RESOURCE ESTIMATION OF THE MÓNGORA GOLD-SILVER DEPOSIT
April 18, 2012 Report No. 12-16-12_119_415_5030_IF 23
The principal environmental authority in Colombia is the Ministry of Environment and Sustainable Development, with national jurisdiction, in charge of formulating environmental and renewable natural resources policies and defining regulations focused on reclamation, conservation, management and use of natural resources and surveillance of all activities that may have an environmental impact. Recently, all activities associated with environmental permitting and controls have been delegated to the National Environmental Licensing Authority (Autoridad Nacional de Licencias Ambientales or “ANLA”). At a regional level, the Ministry of Environment and Sustainable Development and ANLA functions are executed by Regional Autonomous Corporations. Together they constitute the principal environmental authorities. In the Company’s area of operation, the Regional Autonomous Corporation in charge of environmental surveillance is the CDMB (Corporación de Defensa de la Maseta de Bucaramanga). The Ministry of Environment and Sustainable Development is entitled to take control over Regional Autonomous Corporations at its discretion, on a case by case basis, when circumstances require it to do so. Both authorities have the following functions: (i) prevent and/or suspend any activity it deems contrary to environmental standards; (ii) reserve and define areas excluded from mining activities (i.e. forest reserves and páramo ecosystem); and (iii) approve environmental instruments, such as environmental management plans (Planes de Manejo Ambiental or “PMAs”), mining and environmental guides (Guías Minero Ambientales or “GMAs”) and Environmental Impact Assessments (Estudios de Impacto Ambiental or “EIAs”), environmental licences and permits.
PMAs, GMAs and EIAs are the principal environmental instruments that allow the Government to oversee activities that have the potential to impact the environment. These documents must be adopted by the concessionaire and define detailed measures and activities to be implemented for the mitigation, compensation and prevention of adverse environmental effects of a project. They also include follow-up, monitoring, contingency, and abandonment activities. Execution of activities under the exploration, construction and exploitation phase requires the approval of one of these instruments. Prospecting activities are not subject to environmental permitting, without prejudice of any permit or concession necessary for the use of natural renewable resources.
Mining operations (in their exploration, construction and exploitation phases) that started activities before Law 99, 1993 was in force are subject to the application of a PMA previously approved by a Regional Autonomous Corporation. After Law 99, 1993 came into force, construction and exploitation operations required the approval of an environmental license and only exploration phase activities remained subject to the application of a PMA previously approved by a Regional Autonomous Corporation. After Law 685, 2001 came into force, GMAs replaced PMAs for exploration phase activities. Neither a PMA nor a GMA constitute permission to use natural resources and therefore authorization of the corresponding environmental authority is required (e.g. water concessions, dumping permits). Environmental licenses, however, include all necessary permits for the use of natural resources. Initiation of the construction and exploitation phase requires granting of the environmental license. Under the current mining regime, an environmental license for a gold project is granted by ANLA when total tonnage of extracted ore material and waste material is equal or more than 2,000,000 tons per year. Regional Autonomous Corporations will grant environmental licenses whenever total tonnage of extracted ore material and waste material is less than 2,000,000 tons per year. The Angostura Project is expected to be subject to ANLA jurisdiction.
An environmental license request may require public hearings at which the company presents the project and allows the community to understand its scope, as well as to express their opinion on the feasibility of the project. Public hearings have to be expressly requested by third parties. The request also requires filing of an EIA which

RESOURCE ESTIMATION OF THE MÓNGORA GOLD-SILVER DEPOSIT
April 18, 2012 Report No. 12-16-12_119_415_5030_IF 24
will contain elements, information, data and recommendations as may be required to describe and characterize the physical, social and economic environment of the place or region of the works of exploitation; the impact of such works with its corresponding evaluation; plans for prevention, mitigation, correction and compensation of those impacts; specific measures to be applied to the abandonment and closure of the mining works and its management plan; and the necessary investment and monitoring required with respect to these activities. Once an environmental license has been granted, the company may initiate construction and exploitation activities.
The 2001 Mining Code, as well as the 2010 Amendment and the National Development Plan define the existence of areas that may be excluded from mining activities, such as regional parks and highland ecosystems referred to as páramo. For an area to be excluded from mining it the geographic boundary must have been determined by the relevant environmental authority based on technical, social and environmental studies, which support the incompatibility of mining activities, or in the specific case of páramo ecosystems, which support the existence of said ecosystems. Currently both the Ministry of Environment and Sustainable Development and CDMB are working on the definition of a regional park, as well as a páramo ecosystem in the area where the Angostura Project is located. A final decision on the regional park and páramo ecosystem will be made by the Ministry of Environment and Sustainable Development and the CDMB but should not directly affect the Móngora deposit.
Eco Oro holds and has the corresponding PMA and GMA approved for its mining operation in the Angostura block. In addition, Eco Oro has received the terms of reference for the preparation of the corresponding EIA for the Angostura Project.
4.5 Water Rights The use of surface or underground water requires prior concession from the Regional Autonomous Corporations (CAR). For the Angostura project, the CAR is the Corporación de Defensa de la Maseta de Bucaramanga (CDMB). Likewise, water discharge requires permitting from the same authority. Both water concessions and discharge permits require payment of fees to the Regional Autonomous Corporation. Eco Oro holds the following Water Rights granted by the CDMB (Table 4-3).
Table 4-3 Water Rights granted by the CDMB Resolution Creek L/S Allowed Uses Expiration
Res. 768, 2004 El Pozo 0.1764 Mining activities and human consumption August 2014
Res. 770, 2004 Angostura 4.0101 Industrial use and human consumption August 2016
Res. 771, 2004 La Venta 3.0174 Industrial use and human consumption August 2016
Eco Oro has filed requests for discharge which are currently under study by the CDMB.
4.6 Royalties Royalty is payable to the Government for every ounce of mineral produced. Calculation is based on a 4% royalty rate over 80% of the average of the previous month’s international price published by the London Metal Exchange.
Eco Oro has no private royalty agreements that relate to the Móngora deposit.
RESOURCE ESTIMATION OF THE MÓNGORA GOLD-SILVER DEPOSIT
April 18, 2012 Report No. 12-16-12_119_415_5030_IF 25
5.0 ACCESSIBILITY, CLIMATE, LOCAL RESOURCES, INFRASTRUCTURE AND PHYSIOGRAPHY
5.1 Accessibility Current Project access from Bucaramanga is via the partially-paved Matanza–Surata–California road, a distance of 67 km and travel time of two to three hours, depending on weather conditions. Within the Project area, there are direct accesses only by horse and foot trails.
Bucaramanga has an airport, with daily flights to Bogota, Medellin, Cartagena and Panama City and regional centers serving the interior lowlands (llanos). Helicopter flights to the Project are also conducted from Bucaramanga.
The closest port is Santa Marta, 550 km from the Project site.
5.2 Climate The Project experiences two wet seasons, from April to June and from September to November. January is the driest month, April the wettest. The climate is highland tropical, with the average annual temperature being 8.7- 9.8°C, ranging between 0.8°C and 26.9°C. Rainfall averages 1,182 mm, and the evaporation rate is about 576 mm. Relative humidity averages 73%.
5.3 Local Resources and Infrastructure The Móngora Project is located in a relatively undeveloped region in the department of Santander. The closest communities are the small towns of California (population 393), Vetas (417), Suratá (436), Tona (496) and Cucutilla (451). These towns can provide basic services. Most supplies and services are sourced from Bucaramanga. There is currently no existing Project infrastructure.
5.4 Physiography The Project is located in steep and relatively rugged mountainous terrain at elevations ranging from 2,200 m.a.s.l. to 3,200 m.a.s.l.
The Project is situated in the Móngora Creek Catchment basin, which itself is one of the headwaters of the Vetas River, located approximately 4 km east-northeast of the town of California The principal economic activity in the area is the small-scale exploitation of gold, while agriculture, cattle husbandry and basic commercial activities are of lesser significance. Agriculture is carried out using traditional methods with low yields, and cattle are primarily bred for meat production for local demand.
Vegetation in the higher part of the Móngora area is upper alpine forest where high mountain oak trees occur.
6.0 HISTORY Early mining activity comprised artisanal activities that ranged from pre-Colombian time, and later Spanish excavations. At the end of World War 1, the British company Colombian Mining Association and French company Francia Gold and Silver operated in the area.
RESOURCE ESTIMATION OF THE MÓNGORA GOLD-SILVER DEPOSIT
April 18, 2012 Report No. 12-16-12_119_415_5030_IF 26
In 1947, The Anaconda Company (Anaconda) completed detailed geologic surface and underground mapping and core drilling (746 m) between the La Baja and La Alta areas. The Nippon Mining Company in 1967 undertook drilling in the La Baja area. Exploration activity was undertaken by Placer Development and Ingeominas in the 1970s and 1980s respectively.
Exploration by Eco Oro commenced in the area of the Móngora deposit in 1994, and to 1999, geologic mapping, surface rock sampling, core drilling (181 drill holes, 52,000 m) and metallurgical test work were completed on the Angostura deposit. A small part of the underground development created by artisanal miners was mapped and sampled, and based on areas that were safely able to be inspected; about 13,000 t at about 8 g/t Au has been excavated. Mineral resource estimates were undertaken in 1997, and updated in 1999. An engineering study, termed a “pre-feasibility study” at the time was also undertaken in 1998, and envisioned either; an open pit/ heap leach operation, or an open pit feeding agitated leach and heap leach facilities.
After completion of the preliminary study, Kinross Gold Corporation, who at the time was a significant shareholder in Eco Oro, performed a mineral resource estimate update in 1999.
From 2000 to 2003, due to security constraints, no work was undertaken. From 2003, work has included geochemical sampling, geologic mapping, adit and tunnel excavation, core drilling, and condemnation drilling. Mineral resource estimates were performed in 2005, 2006, 2007, 2008, and 2010. Preliminary assessment (PA) studies for open pit were completed in 2008. Mineral reserve estimation was undertaken in 2009 together with additional metallurgical testwork.
The pre-feasibility study, completed in 2009 by GRD Minproc, envisaged open pit mining, followed by a conventional processing facility using two process routes, cyanide heap leaching of oxide, transition and low sulphur ore to produce doré, and grinding and flotation of high sulphur/high gold content ore to produce concentrates. Based on the assumptions in the study, the Project returned positive economics.
A feasibility study for an open pit operation was commissioned during 2010. This study did not progress to implementation and some of the technical studies executed in this phase are being used to support the evaluation of underground mining exploitation option for the Angostura deposit.
Eco Oro withdrew the Environmental Impact Assessment (EIA) and the work and investment plan for exploitation (PTO) from the MAVDT and Ingeominas respectively. Both studies were prepared based on open pit mining.
Eco Oro considered that regional and national government and the community of Bucaramanga did not support the project as configured for an open pit operation. Eco Oro is currently studying the underground mining option for the project reported in the updated PEA of March 23, 2012.
In April 2011 an initial underground PEA carried out by NCL Consultores was released. The underground mining potential and the preliminary mine production presented in this PEA were constrained by the terms of reference including a gold price of USD850/oz, a gold cut-off grade of 3.0 g/t and a resource estimation update with effective date March 18, 2011. This resource estimation update included drill and assay data acquired up to July 2010
In March 2012 an updated PEA for the exploitation of the Angostura Deposit by an underground mining was filed on SEDAR. This PEA was developed by Golder and included a resource estimation update using drill and assay data acquired up to May 2011.

RESOURCE ESTIMATION OF THE MÓNGORA GOLD-SILVER DEPOSIT
April 18, 2012 Report No. 12-16-12_119_415_5030_IF 27
7.0 GEOLOGICAL SETTING AND MINERALIZATION The information contained in sections 7.1 and 7.2 include extracts from previous technical reports issued by Eco Oro and their agents.
7.1 Regional Geology The Project is situated in the northern Andes ranges, north of the point of bifurcation of the Eastern Cordillera into the western and eastern branches. The eastern branch, hosting the Project, includes the Santander Massif. The oldest rocks in the Massif are Precambrian gneisses and schists that were part of the Guyana Shield, and which have been regionally metamorphosed to upper amphibolite grade in the Palaeozoic. Figure 7-1 presents a regional geological map covering the area of the deposit.
Intruding the metamorphic rocks is the diorite to granite composition rocks that belong to the Triassic–Jurassic Santander Plutonic Group. These intrusions were accompanied by felsic to andesitic volcanism. During subsequent back-arc development, a number of basins were formed and filled with marine transgressive sediments. During the Late Cretaceous to Paleocene/Eocene, folding and thrusting of the Eastern Cordillera resulted in basin inversion and uplift, and intrusion of Middle Miocene porphyritic bodies of rhyodacitic and dacitic composition.
Uplift and erosion occurred during the Late Eocene to Early Oligocene, with reactivation of older structures and continued uplift during the Middle to Late Miocene. As a result of ongoing tectonic plate movements, the area is currently undergoing additional deformation, with rapid basin inversion and uplift.
Gold mineralization occurs within the Angostura–California gold province, a belt of epithermal gold occurrences that has developed along the regional-scale Rio La Baja fault in association with the Middle Miocene stocks.
7.2 Deposit Geology 7.2.1 Lithology
In the eastern sector of Móngora the Bucaramanga Gneiss unit occurs, formed by a high-grade metamorphic sequence of paragneises and feldspathic quartz composition ortogneises. Augen textures are observed with banded, migmatitic, local quartz lenses and insertions of feldspathic pegmatite. Pre-Cambrian age amphibolite-granulite facies rocks with propylitic alteration characterized mainly by the presence of chlorite, epidote and ankerite. Triassic-Jurassic age quartz diorite and tonalitic intrusive bodies outcrop in the central and western of the Móngora area presenting phyllic and propylitic alteration, silicification and subordinate argilic alteration. In the southwest sector dacitic porphyry bodies and tuffaceous dykes are observed. The occurrence of bipyramidal quartz veins with phyllic, argilic and silicification are also observed. Mineralogy and texture of pre-existing rocks were affected by hydrothermal fluids associated with proximal porphyry bodies.
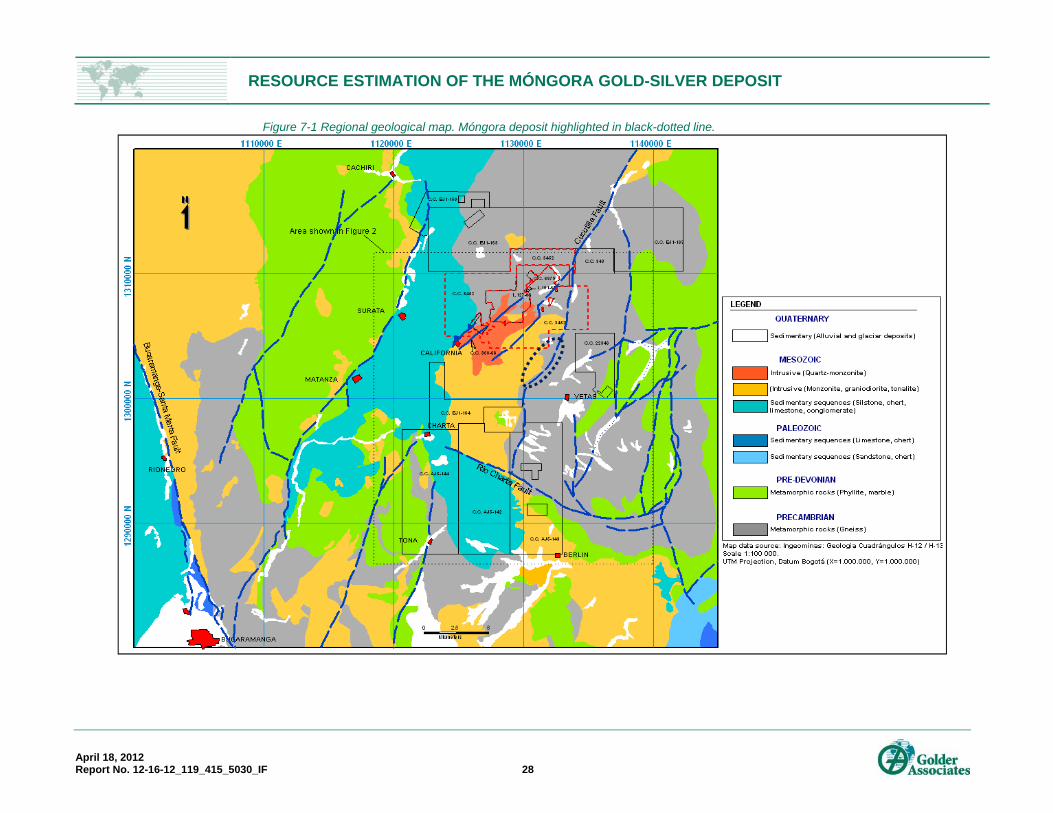
RESOURCE ESTIMATION OF THE MÓNGORA GOLD-SILVER DEPOSIT
April 18, 2012 Report No. 12-16-12_119_415_5030_IF 28
Figure 7-1 Regional geological map. Móngora deposit highlighted in black-dotted line.

RESOURCE ESTIMATION OF THE MÓNGORA GOLD-SILVER DEPOSIT
April 18, 2012 Report No. 12-16-12_119_415_5030_IF 29
7.2.2 Geomorphology Móngora is characterized by smooth hills in its eastern part, cliffs defined by faults in the center and by narrow and deep valleys in the west. The drainage system is mainly dendritic to parallel characteristic for metamorphic and intrusive rocks. In the central sectors where topography is steep there is an exuberant oak forest (Figure 7-2).
Figure 7-2 Aero photographic mosaic of Móngora sector.
7.2.3 Structural Geology
The area is tectonically affected by the La Baja - Cucutilla fault system, within which the parallel Mongora Romeral fault is related to the Mongora deposit. This system has a predominant NE direction. Minor structures with direction N-NW cut this structure generating a graben system (Figure 7-3). The Mongora setting is analogous to Angostura which is confined between two parallel transpressional confining structures with internal extensional structures hosting mineralization.
N
Mongora Area
Mongora Valley

RESOURCE ESTIMATION OF THE MÓNGORA GOLD-SILVER DEPOSIT
April 18, 2012 Report No. 12-16-12_119_415_5030_IF 30
Figure 7-3 Stress diagrams for different types of faults, veins and fractures associated to Violetal, La Plata and Móngora
areas and Angostura. Note the N-NE trend fault tensor for faults, veins and fractures (in red).
7.2.4 Hydrothermal alteration
Although alteration and mineralization are not as strongly developed as those observed in Angostura Project, The Móngora deposit also presents multiple higher grade mineralized structures with EW, E-SW and NE trends. The hydrothermal alteration observed in field is evidenced by the presence of illite, chlorite, epidote and kaolinite. In deeper zones carbonate (ankerite, kutnohorite, dolomite and calcite) occurs. In the last depths of some drill holes (MO10-10 and MO09-12) gypsum was identified.
According to the intensity of the alteration, presence of isolated structures with internal alteration and mineralogical assemblage, it is possible classify Móngora as a phyllic and propylitic alteration system within a low to intermediate sulphidation system.
The mineralogical assemblages identified in Móngora are (Figure 7-4):
• Carbonate-illite_Silice-Chlorite_Epidote • Carbonate-Kaolinite_Silice-Chlorite_Epidote • Carbonate-Silice-Gypsum Illite
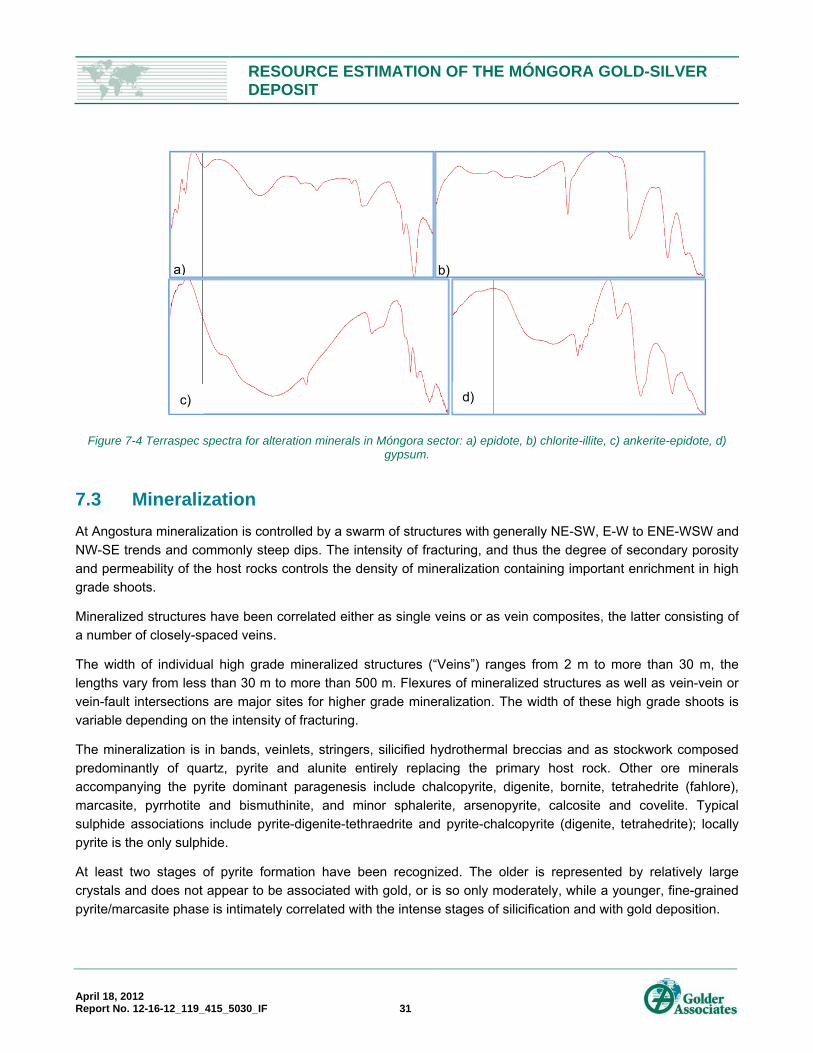
RESOURCE ESTIMATION OF THE MÓNGORA GOLD-SILVER DEPOSIT
April 18, 2012 Report No. 12-16-12_119_415_5030_IF 31
Figure 7-4 Terraspec spectra for alteration minerals in Móngora sector: a) epidote, b) chlorite-illite, c) ankerite-epidote, d) gypsum.
7.3 Mineralization At Angostura mineralization is controlled by a swarm of structures with generally NE-SW, E-W to ENE-WSW and NW-SE trends and commonly steep dips. The intensity of fracturing, and thus the degree of secondary porosity and permeability of the host rocks controls the density of mineralization containing important enrichment in high grade shoots.
Mineralized structures have been correlated either as single veins or as vein composites, the latter consisting of a number of closely-spaced veins.
The width of individual high grade mineralized structures (“Veins”) ranges from 2 m to more than 30 m, the lengths vary from less than 30 m to more than 500 m. Flexures of mineralized structures as well as vein-vein or vein-fault intersections are major sites for higher grade mineralization. The width of these high grade shoots is variable depending on the intensity of fracturing.
The mineralization is in bands, veinlets, stringers, silicified hydrothermal breccias and as stockwork composed predominantly of quartz, pyrite and alunite entirely replacing the primary host rock. Other ore minerals accompanying the pyrite dominant paragenesis include chalcopyrite, digenite, bornite, tetrahedrite (fahlore), marcasite, pyrrhotite and bismuthinite, and minor sphalerite, arsenopyrite, calcosite and covelite. Typical sulphide associations include pyrite-digenite-tethraedrite and pyrite-chalcopyrite (digenite, tetrahedrite); locally pyrite is the only sulphide.
At least two stages of pyrite formation have been recognized. The older is represented by relatively large crystals and does not appear to be associated with gold, or is so only moderately, while a younger, fine-grained pyrite/marcasite phase is intimately correlated with the intense stages of silicification and with gold deposition.
a) b)
c) d)

RESOURCE ESTIMATION OF THE MÓNGORA GOLD-SILVER DEPOSIT
April 18, 2012 Report No. 12-16-12_119_415_5030_IF 32
8.0 DEPOSIT TYPES The Angostura deposit is a typical example of a high-sulphidation epithermal deposit. Global examples of such deposits include Summitville (Colorado, USA); Nansatsu (Japan), El Indio (Chile); Temora (New South Wales, Australia), Pueblo Viejo (Dominica), and Lepanto (Philippines).
The Móngora deposit is part of the California–Vetas gold-silver district province of the Eastern Cordillera in northeastern Colombia, a belt of epithermal gold occurrences developed along the Rio La Baja regional fault , and the parallel Móngora – Romeral Fault that trends in a northeasterly direction from the town of California and from the Vetas River (Felder et al., 2000). The fault transects pre-Devonian granitoid bodies, high-rank metamorphic rocks and overlying Lower Cretaceous sediments – quartzite, shales, limestone and argillite. Middle Miocene (Tortonian) volcanic and subvolcanic stocks represent the last magmatic event in the California-Angostura district (Mantilla, et al., 2009; Leal, et al., this volume). These small, irregular shaped porphyritic bodies of rhyodacitic and dacitic composition have yielded radiometric ages of 8.4 ± 0.2 Ma and 9.0 ± 0.2 Ma (U-Pb) (Mantilla et al., 2009). Intense hydrothermal activity related with these porphyry intrusions gives rise to the gold and silver mineralization.
The California district, of which Móngora is one of the deposits, can be characterized as a structurally controlled, uplifted and deeply eroded, high-sulphidation epithermal gold deposit system. The deposit in this camp are interpreted as being the lower part of a lithocap, as defined by Sillitoe (1995), that was eroded during uplift of the Northern Andes and that exposed the sericite – illite – quartz zone of a Cu-Mo-Au porphyry system, containing important contents of gold and silver, mainly associated with pyrite.
Most of the gold is contained within several sets of anastomosing veins and tabular silicified zones. The hydrothermal alteration in the center of the structures is mainly quartz-alunite, and more distal to this sericite, illite, smectite, kaolinite and finally chlorite, showing a gradual change from acid to basic alteration moving away from the veins.
The discovery of copper-molybdenum mineralization in an intrusive breccia approximately 1.5 kilometres to the west of Angostura suggests that the gold mineralization at Móngora may be associated with a porphyry system at depth. The exploratory works in this area have showed evidence of hydrothermal alteration, and contents of pyrite that suggest a potential that have to be properly investigated.
9.0 EXPLORATION Regional Geochemical soil sampling campaigns have been undertaken in the areas of the Móngora–Angostura area and some of the adjacent showings s, and more than 4,000 samples have been taken on a grid with an initial spacing at 100 or 200 meters with later infill sampling in more promising target areas. Samples were taken at an average depth of 0.8 m. The samples were analysed for 37 elements using ICP mass spectroscopy analysis of 15-gram aliquots after agua regia digestion. As a result of this work, gold anomalies were identified in such areas as Animas, Móngora, Violetal and La Plata.
Similar to the Angostura deposit, the Móngora prospect hosts higher-grade gold mineralization including for example 16.3 grams gold per tonne over 1.05 meters and 12.35 grams over 1.6 meters and 116 grams over 2 meters, within broader zones of lower-grade gold mineralization. The delineation for oxide and transitional gold
RESOURCE ESTIMATION OF THE MÓNGORA GOLD-SILVER DEPOSIT
April 18, 2012 Report No. 12-16-12_119_415_5030_IF 33
mineralization in the Móngora area could be very important for the Angostura project. The potential of outlining a new oxide resource that could be added to the Angostura deposit resources could have favourable implications for the overall economics of the entire Angostura project. In 2010 36 drill holes were drilled comprising 13,263.95 meters and in 2011 a 402.3 meters drill hole was completed resulting in a total of 56 drill holes measuring 19,557.3 meters since 2008.
9.1 Grids and Surveys The coordinate system used for the Project is based upon the Universal Transverse Mercator (UTM) projection (datum Bogota – Zone: 18N).
Topographic data used to delimit the Mineral Resources was provided by Eco Oro, and has a resolution of ± 5 m within the areas of the mineral deposit. A regional topographic restitution was carried out in 2008 by the Colombian company Aeroestudios Ltda. from Medellin, who took the aerial photographs for 16,000 hectares in the surrounding area of the project covering the mine infrastructure foreseen in the open pit project of the prefeasibility study. Detailed topography was carried out from 2008 to 2010 by Estudio-T Rural from Bucaramanga, for the individual areas of the mine infrastructure, using total stations for surveying.
The drill hole collars measurement was performed by professional surveyor using total station equipment.
The topographic measuring method used for the Angostura project is considered appropriate.
9.2 Geological and Structural Mapping Geological mapping has been performed by the geological staff of Eco Oro since 1995, at map scales that vary from 1:25000 for the surrounding areas of the project and detailed mapping up to 1:5000 on the deposit and potential areas for the placement of infrastructure.
Results of the geological mapping of lithology, structure, hydrothermal alteration and mineralization supported the geological interpretations used for resource estimation, and provided vectors for channel sampling and drill targeting.
9.3 Geochemistry As part of exploration work, soil and stream geochemical samples were collected until May 2011 for a combined total of 12,742 m sampled and 4,307 samples corresponding to the Angostura project and 1,106 samples in different areas around the project. Mello and Felder (2010) report that:
“Geochemical soil sampling campaigns have been undertaken in the project and some surrounding areas, and more than 4,000 samples have been taken on a grid with an initial spacing at 100 or 200 metres with later in-fill sampling. Samples were taken at an average depth of 0.8 m.”
This work identified gold anomalies at Cristo Rey, La Alta Este, Los Laches, Animas, Móngora, Violetal and La Plata within the Project area (refer to Figure 9-1 for prospect and anomaly locations).
5,625 soil samples and 769 stream sediment samples have been collected in all of the mining titles owned by Eco Oro. The map of Figure 9-1 shows the rock (surface), soil and stream sediments samples collected in the area of Angostura project.

RESOURCE ESTIMATION OF THE MÓNGORA GOLD-SILVER DEPOSIT
April 18, 2012 Report No. 12-16-12_119_415_5030_IF 34
9.4 Drilling Drilling completed on the Project is discussed in Section 10.
9.5 Bulk Density Bulk density determinations are discussed in Section 11.3.
9.6 Petrology, Mineralogy and Other Research Studies Terraspec Mineral Spectrometer is being used for hydrothermal alteration minerals characterization and for alteration mapping. Limited petrographic work was done at the Industrial University of Santander in Bucaramanga.
9.7 Exploration Potential Significant additional exploration potential existsto the west and southwest of the Mongora deposit. Condemnation drilling and soil and rock geochemical studies have shown that to the east of the Mongora Fault there does not appear to be potential for significant mineralization.
Besides the Móngora occurrence major regional targets have been identified, Violetal, and La Plata, to the west of the Móngora deposit (Figure 9-2).

RESOURCE ESTIMATION OF THE MÓNGORA GOLD-SILVER DEPOSIT
April 18, 2012 Report No. 12-16-12_119_415_5030_IF 35
Figure 9-1 Geochemical Sample Location Plan
PA RAM O L O S PUEN TES
PA RAM O D E RO ME RAL
CUC
El M o rt i n o
La Esp eran za
Co r ral de Pi ed ra
PA RAM O D E M O NS ALVE
El Al p arga t al
Po t rer i l l o s
CUCH
ILLA
VIOL
ETA
L
Be r me j al
La Tro nado ra
Bu enos Ai r es
Sa n Pa l est i na
La Aur ora
Pe na d e O r o
CUCH
ILLA
DE M
ONSA
LVE
LO M A CO LO R ADO S
Sa n M ar t i n
Q . Cruceci t as
Q. Q
uelpa
La guna de Paez
Q. Que
lpa
La guna el Pi co
La guna Lar ga
Q . La Vaca
Q . La Virge n
Q . Lag. L arg a
La guna La Vi rg enQ
. Rom
eral
Q . El Mor ti ño
Q . El Po zo
Q . El M orti ño
Q . El Poz o
Q . Venad eros
Q . Val ados
Q. H
oya
Hond
a
Q. A
ngos
tura
Q. La
Per ezo
sa
Q . Paez
Q. V
i vito
Q . Paez
Q . Q ui nt a
Q. La Catalina
Q. M
ong
ora
Q. M
ong
ora
Q . Mo ngor a
Q . La Perezosa
Q . Ang ost uraQ. S
an J
uan Q
. San Andres
Q. Pot r eril los
Q. A
ngos
tura
Q . Paez
Q . Los Ar rayanes
Q. Barrien
tos
Q. San Lui s
Q. Las Anim
as
Q . Aserradero
Q.C
hicagua
Q.Sa
n Juan
Q. Agu
ali mpia
Q. San An
tonio
Q. L
a Pe
dreg
osa
os
Q . M onsa l ve
Q . Los Arrayanes
Q . Los Ci mient os
Q . Col oradas
Q. C
orra
l de
Pied
ra
Q . La Lom a
Q . Peña de Oro
Q . El Ced ral
Q. Corr
al de Pi ed
r a
Q . Al pargatal
Q . Al pargat al
Q . La Loma
Cñ da. Zepper
Q . La Plata
Q. La Higuera
Q. L
a Ba
j a
Q . La Baj a
Q . Tig uer ín
Q . Cho rrerón
RI O VE TASQ . Ag ual e j í a
C.C. 3452
C.C. EJ1-163
2
C.C. 300-68
P. 3451
CC. 327-68
CC. 328-68
CC. 328-68
CC. 328-68
CC. 328-68
Santander Department
Norte de Santander Department
Municipality
of Cali
fornia
Municipality
of Vetas
C.C. 6979
L.101-68
L.127-68
PAEZ PADPAEZ PAD
ANGO STURAS PAD
W ASTE DUMP
LOS LACHES
0
PLANT
1.50.75
kilometres
CRISTO REY
ANGOSTURAS PAD
LA ALTA
ANIMAS
W ASTE DUMP
MONGORA
Angostura Pit
VIOLETAL
LA PLATA
UTM Projection, Datum Bogotá (X=1.000.000, Y=1.000.000)
Greystar Mineral Rights
Department Border
Municipality Border
Stream Sediment Sample
Other Mining Properties
Creek
Rock Sample
Soil Sample
PFS Mining Infrastructure
Geochemical Samples
LEGEND
Map data source: Greystar Resources Ltd.
&&
1130000 E13
1000
0 N
1307
500
N13
0500
0 N
1127500 E 1132500 E 1135000 E
C.C. 3452
P. 3451
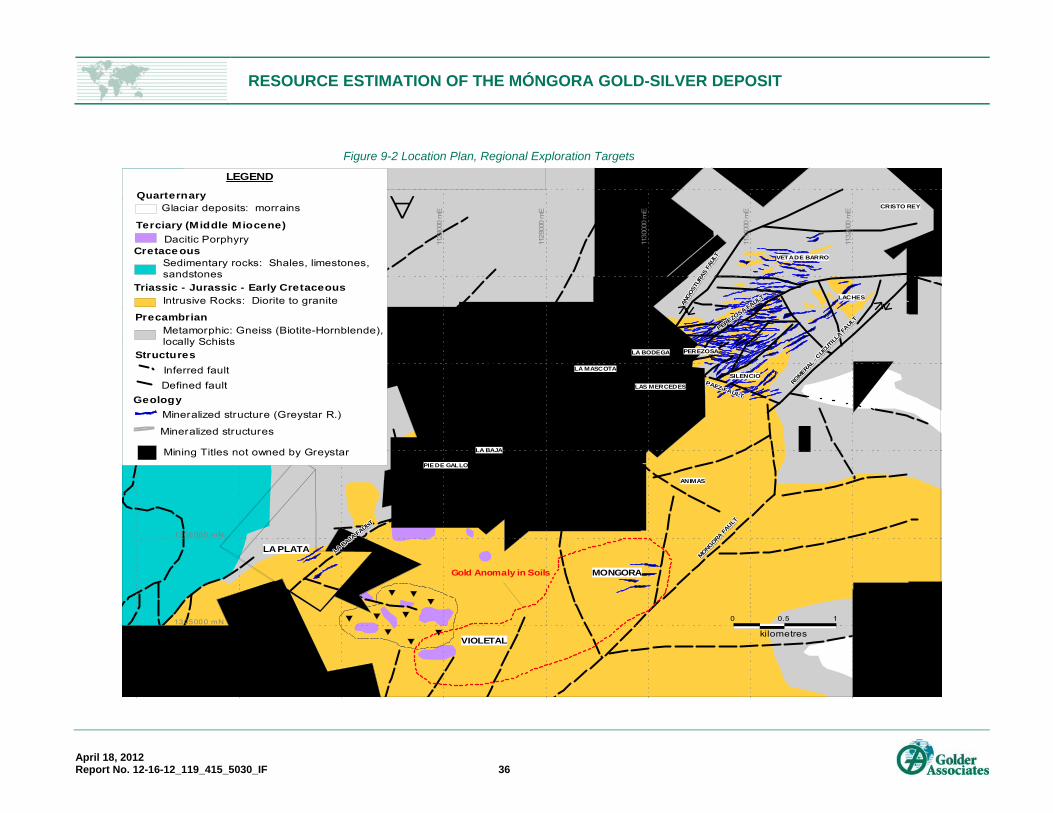
RESOURCE ESTIMATION OF THE MÓNGORA GOLD-SILVER DEPOSIT
April 18, 2012 Report No. 12-16-12_119_415_5030_IF 36
Figure 9-2 Location Plan, Regional Exploration Targets
H
1130
000
mE
1131
000
mE
1132
000
mE
1128
000
mE
1129
000
mE
1306000 mN
1305000 mN
1307000 mN
1308000 mN
1309000 mN
1127
000
mE
1125
000
mE
1126
000
mE
1310000 mN
LACHES
CRISTO REY
1
ROMERAL - C
UCUTILLA
FAULT
ROMERAL - C
UCUTILLA
FAULT
ROMERAL - C
UCUTILLA
FAULT
ROMERAL - C
UCUTILLA
FAULT
ROMERAL - C
UCUTILLA
FAULT
ROMERAL - C
UCUTILLA
FAULT
ROMERAL - C
UCUTILLA
FAULT
ROMERAL - C
UCUTILLA
FAULT
ROMERAL - C
UCUTILLA
FAULT
ROMERAL - C
UCUTILLA
FAULT
VETA DE BARRO
kilometres
0.5
SILENCIOPAEZ FAULT
PAEZ FAULT
PAEZ FAULT
PAEZ FAULT
PAEZ FAULT
PAEZ FAULT
PAEZ FAULT
PAEZ FAULT
PAEZ FAULT
PAEZ FAULT
PEREZOSA FAULT
PEREZOSA FAULT
PEREZOSA FAULT
PEREZOSA FAULT
PEREZOSA FAULT
PEREZOSA FAULT
PEREZOSA FAULT
PEREZOSA FAULT
PEREZOSA FAULT
PEREZOSA FAULT
ANGO
STUR
AS F
AULT
ANGO
STUR
AS F
AULT
ANGO
STUR
AS F
AULT
ANGO
STUR
AS F
AULT
ANGO
STUR
AS F
AULT
ANGO
STUR
AS F
AULT
ANGO
STUR
AS F
AULT
ANGO
STUR
AS F
AULT
ANGO
STUR
AS F
AULT
ANGO
STUR
AS F
AULT
0
PEREZOSA
MONGORA FAULT
MONGORA FAULT
MONGORA FAULT
MONGORA FAULT
MONGORA FAULT
MONGORA FAULT
MONGORA FAULT
MONGORA FAULT
MONGORA FAULT
MONGORA FAULT
ANIMAS
LA MASCOTA
LAS MERCEDES
LA BODEGA
MONGORA
VIOLETAL
Gold Anomaly in Soils
LA BAJA
PIE DE GALLO
LA BAJA FAULT
LA BAJA FAULT
LA BAJA FAULT
LA BAJA FAULT
LA BAJA FAULT
LA BAJA FAULT
LA BAJA FAULT
LA BAJA FAULT
LA BAJA FAULT
LA BAJA FAULT
LA PLATA
LEGEND
PrecambrianMetamorphic: Gneiss (Biotite-Hornblende), locally Schists
Triassic - Jurassic - Early CretaceousIntrusive Rocks: Diorite to granite
Cretace ousSedimentary rocks: Shales, limestones, sandstones
Terciary (Middle Miocene)Dacitic Porphyry
QuarternaryGlaciar deposits: morrains
StructuresInferred faultDefined fault
GeologyMineralized structure (Greystar R.)
Mineralized structures
Mining Titles not owned by Greystar
∀
RESOURCE ESTIMATION OF THE MÓNGORA GOLD-SILVER DEPOSIT
April 18, 2012 Report No. 12-16-12_119_415_5030_IF 37
10.0 DRILLING Drilling has been carried out since 2008 and a total of 20,276 meters have been completed.
10.1 Drill Contractors and Methods All drilling to date has been performed using diamond drills. Two Colombian contractors, Geominas and Perfotec have done all the drilling at Mongora. The contractor has used mainly Longyear wire line drill rigs (38 and 44).
Core size varied from BQ (36.5 mm diameter) to NQ (47.6 mm) to HQ (63.5 mm). By far the majority of the core size has been NQ, with HQ and BQ making up a lower proportion.
10.2 Core Logging All drill core has been photographed with digital records being kept on the company’s database system.
After photography, the Eco Oro geologists log the core in detail. Data recorded include the major and minor lithologies, mineralization style, intensity, and key minerals, the type and intensity of alteration, rock color, grain size, structural information such as brecciation and faulting, rock quality designation (RQD) and the degree of oxidation and weathering. The data was initially entered into paper log sheets and later into a computerized relational database.
10.3 Collar Surveys Drill hole collars in the field are clearly marked by wooden stakes bearing the information of hole number, azimuth, inclination, and coordinates. Drill collar locations have been verified by survey, and Eco Oro contracted a professional surveyor to perform the survey readings using total station equipment.
10.4 Down-Hole Surveys Down hole surveys were completed at surface and then at 25 m intervals until the end of the hole using a Reflex EZ-Shot instrument. Sometimes, when there were problems of hole stability, the measurements were taken at different intervals.
In Eco Oro’s experience, the 25 m readings indicate a systematic steepening of the holes by about 1.5° in the first 100 m. Azimuth deviations are of a similar order of magnitude, but can be in either direction, right or left. The degree of steepening and change of azimuth at greater depths is somewhat smaller, reducing to 1° for the dip and 0.3° for the azimuth per 100 m. These changes in drill hole attitude are small and reasonably predictable, so that, despite the absence of deviation determinations above a depth of 150 m in the earlier drill holes, the actual location of these holes will not be far from where they are plotted.
RESOURCE ESTIMATION OF THE MÓNGORA GOLD-SILVER DEPOSIT
April 18, 2012 Report No. 12-16-12_119_415_5030_IF 38
Golder considers that down-hole surveying carried out at Móngora is appropriate.
10.5 Recovery The average core recovery for the entire drill-hole database is approximately 93%. About 80% of the intervals are above a 90% recovery, a figure which includes near-surface recoveries that are typically very poor to a depth of about 5–10 m. Core recovery below a depth of approximately 20 m increases to an average 95%.
10.6 Drilling Used to Support Mineral Resource Estimation The data used was that available to October 2011. A total of 58 drill holes were used to prepare the geological model and the resource estimation. The average sample length of the core drill holes is approximately 2.0 m, the longest being 9.0 m long.
Drill holes were generally orientated perpendicular to the main mineralization trend. Dips vary depending on the target and range from -40º to -57º. Average drill spacing in the core of the deposit is approximately 50 m; this widens to 200 m drill spacing on the deposit edges.
11.0 SAMPLE PREPARATION, ANALYSES, AND SECURITY From project acquisition to date, project staff employed by Eco Oro was responsible for the following:
Sample collection
Core splitting
Density determinations
Sample preparation from March 2004 to date
Sample storage
Sample security
11.1 Sample Collection 11.1.1 Surface Sampling
Because of poor outcropping in the Móngora area, very few rock samples have been taken.
11.1.2 Core Samples Mineralized sections of core are sampled as follows:
Silicified rocks and zones of sulfides: 0.5 – 1.0 m.
Altered porphyry with between 1% and 10% alteration/sulfides: 1.0 – 2.0 m.
Porphyry and gneiss with minor alteration and sulfides 2.0 m.

RESOURCE ESTIMATION OF THE MÓNGORA GOLD-SILVER DEPOSIT
April 18, 2012 Report No. 12-16-12_119_415_5030_IF 39
Mafic gneiss and dyke without alteration: 2.0 - 3.0 m.
Sample intervals are marked on the core boxes and a paper ticket is placed with the core. The portion of core to be assayed is placed in a plastic sample bag with a sample ticket. A preparation laboratory is located at the Angostura camp and each sample is prepared as is described in the Section 11.4.
In general, longer samples were taken in areas believed to be of below economic cut-off grade. Few samples are less than 0.5 m long. Sampling observes obvious lithological, alteration, and mineralization breaks.
11.2 Analytical Laboratories ALS Chemex in Vancouver B.C., has performed assays on samples. The laboratory is independent of Eco Oro, and holds both ISO:9001:2000 and ISO17025 accreditation. ACME laboratories of Vancouver B.C. was used to perform control duplicates.
11.3 Density/Specific Gravity Eco Oro has undertaken 701 density measurements on drill core samples selected according the lithology, alteration and mineralization, using a wax immersion (ASTM C914-98) methodology. The Table 11-1 shows statistics for database.
Table 11-1 Density Database used in Modeling N. samples Min. Max. Std. Dev. Mean
701 1.85 3.56 0.041 2.603
Eco Oro has adopted a regression analysis to assign density values to the model. The methodology is presented in section 14.8.
11.4 Sample Preparation In March 2004 a preparation laboratory was established at the Angostura base camp. The site facility employs one Rhino and one Terminator jaw crusher. A charge of barren limestone or granite is passed between samples. After crushing, the sample, of an original mass of typically 1.5 kg to 3 kg, is blended and a sub-sample of nominally 250 g obtained by riffle splitting. Quality control (QC) measures include the weighing and screen analysis of one in 10 samples. Actual crusher output is usually close to 95% passing 1.7 mm. The sample preparation facility capacity is currently around 150 samples per shift, and the facility employs six people.
11.5 Sample Analysis ALS Chemex of Vancouver, Canada, analyses are by fire assay digestion with an atomic absorption spectrometer (FA/AAS) finish using a one assay-ton (29.2 g) aliquot (Code Au-AA23). Gold assays above 10 g/t Au and silver assays above 100 g/t Ag are re-assayed by one assay-ton FA with a gravimetric finish (Codes Au-GRA21, Ag-OG62). Separate splits of these samples are subjected to a multi-element ICP assay, including silver and sulfur, following a four-acid digestion. The limit of the reported sulfur assays by this method is 10%. All

RESOURCE ESTIMATION OF THE MÓNGORA GOLD-SILVER DEPOSIT
April 18, 2012 Report No. 12-16-12_119_415_5030_IF 40
samples with ICP results that show a sulfur grade of >10% are re-assayed using the Leco method (Code S-IR08) with an upper limit of 50% S.
Confirmation resampling was carried out at ACME laboratory in Vancouver, Canada. ACME performed assays using a 15 g aliquot and a 30 element geochemical inductively-coupled plasma (ICP) gold method after aqua regia digestion.
11.6 Sample Security Sample security relied upon the fact that the samples were always attended or locked at the sample dispatch facility. Sample collection and transportation have always been undertaken by company or laboratory personnel using corporately-owned vehicles.
Chain of custody procedures consisted of filling out sample submittal forms that were sent to the laboratory with sample shipments to make certain that all samples were received by the laboratory.
11.7 Sample Storage The core storage facility is located in the town of California and includes a two dedicated warehouses for this purpose. Figure 11-1 shows a general view of one of the warehouse which is also used to store coarse samples and pulps. As the current storage conditions presents lack of space a new warehouse was constructed (Figure 11-2). Rejects are stored in a facility at the laboratory in Canada.
Figure 11-1 A general view of core shed.
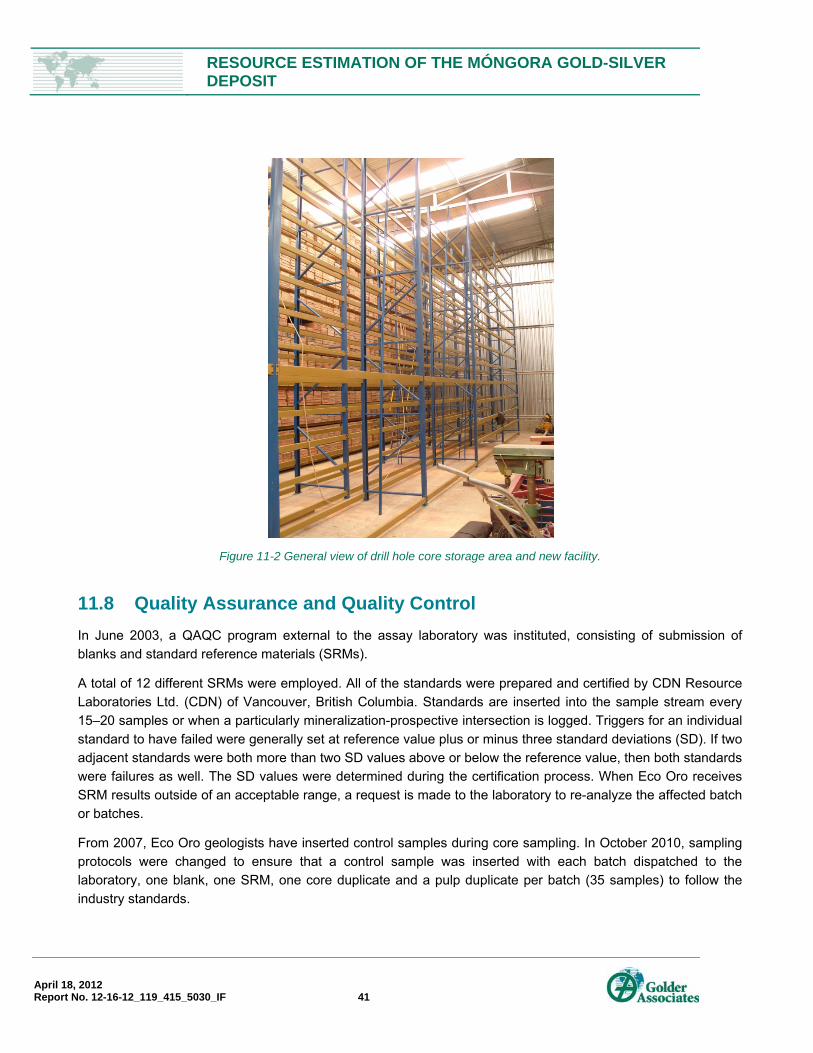
RESOURCE ESTIMATION OF THE MÓNGORA GOLD-SILVER DEPOSIT
April 18, 2012 Report No. 12-16-12_119_415_5030_IF 41
Figure 11-2 General view of drill hole core storage area and new facility.
11.8 Quality Assurance and Quality Control In June 2003, a QAQC program external to the assay laboratory was instituted, consisting of submission of blanks and standard reference materials (SRMs).
A total of 12 different SRMs were employed. All of the standards were prepared and certified by CDN Resource Laboratories Ltd. (CDN) of Vancouver, British Columbia. Standards are inserted into the sample stream every 15–20 samples or when a particularly mineralization-prospective intersection is logged. Triggers for an individual standard to have failed were generally set at reference value plus or minus three standard deviations (SD). If two adjacent standards were both more than two SD values above or below the reference value, then both standards were failures as well. The SD values were determined during the certification process. When Eco Oro receives SRM results outside of an acceptable range, a request is made to the laboratory to re-analyze the affected batch or batches.
From 2007, Eco Oro geologists have inserted control samples during core sampling. In October 2010, sampling protocols were changed to ensure that a control sample was inserted with each batch dispatched to the laboratory, one blank, one SRM, one core duplicate and a pulp duplicate per batch (35 samples) to follow the industry standards.

RESOURCE ESTIMATION OF THE MÓNGORA GOLD-SILVER DEPOSIT
April 18, 2012 Report No. 12-16-12_119_415_5030_IF 42
Collection of duplicate samples are triggered by a geologist inserting a “repeat” ticket into the sample stream; this indicates to the preparation laboratory that a second split of the sample is required (Burns, 2005). Duplicate samples have been collected at irregular intervals since early 2004.
Acme performed secondary assays on pulp duplicate materials from late 2007 to May 2011. Evaluation of the data indicates a potential low bias at ALS Chemex in the gold range of 50–100 g/t Au (Mello and Felder, 2010).
In October 2011 Golder preformed QAQC review as a part of a Resource Estimation Review for the Angostura Gold Project (Golder, 2011); the results of this review are discussed in Section 11.10.
11.9 Databases Eco Oro has implemented SQL software, produced by the Bucaramanga firm Systemas Integrados de Informacion y Digitalizacion (SIID), to manage the Angostura database. The system is installed in the Eco Oro Bucaramanga office and is fully integrated with the data acquisition activities in the field and downloaded to Bucaramanga by microwave base data transmission. A strict, controlled and structured set of fields and columns is used to manage the data flow, and there are checks to alert the database manager of any import issues (Burns, 2005).
Assays are received electronically from the laboratories and imported directly into the database. Drill hole logging, collar and down hole survey data are manually entered into the database. Data are verified on entry to the database by means of in-built program triggers within the SQL database, and further checked on import to the mining estimation software. Checks are performed on surveys, collar co-ordinates, lithology data, and assay data.
Paper records are kept for all assay and QAQC data, geological logging and bulk density information, downhole, and collar co-ordinate surveys.
11.10 QAQC Golder Review, October 2011 Quality Assurance (QA) is the system and set of procedures used to ensure that the sampling and assaying results are of high quality. Quality Control (QC) tests are the data used to prove that the results of sample preparation and chemical analysis are adequate. QAQC procedures at Angostura were updated in 2010. These include the insertion of standards, field and coarse duplicates and blank samples into every batch of samples sent to the laboratories. The QAQC procedures are detailed in the 2010 internal report “A Review of Quality Control Procedures and Data”. This document details QAQC sample types, thresholds values for acceptance, reporting requirements and QAQC samples insertion procedures. It does not specify responsibilities.
The insertion of standards, field and coarse duplicates and blank samples are made by the geologists and technicians during sample preparation.
For a regular 36 sample batch, 1 blank, 1 reference standard, 1 field duplicate and 1 pulp duplicate are inserted as part of the QAQC program (Figure 11-3). Assay values of Au and Ag are checked in the process. To ensure the correct insertion of controls, the field geologist in addition to the normal sampling activities, marks a control insertion in the core box near to the x8th sample (8th, 16th, 24th, 36th) and registers the insertion in the “table of

RESOURCE ESTIMATION OF THE MÓNGORA GOLD-SILVER DEPOSIT
April 18, 2012 Report No. 12-16-12_119_415_5030_IF 43
controls” to check which of the 4 controls needs to be inserted. The controls do not follow the same sequence and are not always exactly the x8th sample. Golder was provided with Au data for all Móngora QAQC samples.
11.10.1 Blank Samples
Blank samples for Au are inserted into the sampling stream as a QAQC check for sample contamination and laboratory cleanliness. Eco Oro informed that since 3rd quarter 2010 blanks are inserted in the process with same frequency that standards.
The material used for blank samples is obtained from not mineralized zones and it is not standardized. The results presented in Figure 11-4 are considered adequate.
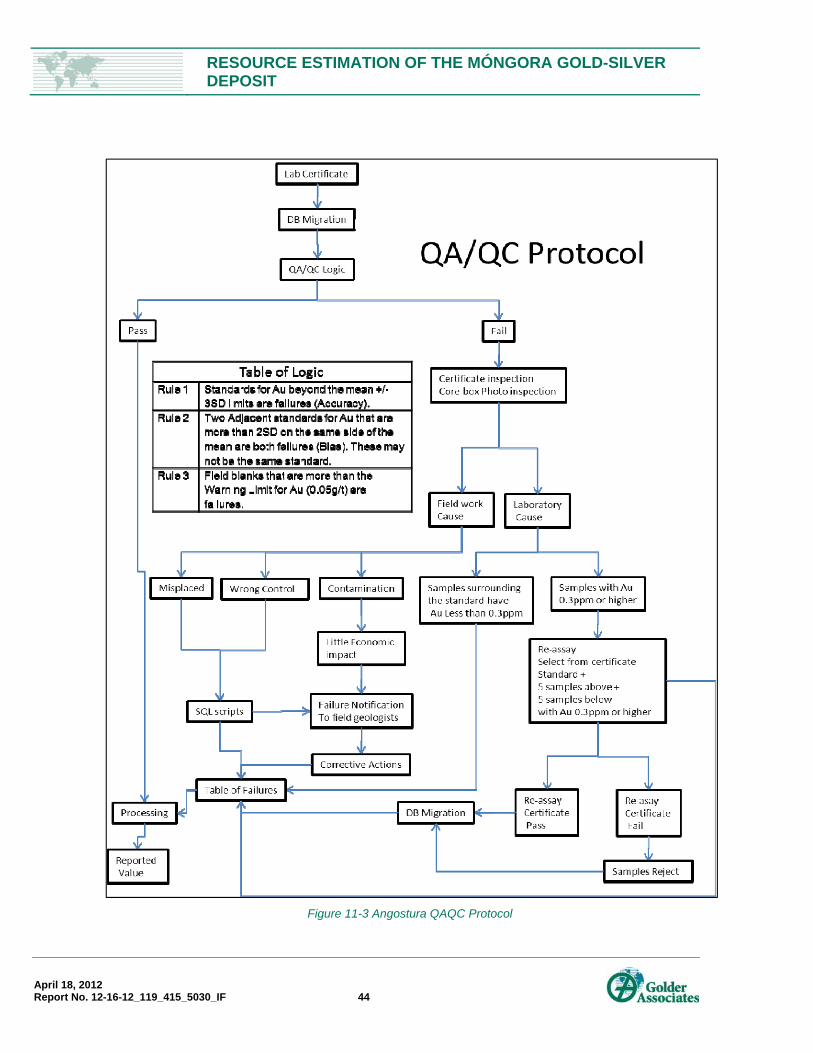
RESOURCE ESTIMATION OF THE MÓNGORA GOLD-SILVER DEPOSIT
April 18, 2012 Report No. 12-16-12_119_415_5030_IF 44
Figure 11-3 Angostura QAQC Protocol
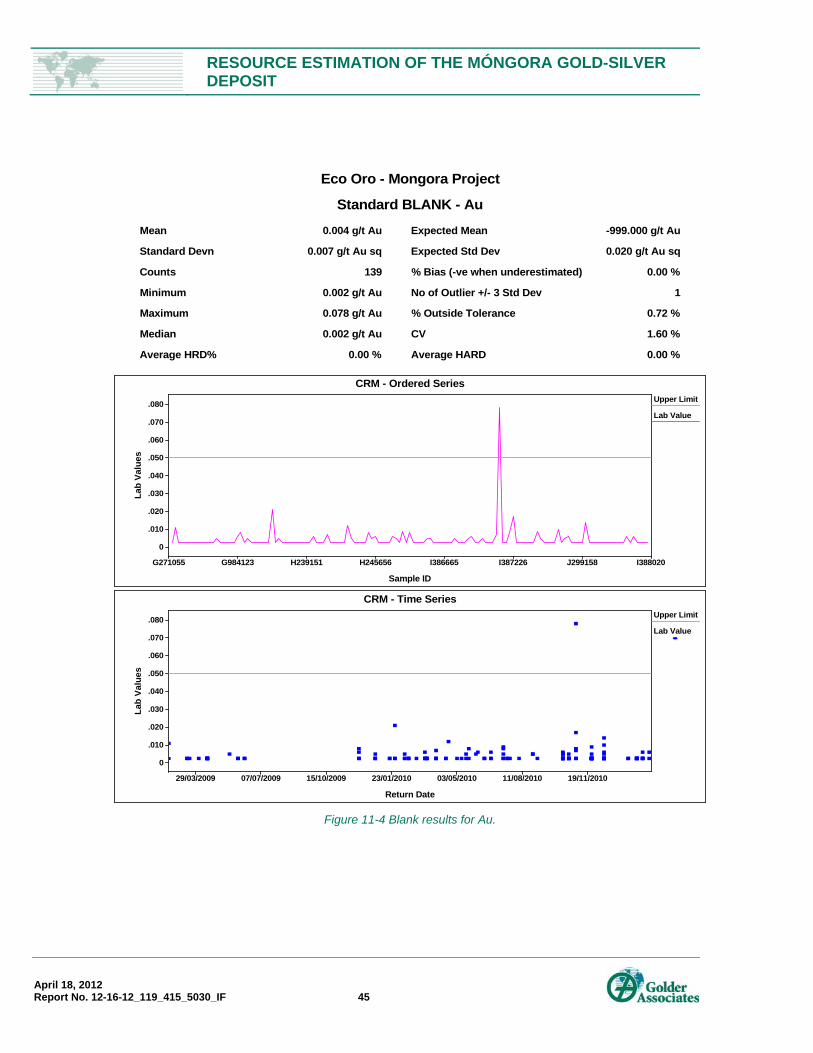
RESOURCE ESTIMATION OF THE MÓNGORA GOLD-SILVER DEPOSIT
April 18, 2012 Report No. 12-16-12_119_415_5030_IF 45
Figure 11-4 Blank results for Au.
Eco Oro - Mongora Project
Standard BLANK - Au
Mean
Standard Devn
Counts
Minimum
Maximum
Median
Average HRD%
0.004 g/t Au
0.007 g/t Au sq
139
0.002 g/t Au
0.078 g/t Au
0.002 g/t Au
0.00 %
Expected Mean
Expected Std Dev
% Bias (-ve when underestimated)
No of Outlier +/- 3 Std Dev
% Outside Tolerance
CV
Average HARD
-999.000 g/t Au
0.020 g/t Au sq
0.00 %
1
0.72 %
1.60 %
0.00 %
CRM - Ordered Series
Sample ID
Lab
Valu
es
0
.010
.020
.030
.040
.050
.060
.070
.080
G271055 G984123 H239151 H245656 I386665 I387226 J299158 I388020
Upper Limit
Lab Value
CRM - Time Series
Return Date
Lab
Valu
es
0
.010
.020
.030
.040
.050
.060
.070
.080
29/03/2009 07/07/2009 15/10/2009 23/01/2010 03/05/2010 11/08/2010 19/11/2010
Upper Limit
Lab Value

RESOURCE ESTIMATION OF THE MÓNGORA GOLD-SILVER DEPOSIT
April 18, 2012 Report No. 12-16-12_119_415_5030_IF 46
11.10.2 Standard Samples
Móngora Project routinely inserts standard samples into the analytical stream to assess the assay laboratory’s accuracy and to determine the presence of bias. Eco Oro has utilized a suite of 8 standard samples, developed previously for Angostura project, which covered a range of Au grades. Table 11-2 summarises the expected mean and standard deviation values of the standard samples.
Table 11-2 Expected mean values and acceptable limits for Móngora standard samples Au (g/t)
Standard Expected Mean (%) Std Dev (%) Accepted Lower (%) Accepted Upper (%) CDN-CGS-13 1.01 0.055 0.84 1.18
CDN-CM-8 0.91 0.055 0.75 1.01
CDN-GS-14A 14.90 0.435 13.60 15.37
CDN-GS-5C 4.74 0.140 4.32 5.16
CDN-GS-5D 5.06 0.125 4.68 5.43
CDN-GS-5F 5.30 0.180 4.76 5.65
CDN-GS-8A 8.25 0.300 7.35 8.59
CDN-GS-P7A 0.77 0.030 0.68 0.86
The analyses of the Au values for the standard samples show an acceptable accuracy and precision, all samples have Au values within the tolerance limits adopted by Eco Oro. An example of the results obtained for two standards are presented in Figure 11-5. All QAQC results together with the certificates for the standards are included in Appendix B.
All detected failures were reported and the corrected values were updated in the database.
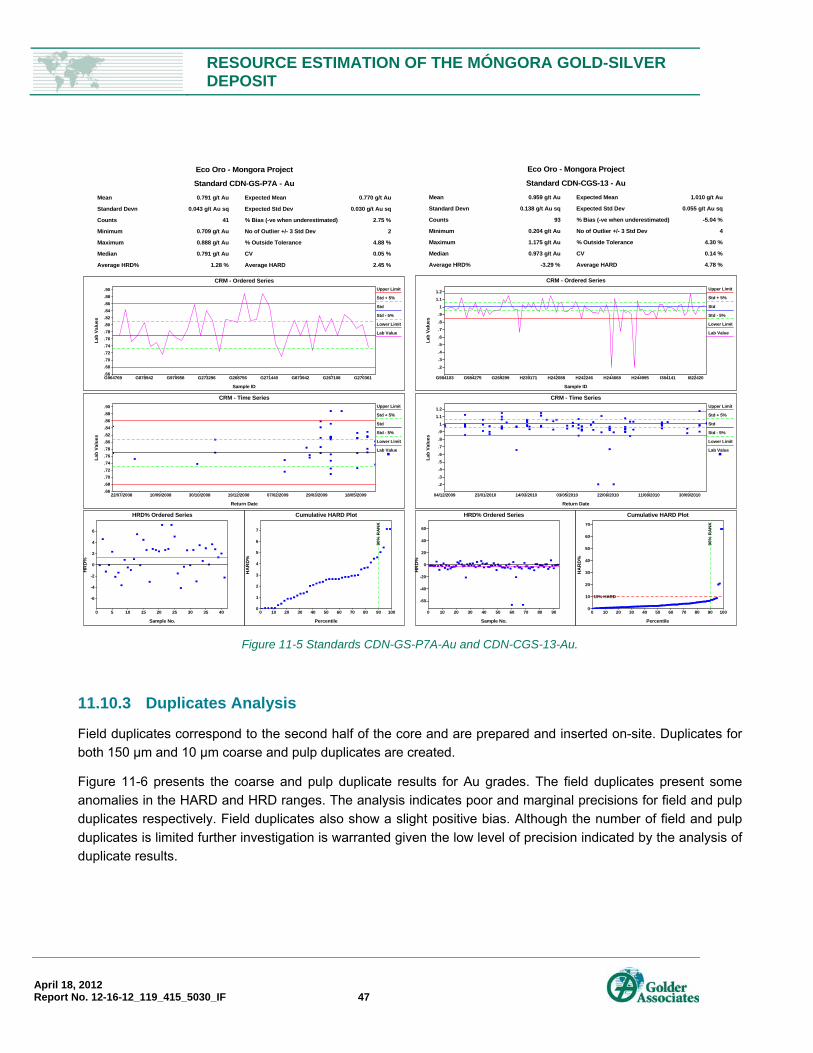
RESOURCE ESTIMATION OF THE MÓNGORA GOLD-SILVER DEPOSIT
April 18, 2012 Report No. 12-16-12_119_415_5030_IF 47
Figure 11-5 Standards CDN-GS-P7A-Au and CDN-CGS-13-Au.
11.10.3 Duplicates Analysis
Field duplicates correspond to the second half of the core and are prepared and inserted on-site. Duplicates for both 150 µm and 10 µm coarse and pulp duplicates are created.
Figure 11-6 presents the coarse and pulp duplicate results for Au grades. The field duplicates present some anomalies in the HARD and HRD ranges. The analysis indicates poor and marginal precisions for field and pulp duplicates respectively. Field duplicates also show a slight positive bias. Although the number of field and pulp duplicates is limited further investigation is warranted given the low level of precision indicated by the analysis of duplicate results.
Eco Oro - Mongora Project
Standard CDN-GS-P7A - Au
Mean
Standard Devn
Counts
Minimum
Maximum
Median
Average HRD%
0.791 g/t Au
0.043 g/t Au sq
41
0.709 g/t Au
0.888 g/t Au
0.791 g/t Au
1.28 %
Expected Mean
Expected Std Dev
% Bias (-ve when underestimated)
No of Outlier +/- 3 Std Dev
% Outside Tolerance
CV
Average HARD
0.770 g/t Au
0.030 g/t Au sq
2.75 %
2
4.88 %
0.05 %
2.45 %
CRM - Ordered Series
Sample ID
Lab
Valu
es
.66
.68
.70
.72
.74
.76
.78
.80
.82
.84
.86
.88
.90
G964769 G878942 G970958 G273296 G268756 G271440 G873942 G267108 G270361
Upper Limit
Std + 5%
Std
Std - 5%
Lower Limit
Lab Value
Eco Oro - Mongora Project
Standard CDN-CGS-13 - Au
Mean
Standard Devn
Counts
Minimum
Maximum
Median
Average HRD%
0.959 g/t Au
0.138 g/t Au sq
93
0.204 g/t Au
1.175 g/t Au
0.973 g/t Au
-3.29 %
Expected Mean
Expected Std Dev
% Bias (-ve when underestimated)
No of Outlier +/- 3 Std Dev
% Outside Tolerance
CV
Average HARD
1.010 g/t Au
0.055 g/t Au sq
-5.04 %
4
4.30 %
0.14 %
4.78 %
CRM - Ordered Series
Sample ID
Lab
Valu
es
.2
.3
.4
.5
.6
.7
.8
.91
1.1
1.2
G984103 G984275 G269299 H239171 H242088 H242246 H244668 H244995 I384141 I822420
Upper Limit
Std + 5%
Std
Std - 5%
Lower Limit
Lab Value
CRM - Time Series
Return Date
Lab
Valu
es
.66
.68
.70
.72
.74
.76
.78
.80
.82
.84
.86
.88
.90
22/07/2008 10/09/2008 30/10/2008 19/12/2008 07/02/2009 29/03/2009 18/05/2009
Upper Limit
Std + 5%
Std
Std - 5%
Lower Limit
Lab Value
HRD% Ordered Series
Sample No.
HR
D%
-6
-4
-2
0
2
4
6
0 5 10 15 20 25 30 35 40
Cumulative HARD Plot
Percentile
HA
RD
%
0
1
2
3
4
5
6
7
0 10 20 30 40 50 60 70 80 90 100
90%
RA
NK
CRM - Time Series
Return Date
Lab
Valu
es
.2
.3
.4
.5
.6
.7
.8
.9
11.1
1.2
04/12/2009 23/01/2010 14/03/2010 03/05/2010 22/06/2010 11/08/2010 30/09/2010
Upper Limit
Std + 5%
Std
Std - 5%
Lower Limit
Lab Value
HRD% Ordered Series
Sample No.
HR
D%
-60
-40
-20
0
20
40
60
0 10 20 30 40 50 60 70 80 90
Cumulative HARD Plot
Percentile
HA
RD
%
0
10
20
30
40
50
60
70
0 10 20 30 40 50 60 70 80 90 100
10% HARD
90%
RA
NK
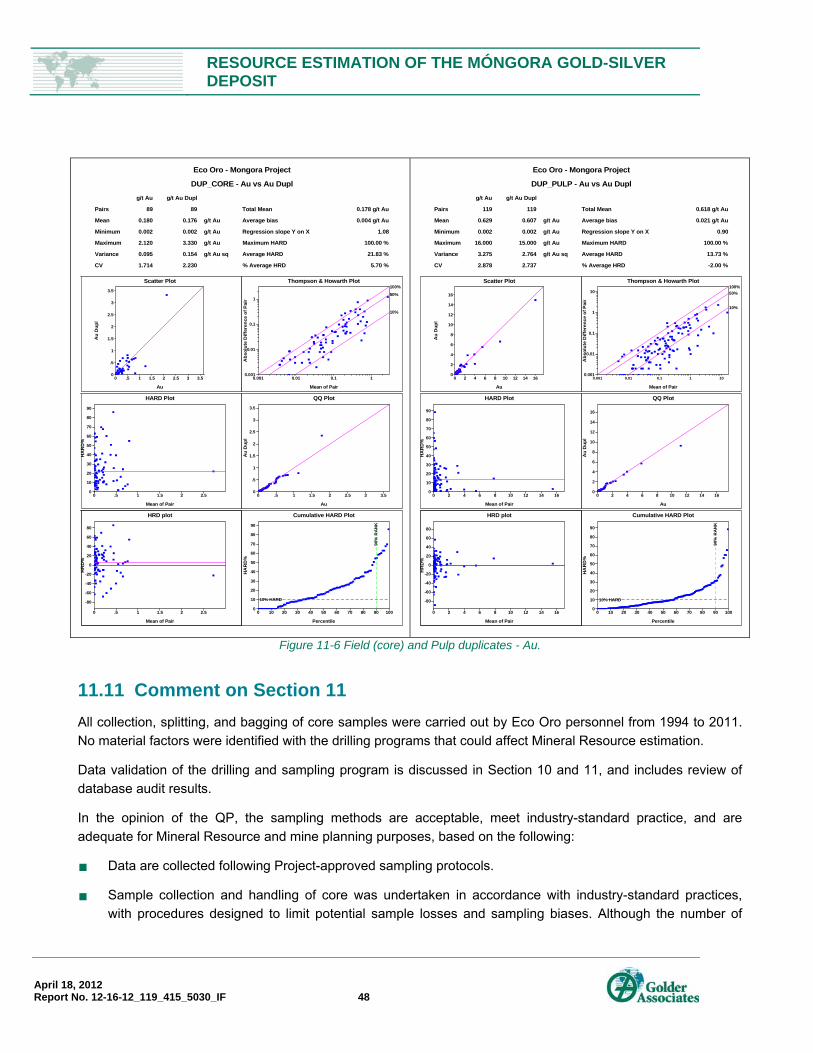
RESOURCE ESTIMATION OF THE MÓNGORA GOLD-SILVER DEPOSIT
April 18, 2012 Report No. 12-16-12_119_415_5030_IF 48
Figure 11-6 Field (core) and Pulp duplicates - Au.
11.11 Comment on Section 11 All collection, splitting, and bagging of core samples were carried out by Eco Oro personnel from 1994 to 2011. No material factors were identified with the drilling programs that could affect Mineral Resource estimation.
Data validation of the drilling and sampling program is discussed in Section 10 and 11, and includes review of database audit results.
In the opinion of the QP, the sampling methods are acceptable, meet industry-standard practice, and are adequate for Mineral Resource and mine planning purposes, based on the following:
Data are collected following Project-approved sampling protocols.
Sample collection and handling of core was undertaken in accordance with industry-standard practices, with procedures designed to limit potential sample losses and sampling biases. Although the number of
Eco Oro - Mongora Project
DUP_CORE - Au vs Au Dupl
Pairs
Mean
Minimum
Maximum
Variance
CV
g/t Au
89
0.180
0.002
2.120
0.095
1.714
g/t Au Dupl
89
0.176
0.002
3.330
0.154
2.230
g/t Au
g/t Au
g/t Au
g/t Au sq
Total Mean
Average bias
Regression slope Y on X
Maximum HARD
Average HARD
% Average HRD
0.178 g/t Au
0.004 g/t Au
1.08
100.00 %
21.83 %
5.70 %
Scatter Plot
Au
Au
Dup
l
0
.5
1
1.5
2
2.5
3
3.5
0 .5 1 1.5 2 2.5 3 3.5
Thompson & Howarth Plot
Mean of Pair
Abs
olut
e D
iffer
ence
of P
air
0.001 0.01 0.1 10.001
0.01
0.1
1
100%
50%
10%
HARD Plot
Mean of Pair
HA
RD
%
0
10
20
30
40
50
60
70
80
90
0 .5 1 1.5 2 2.5
QQ Plot
Au
Au
Dup
l
0
.5
1
1.5
2
2.5
3
3.5
0 .5 1 1.5 2 2.5 3 3.5
HRD plot
Mean of Pair
HR
D%
-80
-60
-40
-20
0
20
40
60
80
0 .5 1 1.5 2 2.5
Cumulative HARD Plot
Percentile
HA
RD
%
0
10
20
30
40
50
60
70
80
90
0 10 20 30 40 50 60 70 80 90 100
10% HARD
90%
RA
NK
Eco Oro - Mongora Project
DUP_PULP - Au vs Au Dupl
Pairs
Mean
Minimum
Maximum
Variance
CV
g/t Au
119
0.629
0.002
16.000
3.275
2.878
g/t Au Dupl
119
0.607
0.002
15.000
2.764
2.737
g/t Au
g/t Au
g/t Au
g/t Au sq
Total Mean
Average bias
Regression slope Y on X
Maximum HARD
Average HARD
% Average HRD
0.618 g/t Au
0.021 g/t Au
0.90
100.00 %
13.73 %
-2.00 %
Scatter Plot
Au
Au
Dup
l
0
2
4
6
8
10
12
14
16
0 2 4 6 8 10 12 14 16
Thompson & Howarth Plot
Mean of Pair
Abs
olut
e D
iffer
ence
of P
air
0.001 0.01 0.1 1 100.001
0.01
0.1
1
10100%50%
10%
HARD Plot
Mean of Pair
HA
RD
%
0
10
20
30
40
50
60
70
80
90
0 2 4 6 8 10 12 14 16
QQ Plot
Au
Au
Dup
l
0
2
4
6
8
10
12
14
16
0 2 4 6 8 10 12 14 16
HRD plot
Mean of Pair
HR
D%
-80
-60
-40
-20
0
20
40
60
80
0 2 4 6 8 10 12 14 16
Cumulative HARD Plot
Percentile
HA
RD
%
0
10
20
30
40
50
60
70
80
90
0 10 20 30 40 50 60 70 80 90 100
10% HARD
90%
RA
NK

RESOURCE ESTIMATION OF THE MÓNGORA GOLD-SILVER DEPOSIT
April 18, 2012 Report No. 12-16-12_119_415_5030_IF 49
field and pulp duplicates is limited further investigation is warranted given the low level of precision indicated by the analysis of duplicate results. This needs to be improved before any Resource is classified as Indicated or Measured.
Sample intervals, which have been defined on the basis of lithology, alteration, and sulfide content, are considered to be adequately representative of the true thicknesses of mineralization.
Specific gravity determination procedures completed are consistent with industry-standard procedures.
The QP is of the opinion that the quality of the gold analytical data collected during the Eco Oro drill programs are sufficiently reliable (also see discussion in Section 12) to support Mineral Resource estimation and that sample preparation, analysis, and security are generally performed in accordance with exploration best practices and industry standards as follows:
Drill sampling has been adequately spaced to first define, then infill, gold and silver anomalies to produce prospect-scale and deposit-scale drill data. Drill hole spacing varies with depth. Drill hole spacing increases with depth as the number of holes decrease and holes deviate apart.
Sample preparation is in line with industry-standard methods for high-sulphidation epithermal deposits. Preparation prior to 2004 was by independent laboratories; since 2004, preparation has been undertaken by Eco Oro personnel at an on-site preparation laboratory.
From 2004, Eco Oro drill programs have included insertion of blank and standard reference material samples. Duplicate submission is irregular. QAQC submission rates meet industry-accepted standards of insertion rates. The QAQC program results that have been validated by independent consultants do not indicate any problems with the analytical programs, therefore the gold and silver analyses from the core drilling are suitable for inclusion in Mineral Resource estimation.
Data that were collected were subject to validation, using in-built program triggers that automatically checked data on upload to the database. This includes checks on surveys, collar co-ordinates, lithology data, and assay data. The results of the checks were appropriate, and consistent with industry standards.
Sample security has relied upon the fact that the samples were always attended or locked in the on-site sample preparation facility. Chain-of-custody procedures consist of filling out sample submittal forms that are sent to the laboratory with sample shipments to make certain that all samples are received by the laboratory.
Current sample storage procedures and storage areas are consistent with industry standards.
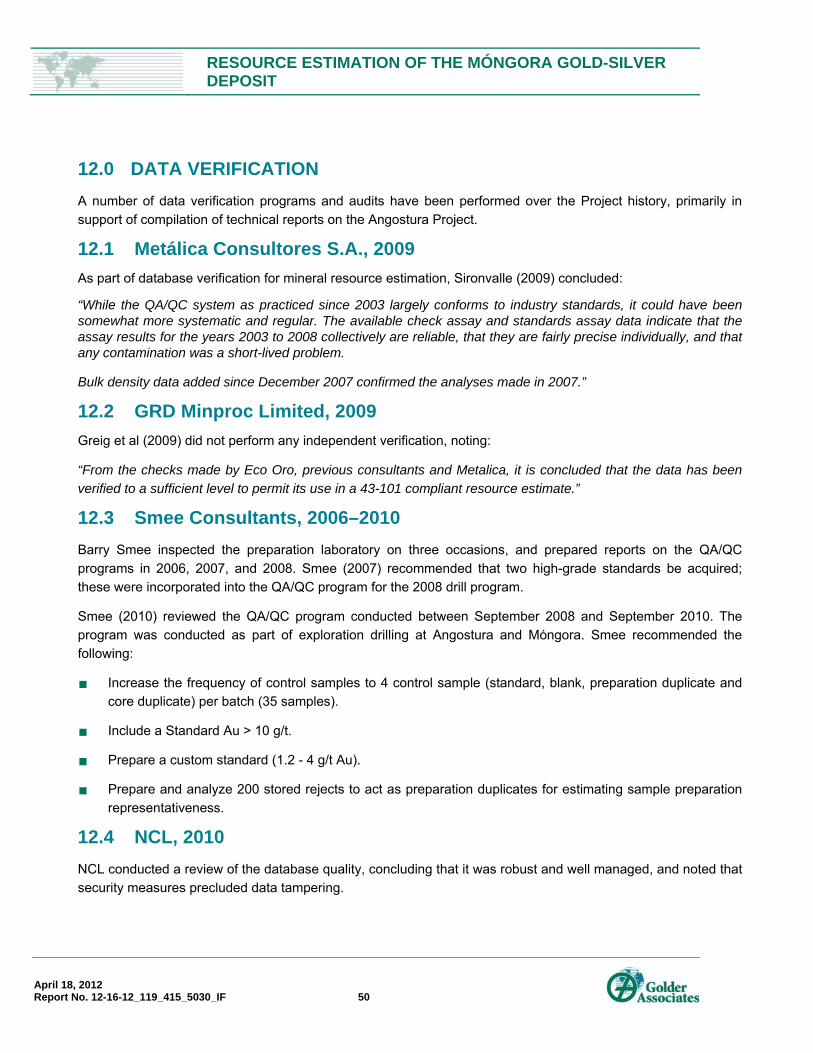
RESOURCE ESTIMATION OF THE MÓNGORA GOLD-SILVER DEPOSIT
April 18, 2012 Report No. 12-16-12_119_415_5030_IF 50
12.0 DATA VERIFICATION A number of data verification programs and audits have been performed over the Project history, primarily in support of compilation of technical reports on the Angostura Project.
12.1 Metálica Consultores S.A., 2009 As part of database verification for mineral resource estimation, Sironvalle (2009) concluded:
“While the QA/QC system as practiced since 2003 largely conforms to industry standards, it could have been somewhat more systematic and regular. The available check assay and standards assay data indicate that the assay results for the years 2003 to 2008 collectively are reliable, that they are fairly precise individually, and that any contamination was a short-lived problem.
Bulk density data added since December 2007 confirmed the analyses made in 2007.”
12.2 GRD Minproc Limited, 2009 Greig et al (2009) did not perform any independent verification, noting:
“From the checks made by Eco Oro, previous consultants and Metalica, it is concluded that the data has been verified to a sufficient level to permit its use in a 43-101 compliant resource estimate.”
12.3 Smee Consultants, 2006–2010 Barry Smee inspected the preparation laboratory on three occasions, and prepared reports on the QA/QC programs in 2006, 2007, and 2008. Smee (2007) recommended that two high-grade standards be acquired; these were incorporated into the QA/QC program for the 2008 drill program.
Smee (2010) reviewed the QA/QC program conducted between September 2008 and September 2010. The program was conducted as part of exploration drilling at Angostura and Móngora. Smee recommended the following:
Increase the frequency of control samples to 4 control sample (standard, blank, preparation duplicate and core duplicate) per batch (35 samples).
Include a Standard Au > 10 g/t.
Prepare a custom standard (1.2 - 4 g/t Au).
Prepare and analyze 200 stored rejects to act as preparation duplicates for estimating sample preparation representativeness.
12.4 NCL, 2010 NCL conducted a review of the database quality, concluding that it was robust and well managed, and noted that security measures precluded data tampering.
RESOURCE ESTIMATION OF THE MÓNGORA GOLD-SILVER DEPOSIT
April 18, 2012 Report No. 12-16-12_119_415_5030_IF 51
Four drill holes from the Angostura deposit, representing approximately 1,000 assays, were randomly selected, and checked against the corresponding database entries. No inconsistencies between digital and hardcopy data were identified.
NCL concluded, from these reviews, that:
“While the QA/QC system as practiced since 2003 conforms to industry standards. The available check assay and standards assay data indicate that the assay results for the years 2003 to 2008 collectively are reliable, that they are fairly precise individually, and that any contamination was a short-lived problem.
Considering the results of the verification completed by NCL and the extent of external quality assurance and quality control measures implemented by Eco Oro as well as external data verification and QA/QC controls conducted by Barry Smee, NCL did not consider that further independent verification sampling was required.
In the opinion of NCL, Eco Oro used industry best practices to explore for gold and silver on the Angostura project. The exploration data was collected with care and is appropriately managed to ensure the safeguard of exploration information. The resulting exploration data is generally reliable for resource estimation.”
This study included data available up to July 2010.
12.5 Comment on Section 12 The process of data verification for the Angostura Project has primarily been performed by Eco Oro geologists and verification and auditing is performed by external consultants. The QP considers that a reasonable level of verification has been completed, and that no material issues would have been left unidentified from the programs undertaken.
The QP, who relies upon this work, has reviewed the appropriate reports, and is of the opinion that the data verification programs undertaken on the data collected from the Project adequately support the geological interpretations, the analytical and database quality, and therefore support the use of the data in Mineral Resource estimation:
No significant sample biases were identified from the QAQC programs undertaken by Eco Oro.
Sample data collected adequately reflect deposit dimensions, true widths of mineralization, and the style of the deposit.
External reviews of the database were undertaken between 1998 and 2010, producing independent assessments of the database quality. No significant problems with the database, sampling protocols, flowsheets, check analysis program, or data storage were noted.
Changes and adjustments the QAQC program suggested by Smee 2010 has been implemented, except the preparation and introduction of a custom standard (1.2 – 4 g/t Au) that is currently in process of certification.
Drill data are typically verified prior to Mineral Resource estimation, by running checking routines.

RESOURCE ESTIMATION OF THE MÓNGORA GOLD-SILVER DEPOSIT
April 18, 2012 Report No. 12-16-12_119_415_5030_IF 52
13.0 MINERAL PROCESSING AND METALLURGICAL TESTING In April of 2009, Eco Oro had five quick leach tests performed on oxide, transition and sulfide materials. The results of these tests showed recoveries varying between 53 and 85 %.
Móngora has many similarities with the geological environment of Angostura. Structurally-controlled mineralization is hosted in Triassic–Jurassic intrusive rocks in association with pyrite. The intensity of a hydrothermal alteration does not appear to be as strong as in Angostura, but sericite, illite and chlorite are common. For the purpose to the resource estimation presented in this report an assumption was made that Móngora mineralized material has similar metallurgical behaviour to Angostura.
14.0 MINERAL RESOURCE ESTIMATES The following sections describe the data, methodology and procedures related to the elaboration of the geological model and block grade estimates for the January 2012 Resource estimation.
14.1 Geological Model The starting point for the interpretation of the Móngora geological model was the structural geology and tectonic study done by Horner in 2005, as well as the analysis of a data collected in the Móngora and Violetal sectors since 2008. Modeling work was also supported by information provided by surface mapping.
For the construction of the mineralized structures a correlation was made between the contents of Au and Ag, alteration and rock types. Modeling was done based on the drilling done up to October 2011. The design criteria for the interpretation were defined by Mr. Frederick Felder (Consultant to Eco Oro) and Mr. Alfonso Silva (Eco Oro’s Chief Geologist).
The geological modeling of the Móngora deposit was done using Datamine Studio 3. The geostatistical grade estimation and validation were carried out using Maptek’s Vulcan Software. The statistical data analysis and variography were done using Golder’s in-house software.
14.2 Database The database used for the geological modeling and the resources estimation of the Móngora deposit comprises 58 diamond drill holes which correspond to approximately 20,062 m of drilling.
Table 14-1 and
Table 14-2 show the details of the general database and the data selected within the high grade veins modeled by Eco Oro’s geologists.
Table 14-1 Database Basic Statistics Type Nº of Drill holes Metres
Core 58 20,276.2

RESOURCE ESTIMATION OF THE MÓNGORA GOLD-SILVER DEPOSIT
April 18, 2012 Report No. 12-16-12_119_415_5030_IF 53
Type Nº of Drill holes Metres
Au 9,675 20,062.35
Ag 9,675 20,062.35
As 9,675 20,062.35
Cu 9,675 20,062.35
S 9,675 20,062.35
Table 14-2 Information Inside mineralized zone (High Grade Veins)
Type Nº of Drillholes Metres
Core 58 979.4
Nº of Samples Metres
Au 498 979.4 Ag 498 979.4 As 498 979.4 Cu 498 979.4 S 498 979.4
14.3 3D Modeling
A total of 103 high grade mineralization structures (veins) were modeled by Eco Oro geologists. Wireframes were constructed for each structure based on Au and Ag grades according to the mineralization parameters. In addition, previous studies of structures, rock types, hydrothermal alterations and Au-Ag-Cu correlation were taken in consideration.
To reduce the dilution in the veins, a cut-off grade of 2 g/t Au was used for veins with up to 2m thickness. For veins with thickness greater than 2 m a cut-off grade of 1.5 g/t Au was considered; taking into consideration the possibility of using different underground exploitation methods in different thickness of high grade veins. The solids were projected 25 m to 50 m horizontally and vertically beyond the last vein intercept.
Figure 14-1 and Figure 14-2 show general views of the veins and the drill holes. Surfaces (DTM) were created to define the topographic surface and the limit between the fresh rock (sulphides) and the oxides zone.
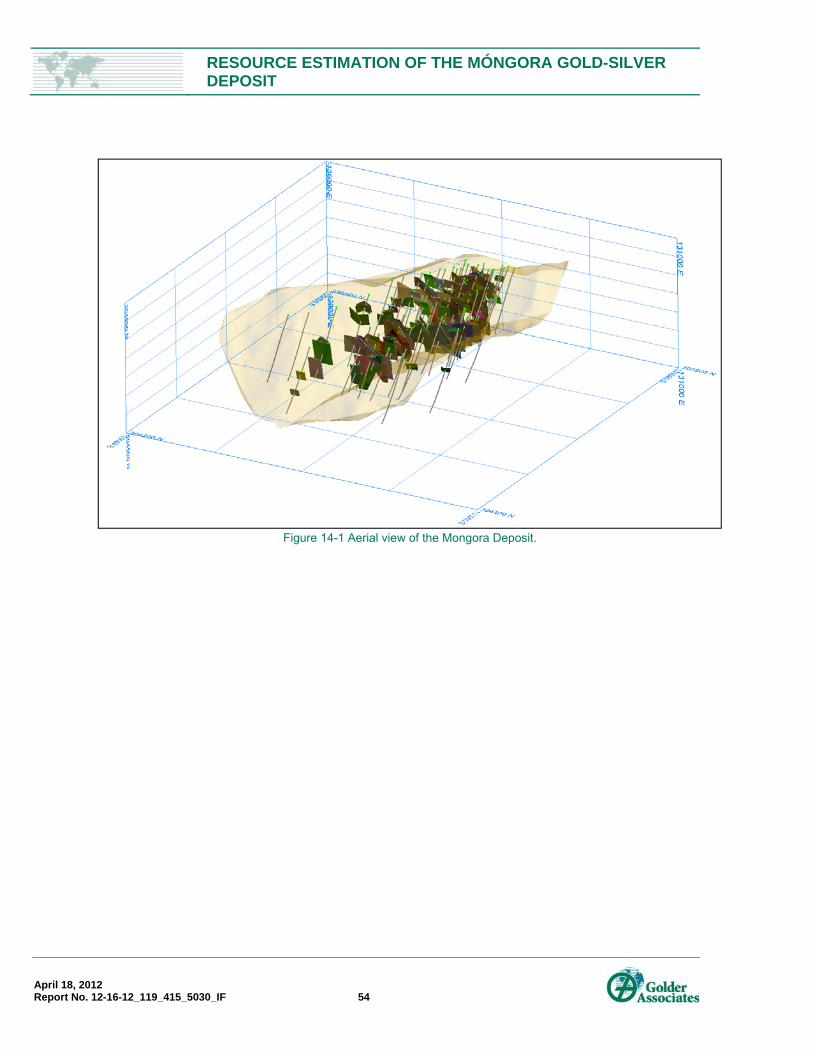
RESOURCE ESTIMATION OF THE MÓNGORA GOLD-SILVER DEPOSIT
April 18, 2012 Report No. 12-16-12_119_415_5030_IF 54
Figure 14-1 Aerial view of the Mongora Deposit.

RESOURCE ESTIMATION OF THE MÓNGORA GOLD-SILVER DEPOSIT
April 18, 2012 Report No. 12-16-12_119_415_5030_IF 55
Figure 14-2 Plan view of the Móngora geological model.
14.4 Oxidation Model The oxidation level at Móngora was modelled using the same methodology applied to the Angostura project. It starts with the coding of the drilling data using the criteria presented in Table 14-3.
Table 14-3 Oxidation level criteria measured form drill hole cores.
Oxidation type Limonite Total S (%) Visual Sulphides
Oxide Present ≤ 1% Trace to ≤ 0.5% Transition Present ≥ 1% ≥ 1% Fresh or Sulphides Absent Not a criterion Present The characterization of oxidation types was made using core photos, core descriptions (logging) and total sulphur content. After defining the oxidation types (oxides, transition and fresh rock) a DTM surface was modelled indicating the top of the fresh zone which means that under this surface oxidation is absent.
Due to the limited occurrence of samples coded as transition type they were modeled as part of the oxide zone. Figure 14-3 and Figure 14-4 present sections showing the surface separating the oxide and sulphide zones.
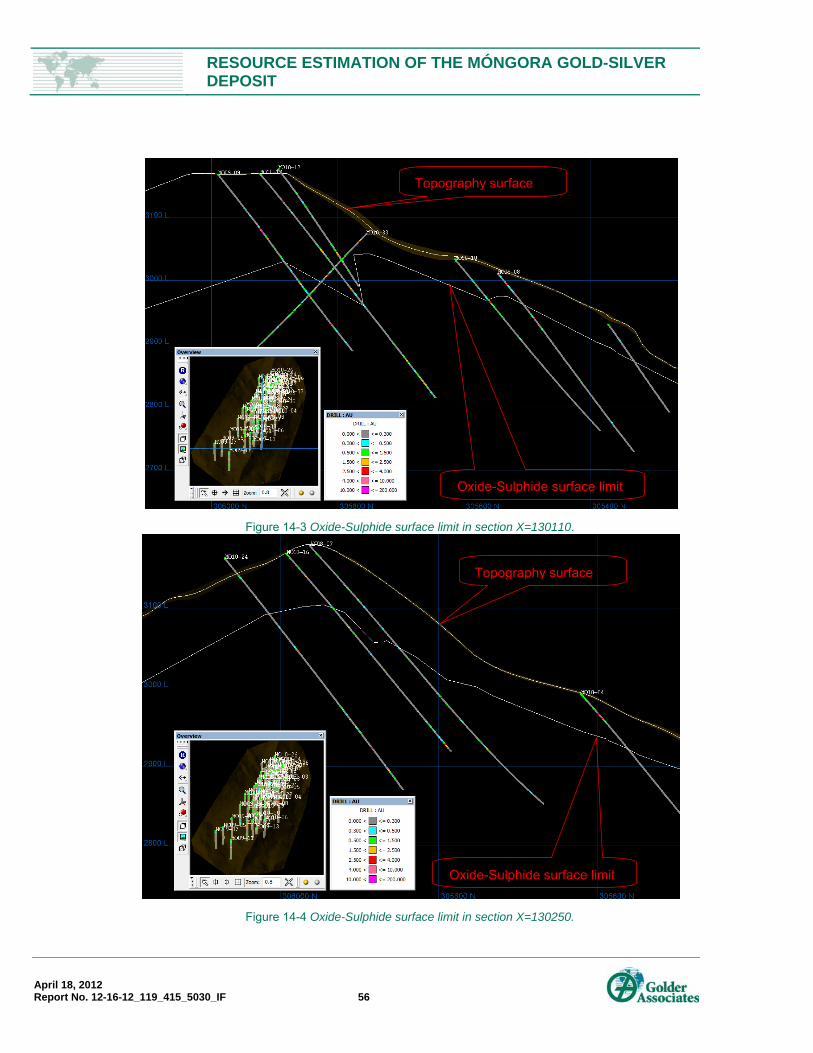
RESOURCE ESTIMATION OF THE MÓNGORA GOLD-SILVER DEPOSIT
April 18, 2012 Report No. 12-16-12_119_415_5030_IF 56
Figure 14-3 Oxide-Sulphide surface limit in section X=130110.
Figure 14-4 Oxide-Sulphide surface limit in section X=130250.
Topography surface
Oxide-Sulphide surface limit
Topography surface
Oxide-Sulphide surface limit

RESOURCE ESTIMATION OF THE MÓNGORA GOLD-SILVER DEPOSIT
April 18, 2012 Report No. 12-16-12_119_415_5030_IF 57
14.5 Compositing Eco Oro took assay samples at every meter considering breaks in the presence of geological contacts (accepted intervals from 0.8 to 9.0 m). The geological interpretation was performed based on this data as well as structures identified by surface mapping and logging information. Then, all intercepts inside each solid were composited to 2.0 m intervals with tolerance of 1.0 to 2.8 m. Only samples with more than 40% recovery were included in the composites database. Figure 14-5 shows the distributions of sample lengths before and after compositing.
Figure 14-5 Probability plot of sample length – drill hole samples (left) and composites (right).
A total of 20% of the composites located inside the veins have Au grades below 1.0 g/t while 1% of the background composites have Au grades greater than 1.0 g/t. The compositing was considered not to alter the distribution of grades significantly while providing the appropriate level of regularization for the purpose of grade estimation.
14.6 Outlier Treatment To reduce the impact of outliers capping and high yield restrictions were applied to the composited database. Capping and high yield thresholds of gold, silver, arsenic, cooper and sulfur grades were determined graphically.
Figure 14-16 illustrates the graphically the threshold obtained for the grade distribution of each element and Table 14-4 presents the actual values.

RESOURCE ESTIMATION OF THE MÓNGORA GOLD-SILVER DEPOSIT
April 18, 2012 Report No. 12-16-12_119_415_5030_IF 58
Figure 14-6 Probability Plots showing the threshold values defined for capping and High Yield Restriction.
Capping
HYR
Capping
HYR
Capping
HYR
CappingHYR
Capping
HYR
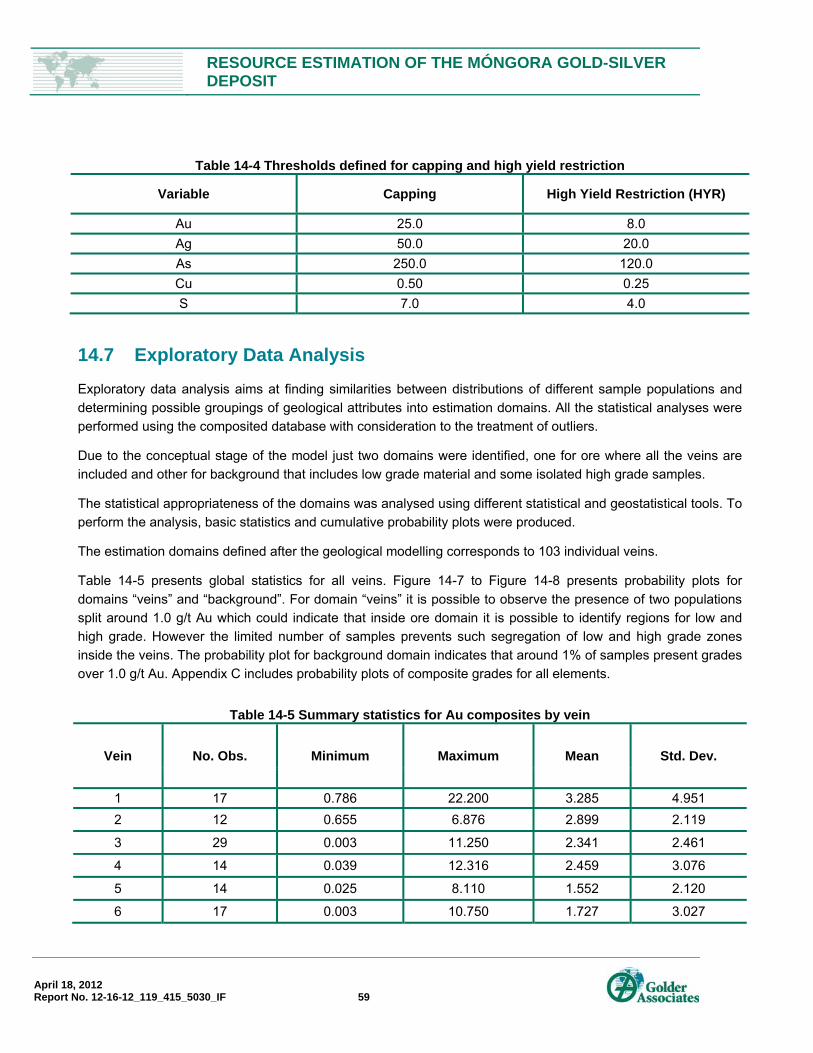
RESOURCE ESTIMATION OF THE MÓNGORA GOLD-SILVER DEPOSIT
April 18, 2012 Report No. 12-16-12_119_415_5030_IF 59
Table 14-4 Thresholds defined for capping and high yield restriction
Variable Capping High Yield Restriction (HYR)
Au 25.0 8.0 Ag 50.0 20.0 As 250.0 120.0 Cu 0.50 0.25 S 7.0 4.0
14.7 Exploratory Data Analysis
Exploratory data analysis aims at finding similarities between distributions of different sample populations and determining possible groupings of geological attributes into estimation domains. All the statistical analyses were performed using the composited database with consideration to the treatment of outliers.
Due to the conceptual stage of the model just two domains were identified, one for ore where all the veins are included and other for background that includes low grade material and some isolated high grade samples.
The statistical appropriateness of the domains was analysed using different statistical and geostatistical tools. To perform the analysis, basic statistics and cumulative probability plots were produced.
The estimation domains defined after the geological modelling corresponds to 103 individual veins.
Table 14-5 presents global statistics for all veins. Figure 14-7 to Figure 14-8 presents probability plots for domains “veins” and “background”. For domain “veins” it is possible to observe the presence of two populations split around 1.0 g/t Au which could indicate that inside ore domain it is possible to identify regions for low and high grade. However the limited number of samples prevents such segregation of low and high grade zones inside the veins. The probability plot for background domain indicates that around 1% of samples present grades over 1.0 g/t Au. Appendix C includes probability plots of composite grades for all elements.
Table 14-5 Summary statistics for Au composites by vein
Vein No. Obs. Minimum Maximum Mean Std. Dev.
1 17 0.786 22.200 3.285 4.951 2 12 0.655 6.876 2.899 2.119
3 29 0.003 11.250 2.341 2.461
4 14 0.039 12.316 2.459 3.076
5 14 0.025 8.110 1.552 2.120
6 17 0.003 10.750 1.727 3.027
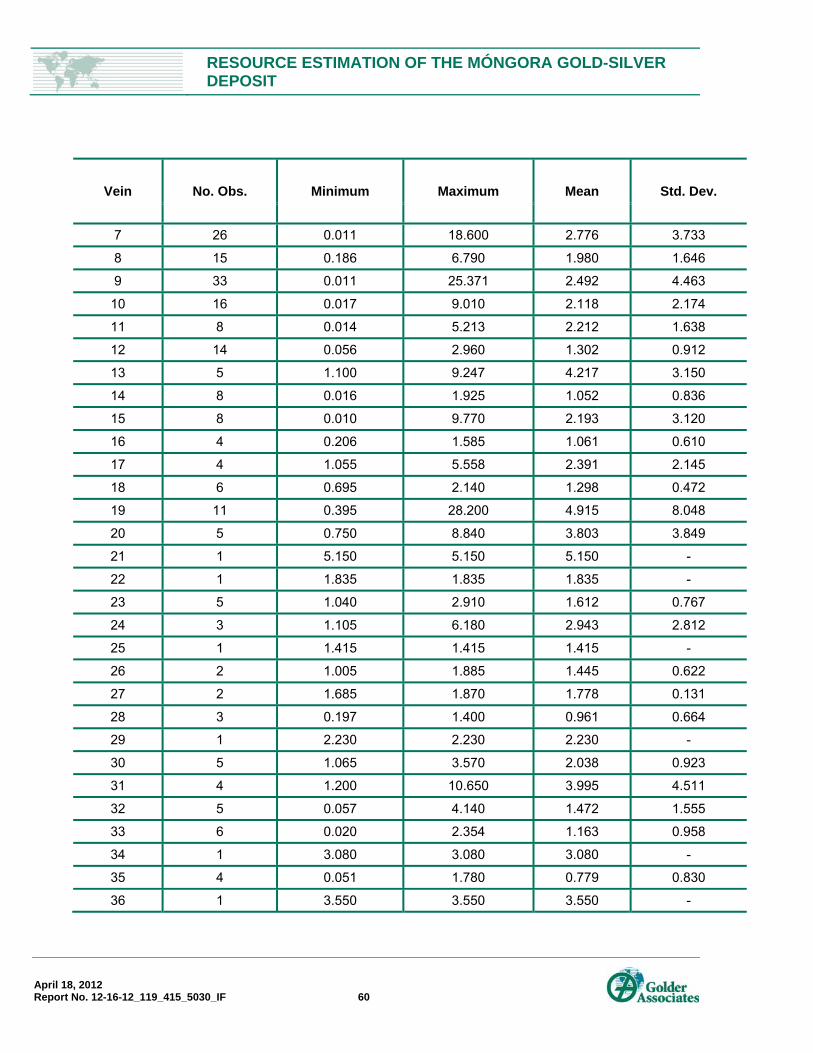
RESOURCE ESTIMATION OF THE MÓNGORA GOLD-SILVER DEPOSIT
April 18, 2012 Report No. 12-16-12_119_415_5030_IF 60
Vein No. Obs. Minimum Maximum Mean Std. Dev.
7 26 0.011 18.600 2.776 3.733
8 15 0.186 6.790 1.980 1.646
9 33 0.011 25.371 2.492 4.463
10 16 0.017 9.010 2.118 2.174
11 8 0.014 5.213 2.212 1.638
12 14 0.056 2.960 1.302 0.912
13 5 1.100 9.247 4.217 3.150
14 8 0.016 1.925 1.052 0.836
15 8 0.010 9.770 2.193 3.120
16 4 0.206 1.585 1.061 0.610
17 4 1.055 5.558 2.391 2.145
18 6 0.695 2.140 1.298 0.472
19 11 0.395 28.200 4.915 8.048
20 5 0.750 8.840 3.803 3.849
21 1 5.150 5.150 5.150 -
22 1 1.835 1.835 1.835 -
23 5 1.040 2.910 1.612 0.767
24 3 1.105 6.180 2.943 2.812
25 1 1.415 1.415 1.415 -
26 2 1.005 1.885 1.445 0.622
27 2 1.685 1.870 1.778 0.131
28 3 0.197 1.400 0.961 0.664
29 1 2.230 2.230 2.230 -
30 5 1.065 3.570 2.038 0.923
31 4 1.200 10.650 3.995 4.511
32 5 0.057 4.140 1.472 1.555
33 6 0.020 2.354 1.163 0.958
34 1 3.080 3.080 3.080 -
35 4 0.051 1.780 0.779 0.830
36 1 3.550 3.550 3.550 -

RESOURCE ESTIMATION OF THE MÓNGORA GOLD-SILVER DEPOSIT
April 18, 2012 Report No. 12-16-12_119_415_5030_IF 61
Vein No. Obs. Minimum Maximum Mean Std. Dev.
37 9 1.070 2.260 1.433 0.399
38 14 0.003 6.340 1.565 1.489
39 13 0.974 15.661 3.498 4.361
40 10 0.017 4.180 1.380 1.292
41 13 0.003 6.030 1.816 2.137
42 2 1.925 3.330 2.628 0.993
43 3 0.016 6.120 3.562 3.170
44 9 0.007 3.960 1.799 1.401
45 2 1.485 1.485 1.485 0.000
46 2 0.275 1.325 0.800 0.743
47 1 12.350 12.350 12.350 -
48 1 1.475 1.475 1.475 -
49 1 16.300 16.300 16.300 -
50 1 1.770 1.770 1.770 -
51 1 116.000 116.000 116.000 -
52 6 0.027 6.500 2.618 2.172
53 3 6.088 20.753 12.284 7.592
54 1 2.150 2.150 2.150 -
55 1 5.910 5.910 5.910 -
56 6 1.862 12.650 5.897 4.287
57 9 0.042 5.640 1.216 1.830
58 1 11.400 11.400 11.400 -
59 2 6.900 7.320 7.110 0.297
60 3 1.590 2.590 2.187 0.527
61 1 1.820 1.820 1.820 -
62 2 2.070 2.600 2.335 0.375
63 2 1.915 1.915 1.915 0.000
64 7 0.427 3.400 1.899 1.098
65 3 1.385 5.570 3.721 2.135
66 2 4.830 4.830 4.830 0.000

RESOURCE ESTIMATION OF THE MÓNGORA GOLD-SILVER DEPOSIT
April 18, 2012 Report No. 12-16-12_119_415_5030_IF 62
Vein No. Obs. Minimum Maximum Mean Std. Dev.
67 3 0.053 2.160 1.296 1.103
68 3 5.540 5.920 5.793 0.219
69 1 12.250 12.250 12.250 -
70 1 2.720 2.720 2.720 -
71 3 1.095 1.485 1.318 0.201
72 2 1.100 2.220 1.660 0.792
73 5 0.930 2.990 1.890 0.739
74 4 0.652 8.530 3.508 3.488
75 2 2.620 2.840 2.730 0.156
76 9 0.105 2.998 1.547 1.250
77 4 0.445 14.600 5.166 6.540
78 4 0.027 13.000 4.929 5.797
79 2 2.753 4.760 3.756 1.419
80 3 1.205 3.150 2.195 0.973
81 6 0.586 4.040 1.864 1.203
82 2 24.300 24.300 24.300 0.000
83 1 5.147 5.147 5.147 -
84 1 3.470 3.470 3.470 -
85 1 5.150 5.150 5.150 -
86 1 1.525 1.525 1.525 -
87 2 1.135 1.495 1.315 0.255
88 1 1.245 1.245 1.245 -
89 1 3.590 3.590 3.590 -
90 1 1.050 1.050 1.050 -
91 1 2.560 2.560 2.560 -
92 2 1.935 3.722 2.829 1.264
93 1 2.080 2.080 2.080 -
94 2 1.269 1.985 1.627 0.506
95 1 2.010 2.010 2.010 -
96 1 3.370 3.370 3.370 -
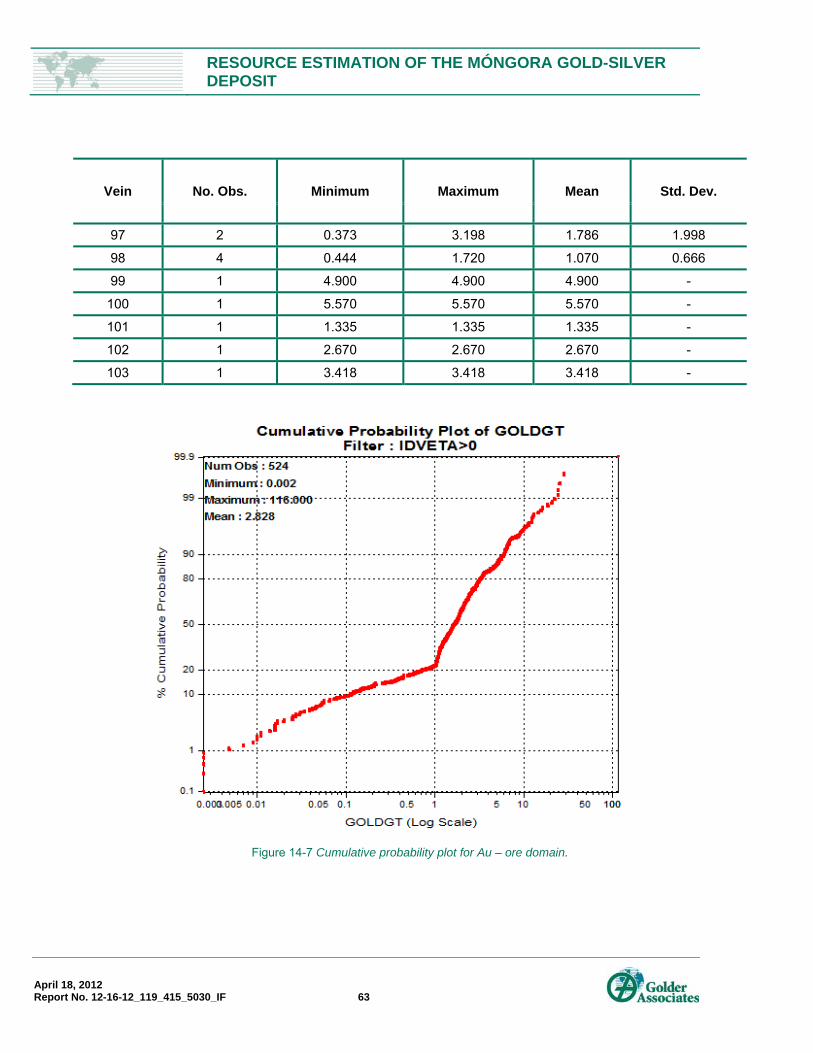
RESOURCE ESTIMATION OF THE MÓNGORA GOLD-SILVER DEPOSIT
April 18, 2012 Report No. 12-16-12_119_415_5030_IF 63
Vein No. Obs. Minimum Maximum Mean Std. Dev.
97 2 0.373 3.198 1.786 1.998
98 4 0.444 1.720 1.070 0.666
99 1 4.900 4.900 4.900 -
100 1 5.570 5.570 5.570 -
101 1 1.335 1.335 1.335 -
102 1 2.670 2.670 2.670 -
103 1 3.418 3.418 3.418 -
Figure 14-7 Cumulative probability plot for Au – ore domain.

RESOURCE ESTIMATION OF THE MÓNGORA GOLD-SILVER DEPOSIT
April 18, 2012 Report No. 12-16-12_119_415_5030_IF 64
Figure 14-8 Cumulative probability plot for Au – background domain.
14.8 Specific Gravity Measurements Eco Oro has undertaken 701 density measurements on drill core samples selected according the lithology, alteration and mineralization.
The partition of this database in relation to the oxidation surface indicated the presence of two distinct populations. Table 14-6 show statistics for the two domains and Figure 14-9 graphs the difference between populations.
Table 14-6 Density database used in modelling
Ore type Zone Density
N. samples Min. Max. Std. Dev. Mean
Oxide 1 218 1.85 3.28 0.051 2.514 Sulphide 3 483 2.12 3.56 0.029 2.643

RESOURCE ESTIMATION OF THE MÓNGORA GOLD-SILVER DEPOSIT
April 18, 2012 Report No. 12-16-12_119_415_5030_IF 65
Figure 14-9 Cumulative probability plot for the two density populations.
The methodology adopted by Eco Oro to provide density values to the geological model is presented in the report “Estimacion de la densidad aparente a partir de tenores de oro – Proyecto Angostura” (Bulk density estimation based on Au grades – Angostura Project) in September 2011 where over 9000 samples (from Angostura and Móngora projects) were analysed.
The procedure take into account that rock density is influenced by multiple factors (rock type, alteration, mineralogy) and presents high correlation between Au grade and oxidation level.
Regression analysis performed over the database showed correlation index around 90% for sulphides and 80% for oxides/transition (Figure 14-10).

RESOURCE ESTIMATION OF THE MÓNGORA GOLD-SILVER DEPOSIT
April 18, 2012 Report No. 12-16-12_119_415_5030_IF 66
Figure 14-10 Correlation for Au in Sulphides zone (left) and Oxide-Transition zone (right).
Based in this study and the oxidation levels defined for Móngora the criteria adopted to assign density values to the block model were: 1) the application of the correlation function for the sulphide zone; 2) use of the mean samples value for oxide zone. The Table 14-7 resume the procedure:
Table 14-7 Procedure to provide density to Móngora model Oxidation level Procedure Value
Oxide Mean value for the zone 2.51 Sulphide Correlation function 0.0369 x Ln(Au_grade) + 2.6509
14.9 Block Model Parameters The Móngora resource model was generated in Vulcan®. The resource model was estimated using an irregular block model with a parent block size of 10.0 m (X) by 10.0 m (Y) by 10.0 m (Z) with sub-blocks not smaller than 1.0 m (X) by 1.0 m (Y) by 1.0 m (Z). The block model specifications are presented in Table 14-8.
Table 14-8 Móngora block model definition
Orientation Bearing Dip Plunge
90 0 0
Origin East North Elevation
129600 304900 2500 Parent block size 10 10 10 Parent number of block 80 130 80 Extension of block model in direction 800 1300 800 Total number of blocks 3,113,524

RESOURCE ESTIMATION OF THE MÓNGORA GOLD-SILVER DEPOSIT
April 18, 2012 Report No. 12-16-12_119_415_5030_IF 67
14.10 Spatial correlation and variography Variography calculation and modeling was completed by Golder using Isatis® Software. All composites flagged as being inside any of the vein wireframes participated defined during geological modeling. Golder performed experimental variograms for each grade variable (Au, Ag, As, Cu and S).
Golder performed the calculations of experimental variograms using a pairwise relative variogram function. The process involved the following steps:
Calculating variogram and assessing directions of anisotropy;
Calculating directional variograms;
Down-the-hole relative variograms to derive the nugget effect;
Fitting the experimental variograms models in the main directions of continuity.
The fitted models together with the experimental variograms are presented in Figure 14-11 to Figure 14-15 and detailed in Table 14-9.
Table 14-9 Adjusted variogram models. VARIOGRAM MODELS – Móngora Project
Element Model Nugget Effect Sill Range1 Range2 Range3
Au
Spherical
0.3
0.45 30 10 15
Spherical 0.123 100 70 55
Spherical 0.195 250 600 500
Ag
Spherical
0.17
0.45 35 20 15
Spherical 0.123 90 130 95
Spherical 0.195 1600 1600 3000
As
Spherical
0.07
0.15 30 10 15
Spherical 0.11 60 15 25
Spherical 0.09 600 400 800
Cu
Spherical
0.1
0.4 30 12 5
Spherical 0.2 120 110 70
Spherical 0.11 550 3000 2000
S
Spherical
0.1
0.37 50 15 25
Spherical 0.046 160 100 80
Spherical 0.437 490 200 650
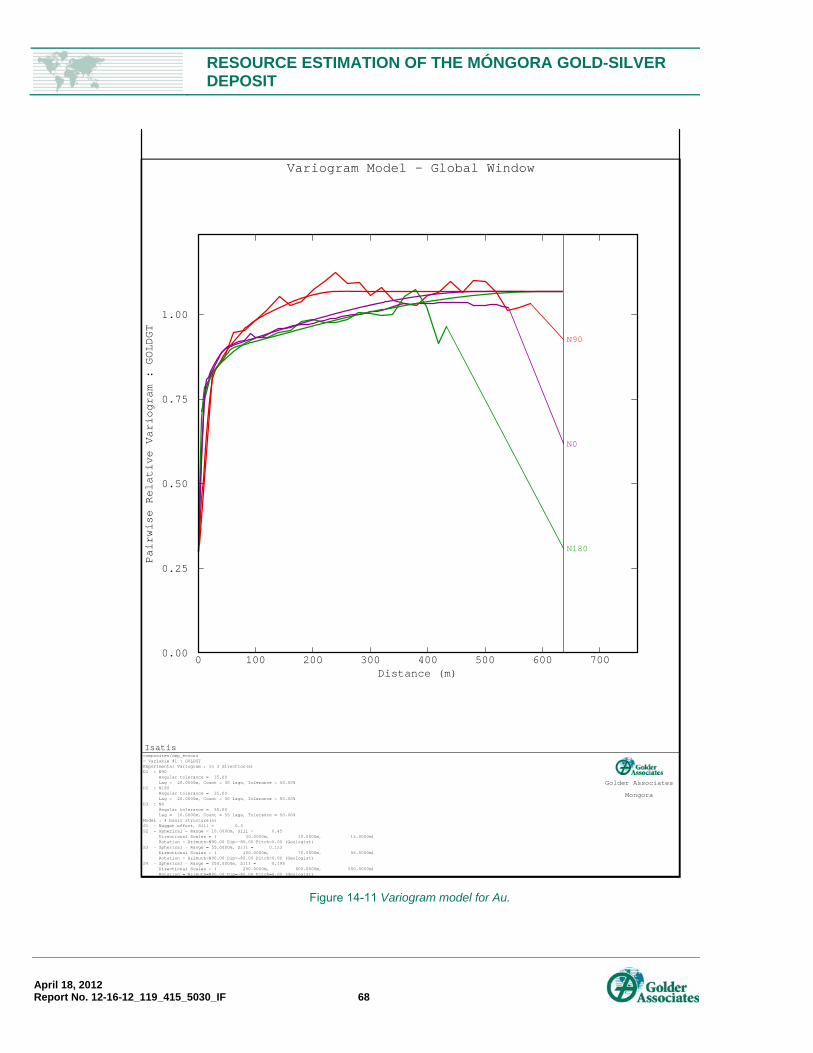
RESOURCE ESTIMATION OF THE MÓNGORA GOLD-SILVER DEPOSIT
April 18, 2012 Report No. 12-16-12_119_415_5030_IF 68
Figure 14-11 Variogram model for Au.
N90
N180
N0
0 100 200 300 400 500 600 700 Distance (m)
0.00
0.25
0.50
0.75
1.00
Pairwise Relative Variogram : GOLDGT
Variogram Model - Global Window
Isatiscomposites/cmp_ecooro- Variable #1 : GOLDGTExperimental Variogram : in 3 direction(s)D1 : N90 Angular tolerance = 35.00 Lag = 20.0000m, Count = 30 lags, Tolerance = 50.00%D2 : N180 Angular tolerance = 35.00 Lag = 20.0000m, Count = 30 lags, Tolerance = 50.00%D3 : N0 Angular tolerance = 35.00 Lag = 10.0000m, Count = 55 lags, Tolerance = 50.00%Model : 4 basic structure(s)S1 - Nugget effect, Sill = 0.3S2 - Spherical - Range = 10.0000m, Sill = 0.45 Directional Scales = ( 30.0000m, 10.0000m, 15.0000m) Rotation = Azimuth=N90.00 Dip=-80.00 Pitch=0.00 (Geologist)S3 - Spherical - Range = 55.0000m, Sill = 0.123 Directional Scales = ( 100.0000m, 70.0000m, 55.0000m) Rotation = Azimuth=N90.00 Dip=-80.00 Pitch=0.00 (Geologist)S4 - Spherical - Range = 250.0000m, Sill = 0.195 Directional Scales = ( 250.0000m, 600.0000m, 500.0000m) Rotation = Azimuth=N90.00 Dip=-80.00 Pitch=0.00 (Geologist)
Golder Associates
Mongora

RESOURCE ESTIMATION OF THE MÓNGORA GOLD-SILVER DEPOSIT
April 18, 2012 Report No. 12-16-12_119_415_5030_IF 69
Figure 14-12 Variogram model for Ag.
N90
N180
N0
0 100 200 300 400 500 600 700 Distance (m)
0.00
0.25
0.50
0.75
1.00
Pairwise Relative Variogram : SILVERGT
Variogram Model - Global Window
Isatiscomposites/cmp_ecooro- Variable #1 : SILVERGTExperimental Variogram : in 3 direction(s)D1 : N90 Angular tolerance = 35.00 Lag = 20.0000m, Count = 30 lags, Tolerance = 50.00%D2 : N180 Angular tolerance = 35.00 Lag = 20.0000m, Count = 30 lags, Tolerance = 50.00%D3 : N0 Angular tolerance = 35.00 Lag = 10.0000m, Count = 55 lags, Tolerance = 50.00%Model : 4 basic structure(s)S1 - Nugget effect, Sill = 0.17S2 - Spherical - Range = 15.0000m, Sill = 0.45 Directional Scales = ( 35.0000m, 20.0000m, 15.0000m) Rotation = Azimuth=N90.00 Dip=-80.00 Pitch=0.00 (Geologist)S3 - Spherical - Range = 90.0000m, Sill = 0.123 Directional Scales = ( 90.0000m, 130.0000m, 95.0000m) Rotation = Azimuth=N90.00 Dip=-80.00 Pitch=0.00 (Geologist)S4 - Spherical - Range = 1600.0000m, Sill = 0.195 Directional Scales = ( 1600.0000m, 1600.0000m, 3000.0000m) Rotation = Azimuth=N90.00 Dip=-80.00 Pitch=0.00 (Geologist)
Golder Associates
Mongora

RESOURCE ESTIMATION OF THE MÓNGORA GOLD-SILVER DEPOSIT
April 18, 2012 Report No. 12-16-12_119_415_5030_IF 70
Figure 14-13 Variogram model for As.
N90
N180
N0
0 100 200 300 400 500 600 700 Distance (m)
0.0
0.1
0.2
0.3
0.4
0.5
Pairwise Relative Variogram : ASPPM
Variogram Model - Global Window
Isatiscomposites/cmp_ecooro- Variable #1 : ASPPMExperimental Variogram : in 3 direction(s)D1 : N90 Angular tolerance = 35.00 Lag = 20.0000m, Count = 30 lags, Tolerance = 50.00%D2 : N180 Angular tolerance = 35.00 Lag = 20.0000m, Count = 30 lags, Tolerance = 50.00%D3 : N0 Angular tolerance = 35.00 Lag = 10.0000m, Count = 55 lags, Tolerance = 50.00%Model : 4 basic structure(s)S1 - Nugget effect, Sill = 0.07S2 - Spherical - Range = 10.0000m, Sill = 0.15 Directional Scales = ( 30.0000m, 10.0000m, 15.0000m) Rotation = Azimuth=N90.00 Dip=-80.00 Pitch=0.00 (Geologist)S3 - Spherical - Range = 15.0000m, Sill = 0.11 Directional Scales = ( 60.0000m, 15.0000m, 25.0000m) Rotation = Azimuth=N90.00 Dip=-80.00 Pitch=0.00 (Geologist)S4 - Spherical - Range = 400.0000m, Sill = 0.09 Directional Scales = ( 600.0000m, 400.0000m, 800.0000m) Rotation = Azimuth=N90.00 Dip=-80.00 Pitch=0.00 (Geologist)
Golder Associates
Mongora

RESOURCE ESTIMATION OF THE MÓNGORA GOLD-SILVER DEPOSIT
April 18, 2012 Report No. 12-16-12_119_415_5030_IF 71
Figure 14-14 Variogram model for Cu.
N90
N180
N0
0 100 200 300 400 500 600 700 Distance (m)
0.00
0.25
0.50
0.75
1.00
Pairwise Relative Variogram : COPPER%
Variogram Model - Global Window
Isatiscomposites/cmp_ecooro- Variable #1 : COPPER%Experimental Variogram : in 3 direction(s)D1 : N90 Angular tolerance = 35.00 Lag = 20.0000m, Count = 30 lags, Tolerance = 50.00%D2 : N180 Angular tolerance = 35.00 Lag = 20.0000m, Count = 30 lags, Tolerance = 50.00%D3 : N0 Angular tolerance = 35.00 Lag = 10.0000m, Count = 55 lags, Tolerance = 50.00%Model : 4 basic structure(s)S1 - Nugget effect, Sill = 0.1S2 - Spherical - Range = 5.0000m, Sill = 0.4 Directional Scales = ( 30.0000m, 12.0000m, 5.0000m) Rotation = Azimuth=N90.00 Dip=-80.00 Pitch=0.00 (Geologist)S3 - Spherical - Range = 70.0000m, Sill = 0.2 Directional Scales = ( 120.0000m, 110.0000m, 70.0000m) Rotation = Azimuth=N90.00 Dip=-80.00 Pitch=0.00 (Geologist)S4 - Spherical - Range = 550.0000m, Sill = 0.11 Directional Scales = ( 550.0000m, 3000.0000m, 2000.0000m) Rotation = Azimuth=N90.00 Dip=-80.00 Pitch=0.00 (Geologist)
Golder Associates
Mongora

RESOURCE ESTIMATION OF THE MÓNGORA GOLD-SILVER DEPOSIT
April 18, 2012 Report No. 12-16-12_119_415_5030_IF 72
Figure 14-15 Variogram model for S.
N90
N180
N0
0 100 200 300 400 500 600 700 Distance (m)
0.0
0.5
1.0
1.5
Pairwise Relative Variogram : S%
Variogram Model - Global Window
Isatiscomposites/cmp_ecooro- Variable #1 : S%Experimental Variogram : in 3 direction(s)D1 : N90 Angular tolerance = 35.00 Lag = 20.0000m, Count = 30 lags, Tolerance = 50.00%D2 : N180 Angular tolerance = 35.00 Lag = 20.0000m, Count = 30 lags, Tolerance = 50.00%D3 : N0 Angular tolerance = 35.00 Lag = 10.0000m, Count = 55 lags, Tolerance = 50.00%Model : 4 basic structure(s)S1 - Nugget effect, Sill = 0.1S2 - Spherical - Range = 15.0000m, Sill = 0.37 Directional Scales = ( 50.0000m, 15.0000m, 25.0000m) Rotation = Azimuth=N90.00 Dip=-80.00 Pitch=0.00 (Geologist)S3 - Spherical - Range = 80.0000m, Sill = 0.046 Directional Scales = ( 160.0000m, 100.0000m, 80.0000m) Rotation = Azimuth=N90.00 Dip=-80.00 Pitch=0.00 (Geologist)S4 - Spherical - Range = 200.0000m, Sill = 0.437 Directional Scales = ( 490.0000m, 200.0000m, 650.0000m) Rotation = Azimuth=N90.00 Dip=-80.00 Pitch=0.00 (Geologist)
Golder Associates
Mongora
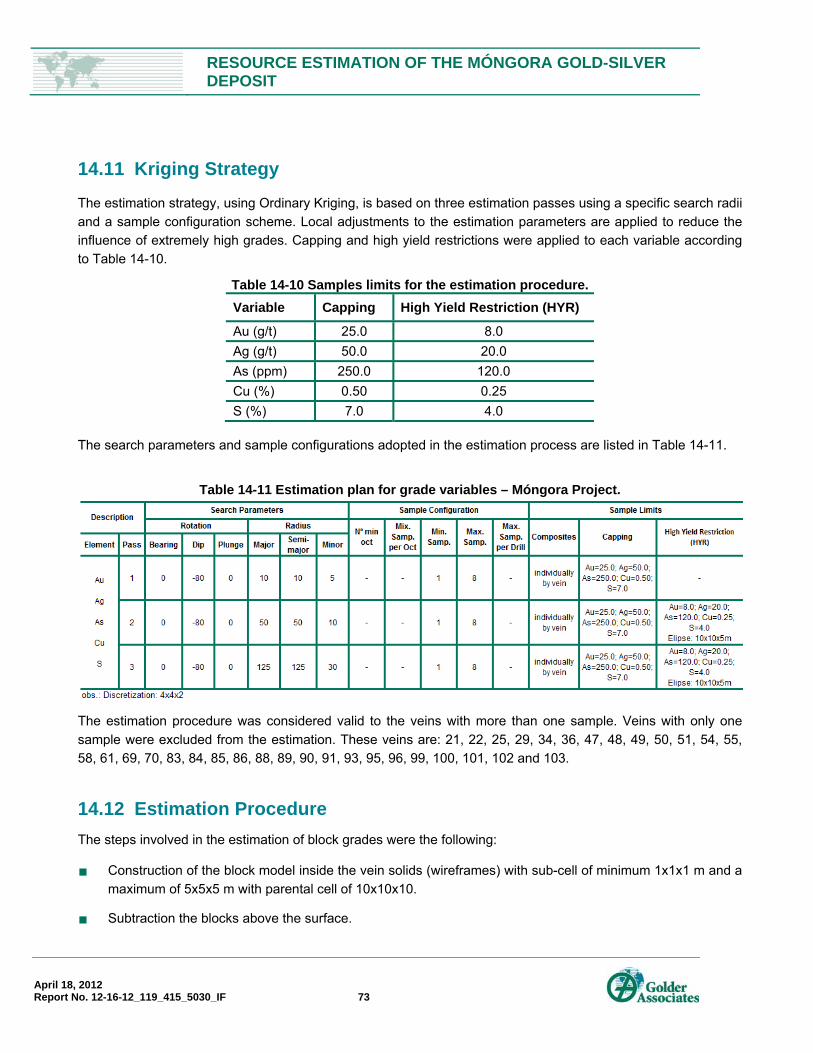
RESOURCE ESTIMATION OF THE MÓNGORA GOLD-SILVER DEPOSIT
April 18, 2012 Report No. 12-16-12_119_415_5030_IF 73
14.11 Kriging Strategy The estimation strategy, using Ordinary Kriging, is based on three estimation passes using a specific search radii and a sample configuration scheme. Local adjustments to the estimation parameters are applied to reduce the influence of extremely high grades. Capping and high yield restrictions were applied to each variable according to Table 14-10.
Table 14-10 Samples limits for the estimation procedure. Variable Capping High Yield Restriction (HYR)
Au (g/t) 25.0 8.0 Ag (g/t) 50.0 20.0 As (ppm) 250.0 120.0 Cu (%) 0.50 0.25 S (%) 7.0 4.0
The search parameters and sample configurations adopted in the estimation process are listed in Table 14-11.
Table 14-11 Estimation plan for grade variables – Móngora Project.
The estimation procedure was considered valid to the veins with more than one sample. Veins with only one sample were excluded from the estimation. These veins are: 21, 22, 25, 29, 34, 36, 47, 48, 49, 50, 51, 54, 55, 58, 61, 69, 70, 83, 84, 85, 86, 88, 89, 90, 91, 93, 95, 96, 99, 100, 101, 102 and 103.
14.12 Estimation Procedure The steps involved in the estimation of block grades were the following:
Construction of the block model inside the vein solids (wireframes) with sub-cell of minimum 1x1x1 m and a maximum of 5x5x5 m with parental cell of 10x10x10.
Subtraction the blocks above the surface.

RESOURCE ESTIMATION OF THE MÓNGORA GOLD-SILVER DEPOSIT
April 18, 2012 Report No. 12-16-12_119_415_5030_IF 74
Ordinary Kriging for Gold, Silver, Arsenic, Copper and Sulfur grades.
Assign the oxidation level to the block model according to the oxidation surface.
Assign Density values using criteria defined in section 14.8.
14.13 Resource Classification Due to the low drilling density available at Móngora, which translates into a limited amount of data available for geological modeling and grade estimation, all estimated blocks inside the modeled veins that were estimated with more than 1 composite were classified as Inferred resource. The lack of more extensive metallurgical tests was also considered a factor preventing the classification of Indicated and Measured resources.
14.14 Model Validation
To check the validity and consistency of the Móngora grade estimates, a validation of the block model was carried out to access the Kriging performance and conformance to the input data. A series of comprehensive checks were performed including:
Comparison between composites and block model statistics;
Visual validation of estimated grades versus composite grades;
Swath plots comparing block grades against composite grades.
14.14.1 Statistical comparison A comparison between declustered composite grades and estimated block grades was performed to confirm that the average composite grades are closely reproduced by the kriging estimates. The results indicate that the block model shows conformance to the input data. The mean grade conformance was tabulated using the following criteria:
Values close to 0% represent good conformance. Negative values indicate that the model estimates are conservative with respect to the data, and positive values show overestimation of the global average in the estimates. In general, differences lower than 5% are desirable and differences greater than 10% require attention.
The analysis was performed individually by vein using the global statistics for the block model and declusterized statistics for the composite grades. The results presented in Table 14-12, Table 14-13 and Table 14-14 indicate that the process honors the database and no significant difference were found. The complete set of tables with the statistical comparisons is included in Appendix D.
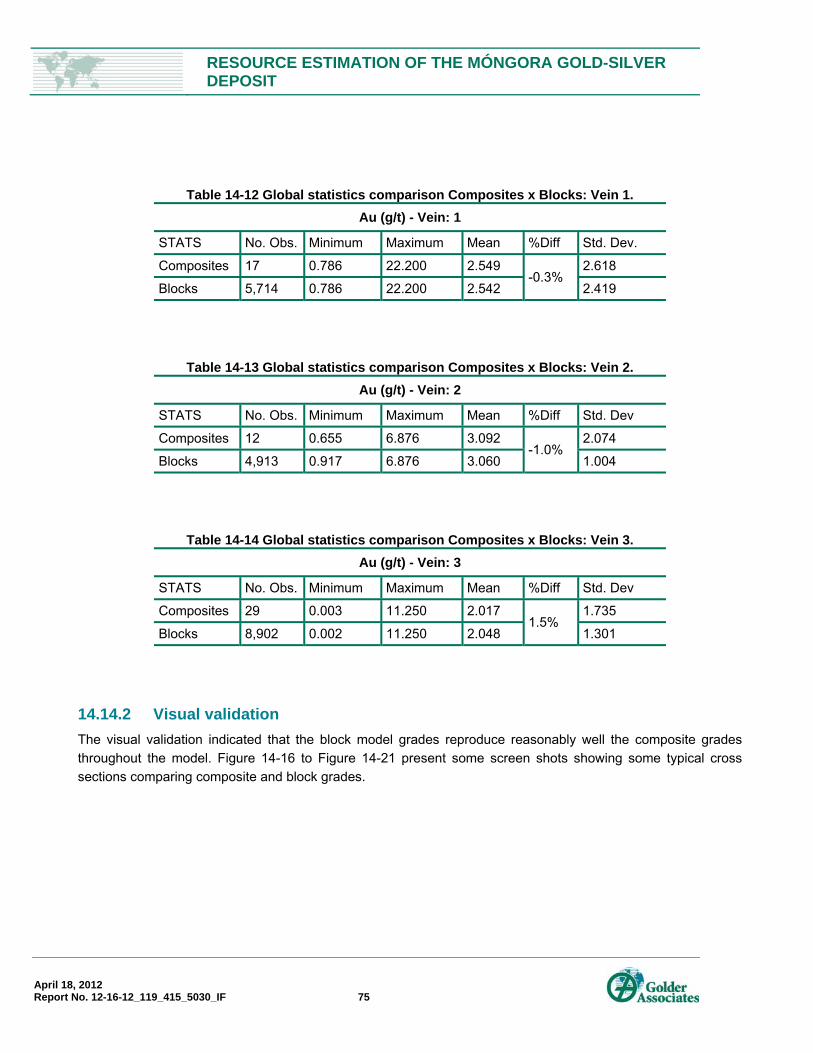
RESOURCE ESTIMATION OF THE MÓNGORA GOLD-SILVER DEPOSIT
April 18, 2012 Report No. 12-16-12_119_415_5030_IF 75
Table 14-12 Global statistics comparison Composites x Blocks: Vein 1. Au (g/t) - Vein: 1
STATS No. Obs. Minimum Maximum Mean %Diff Std. Dev.
Composites 17 0.786 22.200 2.549 -0.3%
2.618
Blocks 5,714 0.786 22.200 2.542 2.419
Table 14-13 Global statistics comparison Composites x Blocks: Vein 2. Au (g/t) - Vein: 2
STATS No. Obs. Minimum Maximum Mean %Diff Std. Dev
Composites 12 0.655 6.876 3.092 -1.0%
2.074
Blocks 4,913 0.917 6.876 3.060 1.004
Table 14-14 Global statistics comparison Composites x Blocks: Vein 3. Au (g/t) - Vein: 3
STATS No. Obs. Minimum Maximum Mean %Diff Std. Dev
Composites 29 0.003 11.250 2.017 1.5%
1.735
Blocks 8,902 0.002 11.250 2.048 1.301
14.14.2 Visual validation The visual validation indicated that the block model grades reproduce reasonably well the composite grades throughout the model. Figure 14-16 to Figure 14-21 present some screen shots showing some typical cross sections comparing composite and block grades.

RESOURCE ESTIMATION OF THE MÓNGORA GOLD-SILVER DEPOSIT
April 18, 2012 Report No. 12-16-12_119_415_5030_IF 76
Figure 14-16 Vertical section (X=130205) showing drill hole grades against block model grades.
Figure 14-17 Detail of the red square in Figure 14-16 indicating good adjustment between composites and block grades.

RESOURCE ESTIMATION OF THE MÓNGORA GOLD-SILVER DEPOSIT
April 18, 2012 Report No. 12-16-12_119_415_5030_IF 77
Figure 14-18 Detail of the yellow square in Figure 14-16 indicating good adjustment between composites and block grades.
Figure 14-19 Vertical section (X=129890) showing drill hole grades against block model grades.

RESOURCE ESTIMATION OF THE MÓNGORA GOLD-SILVER DEPOSIT
April 18, 2012 Report No. 12-16-12_119_415_5030_IF 78
Figure 14-20 Detail of the red square in Figure 14-19 indicating good adjustment between composites and block grades.
Figure 14-21 Detail of the yellow square in Figure 14-19 indicating good adjustment between composites and block grades.
RESOURCE ESTIMATION OF THE MÓNGORA GOLD-SILVER DEPOSIT
April 18, 2012 Report No. 12-16-12_119_415_5030_IF 79
14.14.3 Swath plots To evaluate the robustness of the conformance of the block grades to the data, in a semi-local approach, swath plots were produced. Swath plot generation involves averaging both the blocks and samples in panels from 25.0m x 25.0m x 10.0m (X, Y and Z), then averaging of the panel averages into Easting, Northing and RL swaths to allow trend plots of block vs. composite values to be constructed. The use of panel averages also allows for the generation of scatter plots and Q-Q plots of panel grades to provide an indication of conditional bias and degree of smoothing. On these plots, two distributions that are very similar would plot over the 45 degrees line. Significant deviations indicate potential for over smoothing and bias.
In general, the swath plots indicates good conformance between block estimates and composite grades. Figure 14-22 and Figure 14-23 present swath plots for vein 1 and 2. Similar results are observed for all veins that have been estimated.

RESOURCE ESTIMATION OF THE MÓNGORA GOLD-SILVER DEPOSIT
April 18, 2012 Report No. 12-16-12_119_415_5030_IF 80
Figure 14-22 Swath plot for Au - vein 1.
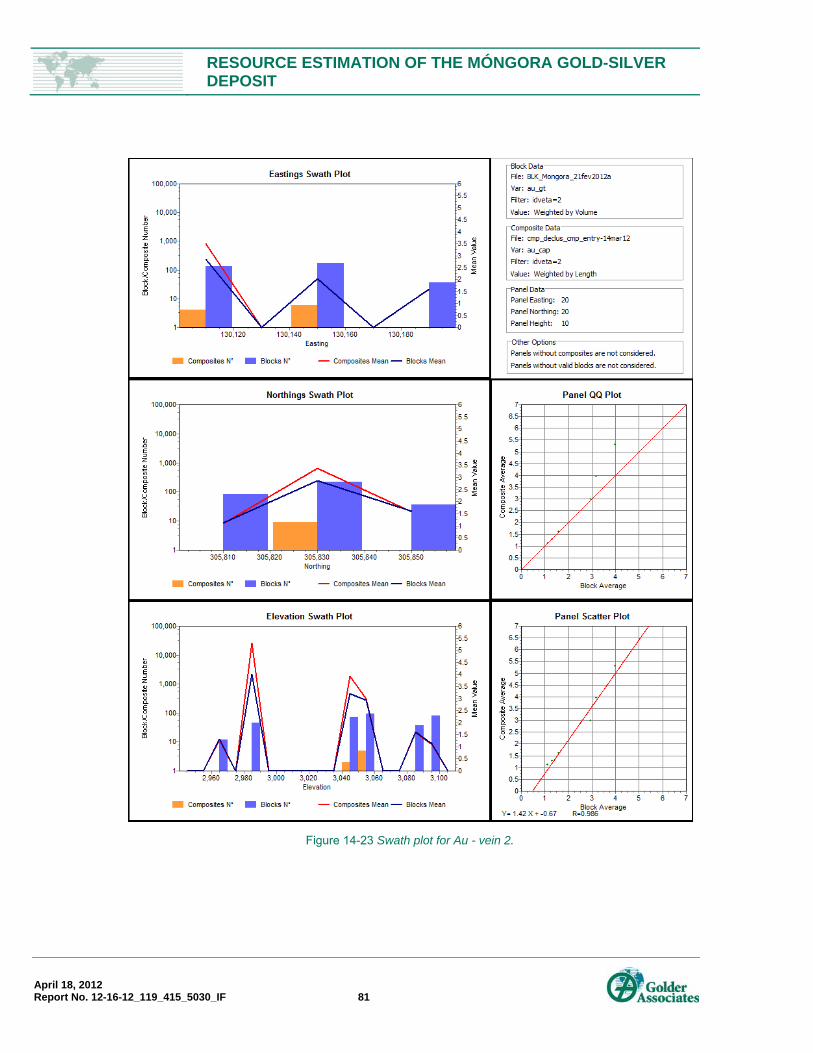
RESOURCE ESTIMATION OF THE MÓNGORA GOLD-SILVER DEPOSIT
April 18, 2012 Report No. 12-16-12_119_415_5030_IF 81
Figure 14-23 Swath plot for Au - vein 2.
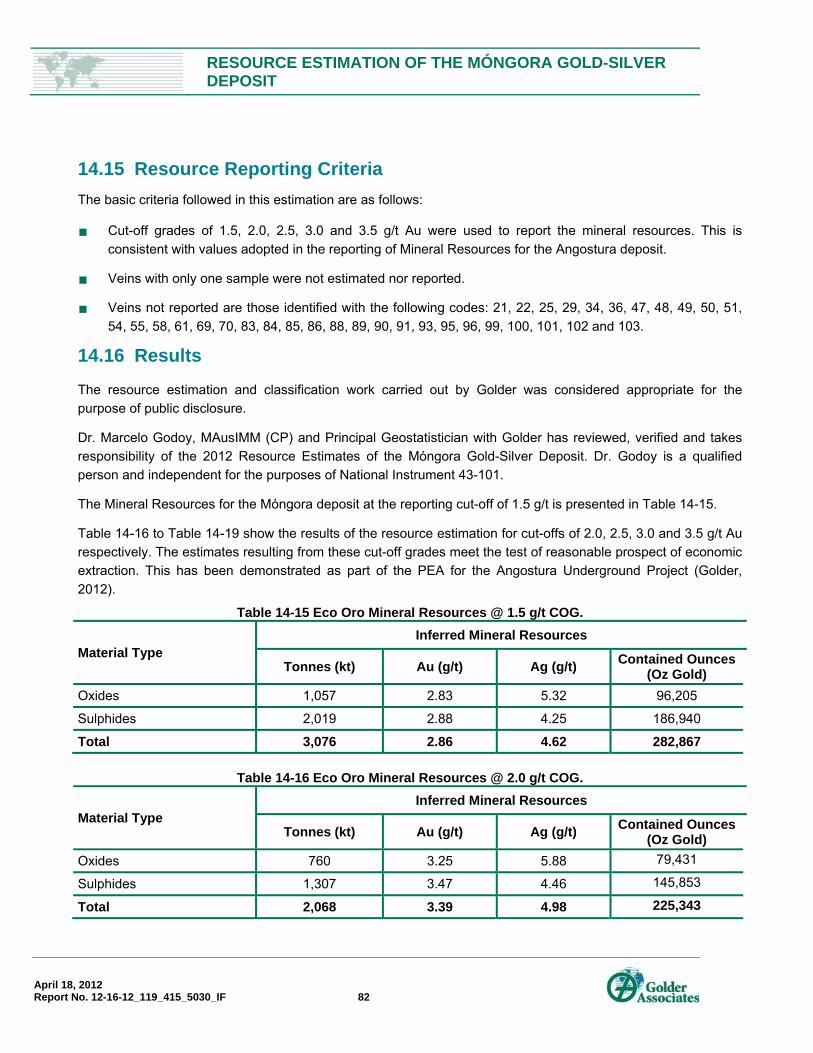
RESOURCE ESTIMATION OF THE MÓNGORA GOLD-SILVER DEPOSIT
April 18, 2012 Report No. 12-16-12_119_415_5030_IF 82
14.15 Resource Reporting Criteria The basic criteria followed in this estimation are as follows:
Cut-off grades of 1.5, 2.0, 2.5, 3.0 and 3.5 g/t Au were used to report the mineral resources. This is consistent with values adopted in the reporting of Mineral Resources for the Angostura deposit.
Veins with only one sample were not estimated nor reported.
Veins not reported are those identified with the following codes: 21, 22, 25, 29, 34, 36, 47, 48, 49, 50, 51, 54, 55, 58, 61, 69, 70, 83, 84, 85, 86, 88, 89, 90, 91, 93, 95, 96, 99, 100, 101, 102 and 103.
14.16 Results
The resource estimation and classification work carried out by Golder was considered appropriate for the purpose of public disclosure.
Dr. Marcelo Godoy, MAusIMM (CP) and Principal Geostatistician with Golder has reviewed, verified and takes responsibility of the 2012 Resource Estimates of the Móngora Gold-Silver Deposit. Dr. Godoy is a qualified person and independent for the purposes of National Instrument 43-101.
The Mineral Resources for the Móngora deposit at the reporting cut-off of 1.5 g/t is presented in Table 14-15.
Table 14-16 to Table 14-19 show the results of the resource estimation for cut-offs of 2.0, 2.5, 3.0 and 3.5 g/t Au respectively. The estimates resulting from these cut-off grades meet the test of reasonable prospect of economic extraction. This has been demonstrated as part of the PEA for the Angostura Underground Project (Golder, 2012).
Table 14-15 Eco Oro Mineral Resources @ 1.5 g/t COG.
Material Type Inferred Mineral Resources
Tonnes (kt) Au (g/t) Ag (g/t) Contained Ounces (Oz Gold)
Oxides 1,057 2.83 5.32 96,205
Sulphides 2,019 2.88 4.25 186,940
Total 3,076 2.86 4.62 282,867
Table 14-16 Eco Oro Mineral Resources @ 2.0 g/t COG.
Material Type Inferred Mineral Resources
Tonnes (kt) Au (g/t) Ag (g/t) Contained Ounces (Oz Gold)
Oxides 760 3.25 5.88 79,431
Sulphides 1,307 3.47 4.46 145,853
Total 2,068 3.39 4.98 225,343

RESOURCE ESTIMATION OF THE MÓNGORA GOLD-SILVER DEPOSIT
April 18, 2012 Report No. 12-16-12_119_415_5030_IF 83
Table 14-17 Eco Oro Mineral Resources @ 2.5 g/t COG.
Material Type Inferred Mineral Resources
Tonnes (kt) Au (g/t) Ag (g/t) Contained Ounces (Oz Gold)
Oxides 500 3.77 6.48 60,653
Sulphides 961 3.94 4.43 121,700
Total 1,461 3.88 5.13 182,269
Table 14-18 Eco Oro Mineral Resources @ 3.0 g/t COG.
Material Type Inferred Mineral Resources
Tonnes (kt) Au (g/t) Ag (g/t) Contained Ounces (Oz Gold)
Oxides 313 4.36 6.50 43,885
Sulphides 666 4.48 4.54 95,904
Total 979 4.44 5.17 139,738
Table 14-19 Eco Oro Mineral Resources @ 3.5 g/t COG.
Material Type Inferred Mineral Resources
Tonnes (kt) Au (g/t) Ag (g/t) Contained Ounces (Oz Gold)
Oxides 193 5.05 6.38 31,327
Sulphides 532 4.81 4.68 82,323
Total 725 4.87 5.13 113,561
Mineral Resources are not Mineral Reserves and do not have demonstrated economic viability. There is no certainty that all or any part of the Mineral Resources will be converted into Mineral Reserves.
Mineral Resource tonnages have been rounded to reflect the accuracy of the estimate, and numbers may not add up due to rounding.
An assumption was made that Móngora mineralized material has similar metallurgical behaviour to Angostura. Some preliminary leach tests have been carried out on Móngora drill core.
The mineral resource estimates discloses in this report were estimated using the Canadian Institute of Mining, Metallurgy and Petroleum (CIM) Standards on Mineral Resources and Reserves, Definitions and Guidelines prepared by the CIM Standing Committee on Reserve Definitions. Mineral resources which are not mineral reserves do not have demonstrated economic viability. The estimate of mineral resources may be materially affected by environmental, permitting, legal, title, taxation, sociopolitical, marketing, or other relevant issues. The quantity and grade of reported Inferred resources in this estimation are uncertain in nature and there has been insufficient exploration to define these Inferred resources as an indicated or measured mineral resource and it is uncertain if further exploration will result in upgrading them to an Indicated or Measured mineral resource category.

RESOURCE ESTIMATION OF THE MÓNGORA GOLD-SILVER DEPOSIT
April 18, 2012 Report No. 12-16-12_119_415_5030_IF 84
15.0 ADJACENT PROPERTIES There are a number of small-scale mining operations in the area of the Angostura project run by Colombian nationals and cooperatives.
AUX Canada (“AUX” formerly Ventana Gold Corp) owns 96.7% of the mineral rights of La Bodega property (Ventana Gold Corp., 2011) which is located to the northwest of the Móngora deposit. AUX has drilled more than 104,774 metres in more than 306 drill holes defining 4 mineralized zones, La Bodega (Extension of Angostura), La Mascota, Las Mercedes and Aserradero (www.ventanagold.com, 2010). On March 16 Ventana Gold Corp, the previous owner of these properties was acquired by AUX.
Galway Resources Ltd. (TSX-V:GWY) and Calvista Gold Corporation have agreements over the California-Vetas district, including a land position along strike and adjacent to (south west) Ventana’s La Mascota area and are conducting a drilling program in California. Galway acquired the Reina de Oro gold property in Vetas (www.galwayresources.com, 2010).
Calvista, a Colombian Canadian joint venture holds smaller claims in the La Baja Creek.
Leyhat Colombia, a subsidiary of CB Gold, has mineral properties in the California-Vetas distict, but this company does not have adjacent properties.
16.0 OTHER RELEVANT A DATA INFORMATION No additional information is available at this time regarding the Móngora Mineral Resource Estimate disclosed in this report. For other additional relevant information the reader may refer to the Technical Report “Updated Preliminary Economic Assessment for the Angostura Gold-Silver Underground Project, Santander Department, Colombia” of March 23, 2012 (Golder, 2012).
17.0 INTERPRETATION AND CONCLUSIONS
Golder has reviewed the project data and the drill hole database and has visited the project site. Golder believes that the data provided by Eco Oro, as well as the geological interpretations Eco Oro has derived from the data, are generally an accurate and reasonable representation of the Móngora’s mineralized structures.
The block grade estimates have been derived using methodology and parameters that are appropriate for the observed spatial continuity of grades and style of mineralization. The mineral resources disclosed in this Technical Report were estimated using the Canadian Institute of Mining, Metallurgy and Petroleum (CIM) Standards on Mineral Resources and Reserves, Definitions and Guidelines prepared by the CIM Standing Committee on Reserve Definitions.
The Mongora deposit has the potential to enhance the value of the envisioned Angostura underground mine project. Not only are the prospects for further expansion of the mineralization at Mongora favourable but its close proximity to Angostura also opens up the possibility of developing Mongora as an early source of mineralized feed in the development of the project.

RESOURCE ESTIMATION OF THE MÓNGORA GOLD-SILVER DEPOSIT
April 18, 2012 Report No. 12-16-12_119_415_5030_IF 85
18.0 RECOMMENDATIONS The following studies are recommended to be carried out to support the next phase of resource definition for the Móngora deposit:
Infill drilling to confirm the continuity of the mineralized veins and improve grade estimation.
Metallurgical testing to confirm assumption that Móngora mineralized material has similar metallurgical behavior to that of Angostura.
Geotechnical characterization program including oriented drilling.
RESOURCE ESTIMATION OF THE MÓNGORA GOLD-SILVER DEPOSIT
April 18, 2012 Report No. 12-16-12_119_415_5030_IF 86
19.0 REFERENCES
Canadian Institute of Mining, Metallurgy and Petroleum (CIM), 2000: CIM Standards for Mineral Resources and Mineral Reserves, Definitions and Guidelines: Canadian Institute of Mining, Metallurgy and Petroleum, August, 2000 http://www.jogmec.go.jp/mric_web/tani/cimstandard.pdf.
Canadian Institute of Mining, Metallurgy and Petroleum (CIM), 2003: Estimation of Mineral Resources and Mineral Reserves, Best Practice Guidelines: Canadian Institute of Mining, Metallurgy and Petroleum, November 23, 2003, http://www.cim.org/committees/estimation2003.pdf.
Canadian Institute of Mining, Metallurgy and Petroleum (CIM), 2005: CIM Standards for Mineral Resources and Mineral Reserves, Definitions and Guidelines: Canadian Institute of Mining, Metallurgy and Petroleum, December 2005, http://www.cim.org/committees/CIMDefStds_Dec11_05.pdf.
Canadian Securities Administrators (CSA), 2005: National Instrument 43-101, Standards of Disclosure for Mineral Projects, Canadian Securities Administrators.
Einaudi, M.T., Hedenquist, J., and Inan, E., 2003: Sulfidation State Of Fluids In Active And Extinct Hydrothermal Systems: Transitions From Porphyry To Epithermal Environments: in Simmons, S.F. and Graham, I.J., eds., Volcanic, Geothermal, And Ore-Forming Fluids: Rulers And Witnesses Of Processes Within The Earth (Giggenbach Volume): Society of Economic Geologists Special Publication 10, pp. 285–313.
Felder, F., 2004, Social Aspects of Developing a Mining Project in an Area of Conflict. Angostura Project – Colombia. Paper presented at Symposium de Oro, Lima, Peru on May 6, 2004.
Felder, F., Spat, A. & Silva, R., 2000: Angostura Project, A High Sulphidation Gold Silver Deposit located in the Santander Complex of North Eastern Colombia. Paper presented at Simposio de Oro, Lima, Perú, May 2000.
Felder, F., Ortiz, G., Campos, C, Monsalve, I., Silva, A. & Horner, J, 2005: Angostura Project, A High Sulfidation Gold-Silver Deposit located in the Santander Complex of North Eastern Colombia. Paper given a the Newgen Conference, Perth, Australia, November 2000.
Hedenquist, J.W., 2005: Epithermal Gold Deposits: Styles, Characteristics, and Exploration, XVI Congreso Geologico Argentino, 18–19 September, Mendoza, Argentina.
Hedenquist, J.W., Arribas, A., and Reynolds, T.J., 1998: Evolution of an Intrusion-centered Hydrothermal System: Far Southeast Lepanto porphyry and epithermal Cu-Au deposits, Philippines: Economic Geology, v. 93, pp. 374–404.
Hedenquist, J.W., Arribas, A.Jr., and Gonzalez-Urien, E., 2000, Exploration for epithermal gold deposits: Reviews in Economic Geology, v. 13, pp. 245–277.
Harris, F., 1998: Petrographic Examination of Thirty samples from the Angostura Project: unpublished report prepared by Vancouver Petrographics for Eco Oro, September 23, 1998
Horner, J., 2005: Structural Geology and Tectonics of the Angostura Project Area: unpublished final draft report prepared by iC consulenten for Eco Oro, May 4, 2005.
Horner, J., 2008: Geological, Geotechnical and Rock Mechanical Services at Kinross Technical Services, 1999 Angostura Underground Mining Examination: unpublished report prepared by iC consulenten for Eco Oro October 12, 1999.
Lavens, T., 1999: 1998 Audit of Drill Core Assay Results Contained in the Angostura Database: unpublished memorandum to S. Ristorcelli of Mine Development Associates, February 15, 1999.

RESOURCE ESTIMATION OF THE MÓNGORA GOLD-SILVER DEPOSIT
April 18, 2012 Report No. 12-16-12_119_415_5030_IF 87
NCL, Alquimia, 2011: Eco Oro Resources, Angostura Underground Mine - Scoping Study, Final Report. Unpublished internal study, January 2011.
Sillitoe, R.H., 1995: Exploration of porphyry copper lithocaps, in Pacific Rim Congress 95, 19–22 November 1995, Auckland, New Zealand, proceedings: Carlton South, The Australasian Institute of Mining and Metallurgy, p. 527–532.
Sillitoe, R.H., and Hendenquist, J.W., 2003: Linkages between Volcanotectonic Settings, Ore-fluid Compositions, and Epithermal Precious-metal Deposits: Society of Economic Geologists Special Publication 10, 2003, pp. 315–343.
Smee, B., 2005a: Interim Recommendations for Quality Control Procedures, Angostura Project, Colombia: unpublished report prepared by Smee Consultants for Eco Oro, August 2005.
Smee, B., 2005b: A Review of Quality Control Data, August to December, 2005: unpublished report prepared by Smee Consultants for Eco Oro, December 2005.
Smee, B., 2007: A Review of Quality Control Data, January 2006 to May, 2007: unpublished report prepared by Smee Consultants for Eco Oro, July 2007.
Smee, B., 2008: A Review of Quality Control Data, October 2008, Angostura Project, Colombia: unpublished report prepared by Smee Consultants for Eco Oro, October 2008.
Smee, B., 2010: A Review of Quality Control Data, September 2010, Angostura Project, Colombia: unpublished report prepared by Smee Consultants for Eco Oro, September 2010.
Thompson, A., 2004: Petrographic Report, Angostura Project: unpublished report prepared by PetraScience Consultants Inc. for Eco Oro, 23 June 2004.
Thompson, A., 2005a: Petrographic Report, Angostura Project: unpublished report prepared by PetraScience Consultants Inc. for Eco Oro 14 January 2005.
Thompson, A., 2005b: SEM Analysis of Gold- and Silver-Bearing Minerals from the Angostura Project: unpublished report prepared by PetraScience Consultants Inc. for Eco Oro 30 June 2005.
Thompson, A., 2005c: Petrographic Report – A & B (part 2), Angostura Project: unpublished report prepared by PetraScience Consultants Inc. for Eco Oro 26 September 2005.
Thompson, A., 2005d: Petrographic Report, Angostura Project: unpublished report prepared by PetraScience Consultants Inc. for Eco Oro, 16 December 2005.
Golder Associates, 2012: Updated Preliminary Economical Assessment for the Angostura Gold-Silver Underground Project, Santander Department, Colombia., March 2012.
RESOURCE ESTIMATION OF THE MÓNGORA GOLD-SILVER DEPOSIT
April 18, 2012 Report No. 12-16-12_119_415_5030_IF
20.0 DATE AND SIGNATURE PAGE
The effective date of this Technical Report, entitled “Resource Estimation of the Móngora Gold-Silver Deposit, Santander Department, Colombia” is April 18, 2012.
GOLDER ASSOCIATES PERÚ S.A.
Marcelo Godoy Marivalda Marques Principal, Ore Evaluation Services/QP Project Manager
MG/MM/Jp/ rm
c:\work\greystar\mongora\ni 43-101_mongora_18apr2012_final_a.docx

RESOURCE ESTIMATION OF THE MÓNGORA GOLD-SILVER DEPOSIT
April 18, 2012 Report No. 12-16-12_119_415_5030_IF
APPENDIX A Certificate of Qualified Person

RESOURCE ESTIMATION OF THE MÓNGORA GOLD-SILVER DEPOSIT
April 18, 2012 Report No. 12-16-12_119_415_5030_IF
CERTIFICATE OF QUALIFIED PERSON Marcelo Godoy, PhD As the author of the Technical Report entitled “Resource Estimation of the Móngora Gold-Silver Deposit, Santander Department, Colombia”, dated 18 April 2012, on the Angostura Property of Eco Oro Minerals Corporation (the “Report”), I hereby make the following statements:
• My name is Dr Marcelo Godoy and my title is Principal, Ore Evaluation Services with the firm of Golder Associates S.A., with a business address at Magdalena 181 piso 3, Las Condes, Santiago, Chile. My residential address is Onofre Jarpa 9476, La Reina, Santiago, Chile.
• My formal education qualifications include PhD (Doctor of Philosophy) in Mining Engineering from the University of Queensland (2002), MSc (Master of Science) in Mineral Economics from the Federal University of Rio Grande do Sul, Brazil and BEng (Bachelor of Engineering) in Mining from the Federal of Rio Grande do Sul (1995).
• I am a practising Geostatistician and Mining Engineer and a Chartered Professional and Member in good standing of the Australasian Institute of Mining and Metallurgy (MAusIMM).
• I have practiced my profession continuously since 1996.
• I have read the definition of “qualified person” set out in National Instrument 43-101 (NI 43-101) and certify that, by reason of my education, affiliation with a professional association (as defined in NI 43-101) and past relevant work experience, I fulfil the requirements to be a “Qualified Person” for the purpose of NI 43-101.
• My relevant experience with respect to the Móngora Gold-Silver Deposit includes over 15 years experience in Mineral Resource and Mineral Reserve estimation for epithermal gold deposits, grade control, sampling studies and evaluation of mining projects.
• I have had prior involvement with the Property related to the recent development of the Updated PEA for the Angostura Underground Project. I was the principal author of the Technical Report entitled “Updated Preliminary Economic Assessment on the Angostura Gold-Silver Underground Project, Santander Department, Colombia”, dated 23 March 2012.
• I have supervised and reviewed the work carried out by Golder and Eco Oro professionals for the estimation of mineral resources for the Móngora Gold-Silver Deposit. I am responsible for the preparation of all Sections and take responsibility as the principal author of this Technical Report titled “Resource Estimation of the Móngora Gold-Silver Deposit, Santander Department, Colombia”, dated 18 April 2012. I have personally visited the property from 1 to 5 August 2011.

RESOURCE ESTIMATION OF THE MÓNGORA GOLD-SILVER DEPOSIT
April 18, 2012 Report No. 12-16-12_119_415_5030_IF
• As of the date of this Certificate, to my knowledge, information and belief, the section of this Technical Report for which I am responsible contain all scientific and technical information that is required to be disclosed to make the Technical Report not misleading.
• I am independent of the Issuer as defined by Section 1.5 of the Instrument.
• I have read National Instrument 43-101 and the sections in this Technical Report have been prepared in compliance with National Instrument 43-101, Companion Policy 43-101CP and Form 43-101F1.
Signed and dated this 18nd day of April, 2012 at Santiago, Chile
“Original Document signed by Dr M C Godoy, MAusIMM (CP). Principal, Ore Evaluation Services” ______________________________ Signature

RESOURCE ESTIMATION OF THE MÓNGORA GOLD-SILVER DEPOSIT
April 18, 2012 Report No. 12-16-12_119_415_5030_IF
APPENDIX B QAQC Results

RESOURCE ESTIMATION OF THE MÓNGORA GOLD-SILVER DEPOSIT
April 18, 2012 Report No. 12-16-12_119_415_5030_IF
Eco Oro - Mongora Project
Standard BLANK - Au
Mean
Standard Devn
Counts
Minimum
Maximum
Median
Average HRD%
0.004 g/t Au
0.007 g/t Au sq
139
0.002 g/t Au
0.078 g/t Au
0.002 g/t Au
0.00 %
Expected Mean
Expected Std Dev
% Bias (-ve when underestimated)
No of Outlier +/- 3 Std Dev
% Outside Tolerance
CV
Average HARD
-999.000 g/t Au
0.020 g/t Au sq
0.00 %
1
0.72 %
1.60 %
0.00 %
CRM - Ordered Series
Sample ID
Lab
Valu
es
0
.010
.020
.030
.040
.050
.060
.070
.080
G271055 G984123 H239151 H245656 I386665 I387226 J299158 I388020
Upper Limit
Lab Value
CRM - Time Series
Return Date
Lab
Valu
es
0
.010
.020
.030
.040
.050
.060
.070
.080
29/03/2009 07/07/2009 15/10/2009 23/01/2010 03/05/2010 11/08/2010 19/11/2010
Upper Limit
Lab Value

RESOURCE ESTIMATION OF THE MÓNGORA GOLD-SILVER DEPOSIT
April 18, 2012 Report No. 12-16-12_119_415_5030_IF
Eco Oro - Mongora Project
Standard CDN-CGS-13 - Au
Mean
Standard Devn
Counts
Minimum
Maximum
Median
Average HRD%
0.959 g/t Au
0.138 g/t Au sq
93
0.204 g/t Au
1.175 g/t Au
0.973 g/t Au
-3.29 %
Expected Mean
Expected Std Dev
% Bias (-ve when underestimated)
No of Outlier +/- 3 Std Dev
% Outside Tolerance
CV
Average HARD
1.010 g/t Au
0.055 g/t Au sq
-5.04 %
4
4.30 %
0.14 %
4.78 %
CRM - Ordered Series
Sample ID
Lab
Valu
es
.2
.3
.4
.5
.6
.7
.8
.9
1
1.1
1.2
G984103 G984275 G269299 H239171 H242088 H242246 H244668 H244995 I384141 I822420
Upper Limit
Std + 5%
Std
Std - 5%
Lower Limit
Lab Value
CRM - Time Series
Return Date
Lab
Valu
es
.2
.3
.4
.5
.6
.7
.8
.9
1
1.1
1.2
04/12/2009 23/01/2010 14/03/2010 03/05/2010 22/06/2010 11/08/2010 30/09/2010
Upper Limit
Std + 5%
Std
Std - 5%
Lower Limit
Lab Value
HRD% Ordered Series
Sample No.
HR
D%
-60
-40
-20
0
20
40
60
0 10 20 30 40 50 60 70 80 90
Cumulative HARD Plot
Percentile
HA
RD
%
0
10
20
30
40
50
60
70
0 10 20 30 40 50 60 70 80 90 100
10% HARD
90%
RA
NK
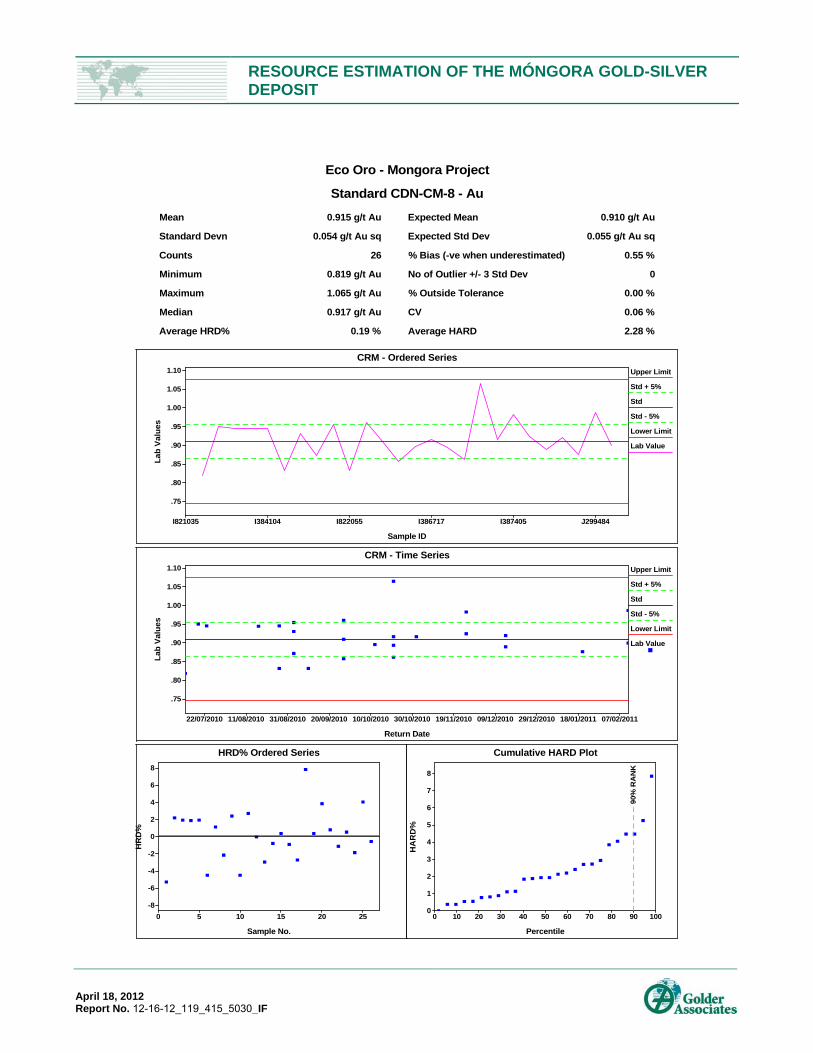
RESOURCE ESTIMATION OF THE MÓNGORA GOLD-SILVER DEPOSIT
April 18, 2012 Report No. 12-16-12_119_415_5030_IF
Eco Oro - Mongora Project
Standard CDN-CM-8 - Au
Mean
Standard Devn
Counts
Minimum
Maximum
Median
Average HRD%
0.915 g/t Au
0.054 g/t Au sq
26
0.819 g/t Au
1.065 g/t Au
0.917 g/t Au
0.19 %
Expected Mean
Expected Std Dev
% Bias (-ve when underestimated)
No of Outlier +/- 3 Std Dev
% Outside Tolerance
CV
Average HARD
0.910 g/t Au
0.055 g/t Au sq
0.55 %
0
0.00 %
0.06 %
2.28 %
CRM - Ordered Series
Sample ID
Lab
Valu
es
.75
.80
.85
.90
.95
1.00
1.05
1.10
I821035 I384104 I822055 I386717 I387405 J299484
Upper Limit
Std + 5%
Std
Std - 5%
Lower Limit
Lab Value
CRM - Time Series
Return Date
Lab
Valu
es
.75
.80
.85
.90
.95
1.00
1.05
1.10
22/07/2010 11/08/2010 31/08/2010 20/09/2010 10/10/2010 30/10/2010 19/11/2010 09/12/2010 29/12/2010 18/01/2011 07/02/2011
Upper Limit
Std + 5%
Std
Std - 5%
Lower Limit
Lab Value
HRD% Ordered Series
Sample No.
HR
D%
-8
-6
-4
-2
0
2
4
6
8
0 5 10 15 20 25
Cumulative HARD Plot
Percentile
HA
RD
%
0
1
2
3
4
5
6
7
8
0 10 20 30 40 50 60 70 80 90 100
90%
RA
NK

RESOURCE ESTIMATION OF THE MÓNGORA GOLD-SILVER DEPOSIT
April 18, 2012 Report No. 12-16-12_119_415_5030_IF
Eco Oro - Mongora Project
Standard CDN-GS-5C - Au
Mean
Standard Devn
Counts
Minimum
Maximum
Median
Average HRD%
4.609 g/t Au
0.239 g/t Au sq
51
4.120 g/t Au
5.280 g/t Au
4.630 g/t Au
-1.46 %
Expected Mean
Expected Std Dev
% Bias (-ve when underestimated)
No of Outlier +/- 3 Std Dev
% Outside Tolerance
CV
Average HARD
4.740 g/t Au
0.140 g/t Au sq
-2.76 %
8
15.69 %
0.05 %
2.33 %
CRM - Ordered Series
Sample ID
Lab
Valu
es
4.2
4.4
4.6
4.8
5
5.2
G964721 G964897 G273135 G273376 G271318 G271424 G273403 G268873 H244627 H245974 H245826
Upper Limit
Std + 5%
Std
Std - 5%
Lower Limit
Lab Value
CRM - Time Series
Return Date
Lab
Valu
es
4.2
4.4
4.6
4.8
5
5.2
10/09/2008 19/12/2008 29/03/2009 07/07/2009 15/10/2009 23/01/2010 03/05/2010
Upper Limit
Std + 5%
Std
Std - 5%
Lower Limit
Lab Value
HRD% Ordered Series
Sample No.
HR
D%
-6
-4
-2
0
2
4
6
0 5 10 15 20 25 30 35 40 45 50
Cumulative HARD Plot
Percentile
HA
RD
%
0
1
2
3
4
5
6
7
0 10 20 30 40 50 60 70 80 90 100
90%
RA
NK

RESOURCE ESTIMATION OF THE MÓNGORA GOLD-SILVER DEPOSIT
April 18, 2012 Report No. 12-16-12_119_415_5030_IF
Eco Oro - Mongora Project
Standard CDN-GS-5D - Au
Mean
Standard Devn
Counts
Minimum
Maximum
Median
Average HRD%
5.032 g/t Au
0.611 g/t Au sq
55
0.780 g/t Au
5.600 g/t Au
5.140 g/t Au
-0.88 %
Expected Mean
Expected Std Dev
% Bias (-ve when underestimated)
No of Outlier +/- 3 Std Dev
% Outside Tolerance
CV
Average HARD
5.060 g/t Au
0.125 g/t Au sq
-0.55 %
3
5.45 %
0.12 %
2.76 %
CRM - Ordered Series
Sample ID
Lab
Valu
es
.5
1
1.5
2
2.5
3
3.5
4
4.5
5
5.5
6
G878860 G878965 G268962 G984360 G984227 G269178 G971965 H239211 H239404 H240560 H240832 H245510
Upper Limit
Std + 5%
Std
Std - 5%
Lower Limit
Lab Value
CRM - Time Series
Return Date
Lab
Valu
es
.5
1
1.5
2
2.5
3
3.5
4
4.5
5
5.5
6
30/10/2008 19/12/2008 07/02/2009 29/03/2009 18/05/2009 07/07/2009 26/08/2009 15/10/2009 04/12/2009 23/01/2010 14/03/2010 03/05/2010
Upper Limit
Std + 5%
Std
Std - 5%
Lower Limit
Lab Value
HRD% Ordered Series
Sample No.
HR
D%
-80
-60
-40
-20
0
20
40
60
80
0 5 10 15 20 25 30 35 40 45 50 55
Cumulative HARD Plot
Percentile
HA
RD
%
0
10
20
30
40
50
60
70
80
0 10 20 30 40 50 60 70 80 90 100
10% HARD
90%
RA
NK
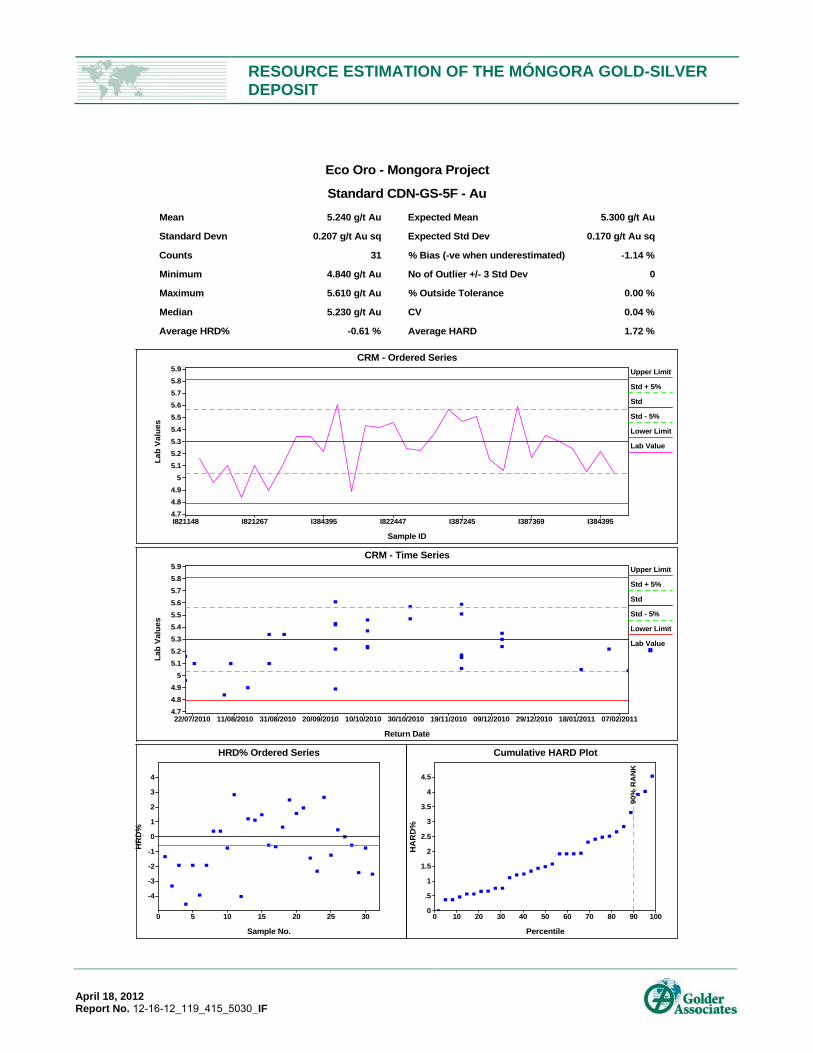
RESOURCE ESTIMATION OF THE MÓNGORA GOLD-SILVER DEPOSIT
April 18, 2012 Report No. 12-16-12_119_415_5030_IF
Eco Oro - Mongora Project
Standard CDN-GS-5F - Au
Mean
Standard Devn
Counts
Minimum
Maximum
Median
Average HRD%
5.240 g/t Au
0.207 g/t Au sq
31
4.840 g/t Au
5.610 g/t Au
5.230 g/t Au
-0.61 %
Expected Mean
Expected Std Dev
% Bias (-ve when underestimated)
No of Outlier +/- 3 Std Dev
% Outside Tolerance
CV
Average HARD
5.300 g/t Au
0.170 g/t Au sq
-1.14 %
0
0.00 %
0.04 %
1.72 %
CRM - Ordered Series
Sample ID
Lab
Valu
es
4.74.84.9
55.15.25.35.45.55.65.75.85.9
I821148 I821267 I384395 I822447 I387245 I387369 I384395
Upper Limit
Std + 5%
Std
Std - 5%
Lower Limit
Lab Value
CRM - Time Series
Return Date
Lab
Valu
es
4.74.84.9
55.15.25.35.45.55.65.75.85.9
22/07/2010 11/08/2010 31/08/2010 20/09/2010 10/10/2010 30/10/2010 19/11/2010 09/12/2010 29/12/2010 18/01/2011 07/02/2011
Upper Limit
Std + 5%
Std
Std - 5%
Lower Limit
Lab Value
HRD% Ordered Series
Sample No.
HR
D%
-4
-3
-2
-1
0
1
2
3
4
0 5 10 15 20 25 30
Cumulative HARD Plot
Percentile
HA
RD
%
0
.5
1
1.5
2
2.5
3
3.5
4
4.5
0 10 20 30 40 50 60 70 80 90 100
90%
RA
NK

RESOURCE ESTIMATION OF THE MÓNGORA GOLD-SILVER DEPOSIT
April 18, 2012 Report No. 12-16-12_119_415_5030_IF
Eco Oro - Mongora Project
Standard CDN-GS-8A - Au
Mean
Standard Devn
Counts
Minimum
Maximum
Median
Average HRD%
8.572 g/t Au
0.341 g/t Au sq
11
8.040 g/t Au
9.120 g/t Au
8.510 g/t Au
1.87 %
Expected Mean
Expected Std Dev
% Bias (-ve when underestimated)
No of Outlier +/- 3 Std Dev
% Outside Tolerance
CV
Average HARD
8.250 g/t Au
0.300 g/t Au sq
3.90 %
0
0.00 %
0.04 %
2.17 %
CRM - Ordered Series
Sample ID
Lab
Valu
es
7.2
7.4
7.6
7.8
8
8.2
8.4
8.6
8.8
9
9.2
I387171 I387171 I387319 I387431 I386836 J299104 I386982 J300536 J299333 J299365 J300680 J299412 J299412
Upper Limit
Std + 5%
Std
Std - 5%
Lower Limit
Lab Value
CRM - Time Series
Return Date
Lab
Valu
es
7.2
7.4
7.6
7.8
8
8.2
8.4
8.6
8.8
9
9.2
09/11/2010 19/11/2010 29/11/2010 09/12/2010 19/12/2010 29/12/2010 08/01/2011 18/01/2011 28/01/2011 07/02/2011 17/02/2011
Upper Limit
Std + 5%
Std
Std - 5%
Lower Limit
Lab Value
HRD% Ordered Series
Sample No.
HR
D%
-5
-4
-3
-2
-1
0
1
2
3
4
5
0 1 2 3 4 5 6 7 8 9 10 11 12
Cumulative HARD Plot
Percentile
HA
RD
%
0
.5
1
1.5
2
2.5
3
3.5
4
4.5
5
0 10 20 30 40 50 60 70 80 90 100
90%
RA
NK
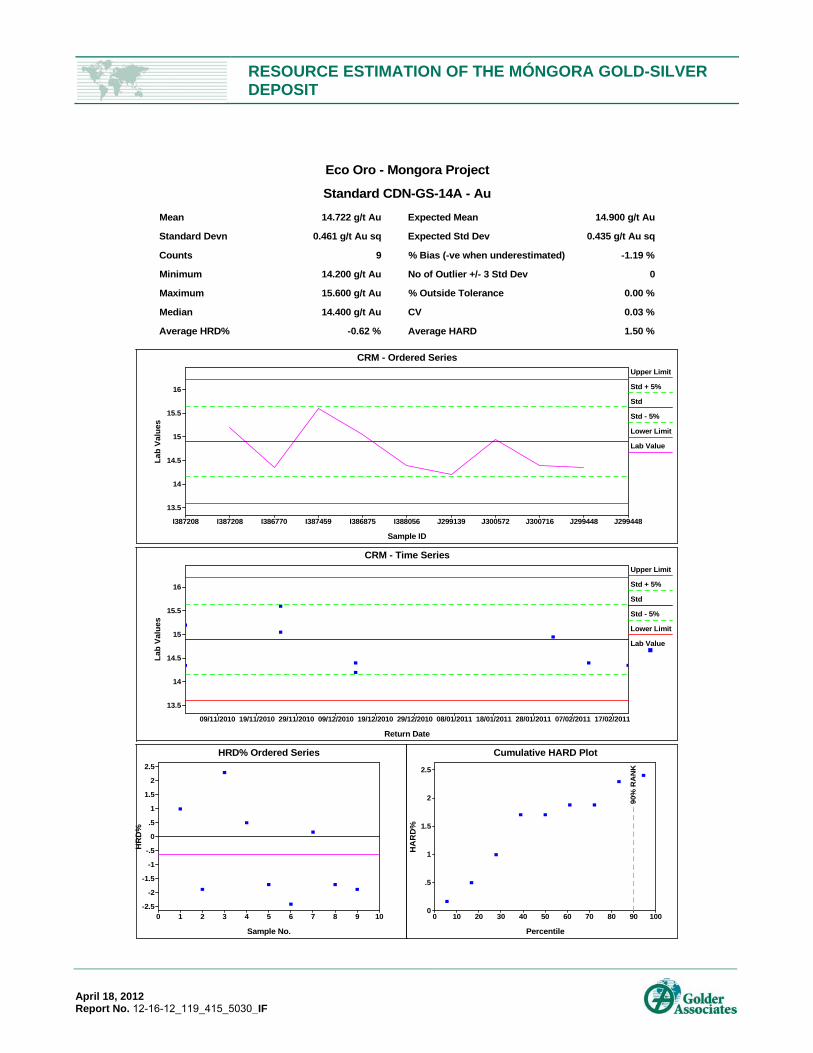
RESOURCE ESTIMATION OF THE MÓNGORA GOLD-SILVER DEPOSIT
April 18, 2012 Report No. 12-16-12_119_415_5030_IF
Eco Oro - Mongora Project
Standard CDN-GS-14A - Au
Mean
Standard Devn
Counts
Minimum
Maximum
Median
Average HRD%
14.722 g/t Au
0.461 g/t Au sq
9
14.200 g/t Au
15.600 g/t Au
14.400 g/t Au
-0.62 %
Expected Mean
Expected Std Dev
% Bias (-ve when underestimated)
No of Outlier +/- 3 Std Dev
% Outside Tolerance
CV
Average HARD
14.900 g/t Au
0.435 g/t Au sq
-1.19 %
0
0.00 %
0.03 %
1.50 %
CRM - Ordered Series
Sample ID
Lab
Valu
es
13.5
14
14.5
15
15.5
16
I387208 I387208 I386770 I387459 I386875 I388056 J299139 J300572 J300716 J299448 J299448
Upper Limit
Std + 5%
Std
Std - 5%
Lower Limit
Lab Value
CRM - Time Series
Return Date
Lab
Valu
es
13.5
14
14.5
15
15.5
16
09/11/2010 19/11/2010 29/11/2010 09/12/2010 19/12/2010 29/12/2010 08/01/2011 18/01/2011 28/01/2011 07/02/2011 17/02/2011
Upper Limit
Std + 5%
Std
Std - 5%
Lower Limit
Lab Value
HRD% Ordered Series
Sample No.
HR
D%
-2.5
-2
-1.5
-1
-.5
0
.5
1
1.5
2
2.5
0 1 2 3 4 5 6 7 8 9 10
Cumulative HARD Plot
Percentile
HA
RD
%
0
.5
1
1.5
2
2.5
0 10 20 30 40 50 60 70 80 90 100
90%
RA
NK
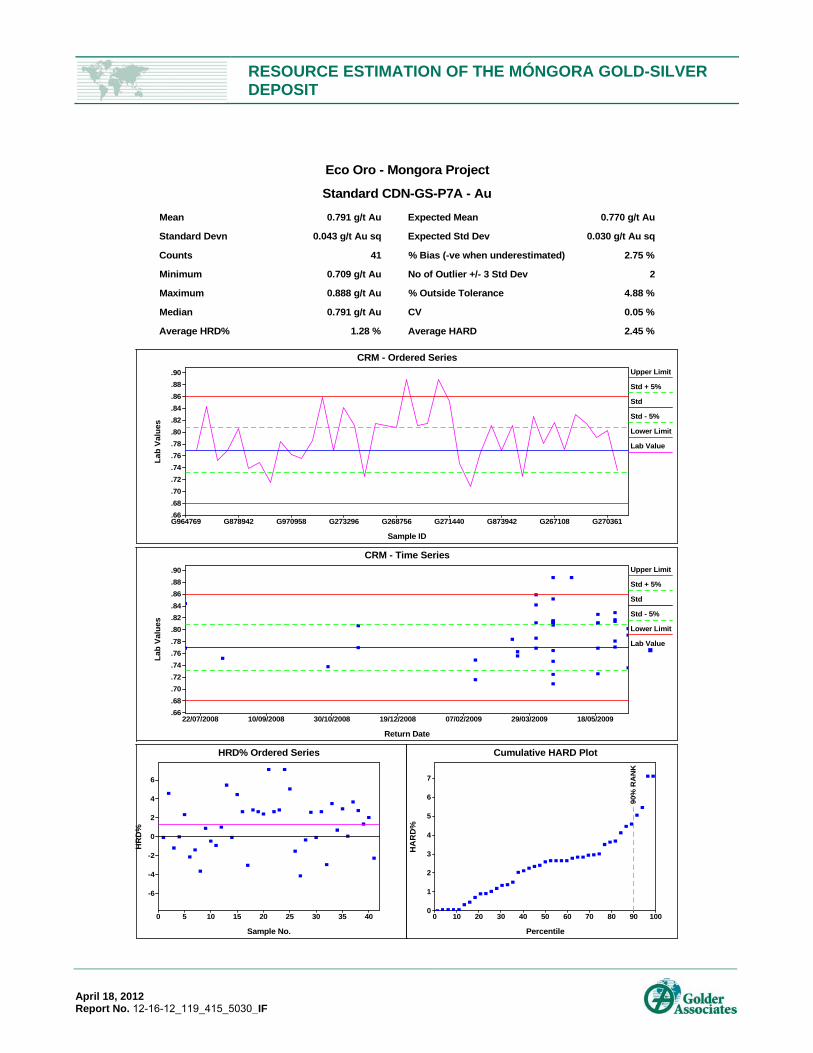
RESOURCE ESTIMATION OF THE MÓNGORA GOLD-SILVER DEPOSIT
April 18, 2012 Report No. 12-16-12_119_415_5030_IF
Eco Oro - Mongora Project
Standard CDN-GS-P7A - Au
Mean
Standard Devn
Counts
Minimum
Maximum
Median
Average HRD%
0.791 g/t Au
0.043 g/t Au sq
41
0.709 g/t Au
0.888 g/t Au
0.791 g/t Au
1.28 %
Expected Mean
Expected Std Dev
% Bias (-ve when underestimated)
No of Outlier +/- 3 Std Dev
% Outside Tolerance
CV
Average HARD
0.770 g/t Au
0.030 g/t Au sq
2.75 %
2
4.88 %
0.05 %
2.45 %
CRM - Ordered Series
Sample ID
Lab
Valu
es
.66
.68
.70
.72
.74
.76
.78
.80
.82
.84
.86
.88
.90
G964769 G878942 G970958 G273296 G268756 G271440 G873942 G267108 G270361
Upper Limit
Std + 5%
Std
Std - 5%
Lower Limit
Lab Value
CRM - Time Series
Return Date
Lab
Valu
es
.66
.68
.70
.72
.74
.76
.78
.80
.82
.84
.86
.88
.90
22/07/2008 10/09/2008 30/10/2008 19/12/2008 07/02/2009 29/03/2009 18/05/2009
Upper Limit
Std + 5%
Std
Std - 5%
Lower Limit
Lab Value
HRD% Ordered Series
Sample No.
HR
D%
-6
-4
-2
0
2
4
6
0 5 10 15 20 25 30 35 40
Cumulative HARD Plot
Percentile
HA
RD
%
0
1
2
3
4
5
6
7
0 10 20 30 40 50 60 70 80 90 100
90%
RA
NK
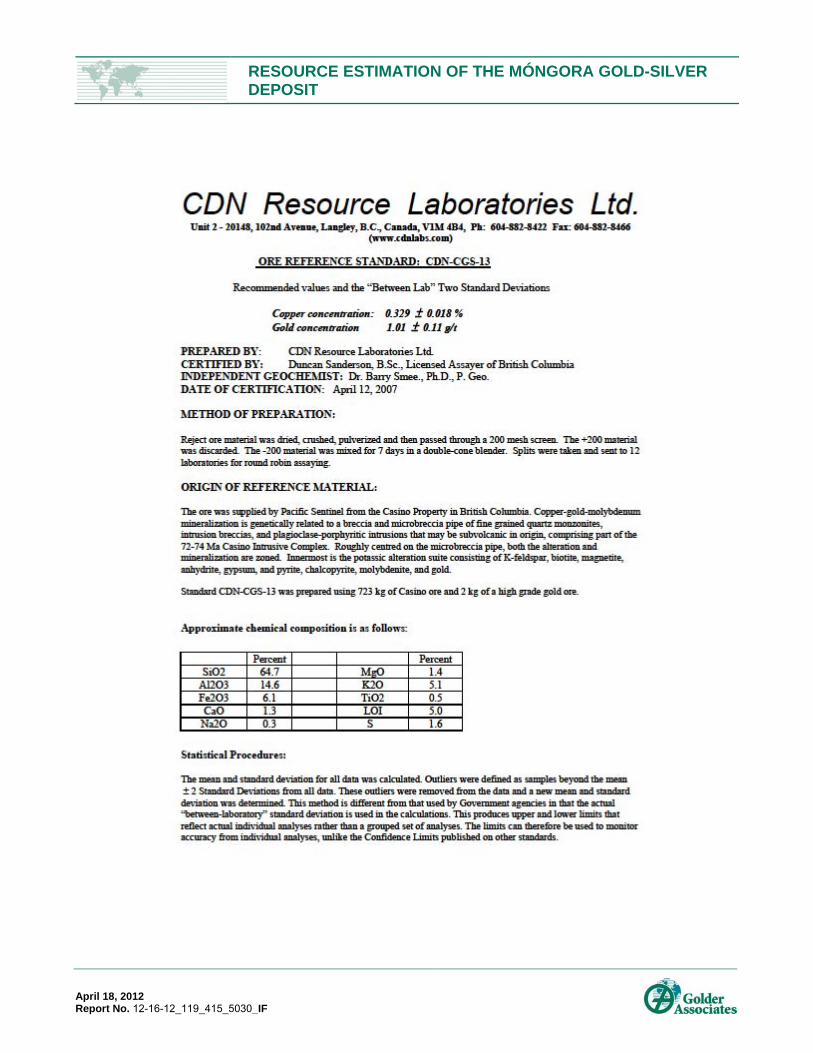
RESOURCE ESTIMATION OF THE MÓNGORA GOLD-SILVER DEPOSIT
April 18, 2012 Report No. 12-16-12_119_415_5030_IF

RESOURCE ESTIMATION OF THE MÓNGORA GOLD-SILVER DEPOSIT
April 18, 2012 Report No. 12-16-12_119_415_5030_IF

RESOURCE ESTIMATION OF THE MÓNGORA GOLD-SILVER DEPOSIT
April 18, 2012 Report No. 12-16-12_119_415_5030_IF
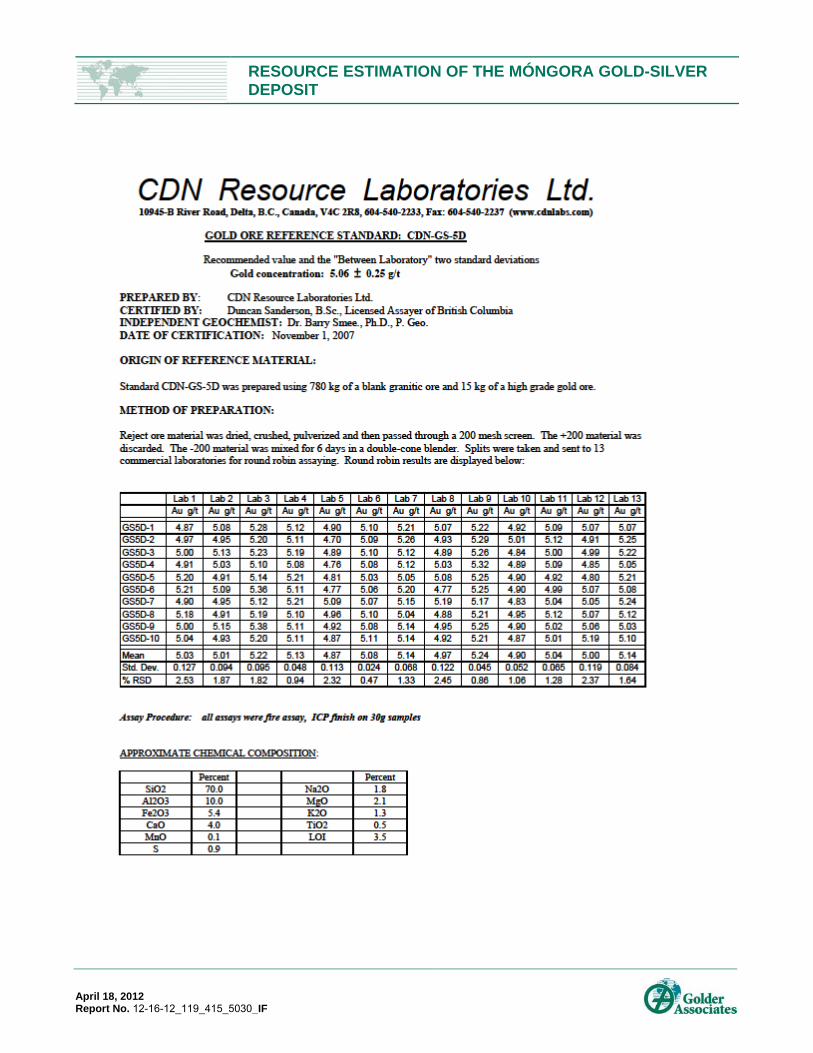
RESOURCE ESTIMATION OF THE MÓNGORA GOLD-SILVER DEPOSIT
April 18, 2012 Report No. 12-16-12_119_415_5030_IF
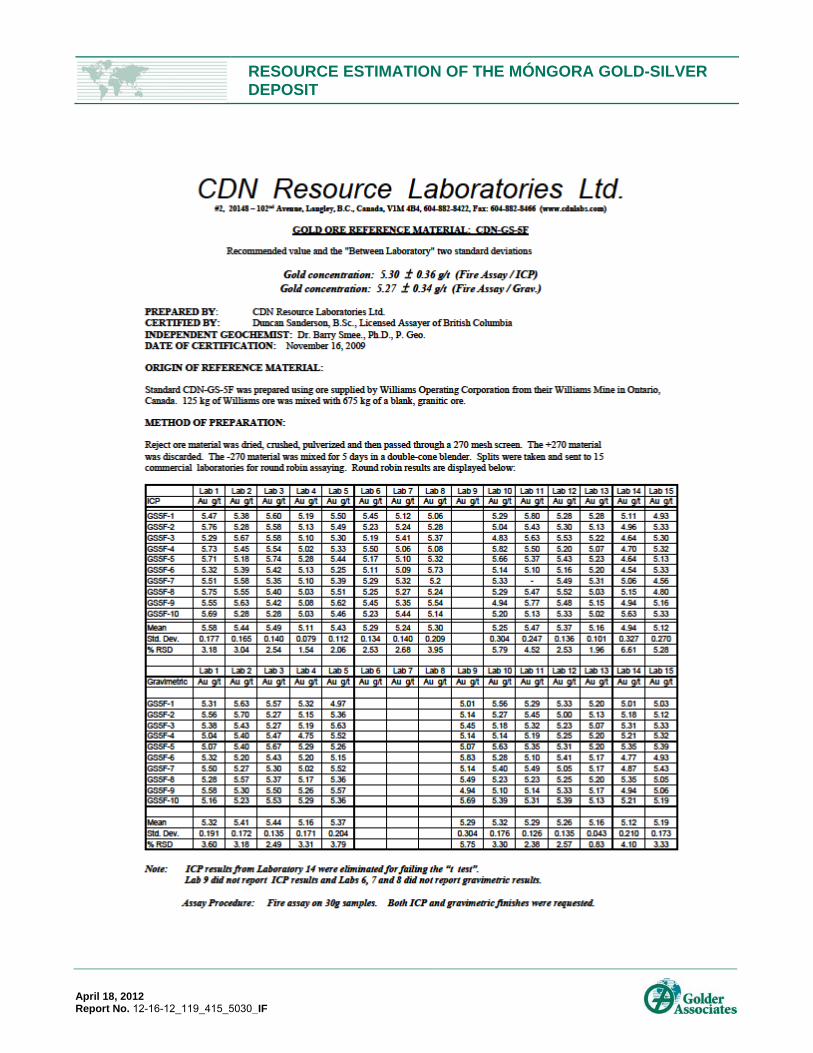
RESOURCE ESTIMATION OF THE MÓNGORA GOLD-SILVER DEPOSIT
April 18, 2012 Report No. 12-16-12_119_415_5030_IF

RESOURCE ESTIMATION OF THE MÓNGORA GOLD-SILVER DEPOSIT
April 18, 2012 Report No. 12-16-12_119_415_5030_IF
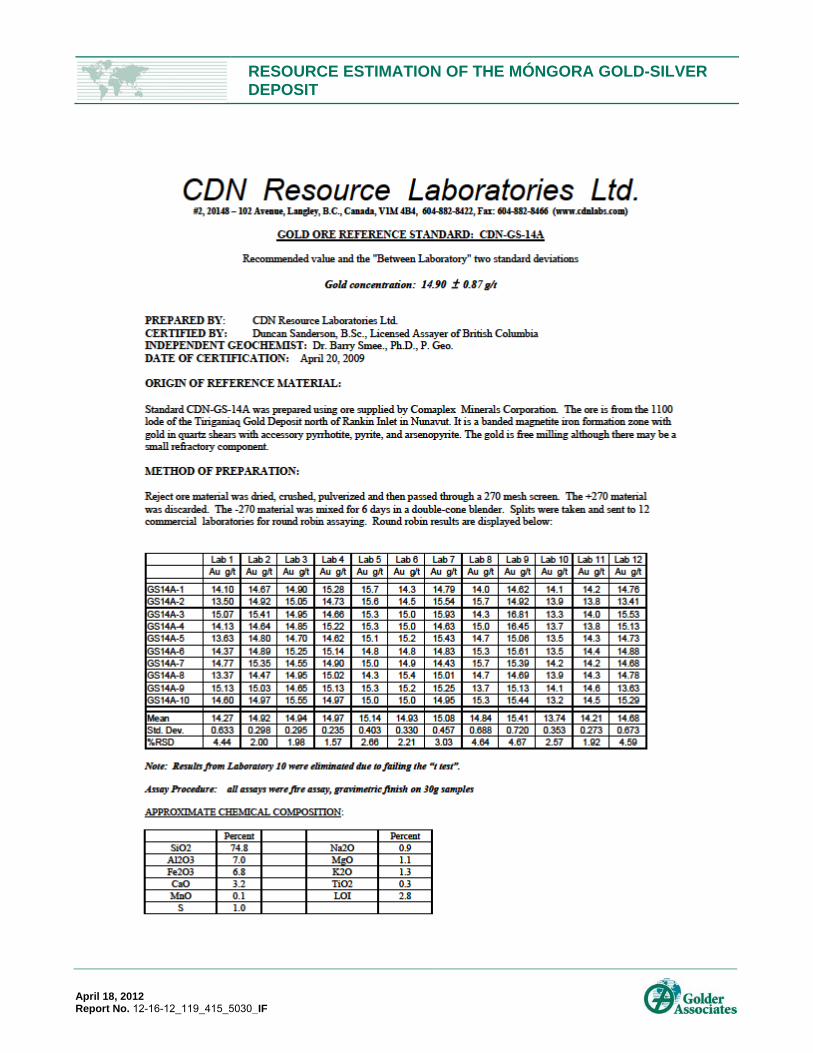
RESOURCE ESTIMATION OF THE MÓNGORA GOLD-SILVER DEPOSIT
April 18, 2012 Report No. 12-16-12_119_415_5030_IF

RESOURCE ESTIMATION OF THE MÓNGORA GOLD-SILVER DEPOSIT
April 18, 2012 Report No. 12-16-12_119_415_5030_IF
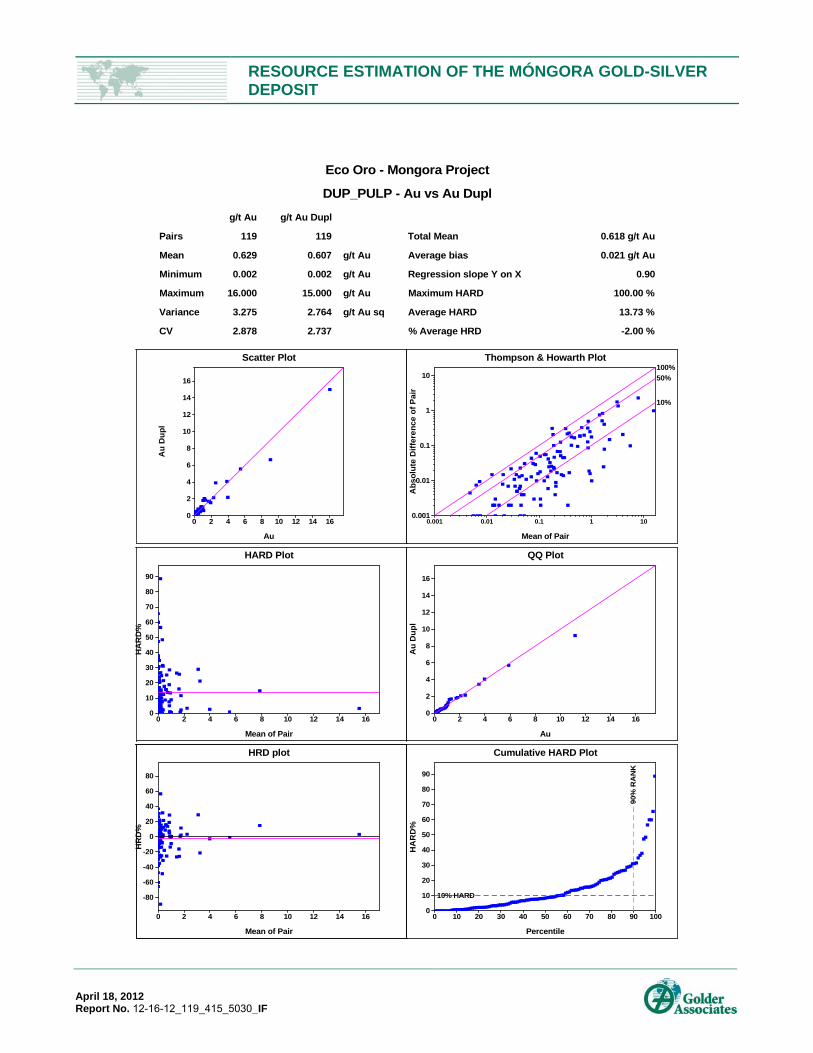
RESOURCE ESTIMATION OF THE MÓNGORA GOLD-SILVER DEPOSIT
April 18, 2012 Report No. 12-16-12_119_415_5030_IF
Eco Oro - Mongora Project
DUP_PULP - Au vs Au Dupl
Pairs
Mean
Minimum
Maximum
Variance
CV
g/t Au
119
0.629
0.002
16.000
3.275
2.878
g/t Au Dupl
119
0.607
0.002
15.000
2.764
2.737
g/t Au
g/t Au
g/t Au
g/t Au sq
Total Mean
Average bias
Regression slope Y on X
Maximum HARD
Average HARD
% Average HRD
0.618 g/t Au
0.021 g/t Au
0.90
100.00 %
13.73 %
-2.00 %
Scatter Plot
Au
Au
Dup
l
0
2
4
6
8
10
12
14
16
0 2 4 6 8 10 12 14 16
Thompson & Howarth Plot
Mean of Pair
Abs
olut
e D
iffer
ence
of P
air
0.001 0.01 0.1 1 100.001
0.01
0.1
1
10100%50%
10%
HARD Plot
Mean of Pair
HA
RD
%
0
10
20
30
40
50
60
70
80
90
0 2 4 6 8 10 12 14 16
QQ Plot
Au
Au
Dup
l
0
2
4
6
8
10
12
14
16
0 2 4 6 8 10 12 14 16
HRD plot
Mean of Pair
HR
D%
-80
-60
-40
-20
0
20
40
60
80
0 2 4 6 8 10 12 14 16
Cumulative HARD Plot
Percentile
HA
RD
%
0
10
20
30
40
50
60
70
80
90
0 10 20 30 40 50 60 70 80 90 100
10% HARD
90%
RA
NK
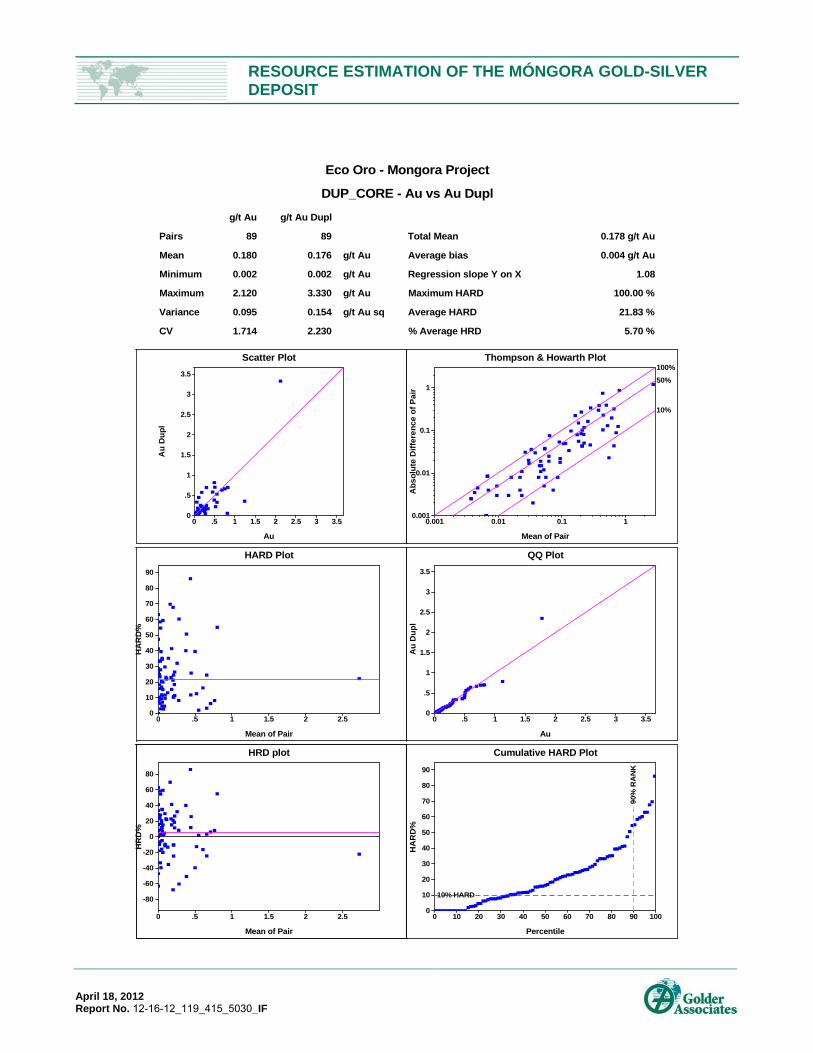
RESOURCE ESTIMATION OF THE MÓNGORA GOLD-SILVER DEPOSIT
April 18, 2012 Report No. 12-16-12_119_415_5030_IF
Eco Oro - Mongora Project
DUP_CORE - Au vs Au Dupl
Pairs
Mean
Minimum
Maximum
Variance
CV
g/t Au
89
0.180
0.002
2.120
0.095
1.714
g/t Au Dupl
89
0.176
0.002
3.330
0.154
2.230
g/t Au
g/t Au
g/t Au
g/t Au sq
Total Mean
Average bias
Regression slope Y on X
Maximum HARD
Average HARD
% Average HRD
0.178 g/t Au
0.004 g/t Au
1.08
100.00 %
21.83 %
5.70 %
Scatter Plot
Au
Au
Dup
l
0
.5
1
1.5
2
2.5
3
3.5
0 .5 1 1.5 2 2.5 3 3.5
Thompson & Howarth Plot
Mean of Pair
Abs
olut
e D
iffer
ence
of P
air
0.001 0.01 0.1 10.001
0.01
0.1
1
100%
50%
10%
HARD Plot
Mean of Pair
HA
RD
%
0
10
20
30
40
50
60
70
80
90
0 .5 1 1.5 2 2.5
QQ Plot
Au
Au
Dup
l
0
.5
1
1.5
2
2.5
3
3.5
0 .5 1 1.5 2 2.5 3 3.5
HRD plot
Mean of Pair
HR
D%
-80
-60
-40
-20
0
20
40
60
80
0 .5 1 1.5 2 2.5
Cumulative HARD Plot
Percentile
HA
RD
%
0
10
20
30
40
50
60
70
80
90
0 10 20 30 40 50 60 70 80 90 100
10% HARD
90%
RA
NK

RESOURCE ESTIMATION OF THE MÓNGORA GOLD-SILVER DEPOSIT
April 18, 2012 Report No. 12-16-12_119_415_5030_IF
APPENDIX C Exploratory Data Analysis

RESOURCE ESTIMATION OF THE MÓNGORA GOLD-SILVER DEPOSIT
April 18, 2012 Report No. 12-16-12_119_415_5030_IF
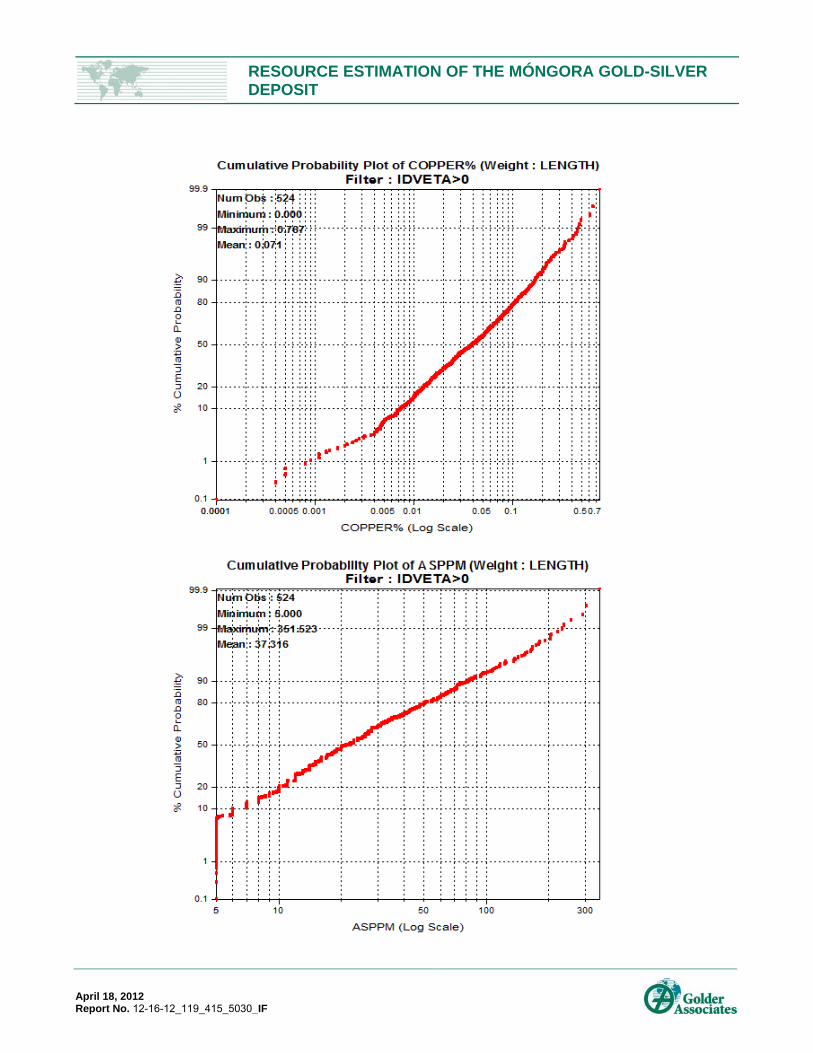
RESOURCE ESTIMATION OF THE MÓNGORA GOLD-SILVER DEPOSIT
April 18, 2012 Report No. 12-16-12_119_415_5030_IF

RESOURCE ESTIMATION OF THE MÓNGORA GOLD-SILVER DEPOSIT
April 18, 2012 Report No. 12-16-12_119_415_5030_IF

RESOURCE ESTIMATION OF THE MÓNGORA GOLD-SILVER DEPOSIT
April 18, 2012 Report No. 12-16-12_119_415_5030_IF
RESOURCE ESTIMATION OF THE MÓNGORA GOLD-SILVER DEPOSIT
April 18, 2012 Report No. 12-16-12_119_415_5030_IF
APPENDIX D Block Model Validation

RESOURCE ESTIMATION OF THE MÓNGORA GOLD-SILVER DEPOSIT
April 18, 2012 Report No. 12-16-12_119_415_5030_IF
Au (g/t) - Vein: 1
STATS No. Obs. Minimum Maximum Mean %Diff Std. Dev.
Composites 17 0.786 22.200 2.549 -0.3%
2.618
Blocks 5,714 0.786 22.200 2.542 2.419
Au (g/t) - Vein: 2
STATS No. Obs. Minimum Maximum Mean %Diff Std. Dev
Composites 12 0.655 6.876 3.092 -1.0%
2.074
Blocks 4,913 0.917 6.876 3.060 1.004
Au (g/t) - Vein: 3
STATS No. Obs. Minimum Maximum Mean %Diff Std. Dev
Composites 29 0.003 11.250 2.017 1.5%
1.735
Blocks 8,902 0.002 11.250 2.048 1.301
Au (g/t) - Vein: 4
STATS No. Obs. Minimum Maximum Mean %Diff Std. Dev
Composites 14 0.039 12.316 1.938 -0.9%
1.659
Blocks 4,928 0.056 12.316 1.920 1.379
Au (g/t) - Vein: 5
STATS No. Obs. Minimum Maximum Mean %Diff Std. Dev
Composites 14 0.025 8.110 1.284 -0.6%
1.233
Blocks 5,081 0.025 8.110 1.276 1.142
Au (g/t) - Vein: 6
STATS No. Obs. Minimum Maximum Mean %Diff Std. Dev
Composites 17 0.003 10.750 1.789 -14.7%
2.658
Blocks 5,594 0.002 10.750 1.526 1.949

RESOURCE ESTIMATION OF THE MÓNGORA GOLD-SILVER DEPOSIT
April 18, 2012 Report No. 12-16-12_119_415_5030_IF
Au (g/t) - Vein: 7
STATS No. Obs. Minimum Maximum Mean %Diff Std. Dev
Composites 26 0.011 18.600 2.306 2.5%
2.216
Blocks 8,521 0.011 18.600 2.363 1.829
Au (g/t) - Vein: 8
STATS No. Obs. Minimum Maximum Mean %Diff Std. Dev
Composites 15 0.186 6.790 1.917 -2.1%
1.594
Blocks 6,926 0.186 6.790 1.876 1.178
Au (g/t) - Vein: 9
STATS No. Obs. Minimum Maximum Mean %Diff Std. Dev
Composites 33 0.011 25.000 2.346 -0.9%
1.987
Blocks 14,052 0.011 25.000 2.325 1.636
Au (g/t) - Vein: 10
STATS No. Obs. Minimum Maximum Mean %Diff Std. Dev
Composites 16 0.017 9.010 1.786 -1.1%
1.097
Blocks 11,477 0.017 9.010 1.766 0.850
Au (g/t) - Vein: 11
STATS No. Obs. Minimum Maximum Mean %Diff Std. Dev
Composites 8 0.014 5.213 2.359 -2.1%
1.446
Blocks 5,362 0.014 5.213 2.309 1.039
Au (g/t) - Vein: 12
STATS No. Obs. Minimum Maximum Mean %Diff Std. Dev
Composites 14 0.056 2.960 1.389 0.7%
0.796
Blocks 5,722 0.056 2.960 1.398 0.489
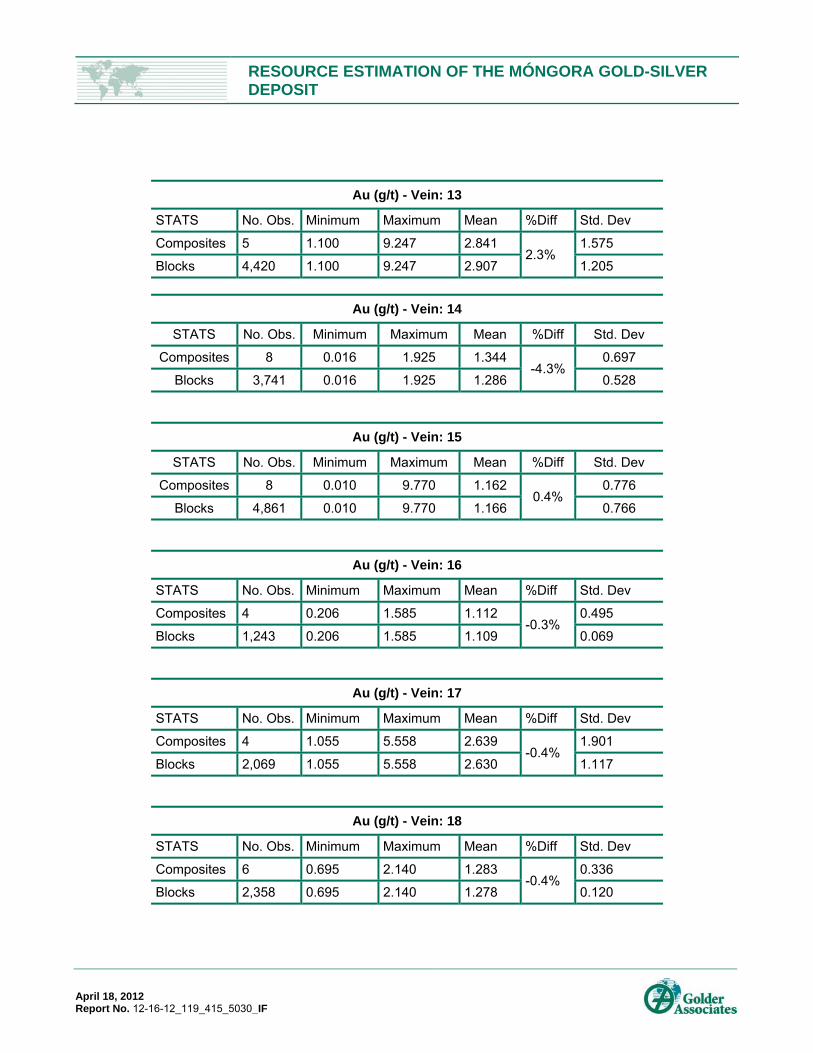
RESOURCE ESTIMATION OF THE MÓNGORA GOLD-SILVER DEPOSIT
April 18, 2012 Report No. 12-16-12_119_415_5030_IF
Au (g/t) - Vein: 13
STATS No. Obs. Minimum Maximum Mean %Diff Std. Dev
Composites 5 1.100 9.247 2.841 2.3%
1.575
Blocks 4,420 1.100 9.247 2.907 1.205
Au (g/t) - Vein: 14
STATS No. Obs. Minimum Maximum Mean %Diff Std. Dev
Composites 8 0.016 1.925 1.344 -4.3%
0.697
Blocks 3,741 0.016 1.925 1.286 0.528
Au (g/t) - Vein: 15
STATS No. Obs. Minimum Maximum Mean %Diff Std. Dev
Composites 8 0.010 9.770 1.162 0.4%
0.776
Blocks 4,861 0.010 9.770 1.166 0.766
Au (g/t) - Vein: 16
STATS No. Obs. Minimum Maximum Mean %Diff Std. Dev
Composites 4 0.206 1.585 1.112 -0.3%
0.495
Blocks 1,243 0.206 1.585 1.109 0.069
Au (g/t) - Vein: 17
STATS No. Obs. Minimum Maximum Mean %Diff Std. Dev
Composites 4 1.055 5.558 2.639 -0.4%
1.901
Blocks 2,069 1.055 5.558 2.630 1.117
Au (g/t) - Vein: 18
STATS No. Obs. Minimum Maximum Mean %Diff Std. Dev
Composites 6 0.695 2.140 1.283 -0.4%
0.336
Blocks 2,358 0.695 2.140 1.278 0.120
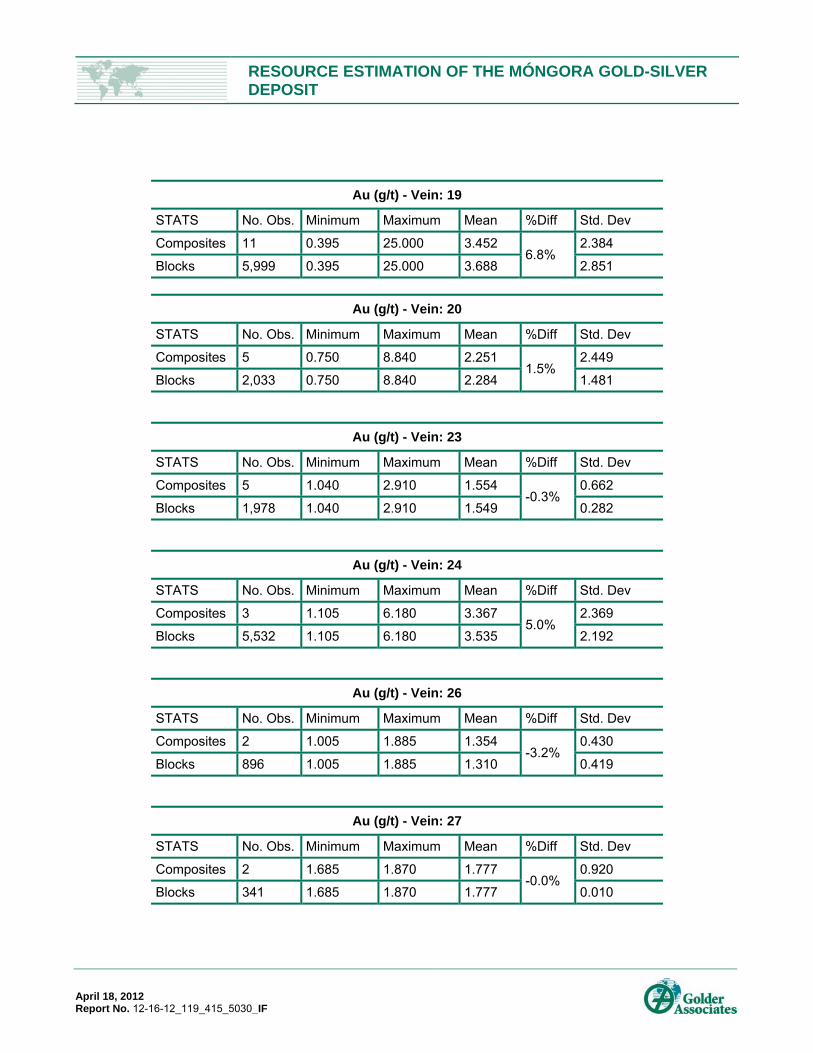
RESOURCE ESTIMATION OF THE MÓNGORA GOLD-SILVER DEPOSIT
April 18, 2012 Report No. 12-16-12_119_415_5030_IF
Au (g/t) - Vein: 19
STATS No. Obs. Minimum Maximum Mean %Diff Std. Dev
Composites 11 0.395 25.000 3.452 6.8%
2.384
Blocks 5,999 0.395 25.000 3.688 2.851
Au (g/t) - Vein: 20
STATS No. Obs. Minimum Maximum Mean %Diff Std. Dev
Composites 5 0.750 8.840 2.251 1.5%
2.449
Blocks 2,033 0.750 8.840 2.284 1.481
Au (g/t) - Vein: 23
STATS No. Obs. Minimum Maximum Mean %Diff Std. Dev
Composites 5 1.040 2.910 1.554 -0.3%
0.662
Blocks 1,978 1.040 2.910 1.549 0.282
Au (g/t) - Vein: 24
STATS No. Obs. Minimum Maximum Mean %Diff Std. Dev
Composites 3 1.105 6.180 3.367 5.0%
2.369
Blocks 5,532 1.105 6.180 3.535 2.192
Au (g/t) - Vein: 26
STATS No. Obs. Minimum Maximum Mean %Diff Std. Dev
Composites 2 1.005 1.885 1.354 -3.2%
0.430
Blocks 896 1.005 1.885 1.310 0.419
Au (g/t) - Vein: 27
STATS No. Obs. Minimum Maximum Mean %Diff Std. Dev
Composites 2 1.685 1.870 1.777 -0.0%
0.920
Blocks 341 1.685 1.870 1.777 0.010

RESOURCE ESTIMATION OF THE MÓNGORA GOLD-SILVER DEPOSIT
April 18, 2012 Report No. 12-16-12_119_415_5030_IF
Au (g/t) - Vein: 28
STATS No. Obs. Minimum Maximum Mean %Diff Std. Dev
Composites 3 0.197 1.400 1.032 -0.5%
0.511
Blocks 454 0.197 1.400 1.027 0.069
Au (g/t) - Vein: 30
STATS No. Obs. Minimum Maximum Mean %Diff Std. Dev
Composites 5 1.065 3.570 1.978 -1.3%
0.720
Blocks 5,220 1.065 3.570 1.952 0.603
Au (g/t) - Vein: 31
STATS No. Obs. Minimum Maximum Mean %Diff Std. Dev
Composites 4 1.200 10.650 2.272 -9.5%
1.491
Blocks 2,592 1.200 10.650 2.055 1.355
Au (g/t) - Vein: 32
STATS No. Obs. Minimum Maximum Mean %Diff Std. Dev
Composites 5 0.057 4.140 1.666 3.2%
1.421
Blocks 3,049 0.057 4.140 1.719 1.372
Au (g/t) - Vein: 33
STATS No. Obs. Minimum Maximum Mean %Diff Std. Dev
Composites 6 0.020 2.354 1.061 -1.6%
0.896
Blocks 3,971 0.020 2.354 1.044 0.797
Au (g/t) - Vein: 35
STATS No. Obs. Minimum Maximum Mean %Diff Std. Dev
Composites 4 0.051 1.780 0.746 -0.5%
0.695
Blocks 1,965 0.051 1.780 0.742 0.146
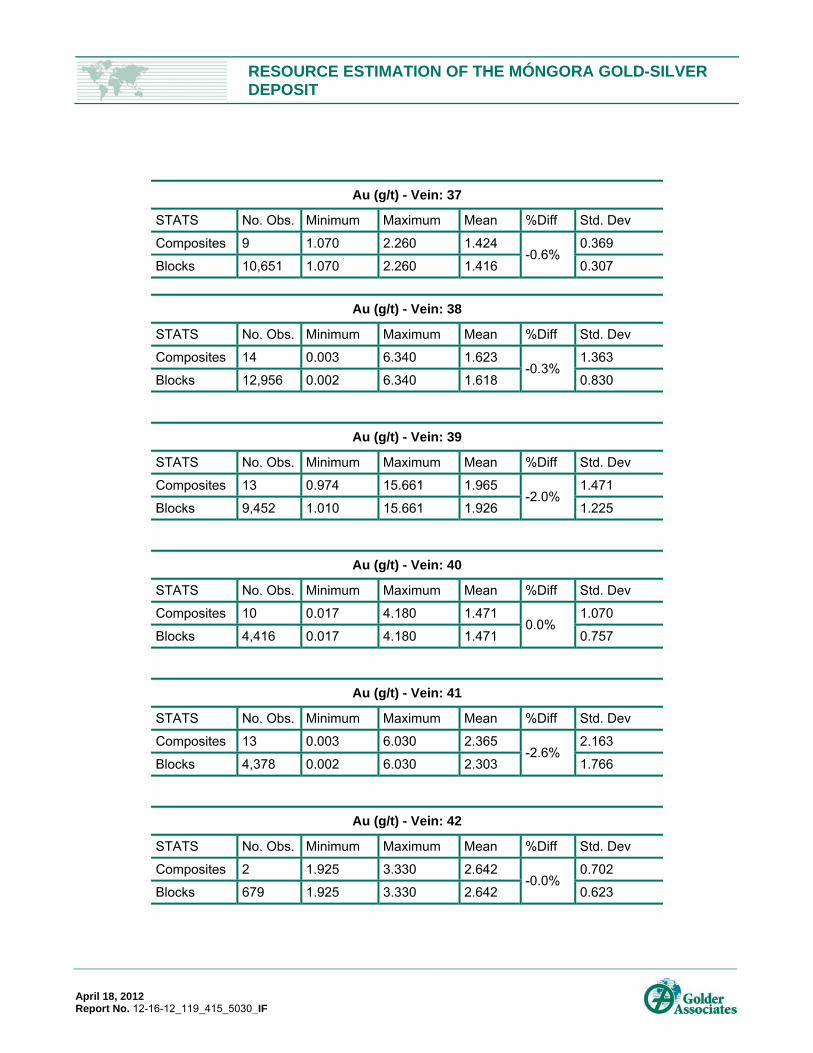
RESOURCE ESTIMATION OF THE MÓNGORA GOLD-SILVER DEPOSIT
April 18, 2012 Report No. 12-16-12_119_415_5030_IF
Au (g/t) - Vein: 37
STATS No. Obs. Minimum Maximum Mean %Diff Std. Dev
Composites 9 1.070 2.260 1.424 -0.6%
0.369
Blocks 10,651 1.070 2.260 1.416 0.307
Au (g/t) - Vein: 38
STATS No. Obs. Minimum Maximum Mean %Diff Std. Dev
Composites 14 0.003 6.340 1.623 -0.3%
1.363
Blocks 12,956 0.002 6.340 1.618 0.830
Au (g/t) - Vein: 39
STATS No. Obs. Minimum Maximum Mean %Diff Std. Dev
Composites 13 0.974 15.661 1.965 -2.0%
1.471
Blocks 9,452 1.010 15.661 1.926 1.225
Au (g/t) - Vein: 40
STATS No. Obs. Minimum Maximum Mean %Diff Std. Dev
Composites 10 0.017 4.180 1.471 0.0%
1.070
Blocks 4,416 0.017 4.180 1.471 0.757
Au (g/t) - Vein: 41
STATS No. Obs. Minimum Maximum Mean %Diff Std. Dev
Composites 13 0.003 6.030 2.365 -2.6%
2.163
Blocks 4,378 0.002 6.030 2.303 1.766
Au (g/t) - Vein: 42
STATS No. Obs. Minimum Maximum Mean %Diff Std. Dev
Composites 2 1.925 3.330 2.642 -0.0%
0.702
Blocks 679 1.925 3.330 2.642 0.623

RESOURCE ESTIMATION OF THE MÓNGORA GOLD-SILVER DEPOSIT
April 18, 2012 Report No. 12-16-12_119_415_5030_IF
Au (g/t) - Vein: 43
STATS No. Obs. Minimum Maximum Mean %Diff Std. Dev
Composites 3 0.016 6.120 4.007 -1.6%
2.466
Blocks 1,537 0.016 6.120 3.941 1.793
Au (g/t) - Vein: 44
STATS No. Obs. Minimum Maximum Mean %Diff Std. Dev
Composites 9 0.007 3.960 1.876 -0.8%
1.416
Blocks 6,987 0.007 3.960 1.861 1.090
Au (g/t) - Vein: 45
STATS No. Obs. Minimum Maximum Mean %Diff Std. Dev
Composites 2 1.485 1.485 1.485 0.0%
0.000
Blocks 2,406 1.485 1.485 1.485 0.000
Au (g/t) - Vein: 46
STATS No. Obs. Minimum Maximum Mean %Diff Std. Dev
Composites 2 0.275 1.325 0.824 -0.8%
0.525
Blocks 1,356 0.275 1.325 0.817 0.136
Au (g/t) - Vein: 52
STATS No. Obs. Minimum Maximum Mean %Diff Std. Dev
Composites 6 0.027 6.500 2.335 2.9%
1.771
Blocks 1,415 0.027 6.500 2.402 0.581
Au (g/t) - Vein: 53
STATS No. Obs. Minimum Maximum Mean %Diff Std. Dev
Composites 3 6.088 20.753 6.814 1.4%
2.929
Blocks 410 6.088 16.017 6.912 2.248
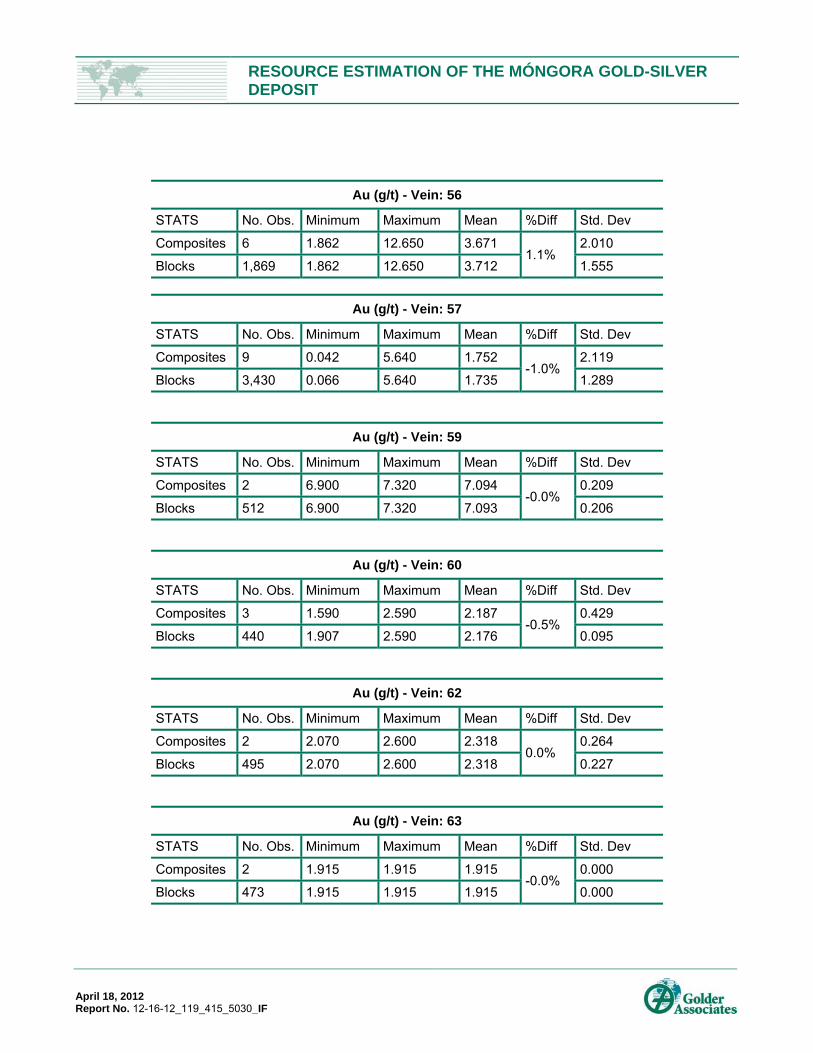
RESOURCE ESTIMATION OF THE MÓNGORA GOLD-SILVER DEPOSIT
April 18, 2012 Report No. 12-16-12_119_415_5030_IF
Au (g/t) - Vein: 56
STATS No. Obs. Minimum Maximum Mean %Diff Std. Dev
Composites 6 1.862 12.650 3.671 1.1%
2.010
Blocks 1,869 1.862 12.650 3.712 1.555
Au (g/t) - Vein: 57
STATS No. Obs. Minimum Maximum Mean %Diff Std. Dev
Composites 9 0.042 5.640 1.752 -1.0%
2.119
Blocks 3,430 0.066 5.640 1.735 1.289
Au (g/t) - Vein: 59
STATS No. Obs. Minimum Maximum Mean %Diff Std. Dev
Composites 2 6.900 7.320 7.094 -0.0%
0.209
Blocks 512 6.900 7.320 7.093 0.206
Au (g/t) - Vein: 60
STATS No. Obs. Minimum Maximum Mean %Diff Std. Dev
Composites 3 1.590 2.590 2.187 -0.5%
0.429
Blocks 440 1.907 2.590 2.176 0.095
Au (g/t) - Vein: 62
STATS No. Obs. Minimum Maximum Mean %Diff Std. Dev
Composites 2 2.070 2.600 2.318 0.0%
0.264
Blocks 495 2.070 2.600 2.318 0.227
Au (g/t) - Vein: 63
STATS No. Obs. Minimum Maximum Mean %Diff Std. Dev
Composites 2 1.915 1.915 1.915 -0.0%
0.000
Blocks 473 1.915 1.915 1.915 0.000

RESOURCE ESTIMATION OF THE MÓNGORA GOLD-SILVER DEPOSIT
April 18, 2012 Report No. 12-16-12_119_415_5030_IF
Au (g/t) - Vein: 64
STATS No. Obs. Minimum Maximum Mean %Diff Std. Dev
Composites 7 0.427 3.400 2.094 -0.7%
0.999
Blocks 946 0.862 3.400 2.080 0.519
Au (g/t) - Vein: 65
STATS No. Obs. Minimum Maximum Mean %Diff Std. Dev
Composites 3 1.385 5.570 3.696 0.7%
1.815
Blocks 635 1.385 5.570 3.720 0.320
Au (g/t) - Vein: 66
STATS No. Obs. Minimum Maximum Mean %Diff Std. Dev
Composites 2 4.830 4.830 4.830 -0.0%
0.000
Blocks 418 4.830 4.830 4.830 0.000
Au (g/t) - Vein: 67
STATS No. Obs. Minimum Maximum Mean %Diff Std. Dev
Composites 3 0.053 2.160 1.351 -5.0%
0.879
Blocks 660 0.053 2.160 1.283 0.593
Au (g/t) - Vein: 68
STATS No. Obs. Minimum Maximum Mean %Diff Std. Dev
Composites 3 5.540 5.920 5.784 0.3%
0.182
Blocks 2,264 5.540 5.920 5.799 0.172
Au (g/t) - Vein: 71
STATS No. Obs. Minimum Maximum Mean %Diff Std. Dev
Composites 3 1.095 1.485 1.358 -0.1%
0.161
Blocks 1,070 1.095 1.485 1.356 0.125

RESOURCE ESTIMATION OF THE MÓNGORA GOLD-SILVER DEPOSIT
April 18, 2012 Report No. 12-16-12_119_415_5030_IF
Au (g/t) - Vein: 72
STATS No. Obs. Minimum Maximum Mean %Diff Std. Dev
Composites 2 1.100 2.220 1.599 -0.1%
0.557
Blocks 718 1.100 2.220 1.597 0.486
Au (g/t) - Vein: 73
STATS No. Obs. Minimum Maximum Mean %Diff Std. Dev
Composites 5 0.930 2.990 1.826 5.4%
0.550
Blocks 786 0.930 2.990 1.925 0.116
Au (g/t) - Vein: 74
STATS No. Obs. Minimum Maximum Mean %Diff Std. Dev
Composites 4 0.652 8.530 2.157 3.4%
1.443
Blocks 670 0.652 8.530 2.231 1.308
Au (g/t) - Vein: 75
STATS No. Obs. Minimum Maximum Mean %Diff Std. Dev
Composites 2 2.6200 2.840 2.730 -0.0%
0.110
Blocks 539 2.620 2.840 2.730 0.016
Au (g/t) - Vein: 76
STATS No. Obs. Minimum Maximum Mean %Diff Std. Dev
Composites 9 0.105 2.998 1.453 0.6%
1.223
Blocks 950 0.105 2.998 1.462 0.451
Au (g/t) - Vein: 77
STATS No. Obs. Minimum Maximum Mean %Diff Std. Dev
Composites 4 0.445 14.600 2.330 1.2%
2.315
Blocks 677 0.445 14.600 2.359 1.133
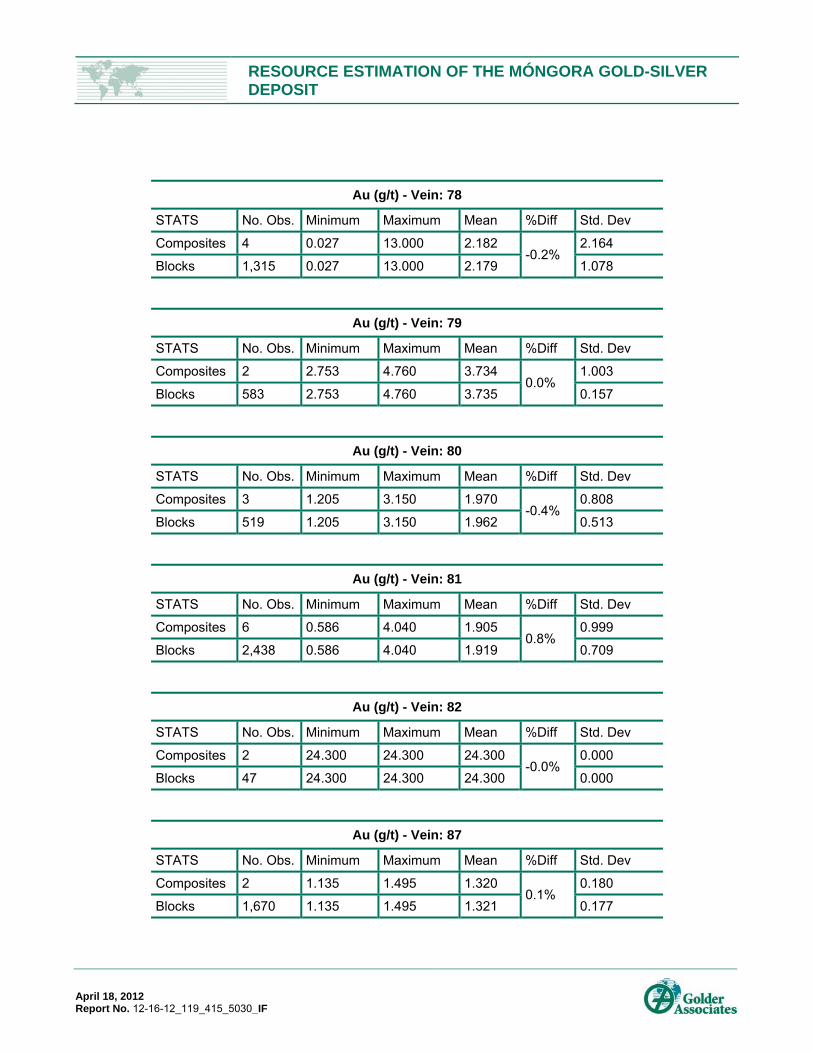
RESOURCE ESTIMATION OF THE MÓNGORA GOLD-SILVER DEPOSIT
April 18, 2012 Report No. 12-16-12_119_415_5030_IF
Au (g/t) - Vein: 78
STATS No. Obs. Minimum Maximum Mean %Diff Std. Dev
Composites 4 0.027 13.000 2.182 -0.2%
2.164
Blocks 1,315 0.027 13.000 2.179 1.078
Au (g/t) - Vein: 79
STATS No. Obs. Minimum Maximum Mean %Diff Std. Dev
Composites 2 2.753 4.760 3.734 0.0%
1.003
Blocks 583 2.753 4.760 3.735 0.157
Au (g/t) - Vein: 80
STATS No. Obs. Minimum Maximum Mean %Diff Std. Dev
Composites 3 1.205 3.150 1.970 -0.4%
0.808
Blocks 519 1.205 3.150 1.962 0.513
Au (g/t) - Vein: 81
STATS No. Obs. Minimum Maximum Mean %Diff Std. Dev
Composites 6 0.586 4.040 1.905 0.8%
0.999
Blocks 2,438 0.586 4.040 1.919 0.709
Au (g/t) - Vein: 82
STATS No. Obs. Minimum Maximum Mean %Diff Std. Dev
Composites 2 24.300 24.300 24.300 -0.0%
0.000
Blocks 47 24.300 24.300 24.300 0.000
Au (g/t) - Vein: 87
STATS No. Obs. Minimum Maximum Mean %Diff Std. Dev
Composites 2 1.135 1.495 1.320 0.1%
0.180
Blocks 1,670 1.135 1.495 1.321 0.177
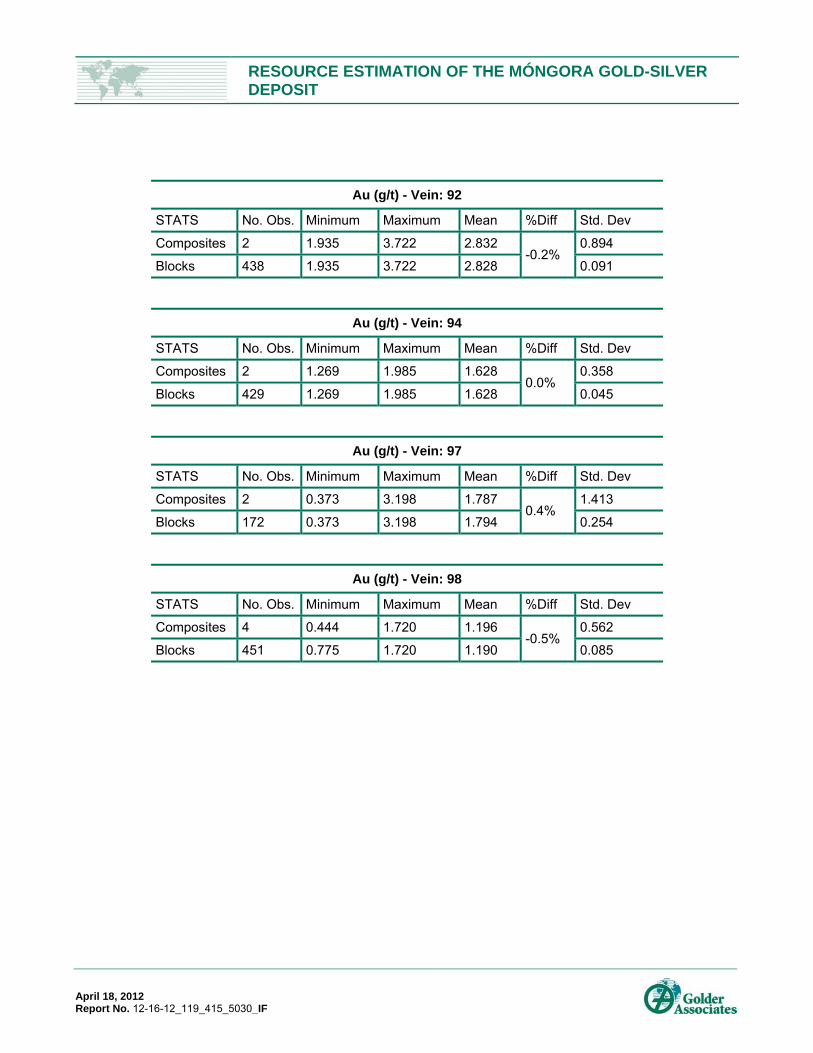
RESOURCE ESTIMATION OF THE MÓNGORA GOLD-SILVER DEPOSIT
April 18, 2012 Report No. 12-16-12_119_415_5030_IF
Au (g/t) - Vein: 92
STATS No. Obs. Minimum Maximum Mean %Diff Std. Dev
Composites 2 1.935 3.722 2.832 -0.2%
0.894
Blocks 438 1.935 3.722 2.828 0.091
Au (g/t) - Vein: 94
STATS No. Obs. Minimum Maximum Mean %Diff Std. Dev
Composites 2 1.269 1.985 1.628 0.0%
0.358
Blocks 429 1.269 1.985 1.628 0.045
Au (g/t) - Vein: 97
STATS No. Obs. Minimum Maximum Mean %Diff Std. Dev
Composites 2 0.373 3.198 1.787 0.4%
1.413
Blocks 172 0.373 3.198 1.794 0.254
Au (g/t) - Vein: 98
STATS No. Obs. Minimum Maximum Mean %Diff Std. Dev
Composites 4 0.444 1.720 1.196 -0.5%
0.562
Blocks 451 0.775 1.720 1.190 0.085
Golder Associates Perú S.A. Edificio Miracorp. Av. La Paz 1049 Piso 7, Miraflores Lima 18 Perú T: +51 (1) 610 1700