resource generation limited annual report · pdf file · 2015-10-02resource...
TRANSCRIPT

Resource Generation LimitedAnnual Report 2015
Reso
urce Generatio
n Limited
Annual R
eport 2015

Once the remaining funding for mine construction is in place, it’s a matter of time, right place for the successful development of the massive open-cut Boikarabelo mine.
Contents
AGM details IFC
Operations review 1
Financial report 7
Corporate directory IBC
Annual General Meeting
The Annual General Meeting of the Company will be held on Wednesday, 4 November 2015 at 10.00am at Sofitel Wentworth Hotel, 61-101 Phillip Street, Sydney.

Resource Generation is on track to deliver a
massive low cost, open cut coal mine in South Africa.
million tonnes of probable coal reserve.
744.8
MEDUPI(UNDER CONSTRUCTION)
MATIMBA
RAIL HEAD
WATERBERGCOAL FIELD
ZOETFONTEIN FAULT
BOTSWANA
BoikarabeloMine
1
Resource Generation Limited Annual Report 2015
With power consumption in South Africa forecast to exceed supply in approximately three years, it’s a matter of time until there is demand for the first shipments of coal to leave our massive Boikarabelo mine in the country’s Waterberg region.
Boikarabelo – which means ‘to be responsible’ in the local dialect – will be a world-class, low-cost, open cut mine. There are probable reserves of 744.8 million tonnes of coal, beginning 20 metres below the surface, on 35% of the tenements we control, and the mine’s potential has been confirmed by contracts to supply almost all its production for its first seven years, and a significant proportion for the following 30 years, to export and domestic customers.
It’s a matter of time

Operational Readiness... a detailed
plan has been advanced, including recruitment,
training and commissioning of initial mining equipment.
person construction camp expansion.
1,320 Approvals...
all regulatory hurdles have been overcome, all
necessary land purchased and rail and port access
contracts sufficient for stage 1 now acquired.
Stage 1 target
Reserve is based on only
of company controlled tenements
35%
million tonnes of saleable coalproduction per annum.
6
2
Coal sales contracts
Stage 1 (saleable production: 6 mtpa)
Stage 2 (saleable production: up to 25 mtpa)
Years 1 – 3 4 – 7 8 9 – 12 13 – 14 15 – 20 21 – 35 36 – 38
CESC 1.0 2.0 4.0 4.0 4.0 4.0 4.0 4.0
Noble 0.5 0.5 0.5 1.5 2.0 2.5 2.5 –
Valu 1.0 1.0 2.0 2.0 2.0 2.0 – –
Total export 2.5 3.5 6.5 7.5 8.0 8.5 6.5 4.0
Domestic 3.0 3.0 3.0 – – – – –
Total 5.5 6.5 9.5 7.5 8.0 8.5 6.5 4.0
Economic importance to South Africa
The value of Boikarabelo and its economic importance to South Africa have been endorsed by the acquisition of 19.5% of Resource Generation’s issued share capital by Public Investment Corporation SOC Limited (PIC), one of Africa’s largest investment managers with assets of over R1.6 trillion ($170 billion). PIC is wholly owned by the South African government and invests funds on behalf of the country’s public sector entities, including the Government Employees Pension Fund.
Another significant South African shareholder is Altius Investment Holdings (Pty) Limited. Altius is a new generation black economic empowerment investment holding company focused on commodity businesses that have the potential to benefit the national economy.
Importantly, we have established strong links with local communities, whose goodwill will be essential to Boikarabelo’s success, and we have supportive partners in our BEE (black economic empowerment) operating subsidiary Ledjadja Coal (Pty) Limited.

Operational Readiness... a detailed
plan has been advanced, including recruitment,
training and commissioning of initial mining equipment.
person construction camp expansion.
1,320 Approvals...
all regulatory hurdles have been overcome, all
necessary land purchased and rail and port access
contracts sufficient for stage 1 now acquired.
Stage 1 target
Reserve is based on only
of company controlled tenements
35%
million tonnes of saleable coalproduction per annum.
6
3
Resource Generation Limited Annual Report 2015
Planning the first production
In the seven years since we identified the potential of the Waterberg region, which accounts for 40% of South Africa’s remaining coal resources, all necessary land for the mine and its infrastructure has been acquired, all regulatory consents have been received, and rail haulage and port access contracts for the mine’s first seven years’ production have been signed.
Where there was bush veldt, today there is a construction camp for up to 1,320 people, with power and water services connected. The camp incorporates kitchen and dining facilities for up to 5,000 cooked meals a day, accommodation units ready for immediate occupation by 400 people, and offices with telephone and data communications that already are occupied by site personnel.
A 40 kilometre rail link to Transnet Freight Rail’s network has advanced and 13 kilometres of a 58 kilometre pipeline to the Marapong effluent treatment plant, which will supply water and is part of the mine’s social and labour plan, have been completed.
We also have a detailed operational readiness plan so we can speed up the path to production as soon as the remaining finance is secured. This covers the delivery
and commissioning of initial mining equipment, recruitment and training, the initial box cut, and commissioning of the coal handling and preparation plant to produce the first saleable coal.
Continuing progress
During the past year, while negotiating to secure the finance to complete construction, we continued to develop Boikarabelo’s infrastructure.
The first three of the rail link’s seven bridges were completed, together with earthworks, drainage and retaining walls for its intersection with the main line. The intersection will be complex, with multiple lines so trains with up to 200 wagons can pass each other without delays.
Water supply infrastructure, including holding tanks and pumping facilities from the mine’s borehole field, was installed and pipes were laid along a 13 kilometre section of the Marapong pipeline. We also signed a contract to construct the Marapong effluent treatment plant.
Poles and 21.2 kilometres of 132kv electricity transmission lines for the power supply were erected, and a substation and switch room are due for completion in October 2015, funded by a deferred payment facility.

Funding Timeline... negotiations for project finance continue, whilst
alternative funding also sought. $$$$
expected to provide all that is required to finalise mine construction.
PROJECT FUNDING
Construction Continues... of the
mine’s infrastructure with 3 rail link bridges, power supply and rail network
earthworks now complete.
of water pipeline associated with the treatment plant being laid.
13kms 4
We also signed two additional contracts with FLSmidth Roymec (Pty) Limited, the South African black economic empowerment subsidiary of FLSmidth & Co, the leading supplier of plant, equipment and services for the global minerals industry which had designed the coal handling and preparation plant, the largest item in the capital budget. These further contracts covered the engineering, procurement, supply and construction management of the plant, including on-site mechanical and electrical installations.
Funding the mine’s construction
A year ago, we expected production to begin in mid-2016, subject to securing debt funding of US$500 million to complete construction and buy mobile equipment.
The first tranche of this finance was secured in August 2014, when we signed a loan facility for up to US$113 million with Komatsu Financial Limited Partnership for the cost of the mobile equipment fleet.
The weakening coal price, however, delayed credit approval from the club of financiers with which we were negotiating to obtain the remaining US$400 million capital requirement. In February 2015, due to the time the negotiations were taking, the financiers agreed to our disclosing their names: Rand Merchant Bank, HSBC Bank, Industrial Development Corporation of South Africa,
PIC, Noble Group and Export Finance & Insurance Corporation. We also announced that a term sheet was being finalised to provide all the remaining funding, with loans agreed by Noble Group in 2013 becoming part of the facility.
Eventually, in June 2015 we were close to an in-principle agreement with the club of financiers on the term sheet for a multi-layered funding package. Together with other funding commitments, this would have provided the necessary finance and we believed we were on the verge of being able to construct the mine.
Finalising these negotiations, however, has been hampered by a weakened API4 coal price forecast. This has prompted the financiers to ask us to investigate whether a contract mining model could reduce the mine’s cost and capital requirement, thereby lowering gearing. Previously, contract mining options were evaluated and found not to be viable. However, it is possible in the current market that circumstances may have changed. Consequently, we are now seeking quotes from mining contractors – a process that is likely to take several months to complete. Meanwhile, we are exploring alternative debt funding solutions.

Funding Timeline... negotiations for project finance continue, whilst
alternative funding also sought. $$$$
expected to provide all that is required to finalise mine construction.
PROJECT FUNDING
Construction Continues... of the
mine’s infrastructure with 3 rail link bridges, power supply and rail network
earthworks now complete.
of water pipeline associated with the treatment plant being laid.
13kms 5
Resource Generation Limited Annual Report 2015
Contributing to local communities
Everything we do at Boikarabelo follows five core values:
• Zero harm – making sure it is a safe coal mine.
• Equality – ensuring that men and women have an equal opportunity to work at the mine.
• Low environmental impact – minimising the impact the mine has on the surrounding Waterberg region.
• Supporting the local economy – ensuring that as many services as possible are sourced from the local region.
• Be responsible – aiming to be responsible in all aspects of our work and community activity.
The health and safety of our employees and their families are a key priority. Safety procedures are non-negotiable, aimed at achieving ‘zero harm’, and in March 2015 Boikarabelo’s safety officer completed the Chamber of Mines Safety Officer Course.
In December 2014, we held our second World AIDS Day event for the local community, with health practitioners from nearby clinics giving free tests for HIV/AIDS and tuberculosis to more than 200 people.
Regular meetings are held with our local communities to keep each other informed about developments and employment opportunities at the mine and any concerns that people have.
Our human resource development program, which forms part of Boikarabelo’s social and labour plan, holds educational events at a number of schools and also funds an adult basic education and training program that is well attended by members of our local communities. The program develops skills so people can secure a range of jobs at the mine, including as welders, fitters, electricians and plumbers.
We also support our neighbouring communities through securing supplies and services from local businesses wherever possible. Workshops are held for business owners and more than 250 small, medium and micro enterprises are registered on Boikarabelo’s electronic supplier database.
The Boikarabelo project covers 22,000 hectares, with a wide range of game including giraffe, kudu, impala and water buck, and we have instituted an environmental management plan to limit the mine’s impact. This includes a feeding and conservation program for African white back vultures, which have been classified as an endangered species, and we now have a colony of 120 birds, with 40 breeding pairs.

Unlocking potential...once funding has been
finalised we are confident of delivering the successful
development of the Boikarabelo mine.
120m thick coal seam at a shallow depth of 20-35m.
6
It’s a matter of time for Boikarabelo
While the weak coal price has delayed our securing the remainder of the finance to build the mine, it’s only a matter of time until the funds are raised. Global demand for coal continues to grow, as demonstrated by recent proposals to develop new mines in Australia. The forecast power shortfall in South Africa will increase demand for coal there and international studies conclude that Asian imports of coal also will grow.
With low production costs, transport arrangements in place and the initial years’ production already underwritten by sales contracts, Boikarabelo is positioned to benefit from this growth in demand, while
contributing to South Africa’s economy through exports. We are optimistic, therefore, that the project finance to bring the mine to reality will become available in the coming year.
Meanwhile, we thank our shareholders, employees and many others who share our confidence in the potential of Boikarabelo.
* This information was prepared and first disclosed under the JORC Code 2004. It has not been updated since to comply with the JORC Code 2012 on the basis that the information has not materially changed since it was last reported.
Information in this report that relates to exploration results, mineral resources or ore reserves is based on information compiled by Mr Dawie Van Wyk who is a consultant to the Company and is a member of a Recognised Overseas Professional Organisation. Mr Van Wyk has sufficient experience which is relevant to the style of mineralisation and type of deposit under consideration and to the activity which he is undertaking to qualify as a Competent Person as defined in the 2004 Edition of the ‘Australasian Code for Reporting of Exploration Results, Mineral Resources and Ore Reserves’. Mr Van Wyk has given and has not withdrawn consents to the inclusion in the report of the matters based on his information in the form and context in which it appears.

7
Resource Generation Limited Annual Report 2015
Financial Reportfor 30 June 2015
Directors’ report 8
Independence statement 19
Corporate governance 20
Consolidated statement of profit or loss and other comprehensive income 24
Consolidated statement of financial position 25
Consolidated statement of changes in equity 26
Consolidated statement of cash flows 27
Notes to the consolidated financial statements 28
Directors’ declaration 54
Independent auditor’s report to the members 55
Supplementary information 57
Shareholder information 60
Mining Tenements 62
The financial report covers Resource Generation Limited, comprising the consolidated entity and its subsidiaries. The financial report is presented in Australian dollars. Resource Generation Limited is a company limited by shares, incorporated and domiciled in Australia. Its registered office and principal place of business is: Level 12, Chifley Tower, 2 Chifley Square, Sydney NSW 2000. The financial report was authorised for issue by the Directors on 20 August 2015. The Company has the power to amend and reissue the financial report. Through the use of the internet, we have ensured that our corporate reporting is timely, complete and available globally at a minimum cost. All market releases, quarterly reports, financial reports and other information is available at our Investor page on our website: www.resgen.com.au

8 Directors’ report30 June 2015
Your directors present their report on the consolidated entity (referred to hereafter as the Group) consisting of Resource Generation Limited (the Company) and the entities it controlled at the end of, or during, the year ended 30 June 2015.
Directors
The following persons were directors of Resource Generation Limited during the whole of the financial year and up to the date of this report:
Length of Service B D Warner (Chairman) 4.8 years P J Jury (Managing Director) 7.0 years S J Matthews (Executive Director) 7.0 years G Rose (Non-executive Director) 6.6 years
The above named directors held office during the whole of the year ended 30 June 2015.
Principal activities
During the year the principal continuing activities of the Group consisted of the development of the Boikarabelo mine in the Waterberg region of South Africa.
Review of operations
The Boikarabelo mine’s potential continued to be unlocked during the half year. The Boikarabelo mine, in the Waterberg region of South Africa, has probable reserves of 744.8 million tonnes of coal on 35% of the tenements controlled by the Group.
The investment highlights in the development of the Boikarabelo mine include:
• A large quality shallow resource and reserve base
• A defined pathway to first production
• The mine plan reflects a simple cost effective mining operation
• The mine is fully compliant with the Black Economic Empowerment (BEE) legislation and all material licences have been obtained
• There is a substantial production profile with long-term offtake secured
• Experienced management
The net loss for the year to 30 June 2015 of $4.9 million reflects employee expenses of $1.6 million, finance costs of $2.7 million and expenses relating to performance share rights of $0.8million. Revenue has decreased as interest on the loan to the black economic empowerment (BEE) partner, Fairy Wing Trading 136 (Pty) Limited, has been deferred from 1 January 2014 until commencement of coal production at the Boikarabelo mine.
Management has continued to pursue debt funding of approximately US$400 million required to complete construction of site infrastructure and the rail link. Although negotiations have been protracted, their continuation indicates that all parties seek to agree a structure that provides the funding. Every effort is being made to finalise the funding. The Company continues to meet its financial obligations but is mindful that the future of the Boikarabelo mine is dependent upon funding being secured.
The financial position of the Group is sound, with efforts focused to secure funding to support the construction of the Boikarabelo mine. The Boikarabelo mine in South Africa is the only segment of the Group.
Further information on the operations and financial position of the Group is set out in this annual report.
Significant changes in the state of affairs
A significant number of corporate events occurred during the year:
• In August 2014, a loan facility of up to US$113 million was signed with Komatsu Financial Limited Partnership for the mobile equipment fleet for the project. The term is 5 years from the first utilisation date. In November 2014, a supply agreement was signed with Komatsu Southern Africa (Pty) Limited. The agreements will not be activated until the balance of debt required to complete project construction has been secured.
• In August 2014, an engineering, procurement and supply contract was signed with FLSmidth Roymec (Pty) Limited, the South African BEE subsidiary of FLSmidth & Co, the leading supplier of complete plants, equipment and services for the global minerals industry. A further contract in respect of the construction management in respect of on-site mechanical and electrical installations of the coal handling and preparation plant was signed in October 2014. Commencement of fabrication and supply is conditional upon completion of debt funding.

9
Resource Generation Limited Annual Report 2015
Directors’ report (cont.)
30 June 2015
• Construction activity continued at the Boikarabelo mine, while debt funding is being finalised, in order to shorten the overall construction time. This included:
– construction camp for up to 1,320 persons;
– rail link bridges;
– power supply infrastructure;
– rail network stabilisation facility (NSF);
– earthworks relating to the construction offices, power supply and the NSF;
– permanent water supply infrastructure; and
– 13 kilometres of water pipeline for the Marapong Boikarabelo Effluent Transfer Scheme.
• At the construction camp, services, kitchen and dining facilities have been installed for 1,320 people. Accommodation units have been installed to allow 400 persons to take up immediate occupation.
• Construction of several rail link bridges over the rail line was completed in December 2014.
• In October 2014 EHL Energy (Pty) Limited commenced erecting power poles for the 132kV power transmission lines and these were completed in July 2015. Earthworks for the substation and switch room were completed, and their construction, which is funded by a deferred payment facility, is scheduled for completion by October 2015.
• The construction offices were completed and occupied in December 2014.
• The term sheet for the US$55.3 million loan from Noble Resources International Pte Ltd to fund rail construction expired on 24 June 2015. This commitment has been rolled into the intended project financing.
Dividends
No dividends were paid or proposed to be paid to members during the financial year.
Results of operations
The loss for the year for the company was $4.9 million (2014 loss $1.0 million).
Matters subsequent to the end of financial year
There were no matters subsequent to the end of the financial year that have significantly affected or may significantly affect:
(i) the Group’s operations in future financial years, or
(ii) the results of those operations in future financial years, or
(iii) the Group’s state of affairs in future financial years.
Likely developments and expected results of operations
Further information on likely developments in the operations of the Group and the expected results of operations are expanded upon elsewhere in this report. The focus of the next two years will be the construction of the Boikarabelo mine with production targeted for the 2018 financial year.
Environmental regulation
The Group’s directors and management are committed to continual improvement in the environmental management of the Group’s operations and to develop effective community and stakeholder relationships.
The Group is aware of the environmental regulations applying to its operations and seeks to comply with them in all relevant jurisdictions. There have been no environmental incidents throughout the year.
Information on directors
Brian David Warner (B Sc, Dip Ed, Dip Mineral Processing)Chairman
Experience and expertiseMr Warner has considerable experience and skills in both the mining and finance industries. He retired as the senior resources analyst at Citibank, a position he had held for 6 years. Brian is a metallurgist and in his early career worked with Peko Wallsend, Agnew Nickel Mining and Seltrust as a metallurgist, project manager and operations manager. His last 20 years were as a senior mining research analyst with several international merchant banking groups including Citibank, Deutsche Bank and Credit Suisse First Boston.
Other current directorships or former directorships in the last 3 yearsNone.
Interests in shares and performance share rights200,000 ordinary shares in Resource Generation Limited
Nil performance share rights
Special responsibilitiesMember of the Audit Committee Member of the Risk Committee Chairman of the Remuneration Committee Chairman of the Nomination Committee

10 Directors’ report (cont.)
30 June 2015
Paul John Jury , (BComm, CA, FFin, ACIS, FTIA)Managing Director
Experience and expertiseMr Jury has over 35 years experience in managing businesses, the last 30 being in the coal sector. Mr Jury’s positions have included Chief Financial Officer of Coal and Allied Industries Limited, Finance Director of Coal Mines Australia Limited, Executive Chairman of Oceanic Coal Australia Limited and Managing Director of Resource Pacific Holdings Limited.
Interests in shares and performance share rights24,360,591 ordinary shares in Resource Generation Limited
10,000,000 performance share rights
Shares issued on exercise of performance share rightsNone.
Other current directorships or former directorships in the last 3 yearsNone.
Special responsibilitiesManaging Director Member of the Risk Committee Member of the Nomination Committee
Stephen James Matthews, (BSc (Hons), FCA, FFin)Executive Director and Company Secretary
Experience and expertiseMr Matthews has over 30 years corporate finance and commercial experience, including 18 years in the coal industry. Mr Matthews is a qualified Chartered Accountant and is the Company Secretary. Mr Matthews’ previous positions were as a senior executive with Coal Mines Australia Limited, Billiton Coal Australia, BHP Billiton’s Hunter Valley Energy Coal division and Resource Pacific Holdings Limited.
Interests in shares and performance share rights4,175,603 ordinary shares in Resource Generation Limited
5,000,000 performance share rights
Shares issued on exercise of performance share rightsNone.
Other current directorships or former directorships in the last 3 yearsNone.
Special responsibilitiesCompany Secretary and Finance Director
Geoffrey (Toby) Rose AO, (BSc)Non-executive director.
Experience and expertiseMr Rose is a geologist with more than 50 years experience in the NSW coal and minerals industry. He was awarded the Order of Australia for contributions to mining and minerals research. For 10 years until 1992 Toby was Director General of the New South Wales Department of Mineral Resources and Chair of the Mines Subsidence Board. Subsequent directorships include non-executive roles with Coal Mines Australia Limited, Billiton Coal Australia and Resource Pacific Holdings Limited.
Interests in shares and performance share rights136,000 ordinary shares in Resource Generation Limited
Nil performance share rights
Other current directorships or former directorships in the last 3 yearsNone.
Special responsibilitiesChairman of the Audit Committee Chairman of the Risk Committee Member of the Remuneration Committee Member of the Nomination Committee
Meetings of directors
The number of meetings of the Company’s Board of Directors held during the year ended 30 June 2015, and the number of meetings attended by each director was:
MEETINGS OF COMMITTEES
Full meetings of directors Audit Remuneration Nomination Risk
Attended Held Attended Held Attended Held Attended Held Attended Held
B Warner 16 16 2 2 1 1 1 1 1 1
P Jury 16 16 – – – – 1 1 1 1
S Matthews 15 16 – – – – – – – –
G Rose 16 16 2 2 1 1 1 1 1 1

11
Resource Generation Limited Annual Report 2015
Directors’ report (cont.)
30 June 2015
Remuneration report
The Board is committed to clear and transparent disclosure of the Group’s remuneration arrangements.
The remuneration report is set out under the following main headings:
1. Principles used to determine the nature and amount of remuneration;
2. Details of remuneration;
3. Service agreements;
4. Share-based compensation.
1 Principles used to determine the nature and amount of remuneration
The objective of the Group’s executive reward framework is to ensure reward for performance is competitive and appropriate for the results delivered. The framework aligns executive reward with achievement of strategy objectives and the creation of value for shareholders, and conforms to market best practice for delivery of reward. The Board ensures that the executive reward satisfies the following key criteria for good governance practices:
a) Competitiveness and reasonableness;
b) Acceptability to shareholders;
c) Performance linkage/alignment of executive compensation;
d) Transparency; and
e) Capital management.
The Group has structured an executive remuneration framework that is market competitive and complementary to the reward strategy of the organisation. The framework provides a mix of fixed and variable pay, and a blend of short and long term incentives. The remuneration of executives is aligned to key milestones in the development of the Boikarabelo mine.
Alignment to shareholders’ interests:
a) focuses on sustained growth in shareholder wealth; and
b) attracts and retains high calibre executives.
Alignment to performance:
Focuses on achieving key Group milestones, including obtaining relevant licences, funding and development of the Boikarabelo mine.
Alignment to program participants’ interests:
a) rewards capability and experience; and
b) provides a clear structure for earning rewards.
The Remuneration Committee makes recommendations to the Board on remuneration and incentive policies and practices and other terms of employment for executive and non-executive directors and other senior executives. The Corporate Governance Statement provides further information on the role of the committee.
The Company does not use a remuneration consultant.
Executive directorsFees and payments to executive directors reflect the demands which are made on, and the responsibilities of the directors. Executive directors’ fees and payments are reviewed annually by the Remuneration Committee. The Board also ensures that executive directors’ fees and payments are appropriate and in line with the market. Executive directors do receive security based payments as part of their compensation package, as disclosed below.
Retirement allowances and benefits for directorsThere are no retirement allowances or other benefits paid to directors.
Directors’ feesThe amount of remuneration of the directors of Resource Generation Limited is set out in the following table. There was no other remuneration of any type to the directors.
Short-term incentivesShort-term incentives (STI) are offered on a competitive basis considering a total remuneration package benchmarked against relevant industry groups and having regard for the specific circumstances of the Group. The components of each executive’s total remuneration package is weighted in accordance with their role and responsibilities.
The Remuneration Committee recommends to the Board appropriate targets and key performance indicators (KPIs) to link the STI plan and the level of payout if targets are met. This includes setting any maximum payout under the STI plan, and minimum levels of performance to trigger payment of STIs.
There were no STIs paid during the current financial year as there were no targets set for the current year.

12 Directors’ report (cont.)
30 June 2015
Long-term incentive planThe long-term incentive plan (LTIP), known as the Employee Share Plan, was approved by shareholders at the October 2014 Annual General Meeting. Performance share rights are granted under the LTIP to employees eligible to participate in the plan i.e. those at an executive level (including the Managing Director). The Company will seek shareholder approval at an Annual General Meeting prior to any performance share rights being issued to the Managing Director and the Executive Director. The LTIP is focused on achieving key Group milestones including funding and development and initial coal production
of the Boikarabelo mine as per Section 4 in the Remuneration Report. Performance share rights are granted under the LTIP for no consideration. Performance share rights vest over periods ranging from one to five years with non-market based performance hurdles determined by the executive’s role and responsibilities.
Each year, the Board, on the recommendation of the Remuneration Committee, considers whether senior executives should be awarded performance share rights under the LTIP and considers the appropriate targets and key performance indicators to determine what hurdles are appropriate for vesting to occur.
2 Details of remunerationDetails of the nature and amount of each element of the emoluments of directors and key management personnel of Resource Generation Limited and the Group are set out in the following tables.
The non-executive directors do not receive performance share rights.
The key management personnel of the Group includes the directors as set out in the Directors Report and the following executive officers:
– B Warner – Non-Executive Director and Chairman
– T Rose – Non-Executive Director
– P Jury – Managing Director
– S Matthews – Executive Director
– H van den Aardweg – General Manager Operations, South Africa
– M Collopy – Chief Financial Officer
– B O’Regan – Commercial & Financial Manager, South Africa
– A McLeod – Senior General Manager, Boikarabelo Mine, resigned 1 January 2015
i) Remuneration
2015SHORT-TERM
BENEFITS
POST EMPLOYMENT
BENEFITS
LONG-TERM EMPLOYMENT
BENEFITS
SHARE BASED PAYMENTS EXPENSED
OTHER–-RENT ASSISTANCE,
TRAVEL TOTAL
Name of director
Cash salary or fees $
Super- annuation $
Long service leave $
Performance shares $ $
Total $
% Share based payment
Non-executive directors
G Rose 63,863 6,067 – – – 69,930 –
B Warner 87,378 35,000 – – – 122,378 –
Sub-total non-executive directors 151,241 41,067 – – – 192,308
Executive directors
P Jury 597,700 35,000 85,191 534,834 – 1,252,725 43%
S Matthews 442,300 35,000 64,267 267,417 – 808,984 33%
Sub-total executive directors 1,040,000 70,000 149,458 802,251 – 2,061,709
Other key management
H van den Aardweg 365,178 – – 131,915 16,893 513,986 26%
A McLeod 345,000 – – (330,590) 10,500 24,910 0%
M Collopy 99,900 – 9,499 5,348 – 114,747 5%
B O’Regan 234,004 – – 106,967 17,796 358,767 30%
Sub-total key management 1,044,082 – 9,499 (86,360) 45,189 1,012,410
Total 2,235,323 111,067 158,957 715,891 45,189 3,266,427
There were no fees paid to director-related entities.
13
Resource Generation Limited Annual Report 2015
Directors’ report (cont.)
30 June 2015
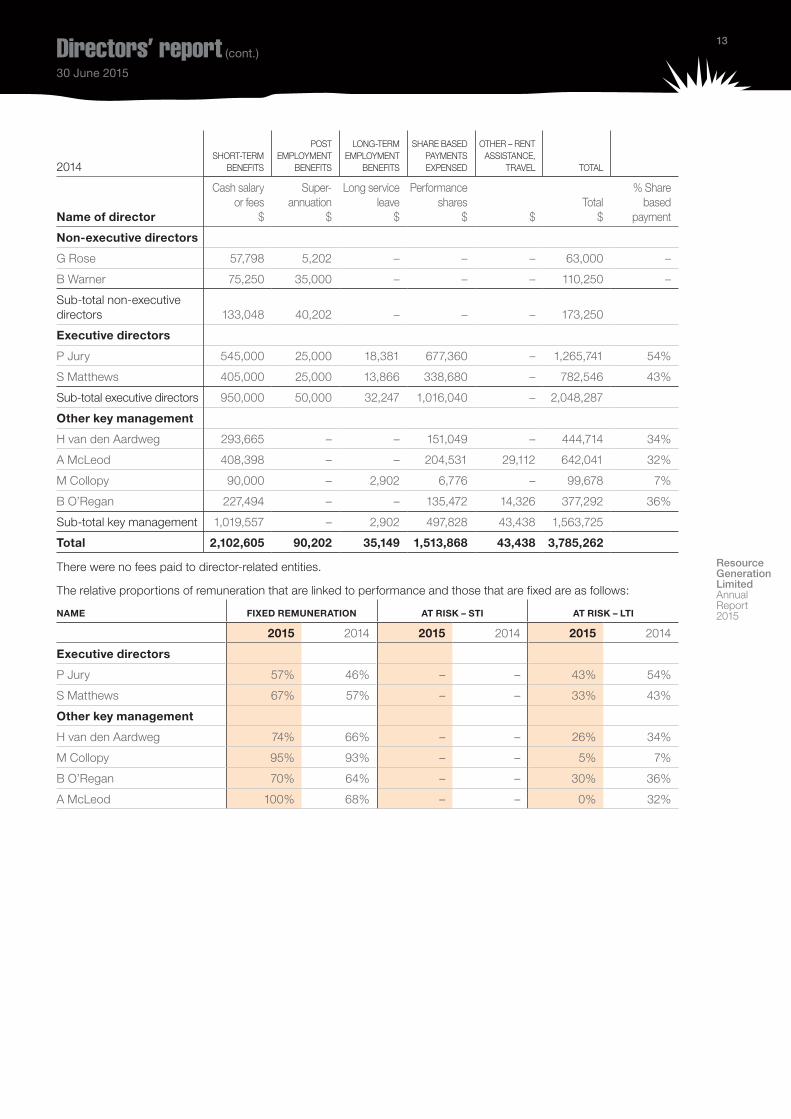
2014
SHORT-TERM
BENEFITS
POST EMPLOYMENT
BENEFITS
LONG-TERM EMPLOYMENT
BENEFITS
SHARE BASED PAYMENTS EXPENSED
OTHER – RENT ASSISTANCE,
TRAVEL TOTAL
Name of director
Cash salary or fees $
Super- annuation $
Long service leave $
Performance shares $ $
Total $
% Share based payment
Non-executive directors
G Rose 57,798 5,202 – – – 63,000 –
B Warner 75,250 35,000 – – – 110,250 –
Sub-total non-executive directors 133,048 40,202 – – – 173,250
Executive directors
P Jury 545,000 25,000 18,381 677,360 – 1,265,741 54%
S Matthews 405,000 25,000 13,866 338,680 – 782,546 43%
Sub-total executive directors 950,000 50,000 32,247 1,016,040 – 2,048,287
Other key management
H van den Aardweg 293,665 – – 151,049 – 444,714 34%
A McLeod 408,398 – – 204,531 29,112 642,041 32%
M Collopy 90,000 – 2,902 6,776 – 99,678 7%
B O’Regan 227,494 – – 135,472 14,326 377,292 36%
Sub-total key management 1,019,557 – 2,902 497,828 43,438 1,563,725
Total 2,102,605 90,202 35,149 1,513,868 43,438 3,785,262
There were no fees paid to director-related entities.
The relative proportions of remuneration that are linked to performance and those that are fixed are as follows:
NAME FIXED REMUNERATION AT RISK – STI AT RISK – LTI
2015 2014 2015 2014 2015 2014
Executive directors
P Jury 57% 46% – – 43% 54%
S Matthews 67% 57% – – 33% 43%
Other key management
H van den Aardweg 74% 66% – – 26% 34%
M Collopy 95% 93% – – 5% 7%
B O’Regan 70% 64% – – 30% 36%
A McLeod 100% 68% – – 0% 32%

14 Directors’ report (cont.)
30 June 2015
ii) Performance share rightsThe number of performance share rights over ordinary shares in the Company held during the financial year by each director of Resource Generation Limited, including their personally related parties, are set out below:
2015
Balance at the start of the year Share Rights
Granted during the year Share Rights
Lapsed or forfeited during the year Share Rights
Balance at the end of the year Share Rights
Vested and exercisable at the end of the year Share Rights
Unvested at the end of the year Share Rights
Directors
P Jury 10,000,000 – – 10,000,000 – 10,000,000
S Matthews 5,000,000 – – 5,000,000 – 5,000,000
Other key management
H van den Aardweg 2,500,000 – – 2,500,000 – 2,500,000
A McLeod* 3,500,000 – (3,500,000) – – –
M Collopy 100,000 – – 100,000 – 100,000
B O’Regan 2,000,000 – – 2,000,000 – 2,000,000
Totals 23,100,000 – (3,500,000) 19,600,000 – 19,600,000
* The 3,500,000 share rights were granted in 2014.
iii) ShareholdingsThe number of shares in the company held during the financial year by each director and key management personnel of Resource Generation Limited, including their personally related parties, are set out below:
2015
Balance at the start of the year Shares
Received during the year on the conversion of performance share rights Shares
Other changes during the year Shares
Balance at the end of the year Shares
Directors
P Jury 24,360,591 – – 24,360,591
S Matthews 4,175,603 – – 4,175,603
B Warner 200,000 – – 200,000
T Rose 136,000 – – 136,000
Other key management
H van den Aardweg 1,080,000 – – 1,080,000
A McLeod* 170,000 – (170,000) –
M Collopy 203,700 – – 203,700
B O’Regan 276,000 – – 276,000
Totals 30,601,894 – (170,000) 30,431,894
* Left employment on 1 January 2015.

15
Resource Generation Limited Annual Report 2015
Directors’ report (cont.)
30 June 2015
3 Service agreementsRemuneration and other terms of employment for key management personnel are formalised in service agreements. The major provisions of the agreements relating to remuneration are set out below:
P Jury, Managing Director– Contract signed 28 July 2011, no fixed term;
– Three months’ notice by director;
– Termination payments equivalent to six months’ salary package;
– Base salary and superannuation to be reviewed annually;
– Provision of four weeks’ annual leave and thirteen weeks’ long service leave (after eight years);
– Provision of sick leave, accrued balance payable upon termination;
– Provision made for the awarding of bonuses at the recommendation of the Remuneration Committee; and
– Provision made for the award of performance share rights, subject to shareholder approval.
S Matthews, Executive Director and Company Secretary– Contract signed 28 July 2011, no fixed term;
– Three months’ notice by director;
– Termination payments equivalent to six months’ salary package;
– Base salary and superannuation to be reviewed annually;
– Provision of four weeks’ annual leave and thirteen weeks’ long service leave (after eight years);
– Provision of sick leave, accrued balance payable upon termination;
– Provision made for the awarding of bonuses at the recommendation of the Remuneration Committee; and
– Provision made for the award of performance share rights, subject to shareholder approval.
H van den Aardweg, General Manager, South Africa– Contract effective 1 November 2008, no fixed term;
– One month’s notice by employee;
– Termination payments equivalent to three months’ salary package;
– Base salary and superannuation to be reviewed annually;
– Provision of four weeks’ annual leave;
– Provision made for the awarding of bonuses at the recommendation of the Remuneration Committee; and
– Provision made for the award of performance share rights.
M Collopy, Chief Financial Officer – No service agreement.
– Provision of four weeks’ annual leave (proportional to period worked) and thirteen weeks’ long service leave after ten years (proportional to period worked).
– Provision made for the award of performance share rights.
B O’Regan, Commercial Manager, South Africa– Contract effective 21 March 2011, no fixed term;
– One month’s notice by employee;
– Termination payments equivalent to three months’ salary package;
– Base salary, superannuation, accommodation and travel allowance to be reviewed annually;
– Provision of four weeks’ annual leave;
– Provision made for the awarding of bonuses at the recommendation of the Remuneration Committee; and
– Provision made for the award of performance share rights.
Non-executive directors serve on a month to month basis and there are no termination payments payable.

16 Directors’ report (cont.)
30 June 2015
Key Financial DataThe tables below set out summary information about the consolidated entity’s earnings and movements in shareholder wealth for the five years to 30 June 2015.
30 June 2015 $’000
30 June 2014 $’000
30 June 2013 $’000
30 June 2012 $’000
30 June 2011 $’000
Revenue 677 4,795 1,860 2,099 1,235
Net loss before tax (4,944) (1,035) (2,791) (578) (5,058)
Net loss after tax (4,949) (1,042) (2,813) (573) (5,072)
30 June 2015 cents
30 June 2014 cents
30 June 2013 cents
30 June 2012 cents
30 June 2011 cents
Share price at start of year 13 20 30 75 46
Share price at end of year 7 13 20 30 75
Basic earnings per share (0.9) (0.2) (1.0) 0.2 (2.3)
Diluted earnings per share (0.9) (0.2) (1.0) 0.2 (2.3)
There were no dividends paid or proposed during the five years to 30 June 2015.
4 Share-based compensationPerformance share rightsPerformance share rights are granted under the Long Term Incentive Plan for no consideration. Performance share rights vest over periods ranging from one to three years with non-market based performance hurdles determined by the executive’s role and responsibilities. The performance hurdles are linked to key development milestones. For the performance rights current as at 30 June 2015, the performance hurdles include the following:
• Funding to enable all material construction, expected during the 2016 financial year.
• Production of the first 100,000 ROM coal, expected during the 2018 financial year.

17
Resource Generation Limited Annual Report 2015
Directors’ report (cont.)
30 June 2015
Unissued ordinary shares of Resource Generation Limited under performance share rights, held by directors and key management, at the date of this report are as follows:
Grant date Name
Financial year in which rights may vest
Issue price of shares
Value per right at grant date
Number granted under right
Maximum total value of grant yet to vest $ Year granted
Performance share rights
28-Jan-14 P Jury 2016 Nil $0.18 5,000,000 900,000 2014
28-Jan-14 P Jury 2018 Nil $0.18 5,000,000 900,000 2014
28-Jan-14 S Matthews 2016 Nil $0.18 2,500,000 450,000 2014
28-Jan-14 S Matthews 2018 Nil $0.18 2,500,000 450,000 2014
28-Jan-14 H van den Aardweg 2016 Nil $0.18 1,000,000 180,000 2014
28-Jan-14 H van den Aardweg 2018 Nil $0.18 1,500,000 270,000 2014
28-Jan-14 M Collopy 2016 Nil $0.18 50,000 18,000 2014
28-Jan-14 M Collopy 2018 Nil $0.18 50,000 18,000 2014
28-Jan-14 B O’Regan 2016 Nil $0.18 1,000,000 180,000 2014
28-Jan-14 B O’Regan 2018 Nil $0.18 1,000,000 180,000 2014
There is no pre-determined vesting or exercisable date for performance share rights. They are converted to shares on the date of vesting, which is at the discretion of the holder once performance hurdles are met. During the year, no performance share rights vested or lapsed.
The assessed fair value at grant date of performance share rights granted to individuals is allocated equally over the period from grant date to vesting date, and the amount is included in the remuneration tables above. The value attached to the performance share right is the share price on the day of issue.
No holder has any right under the performance share rights to participate in any other share issue of the Company or any other entity.
18 Directors’ report (cont.)
30 June 2015
5 Additional informationa) Shares under optionAt 30 June 2015 there were 21.7m ordinary shares under performance share rights. No performance share rights were converted during the period.
b) Insurance of officersDuring the financial year Resource Generation Limited paid a premium of $95,773 to insure the directors and officers of the Group. The liabilities insured are legal costs that may be incurred in defending civil or criminal proceedings that may be brought against the officers in their capacity as officers of the Company and any other payments arising from liabilities incurred by the officers in connection with such proceedings. This does not include such liabilities that arise from conduct involving a wilful breach of duty by the officers or the improper use by the officers of their position or of information to gain advantage for them or someone else or to cause detriment to the Company. It is not possible to apportion the premium between amounts relating to the insurance against legal costs and those relating to other liabilities.
c) Agreement to indemnify officersDuring the financial year, the Company entered into an agreement to provide access to Company records and to indemnify the directors and officers of the Company. The indemnity relates to any liability:
i) as a result of being, or acting in their capacity as, an officer of the Company to the maximum extent permitted by law.
ii) for legal costs incurred in successfully defending civil or criminal proceedings. No liability has arisen under these indemnities as at the date of this report.
d) Proceedings on behalf of the CompanyNo person has applied to the court under section 237 of the Corporations Act 2001, or any other relevant jurisdiction in which the Company operates, for leave to bring proceedings on behalf of the Company, or to intervene in any proceedings to which the Company is a party, for the purpose of taking responsibility on behalf of the Company for all or part of those proceedings.
No proceedings have been brought or intervened in on behalf of the Company with leave of the court under section 237 of the Corporations Act 2001.
e) Rounding of amountsThe Company is of a kind referred to in Class Order 98/100, issued by the Australian Securities and Investments Commission, relating to the “rounding off” of amounts in the directors’ report and financial statements. Amounts in the directors’ report and financial statements have been rounded off in accordance with that Class Order to the nearest thousand dollars, unless otherwise indicated.
f) Auditor’s independence declarationA copy of the auditor’s independence declaration as required under section 307C of the Corporations Act 2001 is set out on page 19 of the annual report.
g) Non-audit servicesThe Company may decide to employ the auditor on assignments additional to their statutory audit duties where the auditor’s expertise and experience with the Company and Group are important. The Board of directors has considered the position and, in accordance with the advice received from the Audit Committee, is satisfied that the provision of the non-audit services is compatible with the general standard of independence for auditors imposed by the Corporations Act 2001. The directors are satisfied that the provision of non-audit services by the auditor, as set out in note 22, did not compromise the auditor independence requirements of the Corporations Act 2001.
Signed in accordance with a resolution of the directors, made pursuant to s.298 (2) of the Corporations Act 2001.
On behalf of the directors
P Jury Managing Director
Sydney Date 20 August 2015

19
Resource Generation Limited Annual Report 2015
Liability limited by a scheme approved under Professional Standards Legislation. Member of Deloitte Touche Tohmatsu Limited
20 August 2015 Dear Board Members
Resource Generation Limited
In accordance with section 307C of the Corporations Act 2001, I am pleased to provide the following declaration of independence to the directors of Resource Generation Limited. As lead audit partner for the audit of the financial report of Resource Generation Limited for the financial year ended 30 June 2015, I declare that to the best of my knowledge and belief, there have been no contraventions of:
(i) the auditor independence requirements of the Corporations Act 2001 in relation to the review; and
(ii) any applicable code of professional conduct in relation to the review. Yours sincerely DELOITTE TOUCHE TOHMATSU R G Saayman Partner Chartered Accountants
The Directors Resource Generation Limited Level 12 Chifley Tower 2 Chifley Square Sydney NSW 2000
Deloitte Touche Tohmatsu ABN 74 490 121 060 Grosvenor Place 225 George Street Sydney NSW 2000 PO Box N250 Grosvenor Place Sydney NSW 1219 Australia DX: 10307SSE Tel: +61 (0) 2 9322 7000 Fax: +64 (0)2 9322 7001 www.deloitte.com.au
Independence statement

20
Resource Generation Limited (the Company) and the Board are committed to achieving and demonstrating the highest standards of corporate governance. The Company’s corporate governance framework is reviewed regularly in light of the best practice recommendations released by the Australian Securities Exchange Corporate Governance Council. The Board continues to review the framework and practices to ensure that they meet the interests of shareholders. Where the Company has not adhered to the policies set out in its Board charter for corporate governance it is stated in the annual report.
The directors are responsible to the shareholders for the performance of the Company in both the short and the long term and seek to balance sometimes competing objectives in the best interests of the Company as a whole. Their focus is to enhance the interests of shareholders and other key stakeholders and to ensure the Company is properly managed.
Day to day management of the Company’s affairs and the implementation of the corporate strategy and policy initiatives are undertaken by the Managing Director and the Company Secretary. These are reviewed on an annual basis, with the most recent review in June 2015.
All these practices, unless otherwise stated, were in place for the entire year. They comply with the ASX Principles of Good Corporate Governance and Best Practice Recommendations and updates thereto.
The Board of directors
The Board operates in accordance with the broad principles set out in its charter which is available from the Company’s registered office and on the website. The charter details the Board’s composition and responsibilities.
Board compositionAt the date of signing the directors’ report, the Board comprises two executive directors (including the Managing Director) and two non-executive directors.
ResponsibilitiesThe responsibilities of the Board include:
i) providing strategic guidance to the Company including contributing to the development of and approving the corporate strategy;
ii) reviewing and approving business plans and financial plans including available resources and major capital expenditure initiatives;
iii) overseeing and monitoring organisational performance and the achievement of the Company’s strategic goals and objectives;
iv) ensuring compliance with the Corporations Act, Accounting Standards, the Company’s Code of Conduct, other corporate policies, relevant mining, safety, environmental and industrial legislation and all other appropriate laws;
v) monitoring progress on major capital works and other significant corporate projects including any acquisitions or divestments;
vi) monitoring financial performance including approval of the annual and half-year financial reports and liaison with the Company’s auditors;
vii) appointment, performance assessment and, if necessary, removal of the directors;
viii) appointment, performance assessment and, if necessary, removal of the Managing Director;
ix) ratifying the appointment and/or removal and contributing to the performance assessment for the members of the senior management team including the Chief Financial Officer and the Company Secretary;
x) ensuring there are effective management processes in place and approving major corporate initiatives;
xi) enhancing and protecting the reputation of the organisation;
xii) overseeing the operation of the Company’s system for compliance and risk management reporting to shareholders;
xiii) promoting a culture of workplace health, safety and environmental responsibility and promoting development of employees through appropriate education and training programmes; and
xiv) recognising the legitimate interests of all stakeholders.
Chairman and Managing DirectorThe Chairman is responsible for leading the Board, ensuring directors are properly briefed in all matters relevant to their role and responsibilities, facilitating Board discussion and managing the Board’s relationship with the Group’s senior executives. The Chairman has acknowledged the significant time commitment in accepting the position and has confirmed that other positions will not hinder his effective performance in the role of Chairman.
The Managing Director is responsible for implementing Company strategy and policies.
Company SecretaryThe Company Secretary is accountable directly to the Board, through the Chairman, on all matters do to with the proper functioning of the Board.
Corporate governance30 June 2015
21
Resource Generation Limited Annual Report 2015
Corporate governance (cont.)
30 June 2015
CommitmentThe number of meetings of the Company’s Board of directors held during the year ended 30 June 2015, and the number of meetings attended by each director is disclosed in the directors’ report under the heading ‘Meetings of directors’.
Conflict of interestThere were no conflicts of interest during the reporting period.
Independent professional adviceDirectors, and Board committees, have the right, in connection with their duties and responsibilities, to seek independent professional advice at the Company’s expense. Written approval of the Chairman is required, but this will not be unreasonably withheld.
Performance assessmentThe Board undertakes an annual self-assessment of its collective performance, the performance of its committees, the performance of the Chairman and of its individual directors, bearing in mind the adequacy of induction and continuing education, access to information and the support provided by the Company Secretary.
DiversityThe Board has initiated employment of a diverse workforce, embracing diversity in skills, gender and culture. It recognises the competitive benefits of recruiting, developing and retaining a talented, diverse and motivated workforce.
The Group’s main project is development of the Boikarabelo mine in South Africa where it is fully compliant with Black Economic Empowerment (“BEE”) requirements. The BEE program is a legislated South African Government initiative to address the issues faced by Historically Disadvantaged South Africans. Diversity is about recognising, respecting and valuing differences based on, but not limited to, gender, age, ethnicity, religion, disability and sexual orientation.
The Company has not set a diversity objective at Board level for 2016. However, if a Board vacancy occurs during 2016 or the number of directors is increased, the Company will recruit new directors in accordance with the Resource Generation diversity policy, with the aspiration of adding one or more women to the Board.
Senior management roles and positions are filled by the best candidates available without discrimination and the Company aims to increase diversity in senior appointments as positions become available. Diversity will be advanced by ensuring the Company retains appropriate recruitment practices, training regimes and management practices.
The Nomination Committee is responsible for establishing and monitoring strategies on gender diversity. The committee has determined the diversity policy and implemented measurable, reportable objectives. It has responsibility, in consultation with management (as appropriate), to oversee the implementation and ongoing monitoring of the Group’s diversity strategy.
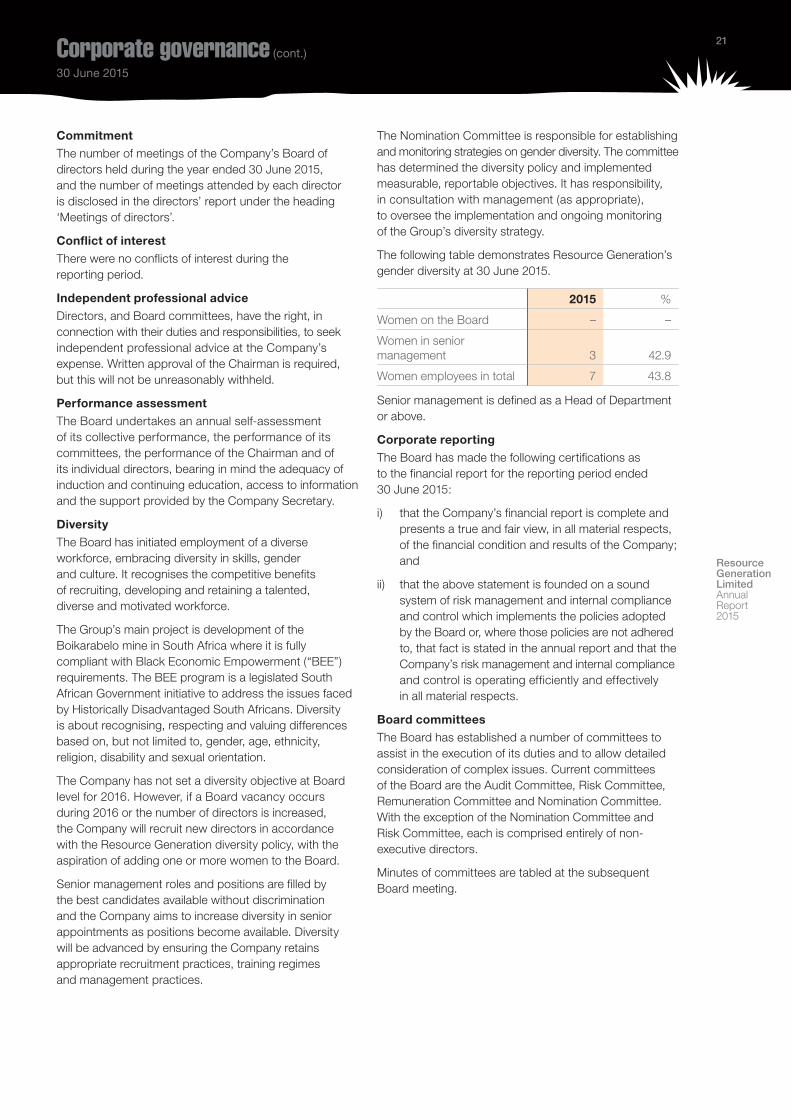
The following table demonstrates Resource Generation’s gender diversity at 30 June 2015.
2015 %
Women on the Board – –
Women in senior management 3 42.9
Women employees in total 7 43.8
Senior management is defined as a Head of Department or above.
Corporate reportingThe Board has made the following certifications as to the financial report for the reporting period ended 30 June 2015:
i) that the Company’s financial report is complete and presents a true and fair view, in all material respects, of the financial condition and results of the Company; and
ii) that the above statement is founded on a sound system of risk management and internal compliance and control which implements the policies adopted by the Board or, where those policies are not adhered to, that fact is stated in the annual report and that the Company’s risk management and internal compliance and control is operating efficiently and effectively in all material respects.
Board committeesThe Board has established a number of committees to assist in the execution of its duties and to allow detailed consideration of complex issues. Current committees of the Board are the Audit Committee, Risk Committee, Remuneration Committee and Nomination Committee. With the exception of the Nomination Committee and Risk Committee, each is comprised entirely of non-executive directors.
Minutes of committees are tabled at the subsequent Board meeting.

22 Corporate governance (cont.)
30 June 2015
Audit and Risk CommitteesDuring the current financial year the audit and risk committee was split into two separate committees, one being Audit and the other Risk.
The Audit Committee consists of the following non-executive directors:
Toby Rose (Chairman) Brian Warner
The Audit Committee members are financially literate and have an appropriate understanding of the industry in which the Group operates. The Audit Committee operates in accordance with a charter. The primary purpose of the Audit Committee is to assist the Board to discharge its responsibilities in the following areas:
• ensuring the Group adopts, maintains and applies appropriate accounting and financial reporting processes and procedures;
• facilitating the independence of the external audit process and addressing issues arising from the audit process; and
• reviewing and concurring on the appointment, replacement, reassignment or dismissal of the CFO.
The Risk Committee consists of the following directors:
Toby Rose (Chairman) Brian Warner Paul Jury
The Risk Committee members are risk aware and have an appropriate understanding of the industry in which the Group operates. The Risk Committee operates in accordance with a charter. The primary purpose of the Risk Committee is to assist the Board to discharge its responsibilities in the following areas:
• ensuring the Group maintains effective risk management and internal control systems. Effective risk management is facilitated through the active operation of three risk registers covering workplace health and safety, finance and operations.
Remuneration CommitteeThe Remuneration Committee consists of the following non-executive directors:
Brian Warner (Chairman) Toby Rose
The primary purpose of the Remuneration Committee is to advise the Board on remuneration and incentive policies and practices generally, and to make practical recommendations to assist the Board in discharging its responsibilities in the following areas:
• ensuring that appropriate procedures exist to assess the remuneration levels of the Chairman, non-executive directors, executive directors, direct reports to the Managing Director, Board committees and the Board as a whole;
• ensuring that the Group adopts, monitors and applies appropriate remuneration policies and procedures; and
• ensuring reporting disclosures related to remuneration meet the Board’s disclosure objectives and all relevant legal reports.
Nomination CommitteeThe Nomination Committee consists of the following directors:
Brian Warner (Chairman) Toby Rose Paul Jury
The Nomination Committee is responsible for identifying and nominating, for approval of the Board, candidates to fill executive and non-executive vacancies as and when they arise. The Nomination Committee is also responsible for employment diversity within the Group.
Health and Safety CommitteeThere is currently no formal Health and Safety Committee of the Board as the Board does not consider that it is currently warranted given the present scale of operations of the Company. Relevant workplace policies are in place governing exploration and development activities and are monitored by the Risk Committee. At the Boikarabelo operations, RSV Enco, as part of its EPCM contract, carries health and safety responsibilities in respect of all contractors.
External AuditorsThe Board and Audit Committee is responsible for the appointment and monitoring of performance of the external auditor. The Audit Committee charter sets out the following areas of responsibility:
• liaising with the external auditors regarding the scope of the audit and ensuring that the annual audits and half-yearly reviews are conducted in an effective manner;
• approving audit fees;
• reviewing matters relating to auditor independence;
• pre-approving any non-audit services provided by the auditors; and
• ensuring rotation of the audit partner every 5 years.

23
Resource Generation Limited Annual Report 2015
Corporate governance (cont.)
30 June 2015
Deloitte Touche Tohmatsu was appointed auditor in October 2010. An analysis of fees paid to the external auditor, including fees for non-audit services, is included in Note 22.
The external auditor attends the annual general meeting and is available to answer shareholder questions. The external auditor is invited to attend half yearly Audit Committee meetings.
Risk assessment and managementThe Board, through the Risk Committee, is responsible for ensuring that there are adequate policies in relation to risk management, compliance and internal control systems. In summary, the Company policies are designed to ensure strategic, operational, legal, reputational and financial risks are identified and assessed, and effectively and efficiently managed and monitored to enable achievement of the Company’s business objectives.
Considerable importance is placed on maintaining a strong control environment. There is an organisational structure with clearly drawn lines of accountability and delegation of authority. Adherence to the code of conduct is required at all times and the Board actively promotes a culture of quality and integrity.
The Company risk management policy and the operation of the risk management and compliance system are managed by the Board. The size and operations of the Company do not presently warrant an internal audit function. Control procedures cover management accounting, financial reporting, project appraisal, compliance and other risk management issues.
Share trading policyThe purchase or sale of Company securities by directors and employees is governed by the Group’s Buying and Selling Securities in Resource Generation Limited policy. The policy acknowledges that under a continuous disclosure environment it is difficult to impose specific ‘windows’ where share trading is permitted and that the only appropriate time for a director or employee to acquire or sell the Company’s shares is when he or she is not in possession of price sensitive information which is not generally available in the market.
Bribery and corruption policyThe Company will not tolerate wilful acts of bribery and corruption in its operations and activities since such acts are legally, morally and ethically wrong. Bribery and corruption are criminal offences and such acts by Resource Generation, its subsidiaries, its directors, officials, employees, contractors and other representatives could generate the risk of legal action possibly resulting in fines and/or imprisonment. Any breach of this policy will be regarded as a serious matter and disciplinary action may result in termination of employment or contract.
Code of conductThe Company has developed a statement of values and a code of conduct which has been fully endorsed by the Board and applies to all directors and employees of the Group when they are engaged. The code is regularly reviewed and updated as necessary to ensure it reflects the highest standards of behaviour and professionalism and the practices necessary to maintain confidence in the Group’s integrity and to take into account legal obligations and reasonable expectations of the Group’s stakeholders.
In summary, the code requires that at all times all Group personnel act with the utmost integrity, objectivity and in compliance with the letter and the spirit of the law and Company policies.
The directors are satisfied that the Group has complied with its policies on ethical standards, including trading in securities.
A copy of the code and the trading policy is available at the Company’s registered office and on the website.
Continuous disclosure and shareholder communicationThe Company has written policies and procedures on information disclosure that focus on continuous disclosure of any information concerning the Company that a reasonable person would expect to have a material effect on the price of the Company’s securities. These policies and procedures also include the arrangements the Company has in place to promote communication with shareholders and encourage effective participation at general meetings. A summary of these policies and procedures is available at the Company’s registered office and on the website.
The Company Secretary has been nominated as the person responsible for communications with the Australian Securities Exchange (ASX). This role includes responsibility for ensuring compliance with the continuous disclosure requirements in the ASX Listing Rules and overseeing and co-ordinating information disclosure to the ASX, analysts, brokers, shareholders, the media and the public.
All information disclosed to the ASX is posted on the Company’s website as soon as it is disclosed to the ASX. When analysts are briefed on aspects of the Group’s operations, the material used in the presentation is released to the ASX and posted on the Company’s website.
Deloitte & Touche Sponsor Services (Pty) Limited acts as the Company’s sponsor for its secondary listing on JSE Limited and is responsible for the Company’s communications with JSE Limited.

24
CONSOLIDATED
Notes 2015 $’000
2014 $’000 *Restated
Revenue from continuing operations 5 677 2,294
Other 5 – 2,501
677 4,795
Administration, rent and corporate (865) (1,209)
Depreciation of property plant and equipment 6 (404) (261)
Employees benefits expense 6 (1,606) (1,411)
Finance expenses 6 (2,729) (1,182)
Land management (290) (132)
Share based compensation 6 (797) (1,635)
Foreign exchange movements 6 1,070 –
Loss before income tax (4,944) (1,035)
Income tax expense 7 (5) (7)
Loss from continuing operations (4,949) (1,042)
Loss for the year (4,949) (1,042)
Other comprehensive income, net of income tax
Items that may be reclassified subsequently to profit and loss when specific conditions are met
Exchange differences on translation of foreign operations 6,764 (9,723)
Total comprehensive income 1,815 (10,765)
Loss is attributable to: Owners of Resource Generation Limited (4,949) (1,042)
Total comprehensive income for the year is attributable to: Owners of Resource Generation Limited 1,815 (10,765)
Loss per share 30
Loss per share for loss from continuing operations cents cents
Basic loss per share (0.9) (0.2)
Diluted loss per share (0.9) (0.2)
* Please refer to Note 3 ‘Critical Accounting estimates and judgements’
The above statement of comprehensive income should be read in conjunction with the accompanying notes.
Consolidated statement of profit or loss and other comprehensive incomeFor the year ended 30 June 2015

25
Resource Generation Limited Annual Report 2015
Consolidated statement of financial positionAs at 30 June 2015
CONSOLIDATED
Notes 2015 $’000
2014 *Restated $’000
01-Jul-13 *Restated $’000
Current assets
Cash and cash equivalents 8 28,551 54,337 21,428
Trade and other receivables 9 200 414 569
Deposits and prepayments 10 207 140 298
28,958 54,891 22,295
Non-current assets
Property, plant and equipment 11 35,464 33,367 34,510
Mining tenements and mining development 12 140,539 103,530 82,102
Deposits and loan receivables 13 18,484 16,923 12,804
194,487 153,820 129,416
TOTAL ASSETS 223,445 208,711 151,711
Current liabilities
Trade and other payables 14 7,320 8,377 8,017
Provisions 15 987 788 713
Borrowings 18 2,661 – 20,500
10,968 9,165 29,230
Non-current liabilities
Provisions 16 204 38 –
Borrowings 19 31,221 21,231 –
Royalties payable 17 2,716 2,553 2,764
34,141 23,822 2,764
TOTAL LIABILITIES 45,109 32,987 31,994
NET ASSETS 178,336 175,724 119,717
Equity
Contributed equity 20(a) 223,622 223,622 159,753
Reserves 21 (2,529) (10,090) (3,270)
Accumulated losses 21 (42,757) (37,808) (36,766)
TOTAL EQUITY 178,336 175,724 119,717
* Please refer to Note 3 ‘Critical Accounting estimates and judgements’
The above statements of financial position should be read in conjunction with the accompanying notes.

26 Consolidated statement of changes in equityFor the year ended 30 June 2015
Notes
Contributed equity $’000
Reserves $’000
Retained earnings $’000
Total equity $’000
Balance at 1 July 2013 (as previously reported) 159,753 12,530 (36,766) 135,517
Adjustments (see note 3(b)) – ( 15,800) – ( 15,800)
Balance at 1 July 2013 (restated) 159,753 (3,270) (36,766) 119,717
Loss for the year – – ( 1,042) ( 1,042)
Other comprehensive income for the year – exchange differences on translation of foreign operations – ( 9,723) – ( 9,723)
Total comprehensive income for the year – ( 9,723) ( 1,042) ( 10,765)
Transactions with owners in their capacity as owners:
Contributions of equity, net of transaction costs 63,869 – – 63,869
Other contributed equity 21 – 1,085 – 1,085
Treasury shares 21 183 183
Employee share options – value of employee services 21 – 1,635 – 1,635
63,869 2,903 – 66,772
Balance at 30 June 2014 223,622 (10,090) (37,808) 175,724
Loss for the year – – ( 4,949) ( 4,949)
Other comprehensive income for the year – exchange differences on translation of foreign operations – 6,764 – 6,764
Total comprehensive income for the year – 6,764 ( 4,949) 1,815
Transactions with owners in their capacity as owners:
Contributions of equity, net of transaction costs 20 – – – –
Employee share options – value of employee services 21 – 797 – 797
– 797 – 797
Balance at 30 June 2015 223,622 (2,529) (42,757) 178,336
The above consolidated statement of changes in equity should be read in conjunction with the accompanying notes.

27
Resource Generation Limited Annual Report 2015
Consolidated statement of cash flowsFor the year ended 30 June 2015
CONSOLIDATED
Notes 2015 $’000
2014 *Restated $’000
Cash flows from operating activities
Payments to suppliers and employees (2,282) (5,669)
Payments for land management (132) (76)
Interest received 677 1,713
Finance costs (8) (1,008)
Taxation payments (4) (7)
Net cash outflow from operating activities 29 (1,749) (5,047)
Cash flows from investing activities
Payments for land, property, plant and equipment (376) (1,861)
Refunds of government charges associated with land acquisition – 330
Payments for acquisition of non-controlling interest – (287)
Net payments for mining related licence deposits (285) –
Payments for mining tenements and mining development (28,588) (22,926)
Loan to BEE partner (196) (2,026)
Net cash outflow from investing activities (29,445) (26,770)
Cash flows from financing activities
Proceeds from issue of shares – 63,963
Equity raising costs – (1,538)
Repayment of borrowings – (20,000)
Forfeited share deposit – 2,500
Proceeds from borrowings – 22,046
Net cash inflow from financing activities – 66,971
Net (decrease)/increase in cash and cash equivalents (31,194) 35,154
Cash and cash equivalents at the beginning of the year 54,337 21,428
Effects of exchange rate movements on cash and cash equivalents 5,408 (2,245)
Cash and cash equivalents at the end of the year 8 28,551 54,337
* Please refer to Note 3 ‘Critical Accounting estimates and judgements’
The above cash flow statements should be read in conjunction with the accompanying notes.

28 Notes to the consolidated financial statementsFor the year ended 30 June 2015
1 Summary of Significant Accounting Policies
The principal accounting policies adopted in the presentation of the consolidated financial statements are as set out below. These policies have been consistently applied to all the years presented, unless otherwise stated. The financial statements are for the consolidated entity consisting of Resource Generation Limited and its subsidiaries.
a) Statement of complianceThis general purpose financial report has been prepared in accordance with Australian Accounting Standards, other authoritative pronouncements of the Australian Accounting Standards Board including Interpretations and the Corporations Act 2001. For the purposes of preparing the consolidated financial statements the Company is a for-profit entity.
It is recommended that this financial report is read in conjunction with any public announcements made by Resource Generation Limited during the year, in accordance with continuous disclosure requirements arising under the Corporations Act 2001.
The accounting policies and methods of computation adopted in the preparation of the financial report are consistent with those adopted and disclosed in the company’s 2014 annual financial report for the year ended 30 June 2014, except for the impact of the Standards and Interpretations described below and the restatement of certain balances as set out in Note 3. These accounting policies are consistent with Australian Accounting Standards and with International Financial Reporting Standards.
The financial statements were approved by the Board of directors on 20 August 2015.
Compliance with IFRSThe financial report of Resource Generation Limited also complies with International Financial Reporting Standards (“IFRS”) as issued by the International Accounting Standards Board (“IASB”).
Going concernAs at 30 June 2015, the Group had net current assets of $18.0 million and made a loss of $4.9 million for the year. The Directors have prepared this financial report on a going concern basis, for the year ended 30 June 2015, after considering the following items:
• Cash position of $28.6 million.
• Key infrastructural aspects have been secured, such as mining rights, offtake agreements, port/rail agreements and water licences obtained.
• Sufficient financing has been secured for the next 12 months.
• Negotiations for project finance to complete the mine project are continuing. Funding of mobile equipment totalling approximately US$113 million is in place.
Basis of preparationThe consolidated financial statements have been prepared on the basis of historical cost, except for certain properties and financial instruments that are measured at revalued amounts or fair values at the end of each reporting period, as explained in the accounting policies below. Historical cost is generally based on the fair values of the consideration given in exchange for goods and services.
Fair value is the price that would be received to sell an asset or paid to transfer a liability in an orderly transaction between market participants at the measurement date, regardless of whether that price is directly observable or estimated using another valuation technique. In estimating the fair value of an asset or a liability, the Group takes into account the characteristics of the asset or liability if market participants would take those characteristics into account when pricing the asset or liability at the measurement date. Fair value for measurement and/or disclosure purposes in these consolidated financial statements is determined on such a basis, except for share-based payment transactions that are within the scope of AASB 2, leasing transactions that are within the scope of AASB 117 and measurements that have some similarities to fair value but are not fair value, such as net realisable value in AASB 102 or value in use in AASB 136.
In addition, for financial reporting purposes, fair value measurements are categorised into Level 1, 2 or 3 based on the degree to which the inputs to the fair value measurements are observable and the significance of the inputs to the fair value measurement in its entirety, which are described as follows:
• Level 1 inputs are quoted prices (unadjusted) in active markets for identical assets or liabilities that the entity can assess at the measurement date;
• Level 2 inputs are inputs, other than quoted prices included within Level 1, that are observable for the asset or liability, either directly or indirectly; and
• Level 3 inputs are unobservable inputs for the asset or liability.

29
Resource Generation Limited Annual Report 2015
Notes to the consolidated financial statements (cont.)
For the year ended 30 June 2015
b) Principles of consolidationSubsidiaries including development partnersThe consolidated financial statements incorporate the assets and liabilities of all subsidiaries of Resource Generation Limited as at 30 June 2015 and the results of all subsidiaries for the year then ended. Resource Generation Limited and its subsidiaries together are referred to in this financial report as the Group or the consolidated entity.
Control is achieved when the Company:
• has power over the investee;
• is exposed, or has rights, to variable returns from its involvement with the investee; and
• has the ability to use its power to affect its returns.
The Company reassesses whether or not it controls an investee if facts and circumstances indicate that there are changes to one or more of the three elements of control listed above.
Consolidation of a subsidiary begins when the Company obtains control over the subsidiary and ceases when the Company loses control of the subsidiary. Specifically, income and expenses of a subsidiary acquired or disposed of during the year are included in the consolidated statement of profit or loss and other comprehensive income from the date the Company gains control until the date when the Company ceases to control the subsidiary. Profit or loss and each component of other comprehensive income are attributed to the owners of the Company and to the non-controlling interests. Total comprehensive income of subsidiaries is attributed to the owners of the Company and to the non-controlling interests even if this results in the non-controlling interests having a deficit balance. When necessary, adjustments are made to the financial statements of subsidiaries to bring their accounting policies into line with the Group’s accounting policies. All intragroup assets and liabilities, equity, income, expenses and cash flows relating to transactions between members of the Group are eliminated in full on consolidation.
c) Segment reportingThe Group has adopted a “management approach” under which segment information is presented on the same basis as that used for internal reporting purposes, consistent with the internal reporting provided to the Board.
d) Foreign currency translation
(i) Functional and presentation currency
Items included in the financial statements of each of the Group’s entities are measured using the currency of the primary economic environment in which the entity operates (the functional currency). The consolidated financial statements are presented in Australian dollars, which is Resource Generation Limited’s presentation and functional currency.
(ii) Transactions and balances
In preparing the financial statements of each individual group entity, transactions in currencies other than the entity’s functional currency are recognised at the exchange rates prevailing at the dates of the transactions. At the end of each reporting period, monetary items denominated in foreign currencies are retranslated at the rates prevailing at that date. Non-monetary items carried at fair value are retranslated at the rates prevailing at the date when the fair value was determined. Non-monetary items that are measured in terms of historical cost in a foreign currency are not restated.
Exchange differences on monetary items are recognised in profit or loss in the period in which they arise except for:
• exchange differences on foreign currency borrowings relating to assets under construction for future productive use, which are included in the cost of those assets when they are regarded as an adjustment to interest costs on those foreign currency borrowings;
• exchange differences on transactions entered into in order to hedge certain foreign currency risks; and
• exchange differences on monetary items receivable from or payable to a foreign operation for which settlement is neither planned nor likely to occur (therefore forming part of the net investment in the foreign operation), which are recognised initially in other comprehensive income and reclassified from equity to profit and loss on repayment of the monetary items.

30 Notes to the consolidated financial statements (cont.)
For the year ended 30 June 2015
1 Summary of Significant Accounting Policies (cont)
(iii) Group companies
The results and financial position of the Group entities (none of which has the currency of a hyperinflationary economy) that have a functional currency different from the presentation currency are translated into the presentation currency as follows:
• Assets and liabilities for each balance sheet are translated at the closing rate at the date of that balance sheet.
• Income and expenses for each statement of comprehensive income are translated at average exchange rates over the period (unless this is not a reasonable approximation of the cumulative effect of the rates prevailing on the transaction dates, in which case income and expenses are translated at the dates of the transactions); and
• All resulting exchange rate differences are recognised in other comprehensive income and accumulated in equity.
On consolidation, exchange rate differences arising from the translation of any net investment in foreign entities, and of borrowings and other financial instruments designated as hedges of such investments, are recognised in other comprehensive income. When a foreign operation is sold or any borrowings forming part of the net investment are repaid, a proportionate share of such exchange differences are recognised in the profit or loss, as part of the gain or loss on sale where applicable.
Goodwill and fair value adjustments arising on the acquisition of a foreign entity are treated as assets and liabilities of the foreign entities and translated at the closing rate.
e) Revenue recognitionRevenue is measured at the fair value of the consideration received or receivable. Interest revenue is recognised on a time proportional basis using the effective interest method.
Interest income from a financial asset is recognised when it is probable that the economic benefits will flow to the Group and the amount of revenue can be measured reliably. Interest income is accrued on a time basis by reference to the principal outstanding and at the effective interest rate applicable, which is at the rate that exactly discounts future cash receipts through the expected life of the financial asset to that asset’s net carrying value on initial recognition.
f) Income TaxThe income tax expense or revenue for the period is the tax payable on the current period’s taxable income based on the applicable income tax rate for each jurisdiction adjusted by changes in deferred tax assets and liabilities attributable to temporary differences between the tax bases of assets and liabilities and their carrying amounts in the financial statements, and to unused tax losses.
The current income tax charge is calculated on the basis of tax laws at the end of the accounting period in the countries where the Group operates and generates taxable income. Management periodically evaluates positions taken where the tax regulation is subject to interpretation. It establishes provisions where appropriate on the basis of amounts expected to be paid to the tax authorities.
Deferred tax assets and liabilities are recognised for temporary differences at the tax rates expected to apply when the assets are recovered or liability settled, based on those tax rates which are enacted or substantially enacted. The relevant tax rates are applied to the cumulative amounts of deductible and taxable temporary differences to measure the deferred tax asset or liability. An exception is made for certain temporary differences arising on initial recognition of an asset or a liability. No deferred tax asset or liability is recognised in relation to these temporary differences if they arose in a transaction, other than a business combination, that at the time of the transaction did not affect either accounting profit or taxable profit or loss.
Deferred tax assets are recognised for deductible temporary differences and unused tax losses only if it is probable that future taxable amounts will be available to utilise those temporary differences and losses.
Deferred tax liabilities and assets are not recognised for temporary differences between the carrying amount and tax bases of investments in controlled entities where the parent entity is able to control the timing of the reversal of the temporary differences and it is probable that the differences will not reverse in the foreseeable future.
Deferred tax assets and liabilities are offset when there is a legally enforceable right to offset current tax assets and liabilities and when the deferred tax balances relate to the same taxation authority. Current tax assets and tax liabilities are offset where the entity has a legally enforceable right to offset and intends either to settle on a net basis, or to realise the asset and settle the liability simultaneously.

31
Resource Generation Limited Annual Report 2015
Notes to the consolidated financial statements (cont.)
For the year ended 30 June 2015
The Directors have not recognised any deferred tax assets in relation to carry forward unused tax losses. Given the history of operating losses the Directors have determined that the most appropriate time to recognise deferred tax assets from carry forward unused tax losses is when the mine commences production.
g) Cash and cash equivalentsFor cash flow statement presentation purposes, cash and cash equivalents includes cash on hand, deposits held at call with financial institutions, other short-term, highly liquid investments with original maturities of three months or less that are readily convertible to known amounts of cash and which are subject to an insignificant risk of changes in value, and bank overdrafts. Bank overdrafts are shown within borrowings in current liabilities on the balance sheet.
h) Impairment of assetsAssets that have an indefinite useful life are not subject to amortisation and are tested annually for impairment, or more frequently if events or changes in circumstances indicate that the carrying amount may not be recoverable. Other assets are tested for impairment whenever events or changes in circumstances indicate that the carrying amount may not be recoverable. An impairment loss is recognised for the amount by which the asset’s carrying amount exceeds its recoverable amount. The recoverable amount is the higher of an asset’s fair value less costs to sell and value in use. For the purposes of assessing impairment, assets are grouped at the lowest levels for which there are separately identifiable cash flows which are largely independent of the cash flows from other assets or groups of assets (cash generating units).
Where an impairment loss subsequently reverses, the carrying amount of the asset (cash-generating unit) is increased to the revised estimate of its recoverable amount, but only to the extent that the increased carrying amount does not exceed the carrying amount that would have been determined had no impairment loss been recognised for the asset (cash-generating unit) in prior years. A reversal of an impairment loss is recognised in profit and loss immediately.
The above principles of impairment also apply to mining tenements.
i) Trade and other payablesThese amounts represent liabilities for goods and services provided to the Group prior to the end of the financial period, which are unpaid. The amounts are unsecured and usually paid within 30 days of recognition.
j) ProvisionsProvisions are recognised when the Group has a present legal or constructive obligation as a result of past events, for which it is probable that an outflow of resources will be required to settle the obligation and the amount and the outflow can be reliably measured. Provisions are not recognised for future operating losses.
Provisions are measured at the present value of management’s best estimate of the expenditure required to settle the present obligation at the reporting date. The discount rate used to determine the present value reflects current market assessments of the time value of money and the risks specific to the liability. The increase in the provision due to the passage of time is recognised as an interest expense.
k) Contributed equityOrdinary shares are classified as equity. Incremental costs directly attributable to the issue of new shares or options are shown in equity as a deduction from the proceeds.
l) Earnings per sharei) Basic Earnings Per Share (“EPS”) is calculated
by dividing the result attributable to equity holders of the Group by the weighted average number of shares outstanding during the year.
ii) Diluted earnings per share adjusts the figures used to determine EPS to take into account:
• the after income tax effect of interest and other financing costs associated with dilutive potential ordinary shares; and
• the weighted average number of additional ordinary shares that would have been outstanding assuming the conversion of all dilutive potential ordinary shares.
m) Goods and services tax (GST); Value added tax (VAT)Revenues, expenses and assets are recognised net of the amount of GST, except where the amount of GST incurred is not recoverable from the Australian Taxation Office. In these circumstances the GST is recognised as part of the cost of acquisition of the asset or as part of an item of the expense. Receivables and payables in the balance sheet are shown inclusive of GST. The net amount of GST recoverable from the taxation authority is shown as a receivable in the balance sheet.
Cash flows are presented on a gross basis. The GST components of cash flows arising from investing or financing activities which are recoverable from, or payable to the taxation authority, are presented as operating cash flows.
The treatment for VAT, in relation to offshore entities, is consistent with the treatment of GST.
32 Notes to the consolidated financial statements (cont.)
For the year ended 30 June 2015
1 Summary of Significant Accounting Policies (cont)
n) DividendsProvision is made for the amount of any dividend declared, being appropriately authorised and no longer at the discretion of the entity, on or before the end of the financial year, but not distributed at balance date. No dividends were paid or proposed to be paid to members during the current year.
o) Non-controlling interestsNon-controlling interest, being that portion of the profit or loss and net assets of subsidiaries attributable to equity interest held by persons outside the Group, are shown separately within the equity section of the consolidated balance sheet and in the consolidated statement of comprehensive income.
p) Property, plant and equipmentProperty, plant and equipment is stated at historical cost less depreciation. Historical cost includes expenditure that is directly attributable to the acquisition of the items. Cost may also include transfers from equity of any gains/losses on qualifying cash flow hedges of foreign currency purchases of property, plant and equipment and borrowing costs capitalised during the construction of a qualifying asset.
The cost of improvements to or on leasehold properties is amortised over the unexpired period of the lease or the estimated useful life of the improvements to the Group, whichever is shorter.
Depreciation on assets is calculated on a straight-line basis to allocate their cost, net of their residual values, over their useful estimated lives as follows:
Plant and equipment 4-25 years, depending on the nature of the asset
Office equipment 1-10 years
Leasehold improvements 5 years
The asset’s residual values and useful lives are reviewed, and adjusted if appropriate, at each reporting date. An asset’s carrying amount is written down immediately to its recoverable amount if the asset’s carrying amount is greater than its estimated recoverable amount (Note1j).
q) Employee benefits
i) Short term and Long term employee benefits
A liability is recognised for benefits accruing to employees in respect of wages and salaries, annual leave, long service leave, and sick leave when it is probable that settlement will be required and they are capable of being measured reliably.
Liabilities recognised in respect of short-term employee benefits, are measured at their nominal values using the remuneration rate expected to apply at the time of settlement.
Liabilities recognised in respect of long term employee benefits are measured as the present value of the estimated future cash outflows to be made by the Group in respect of services provided by employees up to reporting date.
ii) Retirement benefit obligations
Contributions to superannuation funds by the consolidated entity are expensed in the year they are paid or become payable.
r) Share-based paymentsShare-based compensation benefits are provided to employees via the Resource Generation Limited Employee Share Plan.
The fair value of performance share rights granted under the Resource Generation Limited Employee Share Plan is recognised as an employee benefit expense with a corresponding increase in equity. The assessed fair value at grant date of performance share rights granted to individuals is allocated equally over the period from grant date to vesting date. The value attached to the performance share rights is the share price on the day of issue.
For options issued and approved by shareholders, fair values at grant date are determined using a binomial pricing model that takes into account exercise price, the term of the option, the impact of dilution, the share price at grant date and expected price volatility of the underlying share, the expected dividend yield and the risk-free interest rate for the term of the option.
s) LeasesLeases of property plant and equipment where the Group, as lessee, has substantially all the risks and rewards of ownership are classified as finance leases. Finance leases are capitalised at the lease’s inception at the fair value of the leased property or, if lower, the present value of the minimum lease payments. The corresponding rental obligations, net of finance charges, are included in other short term and long term payables. Each lease payment is allocated between the liability and finance cost. The finance cost is charged to profit and loss over the lease period so as to produce a constant periodic rate of interest on the remaining balance of the liability for each period. The property, plant and equipment acquired under finance leases is depreciated over the asset’s useful life and the lease term if there is no reasonable certainty that the Group will obtain ownership at the end of the lease term.
33
Resource Generation Limited Annual Report 2015
Notes to the consolidated financial statements (cont.)
For the year ended 30 June 2015
Leases in which a significant portion of the risks and rewards of ownership are not transferred to the Group as lessee are classified as operating leases. Payments made under operating leases (net of any incentives received from the lessor) are charged to profit and loss on a straight-line basis over the period of the lease.
Lease income from operating leases where the Group is a lessor is recognised in income on a straight line basis over the lease term.
t) Investments and other financial assetsClassificationThe Group classifies its financial assets in the following categories: financial assets at fair value through profit and loss, loans and receivables, held-to-maturity investments and available-for-sale financial assets. The classification depends on the purpose for which the investments were acquired. Management determines the classification of its investments at initial recognition and, in the case of assets classified as held to maturity, re-evaluates the designation at each reporting date.
i) Loans and receivables
Loans and receivables are non-derivative financial assets with fixed or determinable payments that are not quoted in an active market and are subsequently measured at amortised cost using the effective interest rate method. Loans and receivables are included in trade and other receivables (Notes 9 & 13).
DerecognitionFinancial assets are derecognised where the contractual right to receipt of cash flows expires or the asset is transferred to another party, whereby the entity no longer has any significant continuing involvement in the risks and benefits associated with the asset. Financial liabilities are derecognised where the related obligations are either discharged, cancelled or expire. The difference between the carrying value of the financial liability extinguished or transferred to another party and the fair value of consideration paid, including the transfer of non-cash assets to liabilities assumed, is recognised in profit or loss.
ImpairmentThe Group assesses at each balance date whether there is objective evidence that a financial asset or group of financial assets is impaired. In the case of equity securities classified as available-for-sale, significant or prolonged decline in the fair value of a security below its costs is considered as an indicator that the security is impaired. If any such evidence exists for available-for-sale financial assets, the cumulative loss (measured as the difference between the acquisition costs and the current fair value, less
any impairment loss on that financial asset previously recognised in profit or loss) is removed from equity and recognised in the profit and loss. Impairment losses recognised in the profit and loss on equity instruments classified as available-for-sale are not reversed through the profit and loss.
If there is evidence of impairment for any of the Group’s financial assets carried at amortised cost, the loss is measured as the difference between the asset’s carrying amount and the present value of estimated future cash flows, excluding future credit losses that have not been incurred. The cash flows are discounted at the financial asset’s original effective interest rate. The loss is recognised in the profit and loss.
u) Borrowing costsBorrowing costs directly attributable to the acquisition, construction or production of qualifying assets, which are assets that necessarily take a substantial period of time to get ready for their intended use or sale, are added to the cost of those assets, until such time as the assets are substantially ready for their intended use or sale.
All other borrowing costs are recognised in profit or loss in the period in which they are incurred.
v) Comparative figuresWhen required by accounting standards, comparative figures have been adjusted to conform to changes in presentation for the current financial year.
w) New accounting standards and interpretationsIn the current year the Group has adopted all of the new and revised Standards and Interpretations issued by the Australian Accounting Standards Board (AASB) that are relevant to their operations and effective for the current year.
• AASB 1031 ‘Materiality’. An interim standard that cross references to other standards and the Framework for the Preparation and Presentation of Financial Statements (issued December 2013) that contain guidance on materiality.
• AASB 2013-9 ‘Amendments to Australian Accounting Standards’ – Part B: ‘Materiality’.
• AASB 2014-1 ‘Amendments to Australian Accounting Standards’ – Part C: ‘Materiality’ This is an amending standard to delete references to AASB 1031 and make various editorial corrections.
The Company has reviewed the above Accounting Standards and determined that they have no material impact on the financial report for the year ended 30 June 2015.

34 Notes to the consolidated financial statements (cont.)
For the year ended 30 June 2015
1 Summary of Significant Accounting Policies (cont)
x) Standards and Interpretations in issue not yet adoptedAt the date of authorisation of the financial statements, the Standards and Interpretations in issue but not yet effective are listed below. The impact of these has not been determined by the Group.
• AASB 2012-3 ‘Amendments to Australian Accounting Standards-Offsetting Financial Assets and Financial Liabilities’
• AASB 2013-3 ‘Amendments to Australian Accounting Standards-Recoverable Amount Disclosures for Non-Financial Assets’
• Interpretation 21 ‘Levies’
• AASB 9 ‘Financial Instruments’
• AASB 15 ‘Revenue from contracts with customers’
y) Parent entity financial informationThe financial information for the parent entity, Resource Generation Limited, disclosed in note 31, has been prepared on the same basis as the consolidated financial statements, except as set out below.
Investments in subsidiaries, associates and joint venturesInvestments in subsidiaries, associates and joint ventures are accounted for at cost in the financial statements of Resource Generation Limited. Dividends received from associates are recognised in the parent entity’s profit or loss, rather than being deducted from the carrying amount of these investments.
z) Exploration and development assets and mining tenementsExploration, evaluation and development costs are accumulated in respect of each separate area of interest. Exploration and evaluation costs are expensed as incurred and only carried forward where there is certainty that the right of tenure of the area of interest is current and they are expected to be recouped through sale or successful development and exploitation of the area of interest.
Development costs related to an area of interest are carried forward to the extent that they are expected to be recouped either through sale or successful exploitation of the area of interest.
When an area of interest is abandoned or the directors decide that it is not commercial, any accumulated costs in respect of that area are written off in the financial year the decision is made. Each area of interest is also reviewed at the end of each accounting year and accumulated costs impaired to the extent that they will not be recoverable in the future. Mining tenements are recognised at cost, after provision for impairment.
2 Financial risk management
The Group’s activities expose it to a variety of financial risks: market risk (including currency risk, interest rate risk and price risk), credit risk and liquidity risk. The Group’s overall risk management programme focuses on the unpredictability of financial markets and seeks to minimise potential adverse effects on the financial performance of the Group.
Risk management is carried out by the Board of directors and management under policies approved by the Board. The Board and management identify and evaluate financial risks and provide principles for overall risk management.
a) Market risk
i) Interest rate risk
The Group is not exposed to any material interest rate risk as the USD borrowing is fixed at 10.75% per annum.
ii) Foreign currency risk
The Group operates internationally and is exposed to currency exposures in respect of the South African Rand in relation to the development and exploration activities in South Africa and the US Dollar in respect of borrowings. Foreign exchange risk is managed through the holding of deposits in South African Rand to match forecast expenditure over the near term. The foreign exchange exposure is not hedged. If the South African rand weakened/strengthened by 10% since 30 June 2015 there would have been no impact on the Group’s net loss after tax. Other components of equity would not have been affected, with the exception of the foreign currency translation reserve which would have been increased/decreased by $A2,159K (2014 $A2,836K) with a 10% movement.
The Group’s exposure to foreign currency risk at the reporting date was as follows:
2015 Rand ’000
2014 Rand ’000
Cash at Bank (South Africa & Mauritius) 43,960 180,284
VAT Receivable 1,639 3,664
Deposits in respect of mining related licences 18,002 16,219
Royalty payable 30,000 30,000
Creditors and accruals 50,976 82,726
USD ’000
USD ’000
Borrowing 20,000 20,000

35
Resource Generation Limited Annual Report 2015
Notes to the consolidated financial statements (cont.)
For the year ended 30 June 2015
iii) Price risk
The Group is not exposed to equity securities price risk as it holds no investments in securities classified on the balance sheet either as available-for-sale or at fair value through profit or loss. The Group is exposed to commodity price risk to the extent it relates to funding activities.
b) Credit riskThe maximum exposure to credit risk, excluding the value of any collateral or other security, at balance date to recognised financial assets, is the carrying amount, net of any provisions for impairment of those assets, as disclosed in the balance sheet and notes to the financial statements.
The Group has no material credit risk exposure to any single receivable or receivables under financial instruments entered into by the Group.
Credit risk arises from cash and cash equivalents and deposits with banks and financial institutions. For banks and financial institutions only independently rated parties with a minimum rating by Standard & Poors of “A” are accepted.
c) Liquidity riskPrudent liquidity risk management implies maintaining sufficient cash to meet commitments as and when they fall due. Cash flow forecasting monitors liquidity requirements. The Group has $7.320m (2014 $8.377m) in trade and other payables as at 30 June 2015, all of which are due within 6 months.
d) Cash flow and fair value interest rate riskAs the Group has no variable interest-bearing liabilities, its income and operating cash flows are not materially exposed to changes in market interest rates. The Group has $28.427m (2014 $54.275m) in interest bearing accounts which is subject to movements in interest rates. At the current level of interest rates, any risk is considered minimal.
e) Fair value estimationIn estimating the fair value of an asset or a liability, the Group uses market-observable data to the extent it is available. Where Level 1 inputs are not available, the Group engages third party qualified valuers to perform the valuation.
3 Critical accounting estimates and judgements
The preparation of financial statements in conformity with Australian Accounting Standards requires the use of certain critical accounting estimates. It also requires management to exercise its judgement
in the process of applying the Group’s accounting policies. The areas involving a higher degree of judgement or complexity, or areas where assumptions and estimates are significant to the financial statements, are disclosed below.
Estimates and judgements are continually evaluated and are based on historical experience and other factors, including expectations of future events that may have a financial impact on the entity and that are believed to be reasonable under the circumstances. The estimates and assumptions that have a significant risk of causing a material adjustment to the carrying amounts of assets and liabilities within the next financial year are discussed below.
The accounting policies and methods of computation adopted in the preparation of the financial report are consistent with those adopted and disclosed in the company’s financial report for the year ended 30 June 2014, except for the impact of the Standards and Interpretations described above and the reclassification of certain balances as set out in note 3. These accounting policies are consistent with Australian Accounting Standards and with International Financial Reporting Standards.
Development expenditure Development expenditure incurred by or on behalf of the consolidated entity is accumulated separately for each area of interest in which economically recoverable reserves have been identified to the satisfaction of the directors. Such expenditure comprises direct costs plus overhead expenditure incurred which can be directly attributable to the development process, in accordance with AASB116 ‘Property, Plant & Equipment’.
All expenditure incurred prior to the commencement of commercial levels of production from each area of interest is carried forward to the extent which recoupment out of revenue to be derived from the sale of production from the area of interest or, by its sale, is reasonably assured. Once commercial levels of production commence, the development expenditure in respect of that area of interest will be depreciated on a straight line basis, based upon an estimate of the life of the area of interest.
Expenditure on the Boikarabelo mine has been fully capitalised as per note 12. The Group is confident of the full recovery of the expenditure on the Boikarabelo mine on the basis of the financial modelling of the mine incorporating forecast production and sales levels and capital expenditure.

36 Notes to the consolidated financial statements (cont.)
For the year ended 30 June 2015
3 Critical accounting estimates and judgements (cont)
Restatement/reclassification of prior year balancesa) Development expenditure
During the year, the Directors have reassessed the status of the Boikarabelo project, the nature and timing of fund raising activities and expenditure incurred in order to determine the appropriate timing for the transition from evaluation and exploration activities (accounted for under AASB 6 Exploration for and Evaluation of Mineral Resources) to mining development and construction activities (accounted for under AASB 116 Property, Plant and Equipment). This transition is determined by assessing whether the technical feasibility and commercial viability of the project are demonstrable and includes a consideration of various factors specific to the project, including the status and level of committed funding.
Whilst noting that such a determination is judgemental, the Directors have concluded that the most appropriate timing of the transition was during the year ended 30 June 2014. Accordingly, the Consolidated statement of financial position and the Consolidated statement of cash flows have been restated to reflect this position. Capitalised expenditure which was previously classified as ‘Mining tenements and exploration’ is now being reflected as ‘Mining tenements and mining development’ and cash flows previously classified as ‘Payments for mining tenements and exploration’ is now being reflected as ‘Payments for mining tenements and mining development’.
The Directors note that this change has no impact on the Consolidated statement of profit or loss and other comprehensive income, the Consolidated statement of changes in equity, the amounts being capitalised nor the net asset position or total non-current asset line items. This change had no impact on basic and diluted loss per share for the year ended 30 June 2014.
30-JUN-14
As previously stated $’000
Reclassi- fication/ restatement $’000
As restated $’000
Consolidated statement of financial position
Mining tenements and exploration 114,913 (114,913) –
Mining tenements and mining development – 114,913 114,913
Total non-current assets 177,105 – 114,913
Total Assets 231,996 – 231,996
Consolidated statement of cash flows
Payments for mining tenements and exploration (22,926) 22,926 –
Payments for mining tenements and mining development – (22,926) (22,926)
Net cash outflow from investing activities (26,770) – (26,770)

37
Resource Generation Limited Annual Report 2015
Notes to the consolidated financial statements (cont.)
For the year ended 30 June 2015
b) Translation of foreign operationsDuring the year the directors changed the method for the translation of foreign operations to be in line with AASB 121 The Effects of Changes in Foreign Exchange Rates. Certain non monetary items, as noted below, were previously translated at historical exchange rates and are now translated using the closing rate at the end of the reporting period as required by AASB 121 The Effects of Changes in Foreign Exchange Rates.
The Directors note that this change has no impact on the Consolidated statement of cash flows nor the basic and diluted loss per share for the year ended 30 June 2014 and 30 June 2013.
30-JUN-14
As previously stated $’000
Restatement $’000
As restated $’000
Loss for the year (1,042) – (1,042)
Exchange differences on translation of foreign operations (2,238) (7,485) (9,723)
Total comprehensive income (3,280) (7,485) (10,765)
Total comprehensive income for year is attributable to: Owners of Resource Generation Limited
Consolidated statement of financial position
Property, plant and equipment 45,269 (11,902) 33,367
Mining tenements and mining development 114,913 (11,383) 103,530
Total non-current assets 177,105 (23,285) 153,820
TOTAL ASSETS 231,996 (23,285) 208,711
Equity 223,622 – 223,622
Reserves 15,512 (25,602) (10,090)
TOTAL EQUITY 199,009 (23,285) 175,724
30-JUN-13
As previously stated $’000
Restatement $’000
As restated $’000
Loss for the year (2,813) – (2,813)
Exchange differences on translation of foreign operations (471) (15,800) (16,271)
Total comprehensive income (3,284) (15,800) (19,084)
Total comprehensive income for year is attributable to: Owners of Resource Generation Limited
Consolidated statement of financial position
Property, plant and equipment 43,632 (9,122) 34,510
Mining tenements and mining development 88,780 (6,678) 82,102
Total non-current assets 145,216 (15,800) 129,416
TOTAL ASSETS 167,511 (15,800) 151,711
Equity 159,753 – 159,753
Reserves 12,530 (15,800) (3,270)
TOTAL EQUITY 135,517 (15,800) 119,717

38 Notes to the consolidated financial statements (cont.)
For the year ended 30 June 2015
4 Segment information
4.1 Description of segmentsManagement has determined the segments based upon reports reviewed by the Board that are used to make strategic decisions. The Board considers the business from both a business and geographic perspective, with the Board being the central decision maker.
Business segmentsThe Group has coal interests in South Africa. The main priority is to develop its coal resources in the Waterberg region of South Africa. Management has determined mining development to be the critical reportable segment. Corporate administration reflects other corporate costs and includes equity raisings and administration costs.
4.2 Segment revenues and results
SEGMENT REVENUE SEGMENT PROFIT
Year ended 30/6/15 $’000
Year ended 30/6/14 $’000
Year ended 30/6/15 $’000
Year ended 30/6/14 $’000
Mining tenements and mining development 454 1,262 (6,791) (470)
Corporate – unallocated 223 3,533 1,842 (572)
Total for continuing operations 677 4,795 (4,949) (1,042)
Segment revenue is primarily interest income as disclosed in Note 5.
The accounting policies of the reportable segments are the same as the Group’s accounting policies described in Note 1. The mining tenements and mining development segment profit represents the profit earned by that segment without allocation of central administration costs and directors’ salaries, share of profits of associates, gains and losses, finance costs and income tax expense, all of which are included in the corporate segment. This is the measure reported to the chief operating decision maker for the purposes of resource allocation and assessment of segment performance.
4.3 Segment asset and liabilities
2015 $’000
2014 $’000
Segment assets
Mining tenements and mining development 199,378 172,248
Corporate – unallocated 24,067 36,463
223,445 208,711
Segment liabilities
Mining tenements and mining development 43,896 32,084
Corporate – unallocated 1,213 903
45,109 32,987
4.4 Other segment information
DEPRECIATION AND AMORTISATION
ADDITIONS TO LAND, PROPERTY, PLANT AND EQUIPMENT
Year ended 30/6/15 $’000
Year ended 30/6/14 $’000
Year ended 30/6/15 $’000
Year ended 30/6/14 $’000
Mining tenements and mining development 357 180 331 1,880
Corporate – unallocated 47 81 45 18
Total 404 261 376 1,898

39
Resource Generation Limited Annual Report 2015
Notes to the consolidated financial statements (cont.)
For the year ended 30 June 2015
4.5 Other segment information – mining assets
ADDITIONS TO MINING
ASSETS
Year ended 30/6/15 $’000
Year ended 30/6/14 $’000
Mining tenements and mining development 32,392 26,133
Corporate – unallocated – –
32,392 26,133
4.6 Geographical information
REVENUE FROM EXTERNAL CUSTOMERS NON-CURRENT ASSETS
Year ended 30/6/15 $’000
Year ended 30/6/14 $’000
Year ended 30/6/15 $’000
Year ended 30/6/14 $’000
Australia 223 3,533 52 54
South Africa 454 1,262 194,435 153,766
677 4,795 194,487 153,820
5 Total revenue
CONSOLIDATED
2015 $’000
2014 $’000
Interest earned 677 2,294
677 2,294
Other
Forfeited share deposit – 2,500
Other – 1
– 2,501
Total 677 4,795
6 Expenses
The loss before income tax includes the following specific expenses
CONSOLIDATED
2015 $’000
2014 $’000
Depreciation 404 261
Employee benefits expense – salaries and other 1,606 1,411
Finance expenses 2,729 1,182
Share based compensation 797 1,635
Foreign exchange gain (1,070) –

40 Notes to the consolidated financial statements (cont.)
For the year ended 30 June 2015
7 Income tax expense
CONSOLIDATED
2015 $’000
2014 $’000
a) Income tax expense
Current tax 5 7
Deferred tax – –
Under (over) provided in prior years – –
5 7
Income tax expense is attributable to:
Profit/ (Loss) from continuing operations 5 7
Loss from discontinued operations – –
Aggregate income tax expense 5 7
Deferred income tax (revenue) expense included in income tax expense comprises:
Decrease (increase) in deferred tax assets – –
(Decrease) increase in deferred tax liabilities – –
– –
b) Numerical reconciliation of income tax expense to prima facie tax payable
Loss from continuing operations before income tax expense (4,944) (1,035)
Tax at the Australian rate of 30% – –
Tax benefit at the Australian rate of 30% (1,483) (311)
Tax effect of amounts which are not deductible (taxable) in calculating taxable income:
Share based payments 239 491
Income tax benefit not recognised 1,249 (173)
Income tax expense 5 7
c) Tax losses
Unused tax losses for which no deferred tax asset has been recognised: 10,928 11,419
Potential tax benefit at respective tax rates (Aust:30%, RSA:28%) 3,278 3,426
Unused tax losses will not be brought to account until such time as it is probable the Group will be in a position to utilise them.
8 Current Assets – cash and cash equivalents
CONSOLIDATED
2015 $’000
2014 $’000
Cash at bank and in hand 124 63
Deposits at call 28,427 54,274
28,551 54,337

41
Resource Generation Limited Annual Report 2015
Notes to the consolidated financial statements (cont.)
For the year ended 30 June 2015
9 Current Assets – trade and other receivables
CONSOLIDATED
2015 $’000
2014 $’000
Receivables 1 3
Government tax refund 199 411
200 414
10 Deposits and prepayments
CONSOLIDATED
2015 $’000
2014 $’000
Prepayments 54 18
Deposits 153 122
207 140
11 Non-current assets – land, property, plant and equipment
CONSOLIDATED
Land & Buildings $’000
Computer Equipment $’000
Office Equipment $’000
Motor Vehicles $’000
Total $’000
Opening net book value 30 June 2013 (restated) 34,031 136 25 318 34,510
Additions 1,050 106 157 589 1,902
Disposals – (5) – – (5)
Depreciation (10) (101) (21) (129) (261)
Effect of foreign exchange differences (2,675) (22) (9) (73) (2,779)
Closing net book value 30 June 2014 (restated) 32,396 114 152 705 33,367
Additions 56 165 20 135 376
Disposals – – – (75) (75)
Depreciation (4) (150) (36) (214) (404)
Effect of foreign exchange differences 2,066 25 (7) 116 2,200
Closing net book value 30 June 2015 34,514 154 129 667 35,464
Assets at cost 44,252 499 195 1,062 46,008
Accumulated depreciation (20) (348) (66) (408) (842)
Effect of foreign exchange differences (9,718) 3 – 13 (9,702)
Closing net book value 30 June 2015 34,514 154 129 667 35,464
The foreign exchange differences reflect the volatility of the exchange rate between the Australian dollar and the South African Rand. The exchange rates at the years ended 30 June were 9.373 in 2015, 9.9694 in 2014 and 9.2103 in 2013.

42 Notes to the consolidated financial statements (cont.)
For the year ended 30 June 2015
12 Mining tenements and mining development
CONSOLIDATED
2015 $’000
2014 $’000 (restated)
Mining tenements and mining development 140,539 103,530
The Boikarabelo mine
Mining tenements of 100% of Resgen Africa Holdings Limited
Opening net book value 50,677 33,409
Additions/movements 32,913 25,484
Effect of foreign exchange differences 4,174 (8,216)
Closing net book value 87,764 50,677
Mining tenements of 100% of Resgen South Africa (Pty) Limited
Opening net book value 52,853 55,371
Additions/movements (520) 649
Effect of foreign exchange differences 442 (3,167)
Closing net book value 52,775 52,853
Total Boikarabelo mine 140,539 103,530
Carrying value at year end 140,539 103,530
The Boikarabelo mine is the name given to the project for the development of the coal tenements in South Africa. It incorporates the assets acquired and development expenditure for Resgen Africa Holdings Limited, including tenements held by Ledjadja Coal (Pty) Limited, and Resgen South Africa (Pty) Limited, including tenements held by Waterberg One Coal (Pty) Limited. The realisation of the assets of the Boikarabelo mine is dependent upon the successful development of the coal reserves.
13 Non-current assets – deposits and loan receivables
CONSOLIDATED
2015 $’000
2014 $’000
Deposit mining related licences 2,007 1,618
Loan to BEE partner 16,477 15,305
18,484 16,923
The Group has loaned its black economic empowerment (BEE) partner, Fairy Wing Trading 136 (Pty) Limited, 80 million Rand ($11.5 million) to facilitate its 26% acquisition of Ledjadja Coal (Pty) Limited and 39 million Rand ($4.1 million) to fund its 26% acquisition of Waterberg One Coal (Pty) Limited. The loans are secured over the BEE’s shares in Ledjadja and Waterberg One. Interest on the loan has been deferred from 1 January 2014 until commencement of coal production at the Boikarabelo mine at which time interest will be payable at the prime rate quoted by the Standard Bank of South Africa plus 3%. The loan is repayable at call.
14 Current liabilities – trade and other payables
CONSOLIDATED
2015 $’000
2014 $’000
Trade payables 2,746 4,433
Other payables – accrued expenditure 4,574 3,944
7,320 8,377

43
Resource Generation Limited Annual Report 2015
Notes to the consolidated financial statements (cont.)
For the year ended 30 June 2015
15 Current liabilities – provisions
CONSOLIDATED
2015 $’000
2014 $’000
Employee benefits – annual leave and sick leave 987 788
987 788
16 Non-current liabilities – provisions
CONSOLIDATED
2015 $’000
2014 $’000
Employee benefits – Long service leave 204 38
204 38
17 Non-current liabilities – royalties payable
CONSOLIDATED
2015 $’000
2014 $’000
Royalties payable 2,716 2,553
2,716 2,553
Royalties are payable upon the commencement of production. The royalty is calculated on the basis of 2 Rand per tonne of coal extracted and sold from the Boikarabelo mine to a maximum of 15.0 million tonnes. The royalty payable is discounted to present value in line with anticipated production, using a discount rate of 4%.
18 Current liabilities – borrowings
CONSOLIDATED
2015 $’000
2014 $’000
Current liabilities
EHL loan 1,802 –
Noble loan 859 –
Borrowings – unsecured 2,661 –
EHL loanEHL Energy (Pty) Limited are building the electricity sub-station at the Boikarabelo mine which connects the mine to the grid. The construction is subject to a deferred payment plan, with interest payable at the ABSA Bank prime lending rate plus 3%. The loan is unsecured and repayable in 16 quarterly instalments 21 days after the work is due to be completed at the end of October 2015.
Noble loanThe first repayment instalment of the loan from Noble Resources International Pte Ltd (Noble Group) is due in June 2016, as detailed in Note 19.
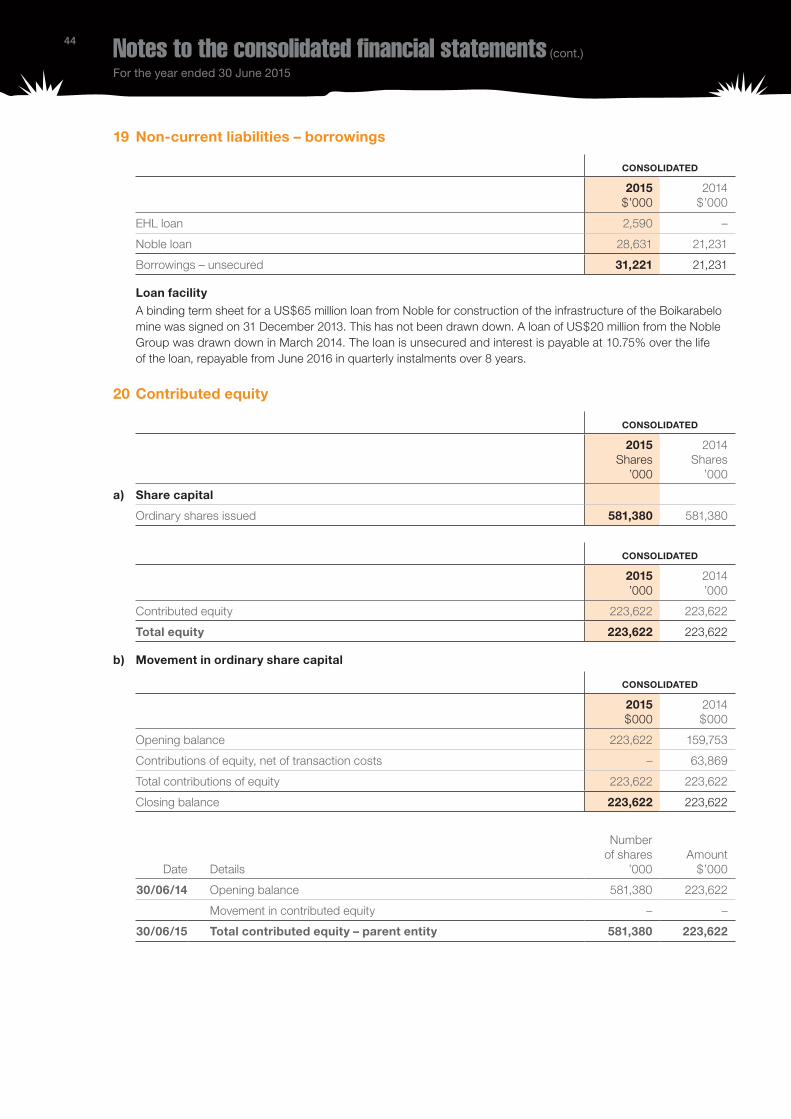
44 Notes to the consolidated financial statements (cont.)
For the year ended 30 June 2015
19 Non-current liabilities – borrowings
CONSOLIDATED
2015 $’000
2014 $’000
EHL loan 2,590 –
Noble loan 28,631 21,231
Borrowings – unsecured 31,221 21,231
Loan facilityA binding term sheet for a US$65 million loan from Noble for construction of the infrastructure of the Boikarabelo mine was signed on 31 December 2013. This has not been drawn down. A loan of US$20 million from the Noble Group was drawn down in March 2014. The loan is unsecured and interest is payable at 10.75% over the life of the loan, repayable from June 2016 in quarterly instalments over 8 years.
20 Contributed equity
CONSOLIDATED
2015 Shares ’000
2014 Shares ’000
a) Share capital
Ordinary shares issued 581,380 581,380
CONSOLIDATED
2015 ’000
2014 ’000
Contributed equity 223,622 223,622
Total equity 223,622 223,622
b) Movement in ordinary share capital
CONSOLIDATED
2015 $000
2014 $000
Opening balance 223,622 159,753
Contributions of equity, net of transaction costs – 63,869
Total contributions of equity 223,622 223,622
Closing balance 223,622 223,622
Date Details
Number of shares ’000
Amount $’000
30/06/14 Opening balance 581,380 223,622
Movement in contributed equity – –
30/06/15 Total contributed equity – parent entity 581,380 223,622
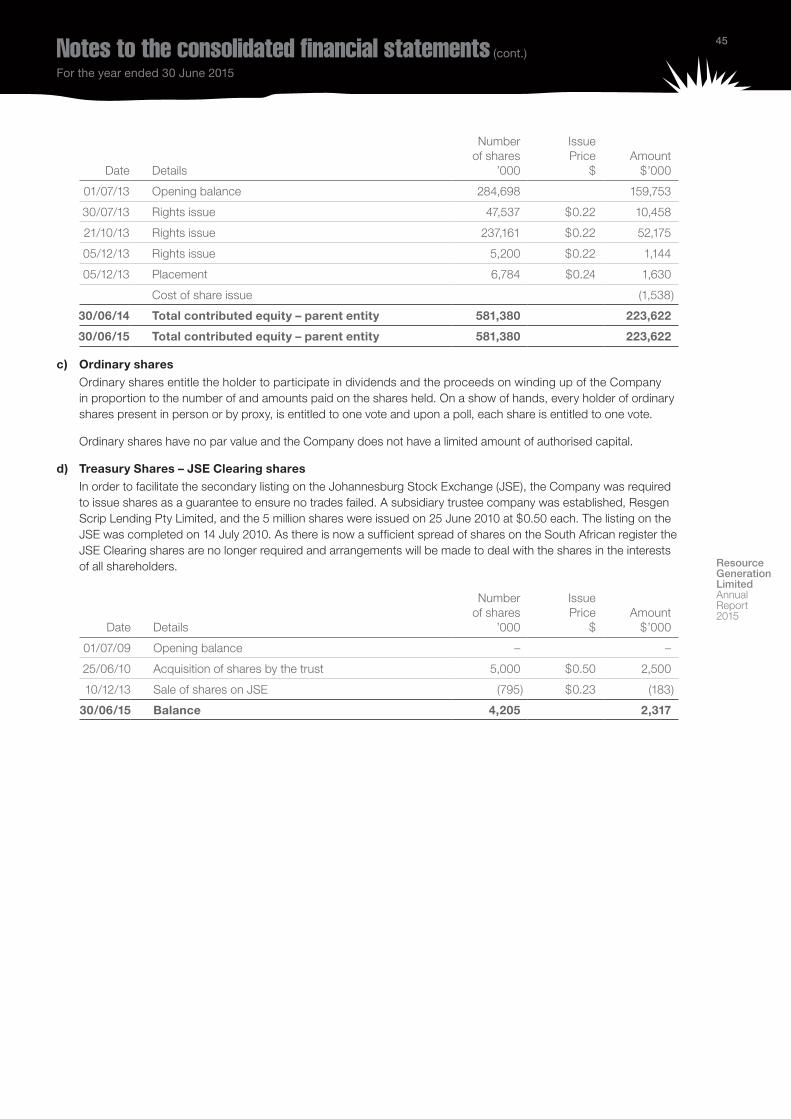
45
Resource Generation Limited Annual Report 2015
Notes to the consolidated financial statements (cont.)
For the year ended 30 June 2015
Date Details
Number of shares ’000
Issue Price $
Amount $’000
01/07/13 Opening balance 284,698 159,753
30/07/13 Rights issue 47,537 $0.22 10,458
21/10/13 Rights issue 237,161 $0.22 52,175
05/12/13 Rights issue 5,200 $0.22 1,144
05/12/13 Placement 6,784 $0.24 1,630
Cost of share issue (1,538)
30/06/14 Total contributed equity – parent entity 581,380 223,622
30/06/15 Total contributed equity – parent entity 581,380 223,622
c) Ordinary sharesOrdinary shares entitle the holder to participate in dividends and the proceeds on winding up of the Company in proportion to the number of and amounts paid on the shares held. On a show of hands, every holder of ordinary shares present in person or by proxy, is entitled to one vote and upon a poll, each share is entitled to one vote.
Ordinary shares have no par value and the Company does not have a limited amount of authorised capital.
d) Treasury Shares – JSE Clearing sharesIn order to facilitate the secondary listing on the Johannesburg Stock Exchange (JSE), the Company was required to issue shares as a guarantee to ensure no trades failed. A subsidiary trustee company was established, Resgen Scrip Lending Pty Limited, and the 5 million shares were issued on 25 June 2010 at $0.50 each. The listing on the JSE was completed on 14 July 2010. As there is now a sufficient spread of shares on the South African register the JSE Clearing shares are no longer required and arrangements will be made to deal with the shares in the interests of all shareholders.
Date Details
Number of shares ’000
Issue Price $
Amount $’000
01/07/09 Opening balance – –
25/06/10 Acquisition of shares by the trust 5,000 $0.50 2,500
10/12/13 Sale of shares on JSE (795) $0.23 (183)
30/06/15 Balance 4,205 2,317

46 Notes to the consolidated financial statements (cont.)
For the year ended 30 June 2015
20 Contributed equity (cont)
e) 2015There were no equity movements during the current financial year.
Employee share scheme issuesInformation relating to the employee share scheme, including details of shares issued under the scheme is set out in note 19 (h)
f) SHARE BASED PAYMENT RESERVE
Number of options 2015 ’000
Value of options 2015 $000
Number of options 2014 ’000
Value of options 2014 $000
Share based payments reserve
Options
Options granted previously and expired – 17,682 – 17,682
Closing balance – 17,682 – 17,682
Performance share rights
Opening balance 24,700 1,815 4,000 180
Employee share plan expense – apportionment of share rights over entitlement period 500 1,547 20,700 1,635
*Performance rights cancelled (3,500) (750) – –
Closing balance 21,700 2,612 24,700 1,815
Total options and performance share rights 21,700 20,294 24,700 19,497
* Performance rights cancelled in respect of termination of employment. Performance hurdles in respect of these share rights related to milestones during construction and initial coal production.
g) Movement in optionsThere are no options on issue as at 30 June 2015. All previously issued options expired by 30 June 2014.
h) Movement in performance share rights
Date Details
Number of rights ’000 Issue price
Amount $
30/06/13 Balance 4,000 – 180
28/01/14 Performance rights issue 20,700 – –
30/06/14 Share based compensation – – 1,635
01/01/15 Performance rights cancelled (3,500) – (750)
30/06/15 Performance rights issue 500 – –
30/06/14 Share based compensation – – 1,547
30/06/15 Balance 21,700 2,612
As at 30 June 2015 there are 12 holders of the total performance rights of 21.7 million. There are no voting rights attached to performance rights. The terms and conditions are the same as those disclosed in the Remuneration Report.

47
Resource Generation Limited Annual Report 2015
Notes to the consolidated financial statements (cont.)
For the year ended 30 June 2015
21 Reserves and accumulated losses
CONSOLIDATED
2015 $000
2014 $000 (restated)
a) Reserves
Other contributed equity 1,085 1,085
Treasury shares – refer Note 20(d) (2,317) (2,317)
Share based payment reserve 20,294 19,497
Foreign currency translation reserve (21,591) (28,355)
(2,529) (10,090)
Movement in reserves
Other contributed equity
Opening balance 1,085 –
Movement for the period – 1,085
Balance at the end of the year 1,085 1,085
Treasury shares
Opening balance (2,317) (2,500)
Movement for the period – 183
Balance at the end of the year (2,317) (2,317)
Share based payment reserve
Balance at the beginning of the year 19,497 17,862
Employee share plan expense 797 1,635
Balance at the end of the year 20,294 19,497
Foreign currency reserve
Opening balance (restated) (28,355) (18,632)
Movement for the period 6,764 (9,723)
Balance at the end of the year (21,591) (28,355)
Foreign currency reserve movements represent a depreciation of the AUD against the USD of 18.5%
b) Retained earnings
Opening balance (37,808) (36,766)
Loss for the year (4,949) (1,042)
Balance at the end of the year (42,757) (37,808)

48 Notes to the consolidated financial statements (cont.)
For the year ended 30 June 2015
22 Remuneration of auditors
During the year the following fees were paid or are payable for services provided by the auditor of the Company:
CONSOLIDATED
2015 $
2014 $
a) Deloitte Touche Tohmatsu Australia
Audit and review of financial reports 105,604 97,779
105,604 97,779
b) Related practices of Deloitte Touche Tohmatsu Australia
Taxation and JSE sponsor services 41,842 13,000
Corporate consulting (South Africa) 29,208 191,134
71,050 204,134
It is the Company’s policy to employ the auditor on assignments additional to their statutory audit duties where the auditor’s expertise and experience with the Company are important. These assignments are where Deloitte Touche Tohmatsu is awarded assignments on a competitive basis. It is the Company’s policy to seek competitive tenders for all major material consulting projects.
23 Related party transactions
a) Key management personnelDisclosures relating to key management personnel are set out in detail in the remuneration disclosures to the Directors’ Report.
CONSOLIDATED
2015 $
2014 $
Short-term employee benefits 2,235,323 2,102,605
Long term benefits (superannuation) 111,067 90,202
Long term benefits (long service leave) 158,957 35,149
Share-based payments 715,891 1,513,868
Rental and travel assistance 45,189 43,438
Total remuneration for key management personnel 3,266,427 3,785,262
b) Parent entities The parent entity within the Group is Resource Generation Limited, and this is the ultimate parent company.
c) SubsidiariesInterests in subsidiaries are set out in Note 24.
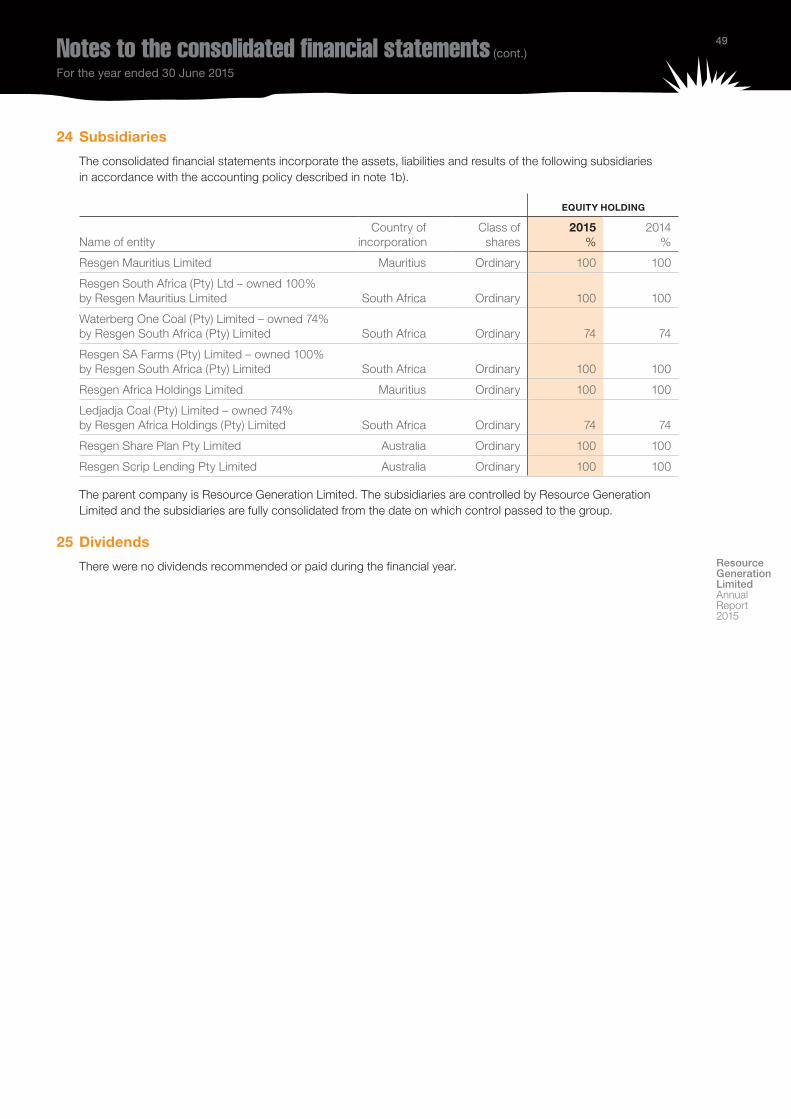
49
Resource Generation Limited Annual Report 2015
Notes to the consolidated financial statements (cont.)
For the year ended 30 June 2015
24 Subsidiaries
The consolidated financial statements incorporate the assets, liabilities and results of the following subsidiaries in accordance with the accounting policy described in note 1b).
EQUITY HOLDING
Name of entityCountry of
incorporationClass of
shares 2015 %
2014 %
Resgen Mauritius Limited Mauritius Ordinary 100 100
Resgen South Africa (Pty) Ltd – owned 100% by Resgen Mauritius Limited South Africa Ordinary 100 100
Waterberg One Coal (Pty) Limited – owned 74% by Resgen South Africa (Pty) Limited South Africa Ordinary 74 74
Resgen SA Farms (Pty) Limited – owned 100% by Resgen South Africa (Pty) Limited South Africa Ordinary 100 100
Resgen Africa Holdings Limited Mauritius Ordinary 100 100
Ledjadja Coal (Pty) Limited – owned 74% by Resgen Africa Holdings (Pty) Limited South Africa Ordinary 74 74
Resgen Share Plan Pty Limited Australia Ordinary 100 100
Resgen Scrip Lending Pty Limited Australia Ordinary 100 100
The parent company is Resource Generation Limited. The subsidiaries are controlled by Resource Generation Limited and the subsidiaries are fully consolidated from the date on which control passed to the group.
25 Dividends
There were no dividends recommended or paid during the financial year.
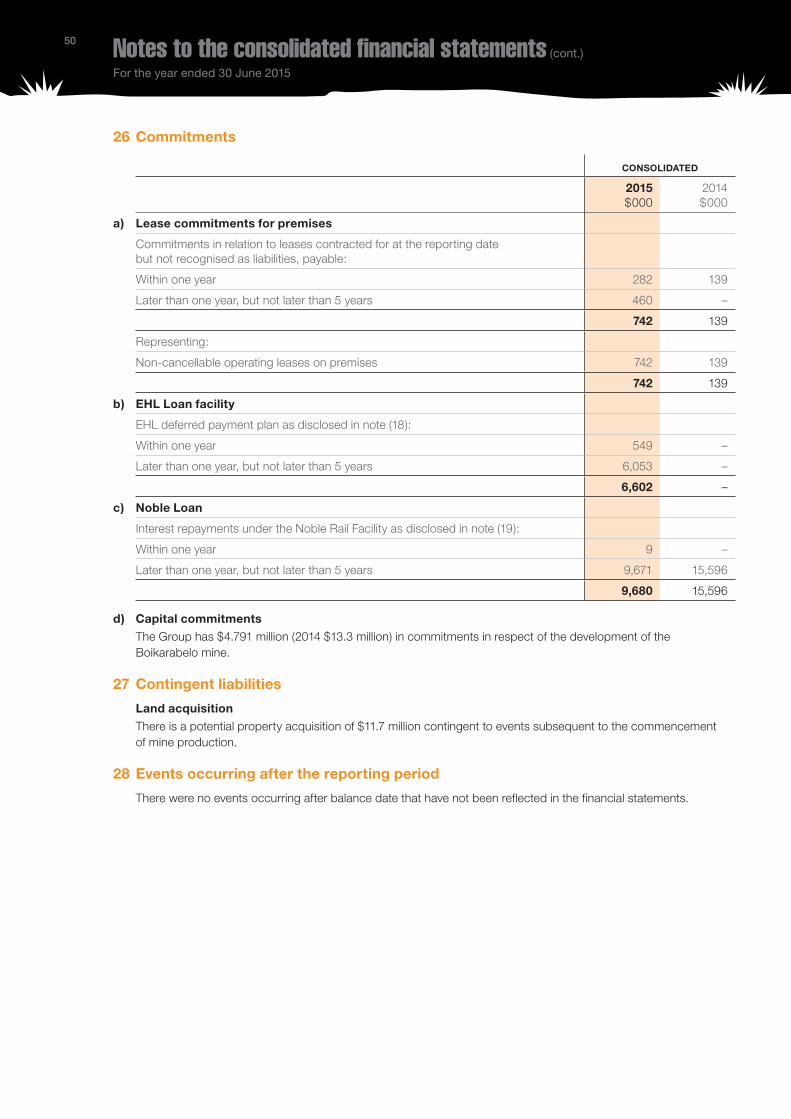
50 Notes to the consolidated financial statements (cont.)
For the year ended 30 June 2015
26 Commitments
CONSOLIDATED
2015 $000
2014 $000
a) Lease commitments for premises
Commitments in relation to leases contracted for at the reporting date but not recognised as liabilities, payable:
Within one year 282 139
Later than one year, but not later than 5 years 460 –
742 139
Representing:
Non-cancellable operating leases on premises 742 139
742 139
b) EHL Loan facility
EHL deferred payment plan as disclosed in note (18):
Within one year 549 –
Later than one year, but not later than 5 years 6,053 –
6,602 –
c) Noble Loan
Interest repayments under the Noble Rail Facility as disclosed in note (19):
Within one year 9 –
Later than one year, but not later than 5 years 9,671 15,596
9,680 15,596
d) Capital commitmentsThe Group has $4.791 million (2014 $13.3 million) in commitments in respect of the development of the Boikarabelo mine.
27 Contingent liabilities
Land acquisitionThere is a potential property acquisition of $11.7 million contingent to events subsequent to the commencement of mine production.
28 Events occurring after the reporting period
There were no events occurring after balance date that have not been reflected in the financial statements.

51
Resource Generation Limited Annual Report 2015
Notes to the consolidated financial statements (cont.)
For the year ended 30 June 2015
29 Reconciliation of loss after income tax to net cash outflow from operating activities
CONSOLIDATED
2015 $000
2,014 $000
Loss for the year (4,949) (1,042)
Depreciation 404 261
Share option expense 797 (1,635)
Interest revenue on BEE loan – (685)
Interest expense on loans 2,729 682
Unrealised foreign exchange gain (1,070) –
Forfeited share deposit – (2,500)
Changes in operating assets and liabilities:
Increase/ (decrease) in trade and other payables (25) (172)
Increase/ (decrease) in provisions 365 (24)
(Increase)/ decrease in trade and other receivables – 123
(Increase)/ decrease in accruals – (55)
Net cash outflow from operating activities (1,749) (5,047)
30 Earnings per share
CONSOLIDATED
2015 Cents
2014 Cents
a) Basic earnings per share
Loss from continuing operations attributable to the ordinary equity holders of the Company (0.9) (0.2)
Total basic earnings per share attributable to the ordinary equity holders of the Company (0.9) (0.2)
b) Diluted earnings per share
Loss from continuing operations attributable to the ordinary equity holders of the Company (0.9) (0.2)
Total diluted earnings per share attributable to the ordinary equity holders of the Company (0.9) (0.2)

52 Notes to the consolidated financial statements (cont.)
For the year ended 30 June 2015
30 Earnings per share (cont)
CONSOLIDATED
2015 $000
2014 $000
c) Reconciliation of earnings used in calculating earnings per share
Basic loss per share
Loss from continuing operations attributable to the ordinary equity holders of the Company (4,949) (1,042)
Diluted loss per share
Loss from continuing operations attributable to the ordinary equity holders of the Company (4,949) (1,042)
CONSOLIDATED NUMBER OF SHARES
2015 2014
d) Weighted average number of shares used as the denominator
Weighted number of ordinary shares used as the denominator in calculating basic earnings per share 577,174,838 494,696,591
Weighted average number of ordinary shares and potential ordinary shares used as the denominator in calculating diluted earnings per share. 582,174,838 499,696,591
e) Information concerning the classification of securities Performance share rights
Performance share rights are considered to be potential ordinary shares and have been included in the determination of diluted earnings per share to the extent to which they are dilutive. The performance share rights have not been included in the determination of basic earnings per share.

53
Resource Generation Limited Annual Report 2015
Notes to the consolidated financial statements (cont.)
For the year ended 30 June 2015
31 Parent entity financial information
a) Summary financial informationThe individual financial statements for the parent entity show the following aggregate amounts:
PARENT
2015 $000
2014 $000
Balance sheet
Current assets
Cash 23,860 36,254
Receivables 24 44
Deposits 131 112
24,015 36,410
Non-current assets
Fixed assets 52 53
Investments 74,069 66,324
Related party loans 108,142 94,089
182,263 160,466
Total assets 206,278 196,876
Current liabilities
Creditors and accruals 170 213
Provisions 1,043 690
1,213 903
Total liabilities 1,213 903
Net assets 205,065 195,973
Shareholders’ equity
Issued capital 223,623 223,623
Reserves
Share based payments reserve 20,294 19,497
Other contributed equity 1,085 1,085
Retained earnings (39,937) (48,232)
Net assets 205,065 195,973
Loss for the year (25,249) (16,112)
Total comprehensive income (25,249) (16,112)
The parent company accounts reflect the revaluation of intercompany balances at current exchange rates with the revaluation adjustment booked to the profit and loss. The prior period has been adjusted to reflect this.
b) Guarantees entered into by the parent entityPost the commencement of operations there are performance obligations under the export offtake contracts. The repayments under the Noble and EHL loans have been guaranteed by the parent.
No other guarantees have been provided by the parent.
c) Contingent liabilities of the parent entityThe parent entity’s contingent liabilities are included in those disclosed at Note 27.
d) Contractual commitments for the acquisition of property, plant or equipmentAs at 30 June 2015, the parent entity had no contractual commitments for the acquisition of property, plant or equipment.

54 Directors’ declaration
In the directors’ opinion:
a the financial statements and notes set out on pages 8 to 53 are in accordance with The Corporations Act 2001, including:
(i) complying with accounting standards, the Corporations Regulations 2001 and other mandatory professional reporting requirements; and
(ii) give a true and fair view of the consolidated entity’s financial position as at 30 June 2015 and of its performance for the financial year ended on that date; and
b There are reasonable grounds to believe that the Company will be able to pay its debts as and when they become due and payable; and
Note 1a) confirms that the financial statements also comply with International Financial Reporting Standards as issued by the International Accounting Standards Board.
The directors have been given the declaration by the Managing Director and the Chief Financial Officer required by section 295A of the Corporations Act 2001.
This declaration is made in accordance with a resolution of the directors, made pursuant to S 295(5) of the Corporations Act 2001.
Paul Jury Managing Director
Sydney 20 August 2015
55
Resource Generation Limited Annual Report 2015
Independent auditor’s report to the membersFor the year ended 30 June 2015
Liability limited by a scheme approved under Professional Standards Legislation. Member of Deloitte Touche Tohmatsu Limited.
Independent Auditor’s Report to the members of Resource Generation Limited
Report on the Financial Report We have audited the accompanying financial report of Resource Generation Limited, which comprises the consolidated statement of financial position as at 30 June 2015, the consolidated statement of profit or loss and other comprehensive income, the consolidated statement of cash flows and the consolidated statement of changes in equity for the year ended on that date, notes comprising a summary of significant accounting policies and other explanatory information, and the directors’ declaration of the consolidated entity, comprising the company and the entities it controlled at the year’s end or from time to time during the financial year as set out on pages 24 to 54. Directors’ Responsibility for the Financial Report The directors of the company are responsible for the preparation of the financial report that gives a true and fair view in accordance with Australian Accounting Standards and the Corporations Act 2001 and for such internal control as the directors determine is necessary to enable the preparation of the financial report that gives a true and fair view and is free from material misstatement, whether due to fraud or error. In Note 1(a), the directors also state, in accordance with Accounting Standard AASB 101 Presentation of Financial Statements, that the consolidated financial statements comply with International Financial Reporting Standards. Auditor’s Responsibility Our responsibility is to express an opinion on the financial report based on our audit. We conducted our audit in accordance with Australian Auditing Standards. Those standards require that we comply with relevant ethical requirements relating to audit engagements and plan and perform the audit to obtain reasonable assurance whether the financial report is free from material misstatement. An audit involves performing procedures to obtain audit evidence about the amounts and disclosures in the financial report. The procedures selected depend on the auditor’s judgement, including the assessment of the risks of material misstatement of the financial report, whether due to fraud or error. In making those risk assessments, the auditor considers internal control, relevant to the entity’s preparation of the financial report that gives a true and fair view, in order to design audit procedures that are appropriate in the circumstances, but not for the purpose of expressing an opinion on the effectiveness of the entity’s internal control. An audit also includes evaluating the appropriateness of accounting policies used and the reasonableness of accounting estimates made by the directors, as well as evaluating the overall presentation of the financial report. We believe that the audit evidence we have obtained is sufficient and appropriate to provide a basis for our audit opinion.
Deloitte Touche Tohmatsu ABN 74 490 121 060 Grosvenor Place 225 George Street Sydney NSW 2000 PO Box N250 Grosvenor Place Sydney NSW 1219 Australia DX: 10307SSE Tel: +61 (0) 2 9322 7000 Fax: +64 (0)2 9322 7001 www.deloitte.com.au
56 Independent auditor’s report to the members (cont.)
For the year ended 30 June 2015
Auditor’s Independence Declaration In conducting our audit, we have complied with the independence requirements of the Corporations Act 2001. We confirm that the independence declaration required by the Corporations Act 2001, which has been given to the directors of Resource Generation Limited, would be in the same terms if given to the directors as at the time of this auditor’s report. Opinion In our opinion: (a) the financial report of Resource Generation Limited is in accordance with the Corporations Act
2001, including:
(i) giving a true and fair view of the consolidated entity’s financial position as at 30 June 2015 and of its performance for the year ended on that date; and
(ii) complying with Australian Accounting Standards and the Corporations Regulations 2001; and
(b) the consolidated financial statements also comply with International Financial Reporting
Standards as disclosed in Note 1(a). Report on the Remuneration Report We have audited the Remuneration Report included in pages 11 to 17 of the directors’ report for the year ended 30 June 2015. The directors of the company are responsible for the preparation and presentation of the Remuneration Report in accordance with section 300A of the Corporations Act 2001. Our responsibility is to express an opinion on the Remuneration Report, based on our audit conducted in accordance with Australian Auditing Standards. Opinion In our opinion the Remuneration Report of Resource Generation Limited for the year ended 30 June 2015, complies with section 300A of the Corporations Act 2001. DELOITTE TOUCHE TOHMATSU R G Saayman Partner Chartered Accountants Sydney, 20 August 2015

57
Resource Generation Limited Annual Report 2015
The presentation currency used in the preparation of the financial statements is the Australian dollar ($A). The Group has translated the financial statements to the South African (SA) Rand (ZAR) because the Boikarabelo mine, which represents the Group’s most significant activity, is located in this region. This supplementary information has restated the financial statements to the Rand. Assets and liabilities were translated to SA Rand using the relevant closing rate of exchange and income and expense items were translated using the relevant cumulative average rate of exchange. The applicable rates used in the restatement of information are as follows:
2015 2014
Cumulative average rate of exchange $A/Rand 9.4870 9.5725
Closing rate of exchange $A/Rand 9.3730 9.9694
CONSOLIDATED
2015 R’000
2014 R’000
Revenue from continuing operations 6,423 21,959
Other – 23,941
6,423 45,900
Administration, rent and corporate (8,206) (11,573)
Depreciation of property plant and equipment (3,833) (2,498)
Employees benefits expense (15,236) (13,507)
Finance expenses (25,890) (11,315)
Land management (2,751) (1,264)
Share based compensation (7,561) (15,651)
Foreign exchange movements 10,150 –
Loss before income tax (46,905) (9,908)
Income tax expense (47) (67)
Loss from continuing operations (46,952) (9,975)
Loss for the year (46,952) (9,975)
Other comprehensive income 64,170 (92,242)
Total comprehensive income 17,218 (102,217)
Profit/(loss) is attributable to: Owners of Resource Generation Limited (46,952) (9,975)
Total comprehensive income for the year is attributable to: Owners of Resource Generation Limited 17,218 (102,217)
Earnings per share for loss from continuing operations Cents Cents
Basic earnings per share (8.5) (2.4)
Diluted earnings per share (8.5) (2.4)
Supplementary informationTranslation of financial information to the South African Rand
Statements of Comprehensive Income – ZAR Convenience Translation (Supplementary Information)
For the Year Ended 30 June 2015

58 Balance sheets– ZAR Convenience Translation (Supplementary Information)As at 30 June 2015
CONSOLIDATED
2015 R’000
2014 R’000
Current assets
Cash and cash equivalents 267,609 541,707
Trade and other receivables 1,874 4,127
Deposits and prepayments 1,940 1,396
271,423 547,230
Non-current assets
Property, plant and equipment 332,404 332,649
Mining tenements and mining development 1,317,272 1,032,132
Deposits and loan receivables 173,250 168,712
1,822,927 1,533,493
Total Assets 2,094,349 2,080,723
Current liabilities
Trade and other payables 68,610 83,514
Provisions 9,251 7,855
Borrowings 24,943 –
102,803 91,369
Non-current liabilities
Provisions 1,912 379
Borrowings 292,634 211,660
Royalties payable 25,457 25,452
320,004 237,491
Total Liabilities 422,807 328,860
Net Assets 1,671,543 1,751,863
Equity
Contributed equity 2,229,377 2,229,377
Reserves (157,072) (100,591)
Accumulated losses (400,761) (376,923)
Total Equity 1,671,543 1,751,863

59
Resource Generation Limited Annual Report 2015
Cash flow statements– ZAR Convenience Translation (Supplementary Information)As at 30 June 2015
CONSOLIDATED
2015 R’000
2014 R’000
Cash flows from operating activities
Payments to suppliers and employees (inclusive of government charges) (21,651) (54,267)
Payments for land management (1,252) (728)
Interest received 6,423 16,398
Interest paid (76) (9,649)
Taxation payments (38) (67)
Net cash outflow from operating activities (16,594) (48,313)
Cash flows from investing activities
Payments for land, property, plant and equipment (3,567) (17,814)
Refunds of government charges associated with land acquisition – 3,159
Payments for acquisition of non-controlling interest – (2,747)
Net payments for mining related licence deposits (2,704) –
Payments for mineral tenements and mining development (271,214) (219,459)
Loan to BEE partner (1,859) (19,394)
Net cash outflow from investing activities (279,344) (256,255)
Cash flows from financing activities
Net proceeds from issue of shares – 612,286
Equity raising costs – (14,724)
Repayment of borrowings – (191,450)
Forfeited share deposit – 23,930
Proceeds from borrowings – 211,035
Net cash inflow from financing activities – 641,077
Net (decrease)/increase in cash and cash equivalents (295,936) 336,509
Cash and cash equivalents at the beginning of the year 541,707 197,358
Effects of exchange rate movements on cash and cash equivalents 21,838 7,840
Cash and cash equivalents at the end of the year 267,609 541,707
Foreign currency reserve movements represent an appreciation of the $A against the ZAR of 8.2% during the current financial year and 8.2% for the prior year.
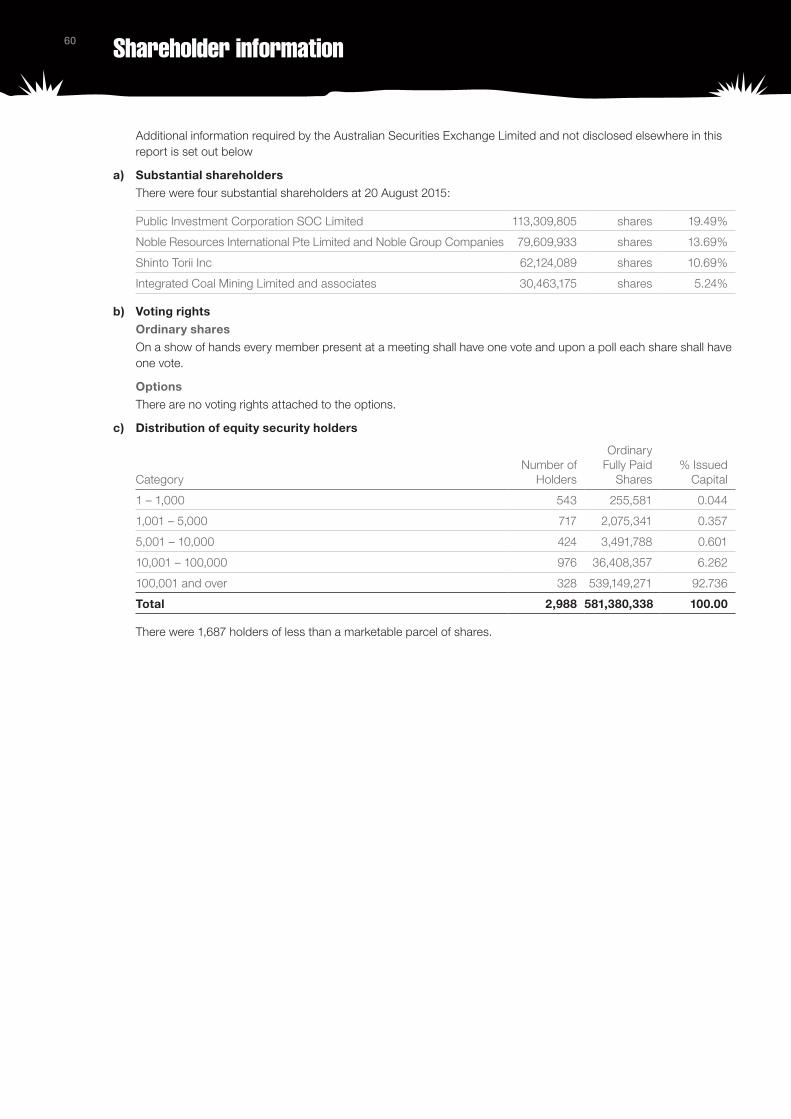
60 Shareholder information
Additional information required by the Australian Securities Exchange Limited and not disclosed elsewhere in this report is set out below
a) Substantial shareholders There were four substantial shareholders at 20 August 2015:
Public Investment Corporation SOC Limited 113,309,805 shares 19.49%
Noble Resources International Pte Limited and Noble Group Companies 79,609,933 shares 13.69%
Shinto Torii Inc 62,124,089 shares 10.69%
Integrated Coal Mining Limited and associates 30,463,175 shares 5.24%
b) Voting rights Ordinary shares
On a show of hands every member present at a meeting shall have one vote and upon a poll each share shall have one vote.
OptionsThere are no voting rights attached to the options.
c) Distribution of equity security holders
Category Number of Holders
Ordinary Fully Paid Shares
% Issued Capital
1 – 1,000 543 255,581 0.044
1,001 – 5,000 717 2,075,341 0.357
5,001 – 10,000 424 3,491,788 0.601
10,001 – 100,000 976 36,408,357 6.262
100,001 and over 328 539,149,271 92.736
Total 2,988 581,380,338 100.00
There were 1,687 holders of less than a marketable parcel of shares.

61
Resource Generation Limited Annual Report 2015
Shareholder information (cont.)
d) Equity security holders
The names of the twenty largest holders of quoted equity securities are listed below:
As at 20 August 2015.
Holder name
Ordinary Fully Paid Shares
% Issued Capital
STANDARD BANK NOMINEES (TRANSVAAL) 113,309,805 19.490
NOBLE RESOURCES INTERNATIONAL PTE LTD 79,609,933 13.693
SHINTO TORII INC 62,124,089 10.686
VALU INVESTMENTS PTE LTD 22,727,273 3.909
MILLETA HOLDINGS LIMITED 19,743,784 3.396
INTEGRATED COAL MINING LIMITED 18,268,053 3.142
YAPP PTY LTD 17,997,258 3.096
BANTAL SINGAPORE PTE LTD 12,195,122 2.098
RESGEN SHARE PLAN PTY LIMITED 10,660,000 1.834
CVC LIMITED 9,389,455 1.615
HSBC CUSTODY NOMINEES (AUSTRALIA) LIMITED 7,930,096 1.364
JENFRE NOMINEES PTY LTD <PETER GIUFFRE FAMILY A/C> 7,506,832 1.291
LUKALE MINING COMPANY (PTY) LTD 6,784,334 1.167
BARTON & BARTON PTY LTD 5,000,000 0.860
HSBC CUSTODY NOMINEES (AUSTRALIA) LIMITED – A/C 2 4,490,499 0.772
RESGEN SCRIP LENDING PTY LIMITED 4,205,500 0.723
CITICORP NOMINEES PTY LIMITED 3,878,778 0.667
J P MORGAN NOMINEES AUSTRALIA LIMITED 3,201,790 0.551
METALLICA INVESTMENTS PTY LTD 3,188,266 0.548
FROIN PTY LTD SCOTT FAMILY S/F A/C 3,085,437 0.531
Total 415,296,304 71.433

62 Mining Tenements
Location Tenement Holder Interest Area (km2)
Coal Tenements
South Africa (Waterberg)
Mining Rights
Witkopje (Ledjadja #1) MPT15/2012 MR Ledjadja Coal (Pty) Limited 74% 18
Draai Om (Ledjadja #2) MPT15/2012 MR Ledjadja Coal (Pty) Limited 74% 11
Kalkpan (Ledjadja #3) MPT15/2012 MR Ledjadja Coal (Pty) Limited 74% 13
Osorno (Ledjadja #4) MPT15/2012 MR Ledjadja Coal (Pty) Limited 74% 11
Zeekoevley (Ledjadja #5) MPT15/2012 MR Ledjadja Coal (Pty) Limited 74% 13
Vischpan (Ledjadja #6) MPT15/2012 MR Ledjadja Coal (Pty) Limited 74% 12
Kruishout (Ledjadja #7) MPT15/2012 MR Ledjadja Coal (Pty) Limited 74% 12
Prospecting Rights
Koert Louw Zyn Pan (Waterberg #1) PR720/2007 Waterberg One Coal (Pty) Limited 74% 14
Lisbon (Waterberg #2) PR678/2007 Waterberg One Coal (Pty) Limited 74% 8
Zoetfontein (Waterberg #3) PR678/2007 Waterberg One Coal (Pty) Limited 74% 10
Resource Generation Limited Annual Report 2015
DirectorsBrian Warner (Chairman) Paul Jury Stephen Matthews Geoffrey (Toby) Rose
Company SecretaryStephen Matthews
AuditorsDeloitte Touche Tohmatsu Grosvenor Place 225 George Street Sydney NSW 2000
BankersSt George Bank Limited The Standard Bank of South Africa Limited Barclays Bank Mauritius Limited Absa Bank Limited
Registered OfficeLevel 12, Chifley Tower 2 Chifley Square Sydney NSW 2000 Telephone: +61 2 9376 9000 Facsimile: +61 2 9376 9013 Website: www.resgen.com.au
Share RegistryBoardroom Pty Limited Level 12 225 George Street Sydney NSW 2000 Investor Enquiries: +61 2 9290 9600 Facsimile: +61 2 9279 0664
Transfer SecretariesComputershare Investor Services (Pty) Limited Ground Floor 70 Marshall Street Johannesburg 2001 South Africa
Stock Exchange ListingSecurities of Resource Generation Limited are listed on the Australian Stock Exchange and the Johannesburg Stock Exchange.
ASX Code: RES JSE Code: RSG
JSE SponsorDeloitte & Touche Sponsor Services (Pty) Limited Building 8, Deloitte Place The Woodlands Woodlands Drive Woodmead Sandton 2196 South Africa
Corporate directory
www.colliercreative.com.au #RES0023

Reso
urce Generatio
n Limited
Annual R
eport 2015
Right place resgen.com.au