resource valuation 1. summary of resource value guiding principles: 1.capture saturation effects on...
TRANSCRIPT

RESOURCE VALUATION
1

2
Summary of Resource Value
• Guiding principles:1. Capture saturation effects on
resource value2. Evaluate resource value on a
marginal basis
• By design, the RPS Calculator avoids allocation of value to individual projects or resources– e.g. ELCC, renewable curtailment
• Currently, the cost of curtailment is captured through adjustments to other parameters of resource cost & value, but future versions of RPS Calculator will show it as an explicit cost component
RPS Calculator Valuation Framework
Levelized Cost of Energy
Transmission Cost
Capacity Value
Energy Value
Net Resource Cost
Integration Cost*
−
=
−
+
++
Curtailment Cost+
3
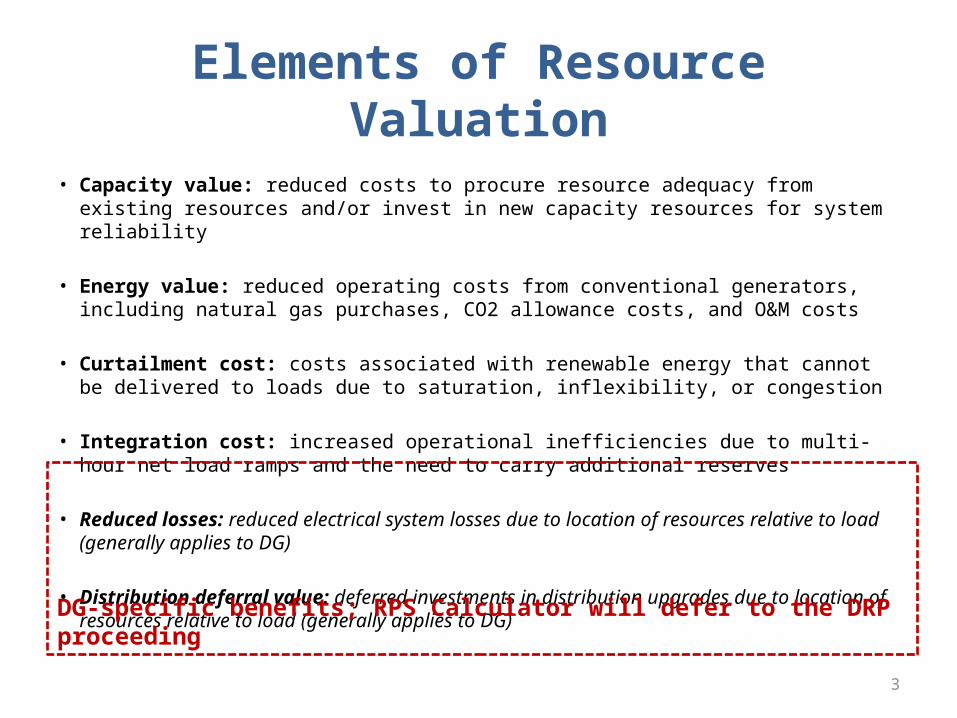
Elements of Resource Valuation
• Capacity value: reduced costs to procure resource adequacy from existing resources and/or invest in new capacity resources for system reliability
• Energy value: reduced operating costs from conventional generators, including natural gas purchases, CO2 allowance costs, and O&M costs
• Curtailment cost: costs associated with renewable energy that cannot be delivered to loads due to saturation, inflexibility, or congestion
• Integration cost: increased operational inefficiencies due to multi-hour net load ramps and the need to carry additional reserves
• Reduced losses: reduced electrical system losses due to location of resources relative to load (generally applies to DG)
• Distribution deferral value: deferred investments in distribution upgrades due to location of resources relative to load (generally applies to DG)DG-specific benefits; RPS Calculator will defer to the DRP proceeding

4
Declining Value of Renewables
• Renewable generation exhibits diminishing marginal returns with scale:– Capacity value declines as net peak shifts away from periods of production– Energy value declines as renewables displace increasingly efficient generators– Curtailment cost increases as the need to curtail renewables grows– Integration cost increases as impacts of variability and uncertainty increasingly
impact unit commitment and dispatch decisions
Charts are generic and are shown for illustrative purposes
0% 10% 20% 30% 40% 50%RPS Penetration (%)
Capacity Value
0% 10% 20% 30% 40% 50%RPS Penetration (%)
Energy Value
0% 10% 20% 30% 40% 50%RPS Penetration (%)
Curtailment Cost
0% 10% 20% 30% 40% 50%RPS Penetration (%)
Integration Cost

5
Capacity Value
• Capacity value reflects the reduction in a utility’s need to procure RA capacity due to the capacity contribution of renewable generation
• The RPS Calculator determines capacity value as the product of a calculated capacity credit and the assumed avoided capacity cost– Avoided cost transitions
between short- and long-run based on resource balance year
RPS Calculator Valuation Framework
Levelized Cost of Energy
Transmission Cost
Capacity Value
Energy Value
Net Resource Cost
Integration Cost*
−
=
−
+
++
Curtailment Cost+

6
Context
• Pursuant to legislation, Resource Adequacy has adopted “Effective Load Carrying Capability” to determine the contribution of variable renewables towards the system’s reserve margin– Goal of resource adequacy program is to determine the total ELCC of
the portfolio of existing resources and to allocate that capacity to specific plants
• To align with RA, other proceedings at the Commission could use ELCC to measure impacts of renewables on reliability:– LTPP: how much capacity will renewables provide, in aggregate,
towards the utilities’ capacity needs over the next twenty years?– RPS: what is the marginal contribution of potential resources to the
utilities’ resource adequacy requirements?

7
What is ELCC?• Effective load carrying capability (ELCC) is the additional load that can
be met by an incremental generator while maintaining the same level of system reliability
• ELCC was established in the 1960s and has been a common metric for conventional generation for decades. In the past 10 years it has been adopted for variable generation.
• ELCC is calculated using Loss of Load Probability (LOLP) modeling
Original system LOLE
Improved LOLE after addition of resources
Additional load to return to original system LOLE
= ELCC
Garver, L.L., "Effective Load Carrying Capability of Generating Units," Power Apparatus and Systems, IEEE Transactions on , vol.PAS-85, no.8, pp.910,919, Aug. 1966
Add generator

8
Capacity Value
• Methodology used to value output of renewable generation captures declining returns to scale, allowing for better analysis of high penetrations
Version 6.0
Capacity value evaluated endogenously in each year based on other renewable resources in portfolio using ELCC
Avoided cost of capacity calculated based on load-resource balance
Value streams calculated based on lifecycle impact to ratepayers
Version 2.0 - 5.0
Capacity value attributed to renewable resources based on static assumptions using NQC
Avoided cost of capacity valued at cost of new entry
Value based only on snapshot in 2020

9
Stakeholder Comment Summary
• Stakeholders generally agreed with the shift to using ELCC in the RPS Calculator to value the reliability benefit from new renewable resources
• Questions raised by stakeholders:– Whether and/or how the RPS Calculator should be updated with ELCC
values from the Resource Adequacy proceeding?• To be addressed in Process Alignment session on Day 2
– Whether the seven production profiles included in the RPS Calculator are adequate to differentiate between renewable types?
– How capacity from new out-of-state transmission projects should be valued in the RPS Calculator?

10
New Methodology Based on ELCC
• While the first increment of solar PV has a relatively large impact on peak, it also shifts the “net peak” to a later hour in the in day
• This shift reduces the coincidence of the solar profile and the net peak such that additional solar resources have a smaller impact on the net peak
0
10
20
30
40
50
60
1 2 3 4 5 6 7 8 9 10 11 12 13 14 15 16 17 18 19 20 21 22 23 24
Load
(GW
)
Hour
0
1
2
3
4
5
6
0 6 12 18Pe
ak L
oad
Redu
ction
(GW
)Installed Solar PV Capacity (GW)

11
Changing Value of Capacity
• The marginal ELCC of any single renewable resource technology declines as its penetration increases
• This is most apparent for solar PV, which has a high capacity credit at low penetrations, but this rapidly decreases as additional capacity is added
• A renewable portfolio that contains a diverse set of technologies can mitigate the decline in ELCC
Solar PV
Wind
0%
10%
20%
30%
40%
50%
60%
70%
80%
0% 5% 10% 15% 20%Penetration (% of Energy)
Marginal ELCC (% of Nameplate)
12
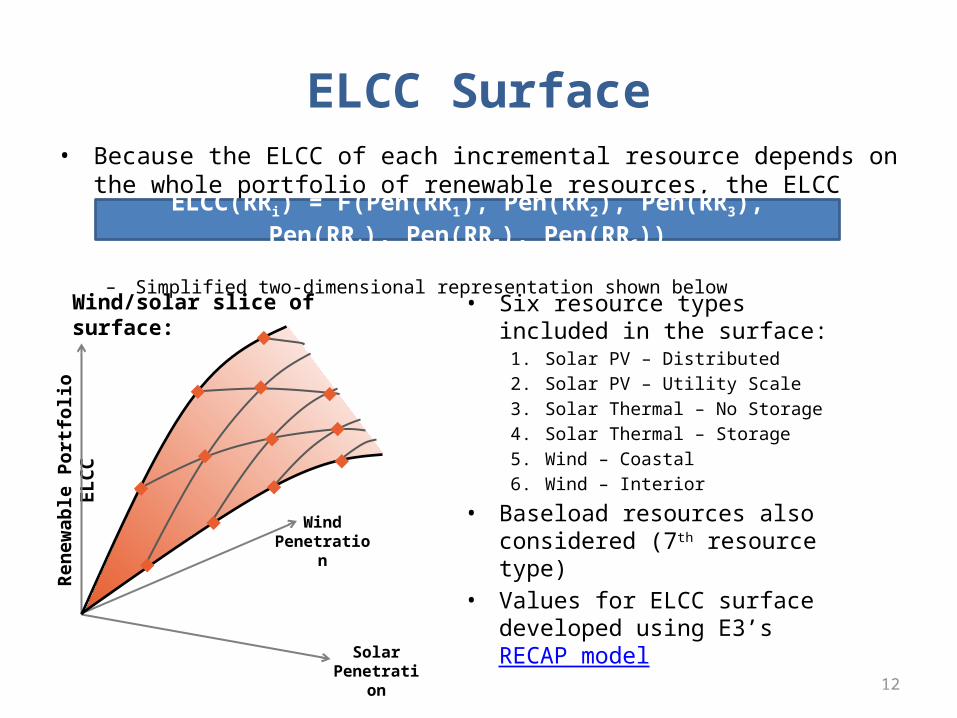
ELCC Surface• Because the ELCC of each incremental resource depends on the whole portfolio of
renewable resources, the ELCC function is actually a multidimensional surface
– Simplified two-dimensional representation shown below
• Six resource types included in the surface:
1. Solar PV – Distributed2. Solar PV – Utility Scale3. Solar Thermal – No Storage4. Solar Thermal – Storage5. Wind – Coastal6. Wind – Interior
• Baseload resources also considered (7th resource type)
• Values for ELCC surface developed using E3’s RECAP model
Wind Penetration
Rene
wab
le P
ortf
olio
ELC
C
Wind/solar slice of surface:
Solar Penetration
ELCC(RRi) = F(Pen(RR1), Pen(RR2), Pen(RR3), Pen(RR4), Pen(RR5), Pen(RR6))

13
ELCC Surface
• Marginal ELCC for each resource is approximated by slope of surface in each direction– Linear interpolation in multiple dimensions involves placing each portfolio on to a facet of this
surface
Solar Penetration
Wind Penetration
Rene
wab
le P
ortf
olio
ELC
C
1MWh of additional wind
1MWh of additional solar
Marginal ELCC of wind
Marginal ELCCof solar
For any portfolio on this facet:
Wind/solar slice of surface:

14
Dimensions in the ELCC Surface
• Due to computational limitations, the RPS Calculator cannot include more than six resource types in the ELCC surface– Surface currently consists of ~10,000
points– Additional dimensions requires
expansion by an order of magnitude and makes the problem intractable within the model
• Changing which six profiles are included in the ELCC surface is possible if necessary to capture material differences between technologies
Dimensions in the ELCC Surface*
1. Solar PV – Distributed
2. Solar PV – Utility
3. Solar Thermal – No Storage
4. Solar Thermal – Storage
5. Wind – Coastal
6. Wind – Inland
*RPS Calculator assumes a constant ELCC for baseload resources, which are independent of the other resources on the system in their impact on reliability

15
Valuing Capacity from Out-of-State Transmission Lines
• Investments in new out-of-state resources along with new transmission may provide reliability benefits beyond the capacity value of the associated renewable resource– OOS transmission lines create opportunities for additional imports, especially
during peak periods
• RPS Calculator v.6.0 relies on a simple rule of thumb: new out-of-state transmission lines contribute 60% of their capacity to the CAISO’s planning reserve margin– CAISO counts on 10,000 MW of imports available during summer peak– Maximum Import Capability of CAISO is 17,486 MW
• RPS Calculator v.6.1 will align with assumptions for imports used in RA

$30
$146
$0
$20
$40
$60
$80
$100
$120
$140
$160
Short-RunAvoided Cost
Long-Run AvoidedCost
Avoided Capacity Cost ($/kW-yr)
Capacity Value Calculation
• The other component of a resource’s capacity value is the avoided cost of capacity from an alternative source
• Avoided capacity cost is driven by the need for capacity– When the system is short, capacity avoided
cost approaches the all-in net cost of a new CT
– When the system is long, capacity avoided cost is represented by today’s average RA contract price
• RPS Calculator includes Load-Resource Balance for CAISO to determine the timing of this transition– Assumptions from LTPP used where possible
Based on recent average RA
contract prices
New CT net cost
16

Determining Avoided Capacity Costs
• Year-by-year avoided cost evaluated based load-resource balance using assumptions provided by LTPP– Load forecast, demand-side resources, conventional generator additions & retirements
• Avoided cost transitions from short-run to long-run avoided cost when load-resource balance is reached
Reserve Margin Requirement
0
10,000
20,000
30,000
40,000
50,000
60,000
70,000
80,000
2012 2014 2016 2018 2020 2022 2024 2026 2028 2030
MW
Available Capacity
Transition from short-run to long-run avoided cost
17

18
Energy Value
• Energy value is intended to capture the reduction in fuel & operating costs and/or market purchases needed to serve a utility’s load
• RPS Calculator uses a cost-based stack model approach to estimate the fuel & operating cost savings as renewables are added to the system
RPS Calculator Valuation Framework
Levelized Cost of Energy
Transmission Cost
Capacity Value
Energy Value
Net Resource Cost
Integration Cost*
−
=
−
+
++
Curtailment Cost+

19
Energy Value
• Methodology used to value output of renewable generation captures declining returns to scale, allowing for better analysis of high penetrations
Version 6.0
Energy value evaluated endogenously in each year based on other renewable resources in portfolio
Value streams calculated based on impact to ratepayers over term of a resource’s contract
Version 2.0 – 5.0
Energy value attributed to renewable resources based on static assumptions
Value based only on snapshot in 2020

20
Stakeholder Comment Summary
• Many stakeholders agree that the use of a simplified stack model is appropriate for a model of the RPS Calculator’s scope but suggest refinements may be necessary:– Benchmarking against production simulation results– Consideration of additional profiles to differentiate among renewable
resource types– Consideration of additional detail beyond 12x24 profiles for load and
generation– Addition of storage to reflect CPUC-authorized procurement

Energy Value Methodology
• Guiding principle: the primary determinant of the value of energy is the amount of load that must be met with gas generation + imports
• Methodology1. Approximate the amount of Gas + Import generation (MW) needed
to serve load at a month-hour level from load and renewable shapes2. Develop relationship between Gas + Import dispatch levels (MW)
and marginal dispatch heat rate based on fleet characteristics3. Approximate energy prices by month-hour from Gas + Import
dispatch in future years and market heat rate function from Step 24. Calculate an average production value by technology in future years
based on energy prices and month-hour generation shapes
21

22
Thermal Stack
• Energy value in each time period (12x24) is determined by the load served by thermal generators:
0.02.04.06.08.0
10.012.014.016.018.0
1 2 3 4 5 6 7 8 9 10 11 12 13 14 15 16 17 18 19 20 21 22 23 24 25 26 27 28 29 30 31 32 33 34 35 36
MM
Btu/
MW
h
GW
2012 Thermal Stack
CCGTs
CTs
Thermalh = Loadh – Renewableh – Nuclearh– Cogenh – Hydroh

23
Escalation of Energy Value
• Energy value increases over time with escalation of:– Natural gas price– CO2 allowance price
Gas Price
Gas + CO2 Price
$0
$2
$4
$6
$8
$10
$12
2014 2016 2018 2020 2022 2024 2026 2028 2030
Pric
e (2
013
$/M
MBt
u)

24
Snapshots of Energy Value Profiles
• Assessing the marginal energy value based on the net load shape causes the profile of value to change with increasing resource penetration
Example is illustrative of calculator functionality and is not a model result
Jan Feb Mar Apr May Jun Jul Aug Sep Oct Nov Dec
$0
$20
$40
$60
$80
$100
$120
Mar
gina
l Ene
rgy
Valu
e ($
/MW
h)
2012
2020
2030
At high penetrations, value drops to zero during periods of overgeneration
At low penetrations, highest value coincides with peak load

25
Planned Refinements
• Several refinements to the method used to value energy are planned for v.6.1:– Addition of profiles to represent key out-of-state resources
• e.g. Wyoming/New Mexico wind– Refinement of hydroelectric operational modeling
• More detail available in FAQ document– Incorporation of storage heuristics to reflect possible impact of
authorized procurement on system operations– Benchmarking results against results of analysis conducted to develop
integration cost adder• May be necessary to incorporate economic imports

26
Curtailment Cost
• Curtailment cost captures the value of the renewable attribute that is lost to ratepayers when renewable generation is curtailed
• Need to curtail may be driven by:1. Overgeneration2. Flexibility constraints3. Transmission constraints
• RPS Calculator estimates the cost of curtailment associated with (1), but does not currently quantify (2) or (3)– Flexibility-driven curtailment to be
discussed with integration adder– Transmission-driven curtailment to be
discussed with energy only functionality
RPS Calculator Valuation Framework
Levelized Cost of Energy
Transmission Cost
Capacity Value
Energy Value
Net Resource Cost
Integration Cost*
−
=
−
+
++
Curtailment Cost+

27
Curtailment at High Renewable Penetrations
• A number of operational & investment strategies are available to meet need for flexibility:– Dispatch of existing flexible resources– Curtailment– Investment in new flexible resources
• Analysis of renewable portfolios above 33% suggest that curtailment could become a key strategy in system operations
Example April Day

28
Three Types of Renewable Curtailment
• Oversupply– Curtailment that occurs due to too much renewable energy supply – Curtailment that would still occur even if:
• Supply resources were perfectly flexible (able to move from 0 to Pmax instantaneously); and
• Transmission were completely unconstrained (“copper sheet”)– Curtailment that can only be solved by increasing load during periods of
overgeneration• Flexible loads, energy storage, exports
• Flexibility-induced curtailment– Additional curtailment, above the curtailment due to oversupply, that is
caused by lack of supply side flexibility
• Transmission-induced curtailment– Additional curtailment, above the curtailment due to oversupply, that is
caused by transmission congestion
Quantified in v.6.0
Not quantified in
v.6.0

29
Curtailment Cost
• Inclusion of impacts of renewable curtailment at higher penetrations encourages resource diversity in portfolio creation
Version 6.0
Marginal curtailment due to overgeneration calculated for each prospective resource type in each year based on other renewable resources in portfolio
Resource cost and value streams adjusted to reflect implicit reduction in capacity factor
Version 2.0 – 5.0
No consideration of curtailment

30
Cost of Curtailment
• Curtailment of renewables may be needed at higher penetrations due to a number of factors, which may cause additional costs to ratepayers
• When evaluating the economic tradeoff between curtailment and other measures to provide flexibility, renewable curtailment is valued at the replacement cost: the avoided cost of procuring an additional unit of renewable generation– e.g. penalty prices for curtailment used in production simulation– Provides a framework for determining economically efficient levels of curtailment
and/or cost-effectiveness of flexibility investments– Any out of pocket costs should also be included, e.g., lost PTC
• When evaluating potential RPS bids, expected marginal curtailment should be considered in valuation through adjustments to net cost of delivered energy to reflect all costs associated with a project

31
Curtailment and Negative Market Prices• In market operations, curtailment may be actualized through negative bids
– Scheduling coordinators bid to pay the CAISO to accept the production from a renewable resource
– SCs willing to bid up to their out-of-pocket costs plus replacement costs– Curtailment value forms a conceptual floor for negative prices– Other suppliers may also submit negative bids, particularly in real-time
market, due to operating constraints (ramping costs, startup costs, gas penalties, etc.)
Thermal Stack
RPS Replacement Cost
Price Curve
$/M
Wh
Net Load (GW)

32
Cost of Curtailment in RPS Calculator
• Guiding Principle: employ a cost-based approach to capture all costs of both delivered and curtailed energy in resource valuations
• RPS Calculator Methodology:1. Calculate marginal curtailment for each type of generation profile
based on periods when the energy value is zero2. Calculate the impact of curtailment on resource net cost by attributing
the “cost of curtailed energy” to the non-curtailed output of the renewable generator
• Methodology assumes renewable generators are compensated for curtailed generation– Provides generators with a means of collecting a return of and on
investment without allowing curtailment risk to interfere with financing

33
Estimating Oversupply
• Curtailment due to oversupply is estimated using the same modeling approach as energy value
• Candidate resource profiles are compared with incidence of oversupply to determine marginal curtailment
Jan Feb Mar Apr May Jun Jul Aug Sep Oct Nov Dec
0
5
10
15
20
25
30
35
40
45
50
GW
2030
Overgeneration
Renewables
Hydro
Gas
Cogeneration
Nuclear
Overgeneration

34
Illustrative Marginal Curtailment
• Curtailment increases geometrically with market penetration above a certain point
0%
6%
20%
0%
17%
52%
0%
6%
19%
0%
10%
20%
30%
40%
50%
60%
33% 40% 50% 33% 40% 50% 33% 40% 50%
Baseload Solar PV Wind
Mar
gina
l Cur
tailm
ent (
%)

35
• For each resource considered, the cost of compensated curtailed output is attributed to the resource’s non-curtailed output– Simple example: $100/MWh resource with 20% curtailment
Inclusion of Curtailment Cost in Resource Costing
Curtailed EnergyEnergy (MWhcurt) 20
PPA Price ($/MWhcurt) $100
Energy Value ($/MWhcurt) --
Capacity Value ($/MWhcurt) --
Total ($/MWhcurt) $100
Delivered Energy (w/ Curt Cost)Energy (MWhdel) 80
PPA Price ($/MWhdel) $100
Energy Value ($/MWhdel) -$50
Capacity Value ($/MWhdel) -$10
Curtailment Cost ($/MWhdel) $25
Total ($/MWhdel) $65
Delivered EnergyEnergy (MWhdel) 80
PPA Price ($/MWhdel) $100
Energy Value ($/MWhdel) -$50
Capacity Value ($/MWhdel) -$10
Total ($/MWhdel) $40
Net Cost used in Ranking & Selection
Illustrative example excludes
transmission & integration costs
$100/MWh x 20 MWh / 80 MWh =
$25/MWh

36
Curtailment is an Important Parameter in Resource Selection
• Expected curtailment has a significant impact on the net cost of resources as penetrations increase beyond 33%
• Significant uncertainty about the size of the export market for “null power” from California– RPS Calculator currently does not consider exports– Some of the energy that shows up as “Curtailment” could potentially
be reclassified as “Exports”– Key question is the economic value of exports: what price and who
pays who

37
Integration Cost
• Integration costs reflect the increased operating costs incurred as a result of the ramping and ancillary services needed to balance the variability and intermittency of some renewable technologies
• RPS Calculator v.6.0 does not currently include an integration adder
• Future versions will incorporate an adder linked to the CPUC’s continued efforts to characterize the costs of renewable integration
RPS Calculator Valuation Framework
Levelized Cost of Energy
Transmission Cost
Capacity Value
Energy Value
Net Resource Cost
Integration Cost*
−
=
−
+
++
Curtailment Cost+

38
Context
• In D.14-11-042, CPUC adopted an interim integration adder for use in the utilities’ procurement plans for the first time– Variable cost components of $3 and $4/MWh for wind and solar,
respectively, based on literature review– Fixed cost component based on product of each utility’s need for
flexible RA and the cost premium of flexible RA (likely negligible at current penetration)
• Decision further suggests coordination with ongoing operational flexibility studies underway in 2014 LTPP in order to develop better cost estimates

39
Operational Modeling in LTPP
• Original scope for 2014 LTPP was divided into two phases– Phase 1A: determination of need for flexible capacity– Phase 1B: evaluation of how to meet need
• CPUC has nearly concluded Phase 1A, Phase 1B will emphasize refinement of modeling tools and approaches for analyzing operations of electric systems at high penetrations
• Scoping for Phase 1B is currently underway, and results of modeling could be used to develop an integration adder– Requires analysis specifically needed to calculate an integration adder

40
Stakeholder Comment Summary
• Strong agreement among stakeholders that future versions of RPS Calculator should incorporate an integration cost adder
• Questions raised:– What costs should be considered in the scope of an integration adder?– How should RPS Calculator interact with integration adder work under
RPS proceeding and ongoing modeling efforts in LTPP?– How should the integration adder be developed to ensure no double-
counting of effects captured in energy value?

“Integration” Can Have Many Meanings
Resource Planning ProcurementTransmission development
1 second
4-10 seconds
10-15 minutes
Day Ahead
Month Ahead
Long-term
Real-time Operation Voltage Regulation
Reg Up/Reg DownLoad Following
Transmission StudiesResource Adequacy
Frequency Regulation
Resource Commitment
Transmission Operations
Transmission/Resource Planning
Generator Operations
4141

42
Conceptual Renewable Integration Cost Curve as a Function of Penetration
Mar
gina
l Int
egra
tion
Cost
($
/MW
h)
Renewable Penetration (% of load)
Low Penetration: Operating costs only
(increased Regulation and Load Following)
Medium Penetration: Flexibility constraints lead
to curtailment and/or need to invest in flexible capacity
High Penetration: Storage or other integration
technology serves as a backstop for integration
California at 33%
42

43
Variable Costs Captured in an Integration Adder
• Renewable generation sources such as wind and solar are variable and uncertain– Variable: the output is continuously changing due to meteorological
conditions– Uncertainty: the level of output cannot be precisely predicted
• These attributes result in an increase in costs due to several factors:– The need to carry additional reserves (regulation & load following) to
compensate for forecast error and intra-hour variability– The need to meet increased inter-hour ramps
• Each of these factors contribute to the integration costs of renewables

44
Developing a Marginal Integration Cost Adder
• Purpose of integration cost adder is to inform procurement decisions• Like other components of value, integration adder should:
– Allow for differentiation of resource types– Reflect marginal system impacts given current portfolio
• Operational flexibility modeling underway in LTPP could provide a forum in which this analysis may take place– Energy Division could leverage existing deterministic production simulation
cases– Can develop a California-specific integration cost adder with a reasonable
amount of effort
• Proposal prioritizes developing marginal integration cost adders based on the 33% portfolio to inform upcoming procurement decisions– As utilities procure resources to reach higher penetrations, updates to the
integration adder will be needed to reflect changing marginal costs

45
Isolating Integration Costs
• Energy value, curtailment cost, and integration cost each capture impacts that the addition of renewable generation have on system operations– Increasingly intertwined at higher penetrations
• Care must be taken to avoid any double-counting while ensuring that all operational impacts are considered
• In order to use production simulation to measure integration costs, comparative cases must be constructed to assess the costs of carrying additional reserves as well as meeting multi-hour net load ramps

46
Production Simulation Cases Needed
• A 33% case will be developed under LTPP Phase 1B.• Additional cases could be run to determine the marginal integration cost of solar
and wind beyond 33%.• Each portfolio evaluated requires a total of six production simulation runs to yield
marginal integration cost adders for solar and wind.
47
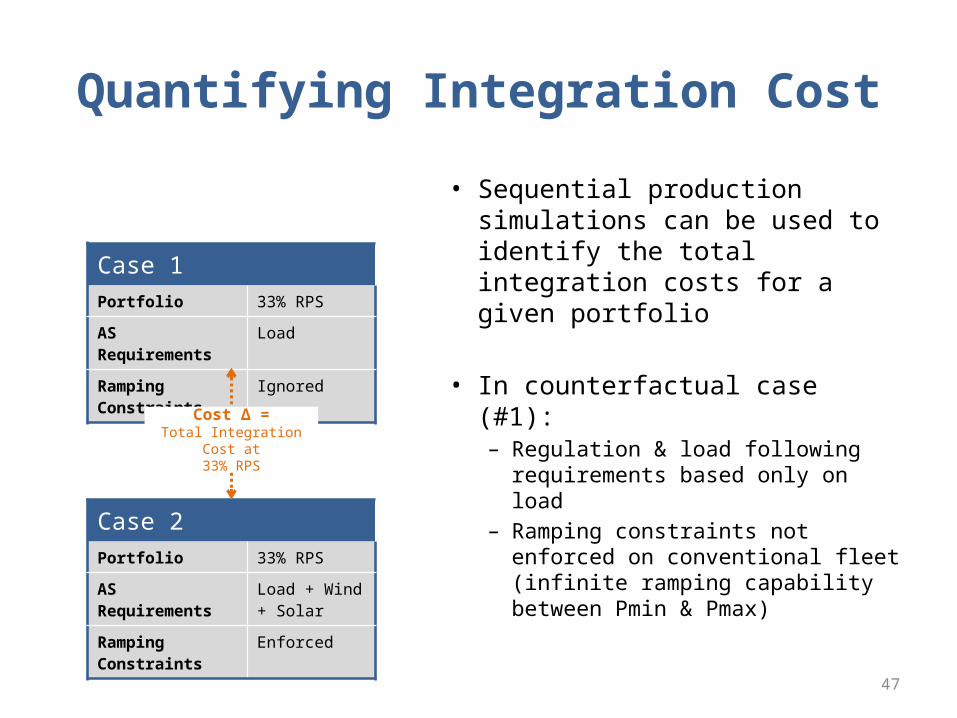
Quantifying Integration Cost
• Sequential production simulations can be used to identify the total integration costs for a given portfolio
• In counterfactual case (#1):– Regulation & load following
requirements based only on load– Ramping constraints not enforced
on conventional fleet (infinite ramping capability between Pmin & Pmax)
Case 1Portfolio 33% RPS
AS Requirements Load
Ramping Constraints Ignored
Case 2Portfolio 33% RPS
AS Requirements Load + Wind + Solar
Ramping Constraints Enforced
Cost Δ =Total Integration Cost at
33% RPS

48
Marginal Integration Cost• Comparing the ramping & AS costs between multiple portfolios enables the
isolation of marginal integration costs associated with specific resources– This example shows the cases needed to calculate the marginal integration cost for generic wind
Case 1Portfolio 33% RPS
AS Requirements Load
Ramping Constraints Ignored
Case 2Portfolio 33% RPS
AS Requirements Load + Wind + Solar
Ramping Constraints Enforced
Case 3Portfolio 33% RPS + 1000
MW Wind
AS Requirements Load
Ramping Constraints Ignored
Case 4Portfolio 33% RPS + 1000
MW Wind
AS Requirements Load + Wind + Solar
Ramping Constraints Enforced
Cost Δ =Total Integration Cost at
33% RPS
Cost Δ =Total Integration Cost at
33% RPS + 1000 MW Wind
Cost Δ =Marginal Integration
Cost

49
Energy Value vs. Integration Cost
• Proposal for four cases provides a clear means of disentangling energy value from integration costs
Case 1Portfolio 33% RPS
AS Requirements Load
Ramping Constraints Ignored
Case 2Portfolio 33% RPS
AS Requirements Load + Wind + Solar
Ramping Constraints Enforced
Case 3Portfolio 33% RPS + 1000
MW Wind
AS Requirements Load
Ramping Constraints Ignored
Case 4Portfolio 33% RPS + 1000
MW Wind
AS Requirements Load + Wind + Solar
Ramping Constraints Enforced
Cost Δ =Marginal Integration
Cost
Cost Δ =Marginal Energy
Value
Cost Δ =Marginal Energy Value – Marginal Integration Cost