resources in the general election. money feca provides full public financing for presidential...
Post on 21-Dec-2015
214 views
TRANSCRIPT
Resources in the Resources in the General ElectionGeneral Election

MoneyMoney
FECA provides FULL public financing for FECA provides FULL public financing for presidential election campaignspresidential election campaigns– 2008: $84.1 million.2008: $84.1 million.
Parties may make coordinated expendituresParties may make coordinated expenditures– Pays for goods or services to benefit candidate Pays for goods or services to benefit candidate – 2008: $19.1 million2008: $19.1 million– State and local parties can still do get-out-the-State and local parties can still do get-out-the-
vote drives (no ads)vote drives (no ads) Parties can spend money independentlyParties can spend money independently

Does money buy outcomes?Does money buy outcomes?
Democratic Spending vs. Winning, 1932-1980
0
10
20
30
40
50
60
0 1
Won Election?
Per
cen
t sp
end
ing

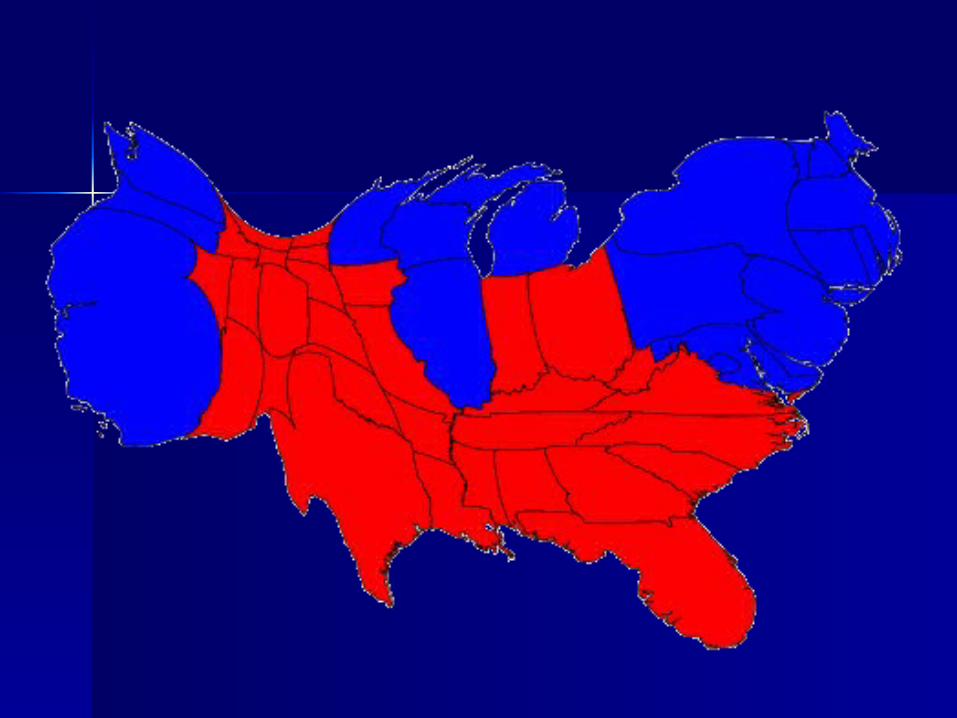
Pros and Cons of the Pros and Cons of the Electoral CollegeElectoral College

RulesRules
Each state appoints “Electors” equal to the Each state appoints “Electors” equal to the number of combined seats in the House and number of combined seats in the House and SenateSenate
Electors meet in own statesElectors meet in own states
Electors cast two votes (P and VP)Electors cast two votes (P and VP)
MAJORITY (270 votes) to winMAJORITY (270 votes) to win
If no winner, House of Reps. chooses among top If no winner, House of Reps. chooses among top candidates, one vote per state.candidates, one vote per state.


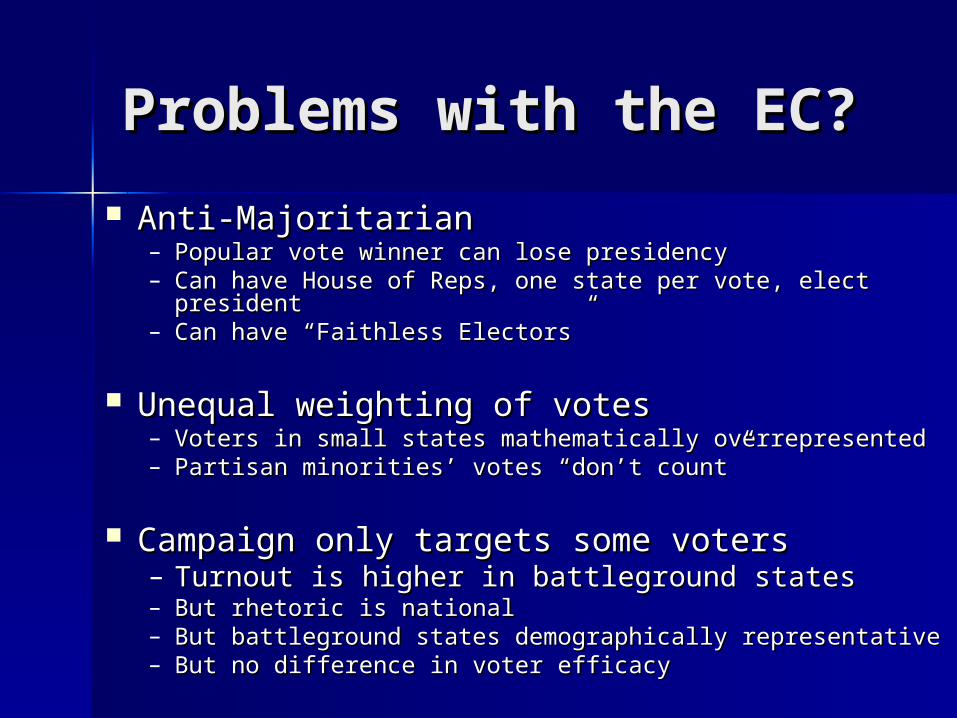
Problems with the EC?Problems with the EC?
Anti-MajoritarianAnti-Majoritarian– Popular vote winner can lose presidency Popular vote winner can lose presidency – Can have House of Reps, one state per vote, elect Can have House of Reps, one state per vote, elect
president president – Can have “Faithless Electors”Can have “Faithless Electors”
Unequal weighting of votesUnequal weighting of votes– Voters in small states mathematically overrepresentedVoters in small states mathematically overrepresented– Partisan minorities’ votes “don’t count”Partisan minorities’ votes “don’t count”
Campaign only targets some votersCampaign only targets some voters– Turnout is higher in battleground statesTurnout is higher in battleground states– But rhetoric is nationalBut rhetoric is national– But battleground states demographically representativeBut battleground states demographically representative– But no difference in voter efficacyBut no difference in voter efficacy

Positive aspects of EC?Positive aspects of EC?
Forces candidates to create broad Forces candidates to create broad electoral coalitionselectoral coalitions
Exaggerates margin of victory, Exaggerates margin of victory, making governing easiermaking governing easier
Encourages 2 party systemEncourages 2 party system

Consequences for Consequences for strategy?strategy?
Focus on electorally rich Focus on electorally rich (populous) states(populous) states
Focus on “swing” statesFocus on “swing” states

Targeted States, 2004Targeted States, 2004StateState VisitsVisits Ads?Ads? Difference in two-party percent of Difference in two-party percent of
votevote
OH OH (20 EV)(20 EV) 4545 XX 2.1%2.1%
IA IA (7 EV)(7 EV) 3131 XX 0.67%0.67%
PA PA (21 EV)(21 EV) 3030 XX 2.5%2.5%
WI WI (10 EV)(10 EV) 2828 XX 0.38%0.38%
FL FL (27 EV)(27 EV) 2323 XX 5.0%5.0%
MN MN (10 EV)(10 EV) 1919 XX 3.5%3.5%
MI MI (17 EV)(17 EV) 1717 XX 3.5%3.5%
NM NM (5 EV)(5 EV) 1212 XX 0.8%0.8%
WV WV (5 EV)(5 EV) 1111 XX 12.9%12.9%
CO CO (9 EV)(9 EV) 1010 XX 4.8%4.8%
NH NH (4 EV)(4 EV) 1010 XX 1.3%1.3%
MO (MO (11 EV)11 EV) 77 7.2%7.2%
NV NV (5 EV)(5 EV) 77 XX 2.4%2.4%
NC NC (15 EV)(15 EV) 55 12.4%12.4%

Targeted States, 2004Targeted States, 2004StateState BattlegroundBattleground Total USTotal US
Income under $35 KIncome under $35 K 42.142.1 41.541.5
Income over $100KIncome over $100K 10.610.6 12.312.3
High school diplomaHigh school diploma 72.872.8 70.170.1
BlackBlack 8.38.3 11.411.4
LatinoLatino 7.27.2 11.011.0
Mainline protestantMainline protestant 21.421.4 17.517.5
Evangelical protestantEvangelical protestant 24.524.5 23.423.4
CatholicCatholic 24.324.3 24.524.5
UnaffiliatedUnaffiliated 15.115.1 14.214.2

Turnout in targeted Turnout in targeted statesstates
Turnout rate Turnout rate 20002000
Turnout rate Turnout rate 20042004
BattlegroundBattleground 54.654.6 62.262.2
US TotalUS Total 50.050.0 55.355.3
DifferenceDifference 4.64.6 6.96.9

Simple popular vote: Simple popular vote: Effects on campaign Effects on campaign strategystrategy
Greater costGreater cost
Media markets replace states as Media markets replace states as focus of resource concentrationfocus of resource concentration
Favors Republicans?Favors Republicans?

What would happen if What would happen if we elected the we elected the president by popular president by popular vote??vote??