resources, land abundance and inequality: …...resources, land abundance and inequality:...
TRANSCRIPT

Resources, Land Abundance and Inequality: Understanding wealth-holding and Investment in Britain and its Settler Colonies, 1870-1930 by L. Di Matteo (Lakehead University), D. Green (King’s College, London) . A. Owens (Queen Mary University of London) , M. Shanahan (University of South Australia) , J. McAloon (Victoria University Wellington)
A Paper Prepared for the World Economic History Congress, Stellenbosch, South Africa, July 9-13. The financial assistance of the Social Sciences and Humanities Research Council of Canada, is gratefully acknowledged by Livio Di Matteo

Research Question � For Britain and its Dominions, the land settlement
boom of the 19th century in the frontier regions of Australia, Canada and New Zealand saw the acquisition of wealth and assets by settlers.
� A largely unexplored aspect of wealth holding and inequality is the impact of these types of transfers on wealth distribution.
� A key question is whether these transfers of cheap land resulted in greater wealth equality relative to the imperial core and whether these settler economies thereby represented a sort of safety valve for the inequality of Britain.

Summary � This paper documents the extent of wealth
inequality within Britain, Australia, Canada and New Zealand over the period 1870 and 1930
� While extreme concentrations were more prevalent in Britain, overall wealth inequality was also high across the Empire. Moreover, wealth inequality was declining in Britain while rising in the Dominions.
� Among the institutions transmitted by the empire to its Dominions was also the pattern of wealth inequality.

Economic Growth, Wealth and Inequality � Economic growth, industrialization and
inequality correlated in 19th and early 20th centuries.
� Kuznets – inverted U-hypothesis between inequality and growth
� Evidence on Kuznets Relationship: ◦ Williamson, Lindert, Higgins, ◦ For Canada: Alan Green, Inwood & Irwin

Factors Affecting Inequality
� Growth in income and wealth � Population characteristics – age, cohort
size � Technology � Globalization � Education supply and demand for skills

Two additional ingredients in inequality � Link between inequality and the manner
in which assets are held which influences returns and subsequent distribution of wealth.
� Effect of individual windfalls in wealth as a result of natural resource rents and particularly land endowments acquired during settlement phases.

Land Policies in New World
� United States, Canada and the rest of the Americas as well as Australia and New Zealand are regions of recent European settlement and new settlers often were the recipients of grants of either “free” or heavily subsidized land.

Examples of Land Policies
� In Australia, the British Crown made grants of land to released convicts in New South Wales starting from 1788 though the practice ended in the 1830s.
� New Zealand was also interesting with the period from 1840 to 1852 being one of colonizing associations with land sales at prices deemed “high enough” to force laborers to work for landowners a few years -only in some parts of the North Island had free grants

Canada � In Upper Canada, there were land
settlement grants during the early nineteenth century that were accompanied by a massive expansion of population and economic activity.
� Canadian West: The Dominion government had a land grants policy that provided title to 160 acres of land to any settler over 18 years of age after three years of residence subject to minimum use of the land and a ten-dollar fee

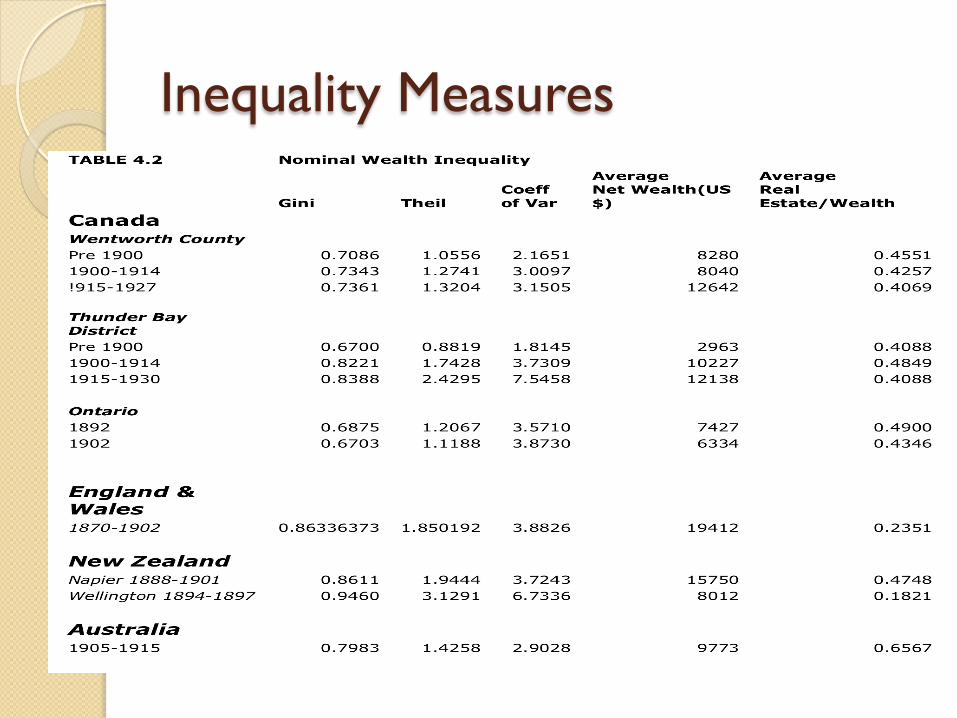
The Data: Probate Wealth data � Australia: 337 individual estates between 1905 and
1915. � Canada: four probate data sets: Ontario 1892 (3,515
decedents), Ontario 1902 (3,476 decedents), Wentworth County, Ontario, 1872-1927 (2,516 decedents) and Thunder Bay District 1885-1930 (2,338 decedents).
� England & Wales: 1,146 individuals with wealth portfolios for the period 1870 to 1902.
� New Zealand: for Wellington and Napier. The Napier (100) estates cover the period 1888 to 1901, while the Wellington (148) estates are only for the period 1894 to 1897.

Inequality Measures
� Decile shares � Gini Coefficient � Theil Coefficient � Coefficient of Variation

Comparing Wealth Shares
Inequality Measures

Gini Inequality Measures
0.000
0.100
0.200
0.300
0.400
0.500
0.600
0.700
0.800
0.900
1.000
1905-1915 Pre 1900 1900-1914 !915-1927 Pre 1900 1900-1914 1915-1930 1892 1902 1870-1902 Napier 1888-1901
Wellington 1894-1897
Australia Wentworth County(CAN) Thunder Bay District(CAN) Ontario(CAN) England & Wales
New Zealand
Gini Coefficients for Britain and the Dominions: 1870-1930

Wealth Comparisons
0
5000
10000
15000
20000
25000
1905
-191
5
Pre
1900
1900
-191
4
!915
-192
7
Pre
1900
1900
-191
4
1915
-193
0
1892
1902
1870
-190
2
Nap
ier
1888
-190
1
Wel
lingt
on 1
894-
1897
Australia Wentworth County(CAN) Thunder Bay District(CAN) Ontario(CAN) England & Wales
New Zealand
U.S
. dol
lars
Average Net Wealth ($US): Britain and the Dominions

Real Estate Portfolios
0
0.1
0.2
0.3
0.4
0.5
0.6
0.7
1905-1915 Pre 1900 1900-1914 !915-1927 Pre 1900 1900-1914 1915-1930 1892 1902 1870-1902 Napier 1888-1901
Wellington 1894-1897
Australia Wentworth County(CAN) Thunder Bay District(CAN) Ontario(CAN) England & Wales
New Zealand
Real Estate Share of Wealth for Britain and the Dominions

Relationships
0.0000
0.1000
0.2000
0.3000
0.4000
0.5000
0.6000
0.7000
0.8000
0.9000
1.0000
0 5000 10000 15000 20000 25000
Gin
i
Average Net Wealth (US dollars)
Gini Versus Net Wealth for England and Wales and the British Settler Economies
(Source: Table 4.2)
Gini
Linear (Gini)
0.0000
0.1000
0.2000
0.3000
0.4000
0.5000
0.6000
0.7000
0.8000
0.9000
1.0000
0.0000 0.2000 0.4000 0.6000 0.8000
Gini Versus the Average Real Estate Share of Net Wealth for England and Wales and the British
Settler Economies (Source: Table 4.2)
Gini
Linear (Gini)

ANNUALIZED DATA FOR REGRESSION ANALYSIS

0.2
0.3
0.4
0.5
0.6
0.7
0.8
0.9
1
1.1 18
70
1872
18
74
1876
18
78
1880
18
82
1884
18
86
1888
18
90
1892
18
94
1896
18
98
1900
19
02
1904
19
06
1908
19
10
1912
19
14
1916
19
18
1920
19
22
1924
19
26
1928
19
30
Annual Gini Coefficients for Wealth with Trends: 1870-1930
New Zealand(Galt)*
Thunder Bay District**
England & Wales***
New Zealand****
Australia*****
Wentworth County**
Linear (New Zealand(Galt)*)
Linear (Thunder Bay District**)
Linear (England & Wales***)
Linear (New Zealand****)
Linear (Australia*****)
Linear (Wentworth County**)


Results

Conclusions � Britain and its Dominions had high and
persistent levels of inequality. � Over time inequality was actually rising in
the Dominion settler economies but declining in the data for England and Wales.
� Inequality varied positively with the level of wealth and inversely with the share of wealth held as real estate and these relationships appear to hold when regression analysis is used.

Final words � If there was a safety valve for inequality in
the imperial core out amongst the Dominions, it was in the form of the opportunity to acquire wealth in a new but nevertheless still quite unequal distribution.
� The mitigating factor in all this was that while there was great and persistent inequality even in the settler economies, the inverse relationship between land holding and inequality meant that the greater shares of land ownership did provide some opportunity to reduce inequality.