resources pipelines andresources, pipelines, and hydraulic
TRANSCRIPT
Resources Pipelines andResources, Pipelines, and Hydraulic Fracturing –
Wh t ill b th F t N t lWhat will be the Future Natural Gas Mix in New England?
Commissioner Bob AnthonyCommissioner Bob AnthonyChairman, Oklahoma Corporation Commission
NARUC Natural Gas Committee, member since 1989Past Chairman National Regulatory Research InstitutePast Chairman, National Regulatory Research Institute
NECPUC Symposium – 5/18/2010 11
Brewster, Massachusetts
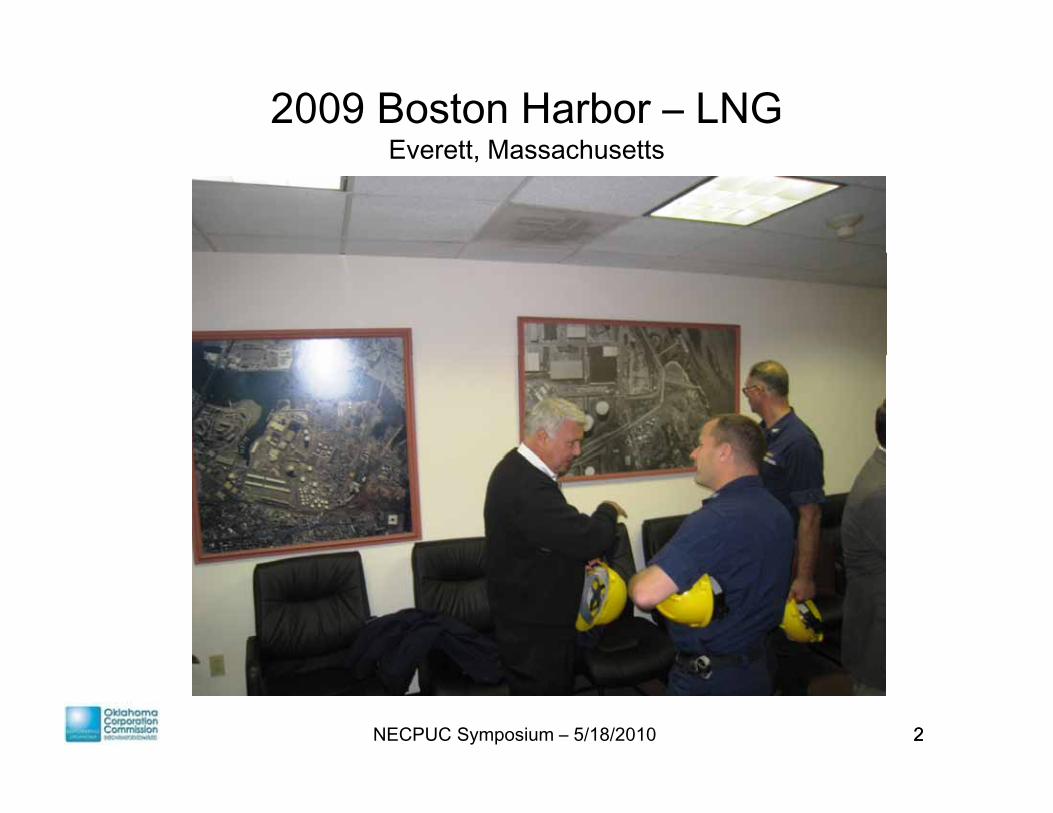
2009 Boston Harbor – LNGEverett MassachusettsEverett, Massachusetts
NECPUC Symposium – 5/18/2010 22
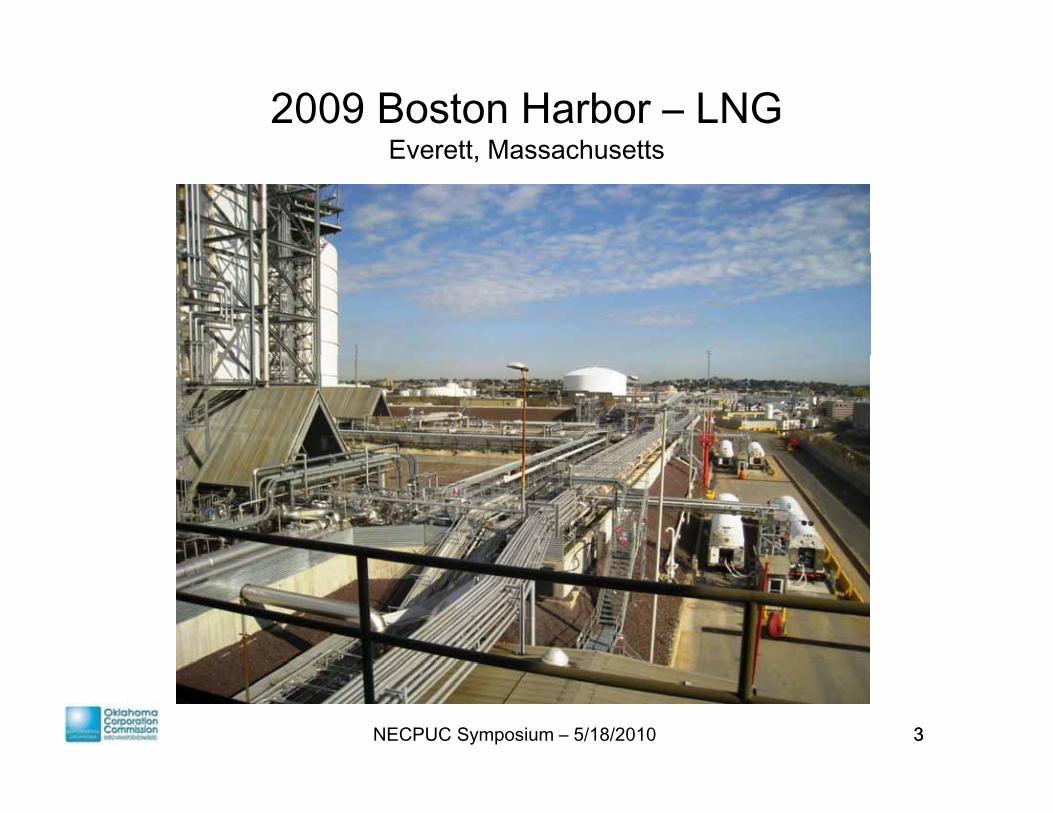
2009 Boston Harbor – LNGEverett MassachusettsEverett, Massachusetts
NECPUC Symposium – 5/18/2010 33
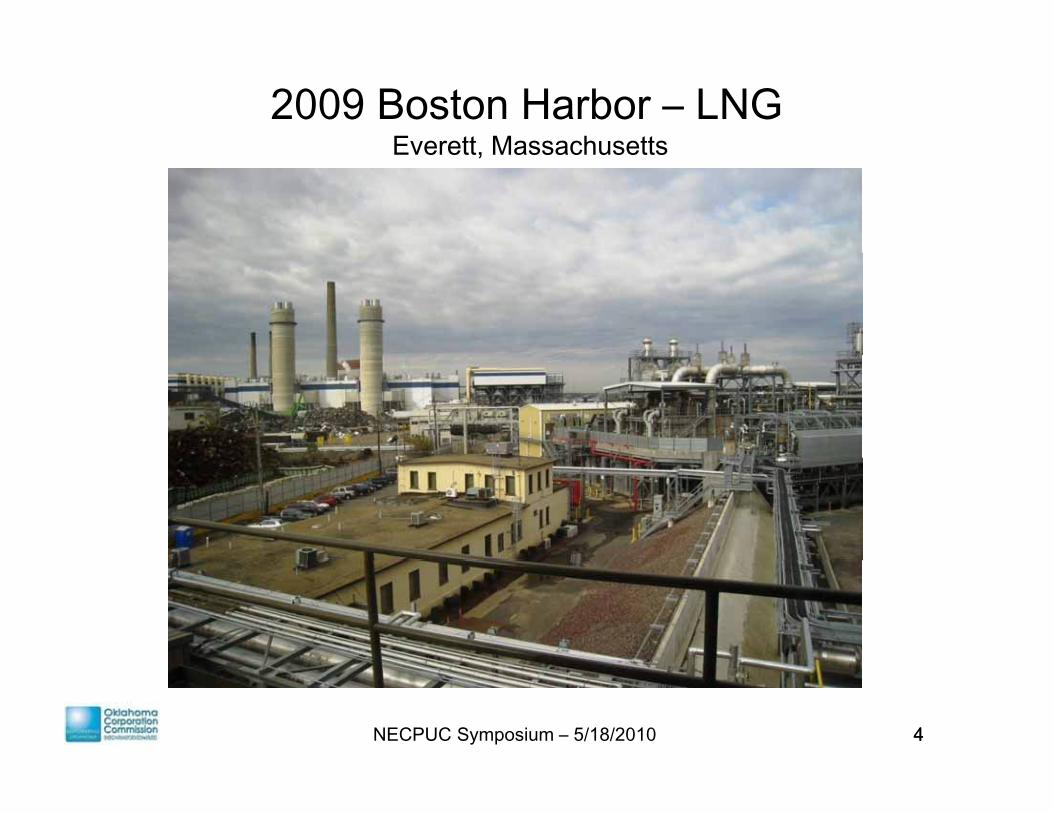
2009 Boston Harbor – LNGEverett MassachusettsEverett, Massachusetts
NECPUC Symposium – 5/18/2010 44
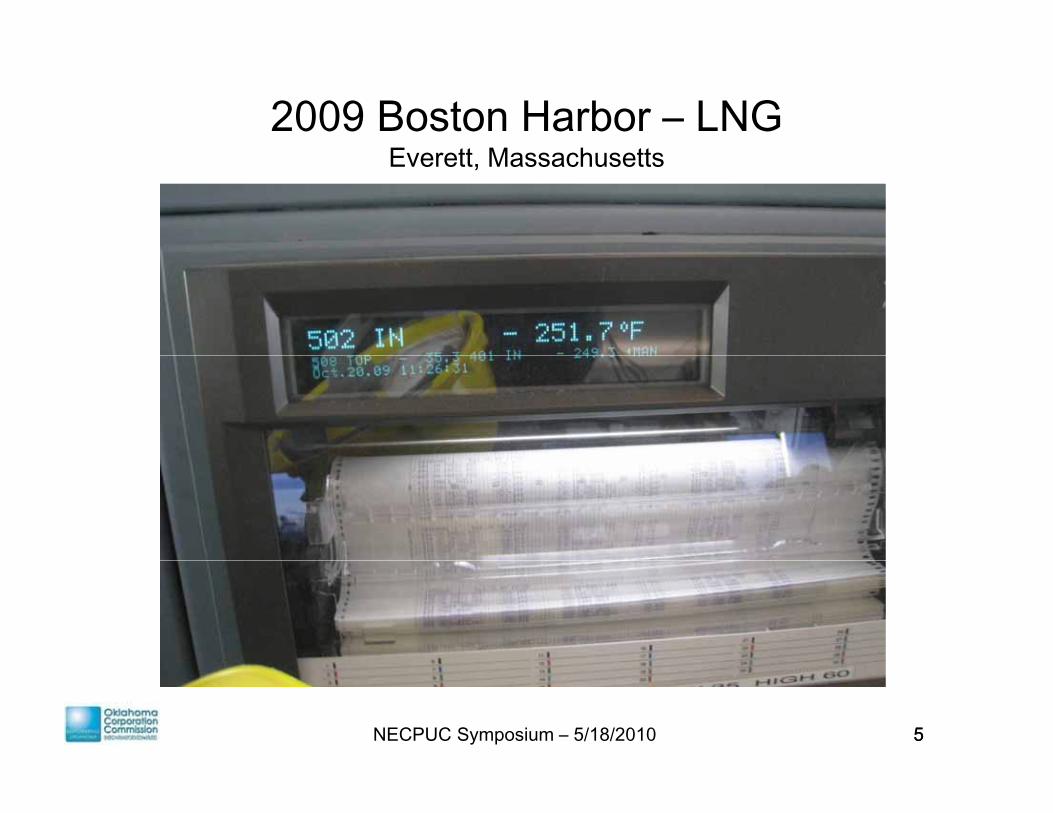
2009 Boston Harbor – LNGE tt M h ttEverett, Massachusetts
NECPUC Symposium – 5/18/2010 55
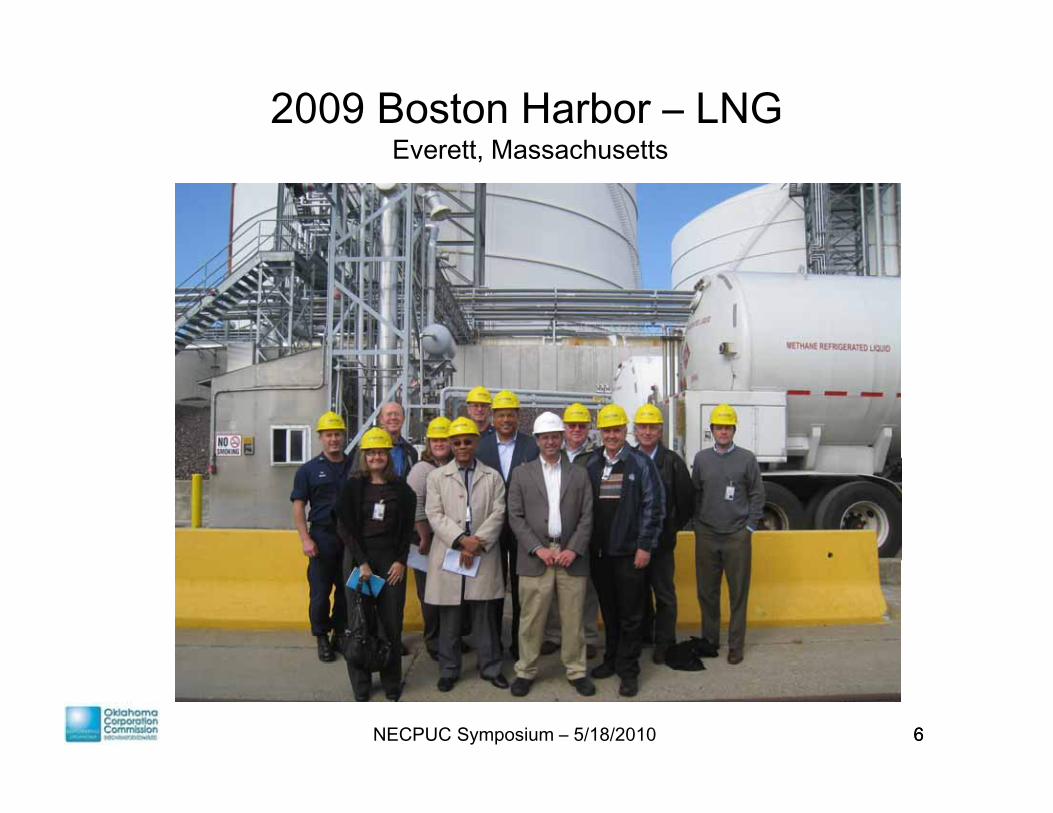
2009 Boston Harbor – LNGEverett MassachusettsEverett, Massachusetts
NECPUC Symposium – 5/18/2010 66
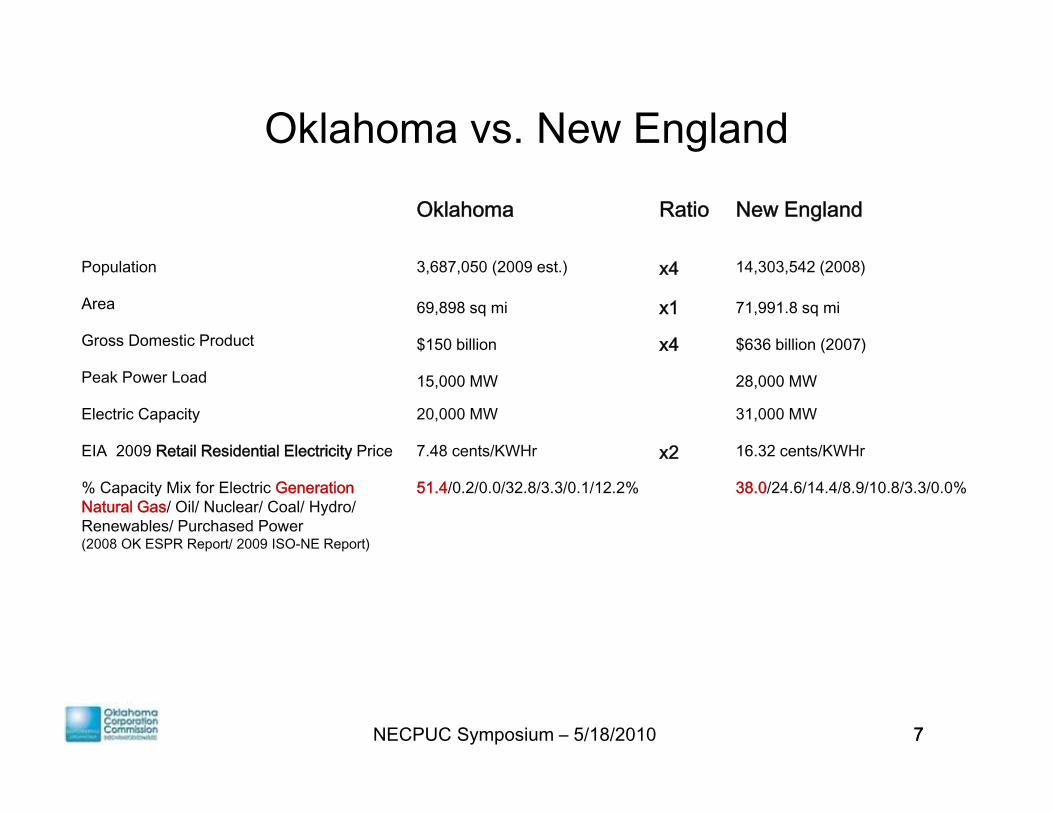
Oklahoma vs. New EnglandgOklahoma Ratio New England
Population 3,687,050 (2009 est.) x4 14,303,542 (2008)
Area 69,898 sq mi x1 71,991.8 sq mi
Gross Domestic Product $150 billion x4 $636 billion (2007)
Peak Power Load 15,000 MW 28,000 MW
Electric Capacity 20,000 MW 31,000 MW
EIA 2009 Retail Residential Electricity Price 7.48 cents/KWHr x2 16.32 cents/KWHry x2
% Capacity Mix for Electric GenerationNatural Gas/ Oil/ Nuclear/ Coal/ Hydro/Renewables/ Purchased Power (2008 OK ESPR Report/ 2009 ISO-NE Report)
51.4/0.2/0.0/32.8/3.3/0.1/12.2% 38.0/24.6/14.4/8.9/10.8/3.3/0.0%
NECPUC Symposium – 5/18/2010 77
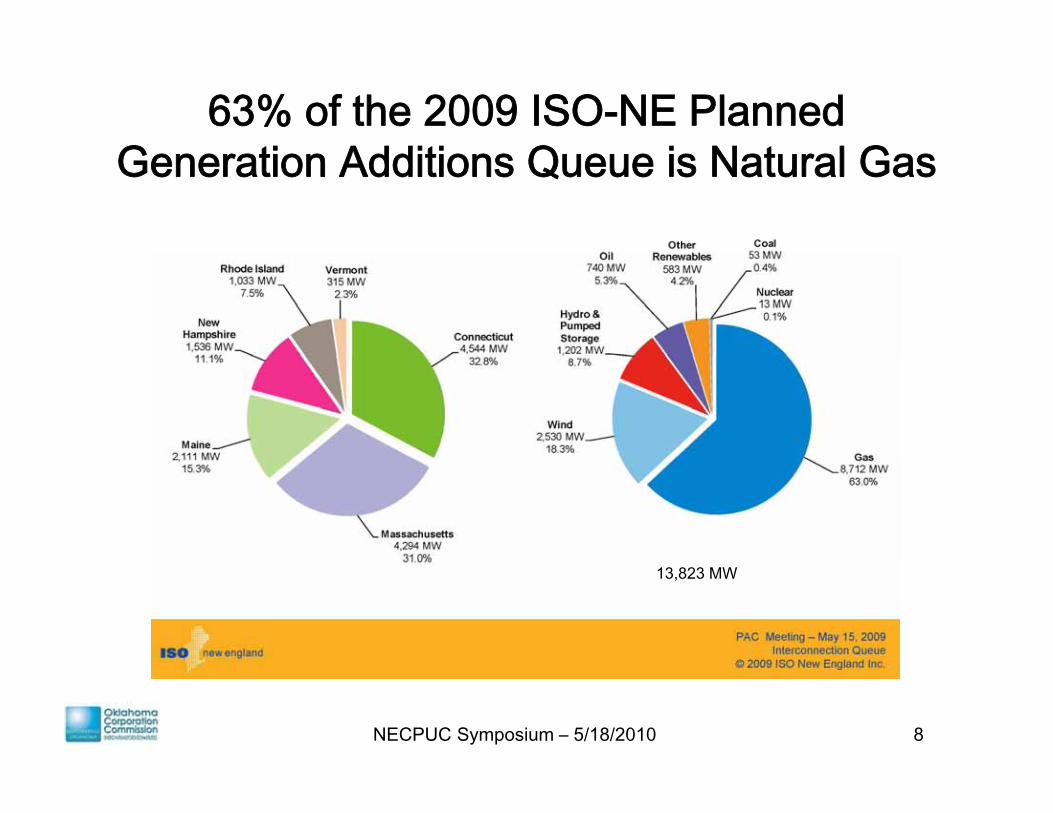
63% of the 2009 ISO-NE Planned G ti Additi Q i N t l GGeneration Additions Queue is Natural Gas
13,823 MW
NECPUC Symposium – 5/18/2010 8
• Agency established by Constitution at statehood (1907)• 3 Commissioners, elected statewide, daily meetings• 15,000 Commission Orders issued in 2009• 440 Employees440 Employees• The OCC has broad regulatory powers over :
– oil and gas drilling, production and pollution abatementoil and gas drilling, production and pollution abatement–– public utilities public utilities (telephone, electric and natural gas)pp ( p , g )– trucking – railroad crossings– petroleum storage tanks and fueling stations
pipeline safetypipeline safety
NECPUC Symposium – 5/18/2010 99
– pipeline safetypipeline safety
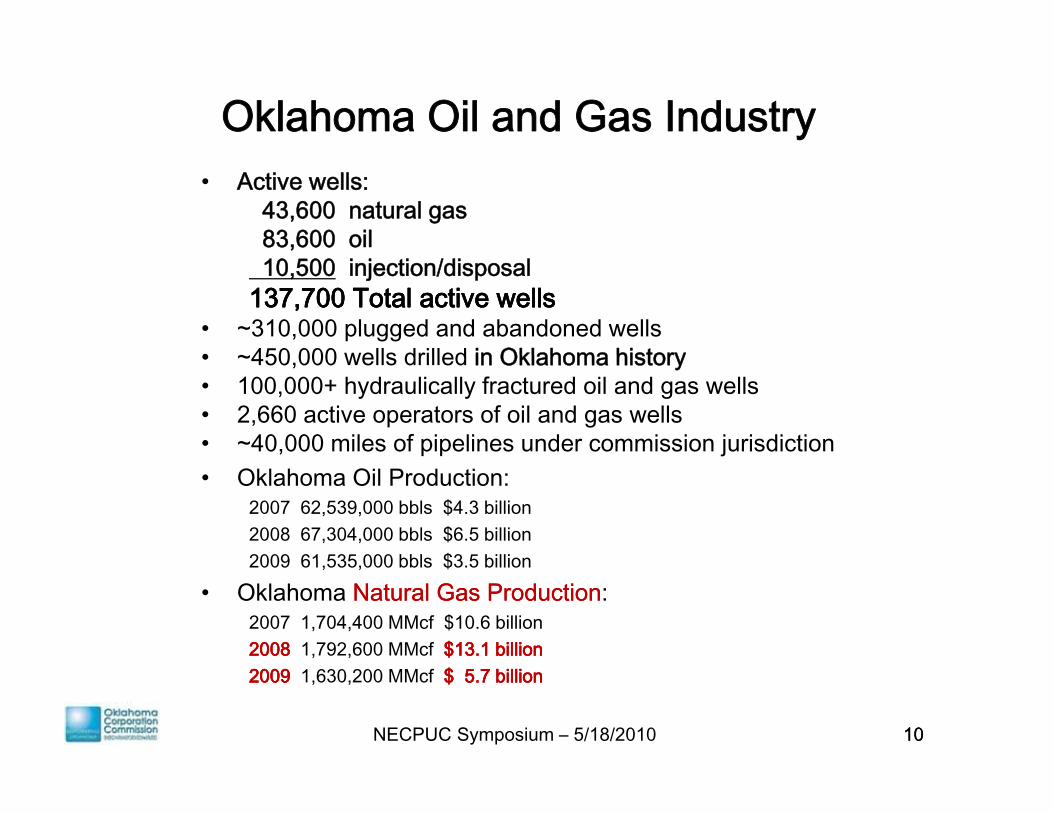
Oklahoma Oil and Gas Industry• Active wells:
43,600 natural gas83,600 oil10,500 injection/disposal
137,700 Total active wells137,700 Total active wells• ~310,000 plugged and abandoned wells• ~450 000 wells drilled in Oklahoma history• ~450,000 wells drilled in Oklahoma history• 100,000+ hydraulically fractured oil and gas wells• 2,660 active operators of oil and gas wells• ~40,000 miles of pipelines under commission jurisdiction• Oklahoma Oil Production:
2007 62,539,000 bbls $4.3 billion 2008 67,304,000 bbls $6.5 billion 2009 61 535 000 bbls $3 5 billion2009 61,535,000 bbls $3.5 billion
• Oklahoma Natural Gas ProductionNatural Gas Production:2007 1,704,400 MMcf $10.6 billion 20082008 1,792,600 MMcf $13.1 billion $13.1 billion
NECPUC Symposium – 5/18/2010 10
20092009 1,630,200 MMcf $ 5.7 billion $ 5.7 billion
10
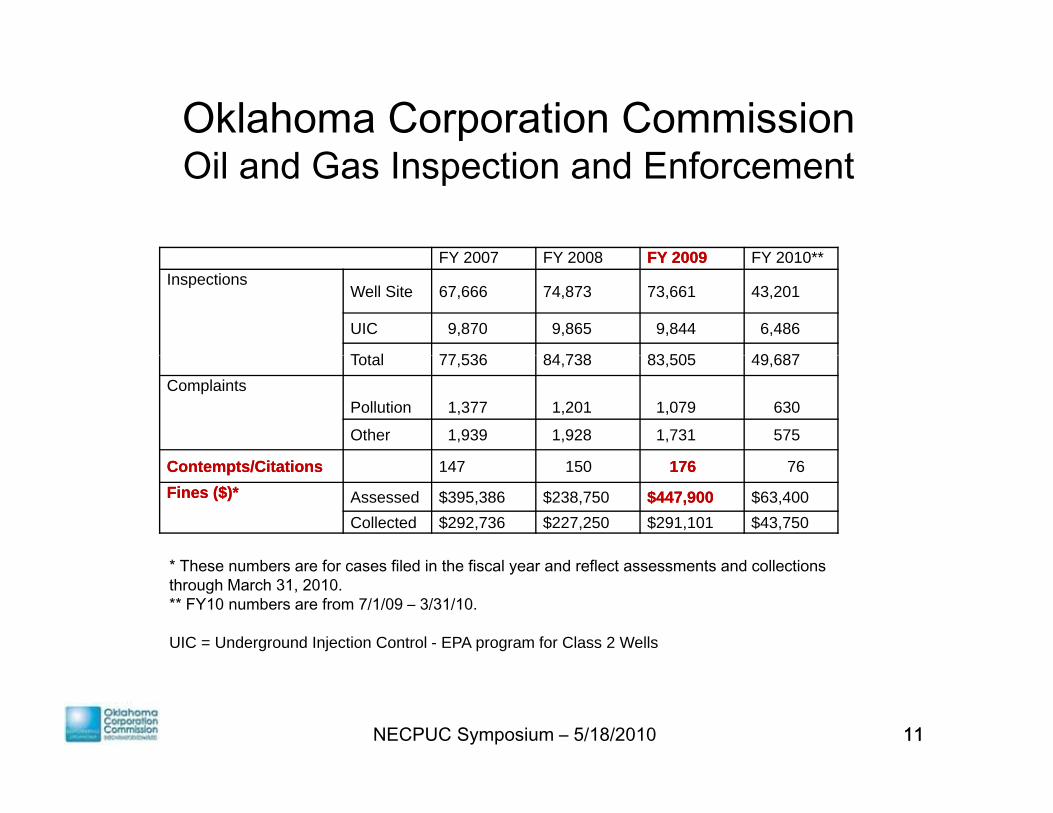
Oklahoma Corporation CommissionOil and Gas Inspection and Enforcement
FY 2007 FY 2008 FY 2009FY 2009 FY 2010**FY 2007 FY 2008 FY 2009FY 2009 FY 2010**Inspections
Well Site 67,666 74,873 73,661 43,201
UIC 9,870 9,865 9,844 6,486
T t l 77 536 84 738 83 505 49 687Total 77,536 84,738 83,505 49,687Complaints
Pollution 1,377 1,201 1,079 630
Other 1,939 1,928 1,731 575
ContemptsContempts/Citations/Citations 147 150 176176 76Fines ($)*Fines ($)* Assessed $395,386 $238,750 $447,900$447,900 $63,400
Collected $292,736 $227,250 $291,101 $43,750
* Th b f fil d i th fi l d fl t t d ll ti* These numbers are for cases filed in the fiscal year and reflect assessments and collections through March 31, 2010.** FY10 numbers are from 7/1/09 – 3/31/10.
UIC = Underground Injection Control - EPA program for Class 2 Wells
NECPUC Symposium – 5/18/2010 1111
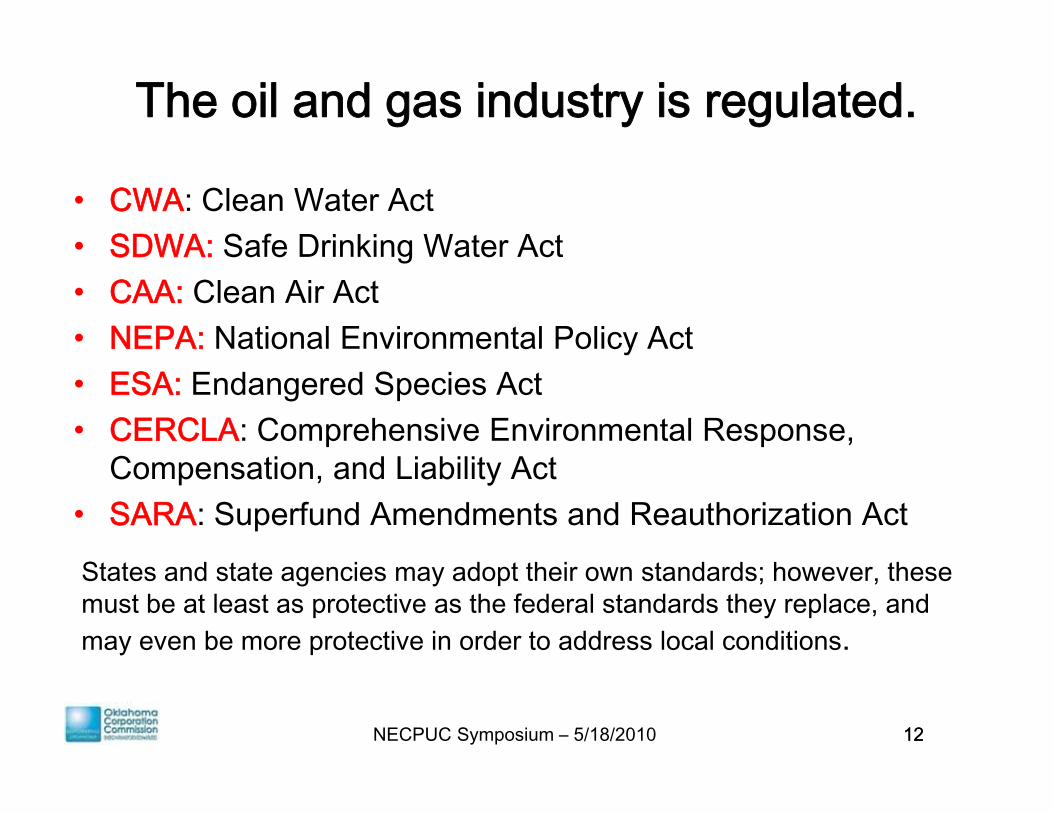
The oil and gas industry is regulated.
• CWA: Clean Water Act• SDWA: Safe Drinking Water ActSDWA: Safe Drinking Water Act• CAA: Clean Air Act• NEPA: National Environmental Policy Act• ESA: Endangered Species Act• CERCLA: Comprehensive Environmental Response,
C ti d Li bilit A tCompensation, and Liability Act• SARA: Superfund Amendments and Reauthorization Act States and state agencies may adopt their own standards; however, these must be at least as protective as the federal standards they replace, and may even be more protective in order to address local conditions.
NECPUC Symposium – 5/18/2010 1212
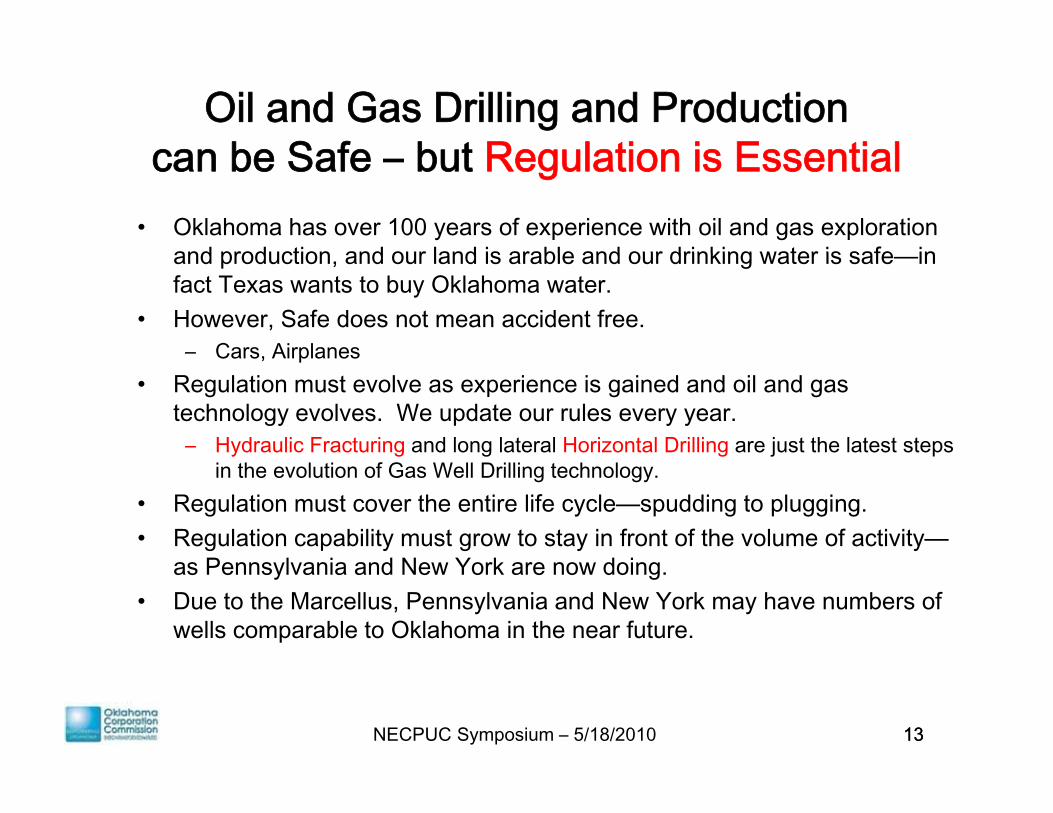
Oil and Gas Drilling and Production can be Safe but Regulation is Essentialcan be Safe – but Regulation is Essential
• Oklahoma has over 100 years of experience with oil and gas exploration and production and our land is arable and our drinking water is safe inand production, and our land is arable and our drinking water is safe—in fact Texas wants to buy Oklahoma water.
• However, Safe does not mean accident free.– Cars AirplanesCars, Airplanes
• Regulation must evolve as experience is gained and oil and gas technology evolves. We update our rules every year.
– Hydraulic Fracturing and long lateral Horizontal Drilling are just the latest steps in the evolution of Gas Well Drilling technology.
• Regulation must cover the entire life cycle—spudding to plugging.• Regulation capability must grow to stay in front of the volume of activity—
P l i d N Y k d ias Pennsylvania and New York are now doing.• Due to the Marcellus, Pennsylvania and New York may have numbers of
wells comparable to Oklahoma in the near future.
NECPUC Symposium – 5/18/2010 1313
NECPUC Symposium – 5/18/2010 1414
NECPUC Symposium – 5/18/2010 1515
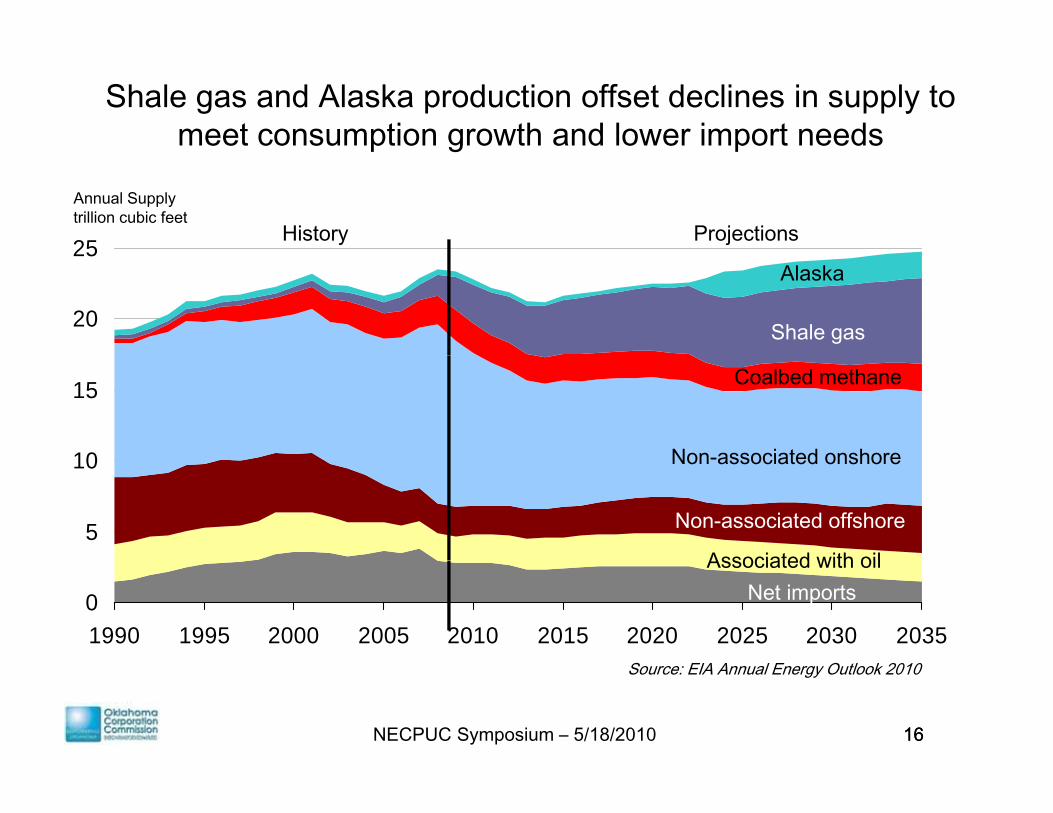
Shale gas and Alaska production offset declines in supply to meet consumption growth and lower import needsp g p
Annual Supplytrillion cubic feet
25ProjectionsHistory
20
25Alaska
Shale gas
10
15 Coalbed methane
Non-associated onshore
5
10
Non-associated offshore
Non-associated onshore
Associated with oil
S EIA A l E O l k 2010
01990 1995 2000 2005 2010 2015 2020 2025 2030 2035
Associated with oilNet imports
NECPUC Symposium – 5/18/2010 1616
Source: EIA Annual Energy Outlook 2010
2010 Winter NARUC2010 Winter NARUC Hydraulic Fracturing Panel
Hydraulic Fracturing - How to balance the need for new gas supplies with environmental uncertainties
Hydraulic fracturing releases natural gas by injecting highly pressurized water mixed with some sand anda small amount of chemicals through a deep well, lined with steel pipe and sealed with cement, into theground to break shale rocks and release natural gas.
By enabling access to previously untapped shale basins, hydraulic fracturing has been projected to increaseth ti ' l b 35% Y t t i t b t t ti ll d i t l i tthe nation's gas supply by over 35%. Yet, uncertainty about potentially adverse environmental impacts,including concerns about drinking and agricultural water contamination, have raised questions about potentialunintended environmental consequences.
Moderator: Hon. Bob Anthony-Chairman, Oklahoma Corporation CommissionPanelists:Panelists:
Hon. Barry Smitherman-Chairman, Public Utility Commission of TexasSteve Heare-Dir, Drinking Water Protection DivisionDir, Drinking Water Protection Division, Office of Groundwater & Drinking Water, US EPAUS EPABill Kappel, Hydrologist, Section Chief, US Geological SurveyHydrologist, Section Chief, US Geological Survey, Water Science Center, Ithaca, NYMichael Bahorich -Executive Vice President and Technology Officer, Apache Corporation
NECPUC Symposium – 5/18/2010 17
Nancy Johnson-Dir, Environmental Science and Policy Analysis, Dir, Environmental Science and Policy Analysis, DOE Office of Oil and Natural Gas
17
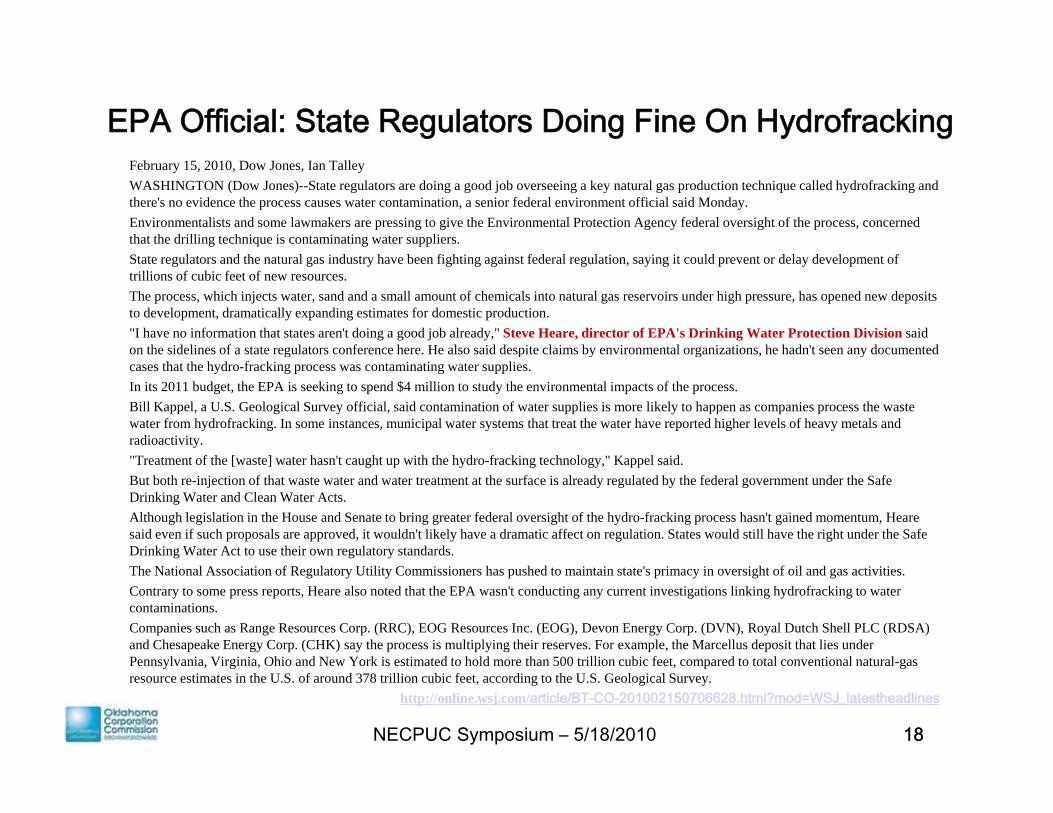
EPA Official: State Regulators Doing Fine On HydrofrackingFebruary 15, 2010, Dow Jones, Ian Talley WASHINGTON (Dow Jones)--State regulators are doing a good job overseeing a key natural gas production technique called hydrofracking and there's no evidence the process causes water contamination, a senior federal environment official said Monday. Environmentalists and some lawmakers are pressing to give the Environmental Protection Agency federal oversight of the process, concerned that the drilling technique is contaminating water suppliers. State regulators and the natural gas industry have been fighting against federal regulation, saying it could prevent or delay development of trillions of cubic feet of new resources. The process, which injects water, sand and a small amount of chemicals into natural gas reservoirs under high pressure, has opened new deposits to development, dramatically expanding estimates for domestic production. "I have no information that states aren't doing a good job already," Steve Heare, director of EPA's Drinking Water Protection Division said on the sidelines of a state regulators conference here. He also said despite claims by environmental organizations, he hadn't seen any documented g p y g , ycases that the hydro-fracking process was contaminating water supplies. In its 2011 budget, the EPA is seeking to spend $4 million to study the environmental impacts of the process. Bill Kappel, a U.S. Geological Survey official, said contamination of water supplies is more likely to happen as companies process the waste water from hydrofracking. In some instances, municipal water systems that treat the water have reported higher levels of heavy metals and radioactivity. "T t t f th [ t ] t h 't ht ith th h d f ki t h l " K l id"Treatment of the [waste] water hasn't caught up with the hydro-fracking technology," Kappel said. But both re-injection of that waste water and water treatment at the surface is already regulated by the federal government under the Safe Drinking Water and Clean Water Acts. Although legislation in the House and Senate to bring greater federal oversight of the hydro-fracking process hasn't gained momentum, Hearesaid even if such proposals are approved, it wouldn't likely have a dramatic affect on regulation. States would still have the right under the Safe Drinking Water Act to use their own regulatory standards. The National Association of Regulatory Utility Commissioners has pushed to maintain state's primacy in oversight of oil and gas activities. Contrary to some press reports, Heare also noted that the EPA wasn't conducting any current investigations linking hydrofracking to water contaminations. Companies such as Range Resources Corp. (RRC), EOG Resources Inc. (EOG), Devon Energy Corp. (DVN), Royal Dutch Shell PLC (RDSA) and Chesapeake Energy Corp. (CHK) say the process is multiplying their reserves. For example, the Marcellus deposit that lies under Pennsylvania Virginia Ohio and New York is estimated to hold more than 500 trillion cubic feet compared to total conventional natural-gas
NECPUC Symposium – 5/18/2010 18
Pennsylvania, Virginia, Ohio and New York is estimated to hold more than 500 trillion cubic feet, compared to total conventional natural-gas resource estimates in the U.S. of around 378 trillion cubic feet, according to the U.S. Geological Survey.
http://online.wsj.com/article/BT-CO-201002150706628.html?mod=WSJ_latestheadlines
18
Hydraulic Fracturing on the NetHydraulic Fracturing on the NetWikipedia (http://en.wikipedia.org/wiki/Hydraulic_fracturing)• The technique of hydraulic fracturing is used to increase or restore the rate at which fluids, such
as oil, gas or water can be produced from a reservoir, including unconventional reservoirs such as shale rock or coal beds. Environmental concerns Environmental concerns regarding hydrofracturing techniques include potential for contamination of aquifers with fracturing chemicals or waste fluidspotential for contamination of aquifers with fracturing chemicals or waste fluids. On the other hand, hydraulic fracturing is applied to remediation of environmental waste spills.
• The process of hydraulic fracturing is used to enable the production of natural gas and oil from rock formations deep below the earth’s surface (generally 5,000-20,000’) that otherwise do not
ffi i t it d bilit t ll th t l d il t fl thposses sufficient porosity and permeability to allow the natural gas and oil to flow up the borehole to be recovered at the surface of the earth. Creating conductive fractures in the rock is essential to produce hydrocarbons due to the extremely low natural permeability of shale reservoirs (measured in the microdarcy to nanodarcy range). The fracture provides a conductive path connecting a larger area of the reservoir to the well, thereby increasing the area from which natural gas and liquids can be recovered from the targeted formationnatural gas and liquids can be recovered from the targeted formation.
• Hydraulic fracturing for stimulation of oil and natural gas wells was first used in the United States in 1947 It was first used commercially in 1949, and because of its success in increasing production from oil wells was quickly adopted, and is now used worldwide in tens of thousands of oil and natural gas wells annually.
• As estimated 90% of the natural gas wells in the U S rely on hydraulic fracturing to produceAs estimated 90% of the natural gas wells in the U.S. rely on hydraulic fracturing to produce natural gas at economic rates.
Natural Resources Defense Council (NRDC )http://switchboard.nrdc.org/blogs/amall/incidents_where_hydraulic_frac.html
PBS “NOW” 3/26/2010 “Gasland” http://www pbs org/now/shows/613/PBS NOW” 3/26/2010 Gasland” http://www.pbs.org/now/shows/613/
NECPUC Symposium – 5/18/2010 19
Gas Shale Primer(DOE Office of Fossil Energy)
Http://fossil.energy.gov/programs/oilgas/publications/naturalgas_general/Shale_Gas_Primer_2009.pdf
NECPUC Symposium – 5/18/2010 2020
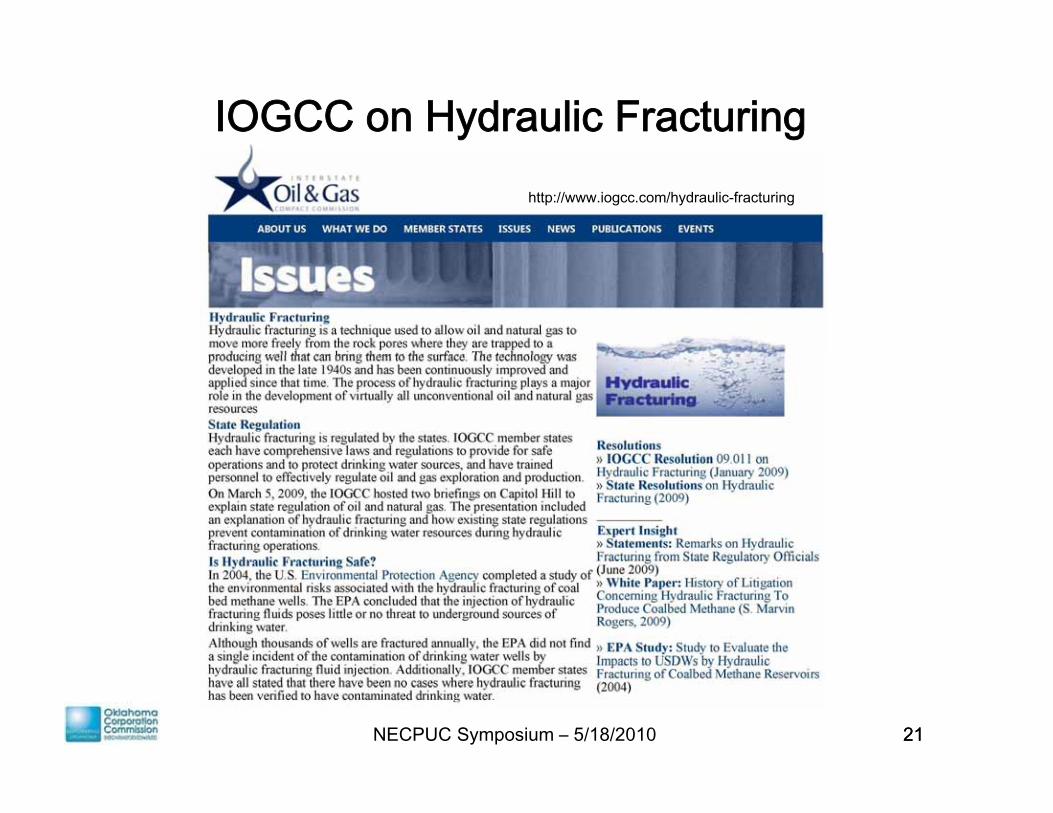
IOGCC on Hydraulic Fracturinghttp://www.iogcc.com/hydraulic-fracturing
NECPUC Symposium – 5/18/2010 2121
Hydraulic Fracturing Basics Oklahoma• Over 60 years of Hydraulic Fracturing (better than nitroglycerin)• Over 100,000 hydraulically fractured oil and gas wells, y y g• No verified or documented instances of harm to groundwater from HF• Cost per well: $10,000 to $1 million plus • HF tailored to individual well characteristicsWhat is Hydraulic Fracturing ?• A method for creating a conductive fracture or crack in a subsurface
formation to provide an easier path for fluids to flow to the well bore f th t iti f th ll' d ifrom the extremities of the well's drainage area
Why Frac ?• To stimulate oil and/or gas production to increase Net Present Value
(NPV) f ll th h(NPV) of a well through:• Accelerating income through increasing production rates• Reducing well life operating expenses• Increasing total cumulative production (reserves)
NECPUC Symposium – 5/18/2010 22
Increasing total cumulative production (reserves)
22
Source: “Hydraulic Fracturing”, Mohd Zaki bin Awang
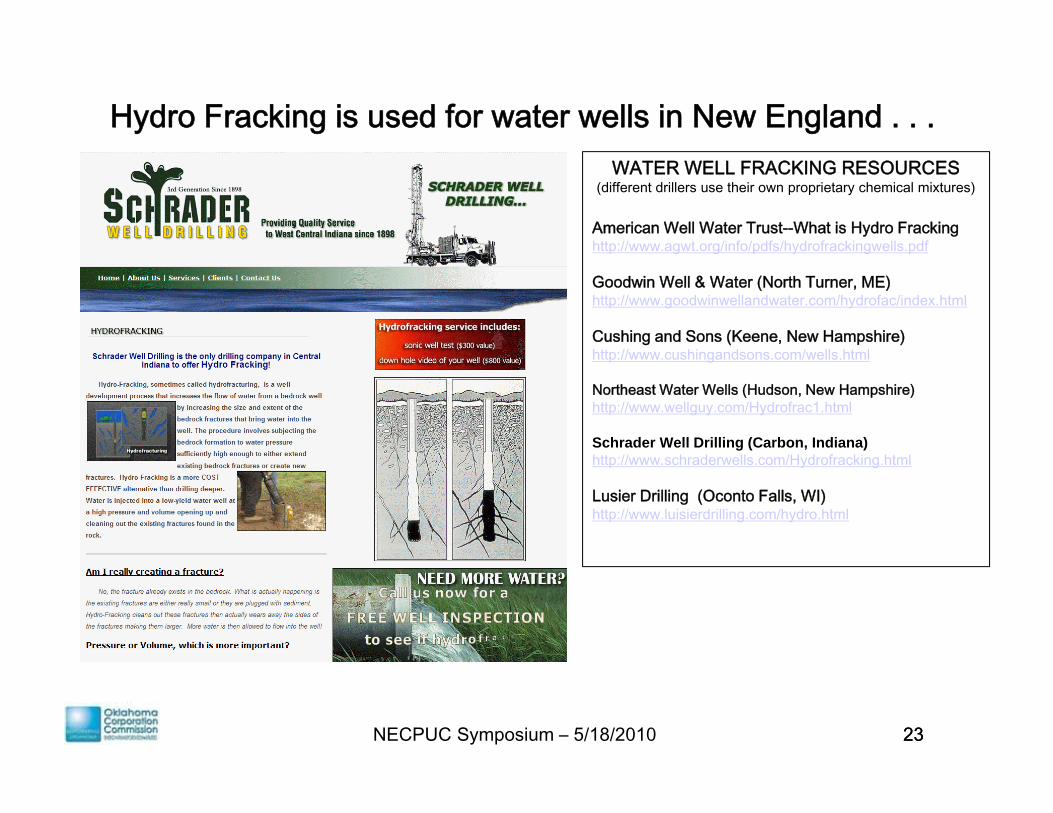
Hydro Fracking is used for water wells in New England . . .WATER WELL FRACKING RESOURCES
(different drillers use their own proprietary chemical mixtures)
American Well Water Trust--What is Hydro Frackinghttp://www.agwt.org/info/pdfs/hydrofrackingwells.pdfp g g p y g p
Goodwin Well & Water (North Turner, ME)http://www.goodwinwellandwater.com/hydrofac/index.html
Cushing and Sons (Keene, New Hampshire)http://www cushingandsons com/wells htmlhttp://www.cushingandsons.com/wells.html
Northeast Water Wells (Hudson, New Hampshire)http://www.wellguy.com/Hydrofrac1.html
Schrader Well Drilling (Carbon, Indiana)http://www schraderwells com/Hydrofracking htmlhttp://www.schraderwells.com/Hydrofracking.html
Lusier Drilling (Oconto Falls, WI)http://www.luisierdrilling.com/hydro.html
NECPUC Symposium – 5/18/2010 2323
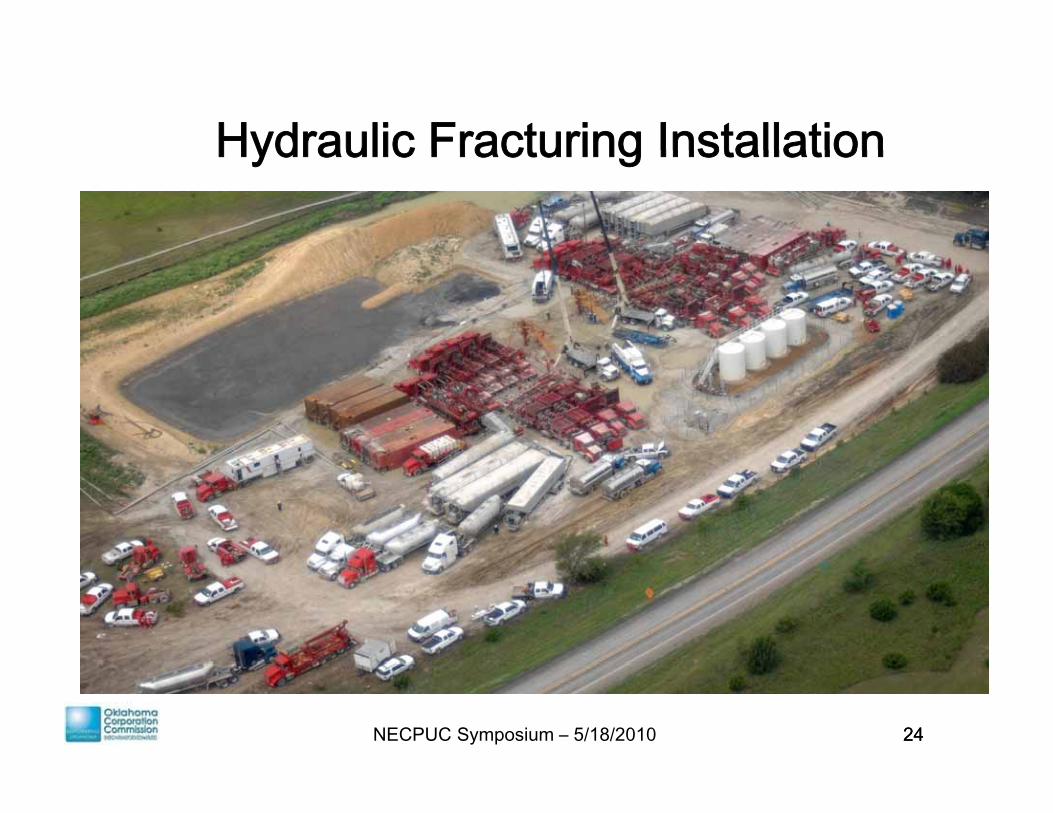
Hydraulic Fracturing InstallationHydraulic Fracturing Installation
NECPUC Symposium – 5/18/2010 2424
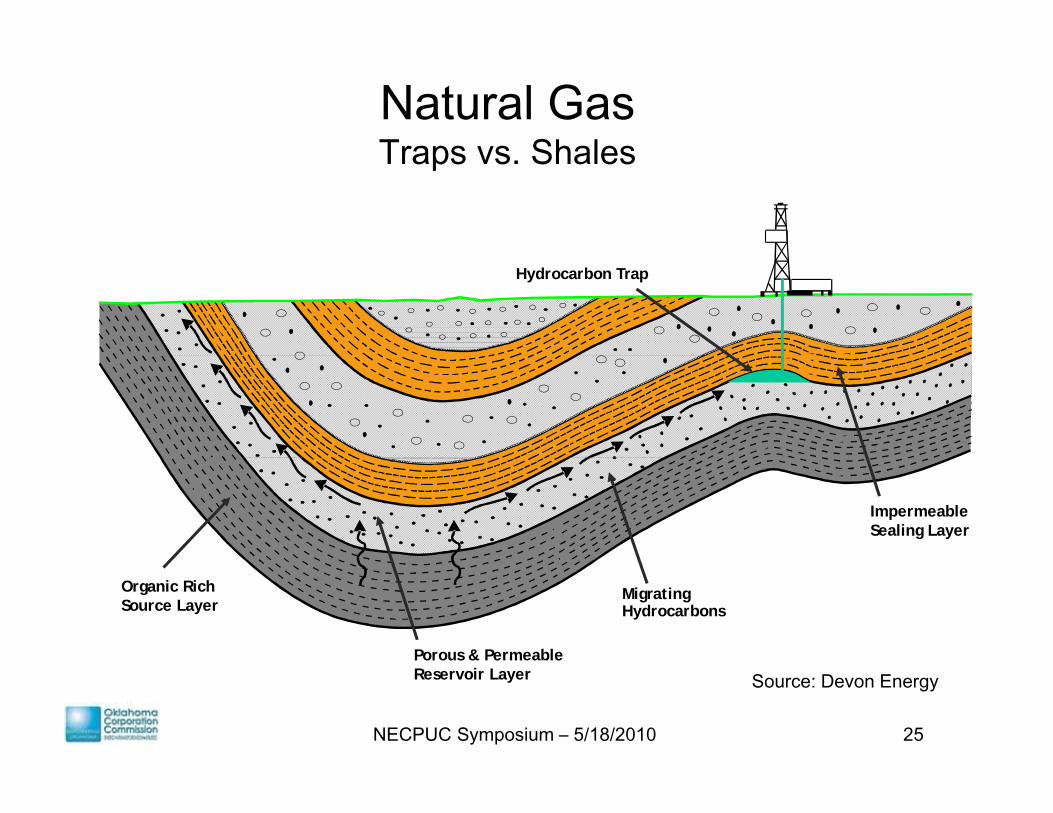
Natural Gas Traps vs ShalesTraps vs. Shales
Hydrocarbon Trap
ImpermeableSealing Layer
Organic RichSource Layer
Porous & Permeable
MigratingHydrocarbons
NECPUC Symposium – 5/18/2010 25
Reservoir Layer Source: Devon Energy
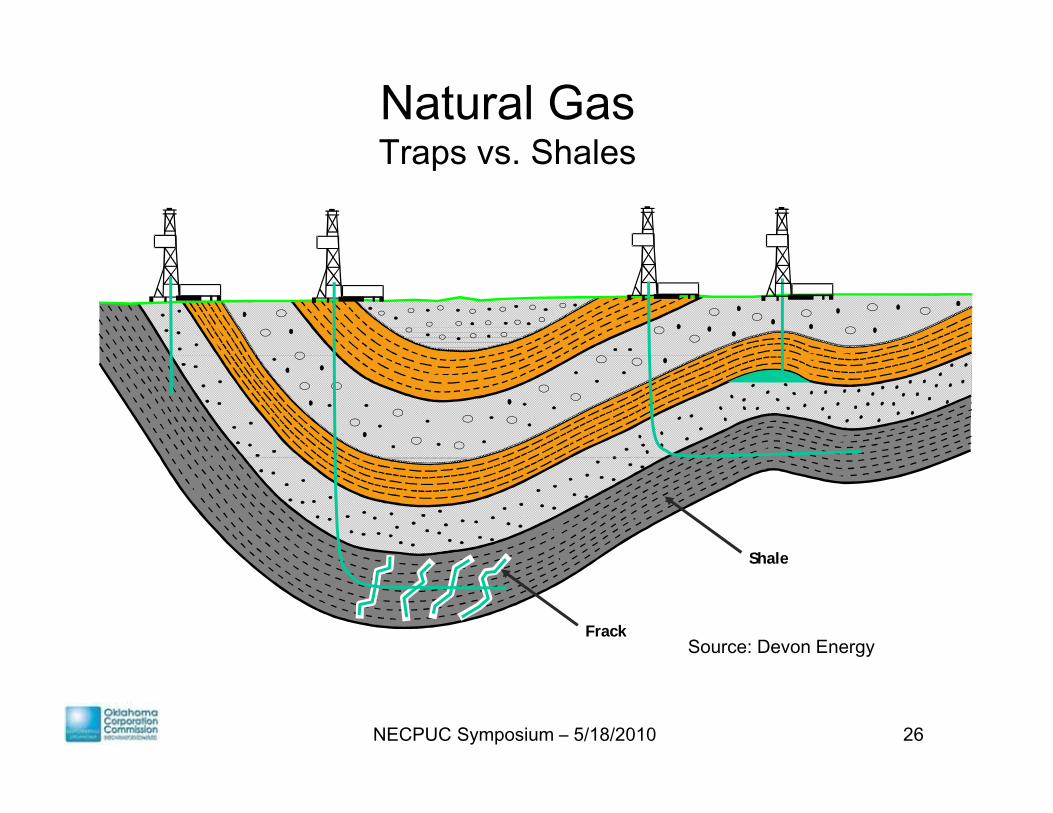
Natural Gas Traps vs ShalesTraps vs. Shales
ShaleShale
FrackSource: Devon Energy
NECPUC Symposium – 5/18/2010 26
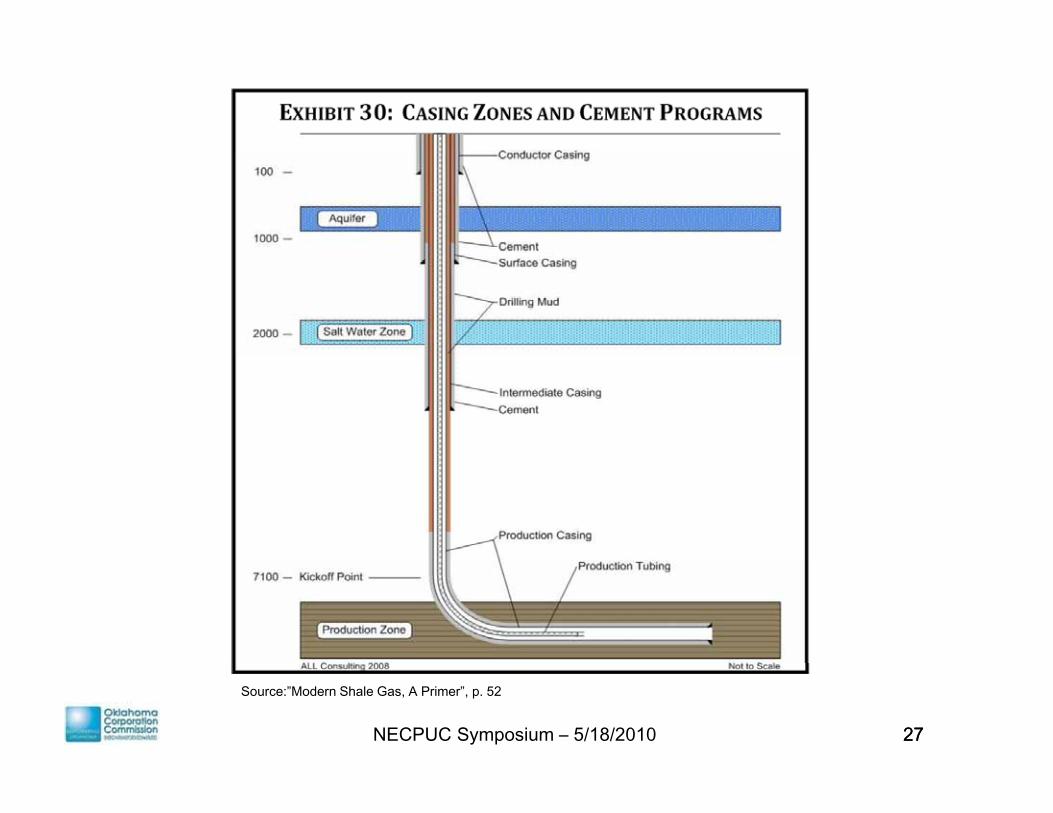
NECPUC Symposium – 5/18/2010 2727
Source:”Modern Shale Gas, A Primer”, p. 52
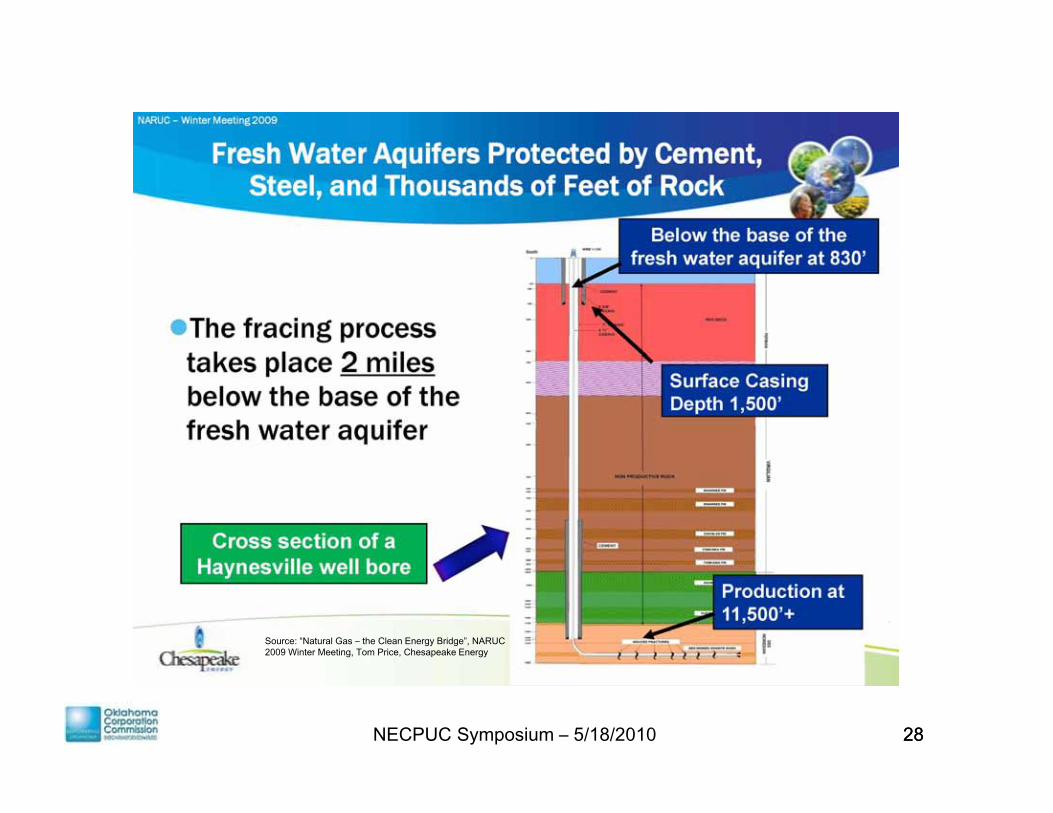
Source: “Natural Gas – the Clean Energy Bridge”, NARUC 2009 Winter Meeting, Tom Price, Chesapeake Energy
NECPUC Symposium – 5/18/2010 2828
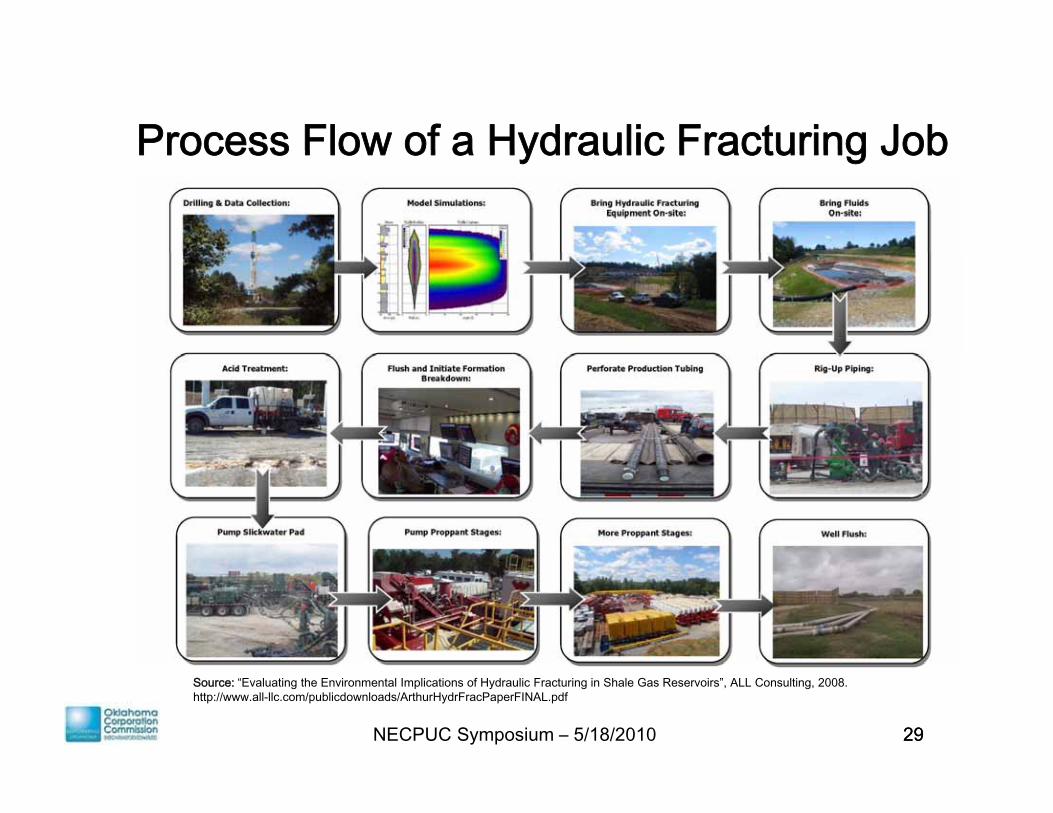
Process Flow of a Hydraulic Fracturing JobProcess Flow of a Hydraulic Fracturing Job
NECPUC Symposium – 5/18/2010 2929
Source: “Evaluating the Environmental Implications of Hydraulic Fracturing in Shale Gas Reservoirs”, ALL Consulting, 2008.http://www.all-llc.com/publicdownloads/ArthurHydrFracPaperFINAL.pdf
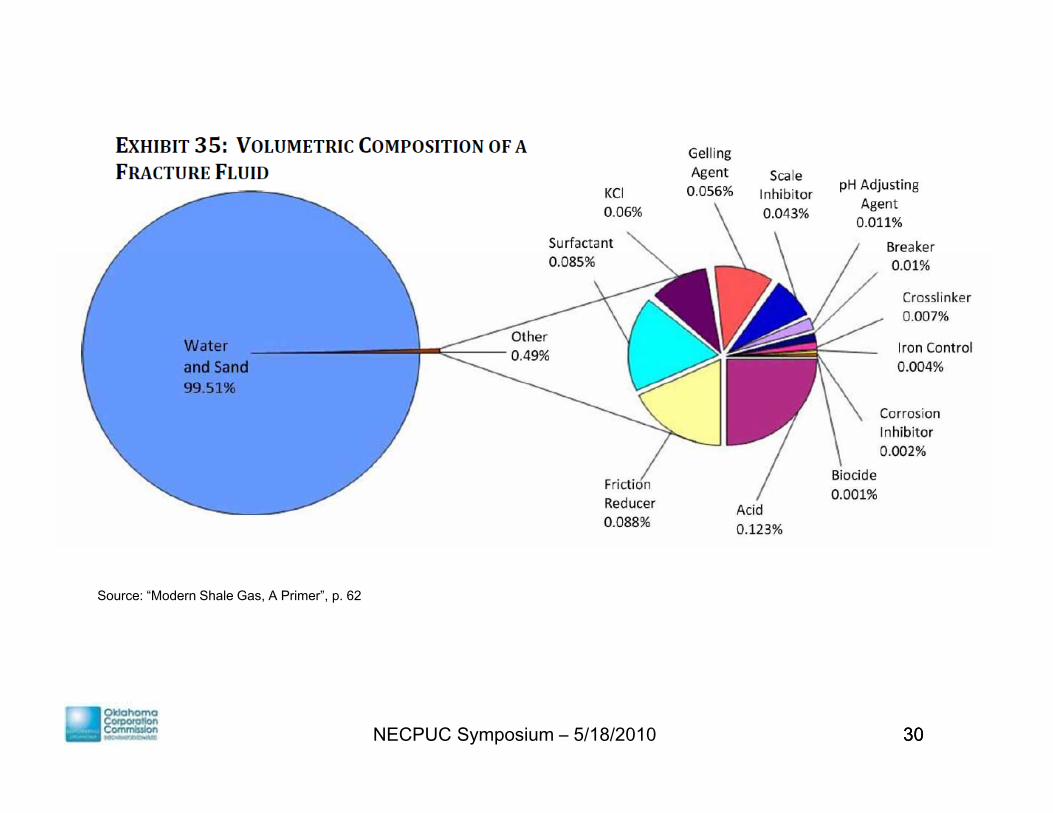
Source: “Modern Shale Gas, A Primer”, p. 62
NECPUC Symposium – 5/18/2010 3030
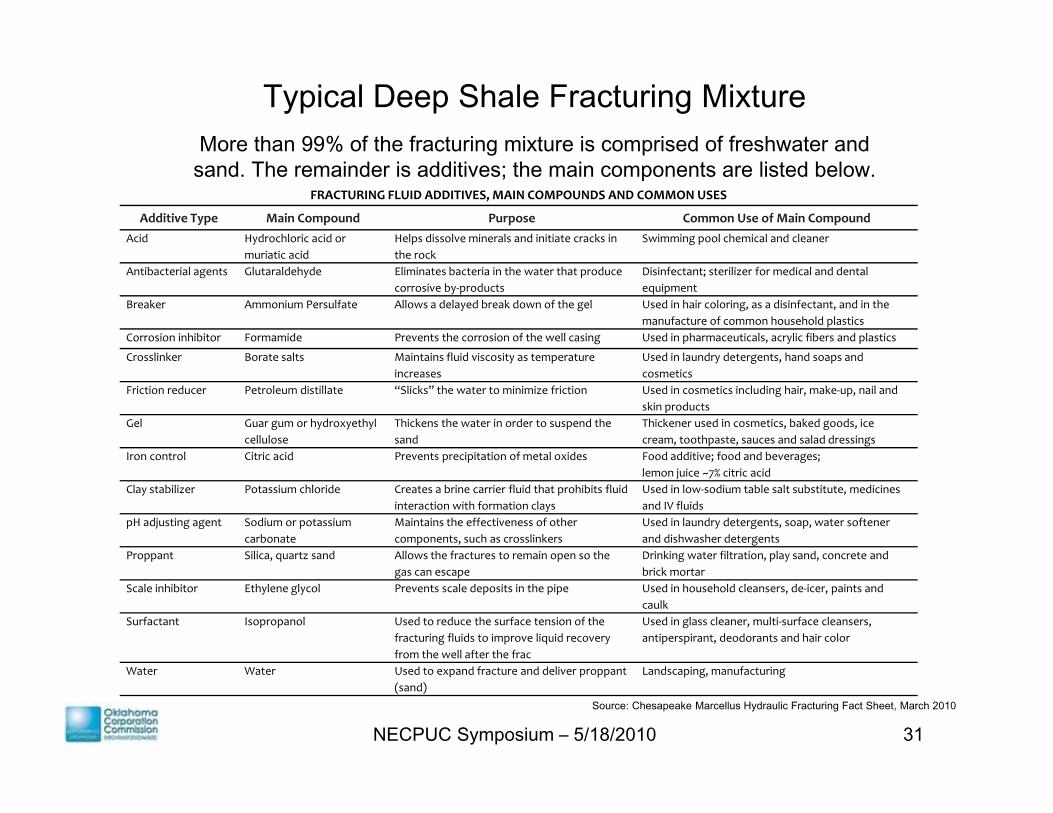
Typical Deep Shale Fracturing MixtureMore than 99% of the fracturing mixture is comprised of freshwater and
FRACTURING FLUID ADDITIVES, MAIN COMPOUNDS AND COMMON USES
Additive Type Main Compound Purpose Common Use of Main CompoundAcid Hydrochloric acid or
m riatic acid Helps dissolve minerals and initiate cracks in the rock
Swimming pool chemical and cleaner
More than 99% of the fracturing mixture is comprised of freshwater and sand. The remainder is additives; the main components are listed below.
muriatic acid the rock Antibacterial agents Glutaraldehyde Eliminates bacteria in the water that produce
corrosive by‐products Disinfectant; sterilizer for medical and dental equipment
Breaker Ammonium Persulfate Allows a delayed break down of the gel Used in hair coloring, as a disinfectant, and in the manufacture of common household plastics
Corrosion inhibitor Formamide Prevents the corrosion of the well casing Used in pharmaceuticals, acrylic fibers and plastics
Crosslinker Borate salts Maintains fluid viscosity as temperature Used in laundry detergents hand soaps and Crosslinker Borate salts Maintains fluid viscosity as temperature increases
Used in laundry detergents, hand soaps and cosmetics
Friction reducer Petroleum distillate “Slicks” the water to minimize friction Used in cosmetics including hair, make‐up, nail and skin products
Gel Guar gum or hydroxyethyl cellulose
Thickens the water in order to suspend the sand
Thickener used in cosmetics, baked goods, ice cream, toothpaste, sauces and salad dressings
Iron control Citric acid Prevents precipitation of metal oxides Food additive; food and beverages; Iron control Citric acid Prevents precipitation of metal oxides Food additive; food and beverages; lemon juice ~7% citric acid
Clay stabilizer Potassium chloride Creates a brine carrier fluid that prohibits fluid interaction with formation clays
Used in low‐sodium table salt substitute, medicines and IV fluids
pH adjusting agent Sodium or potassium carbonate
Maintains the effectiveness of other components, such as crosslinkers
Used in laundry detergents, soap, water softener and dishwasher detergents
Proppant Silica, quartz sand Allows the fractures to remain open so the Drinking water filtration, play sand, concrete and pp , q pgas can escape
g , p y ,brick mortar
Scale inhibitor Ethylene glycol Prevents scale deposits in the pipe Used in household cleansers, de‐icer, paints and caulk
Surfactant Isopropanol Used to reduce the surface tension of the fracturing fluids to improve liquid recovery from the well after the frac
Used in glass cleaner, multi‐surface cleansers, antiperspirant, deodorants and hair color
NECPUC Symposium – 5/18/2010 31Source: Chesapeake Marcellus Hydraulic Fracturing Fact Sheet, March 2010
Water Water Used to expand fracture and deliver proppant(sand)
Landscaping, manufacturing
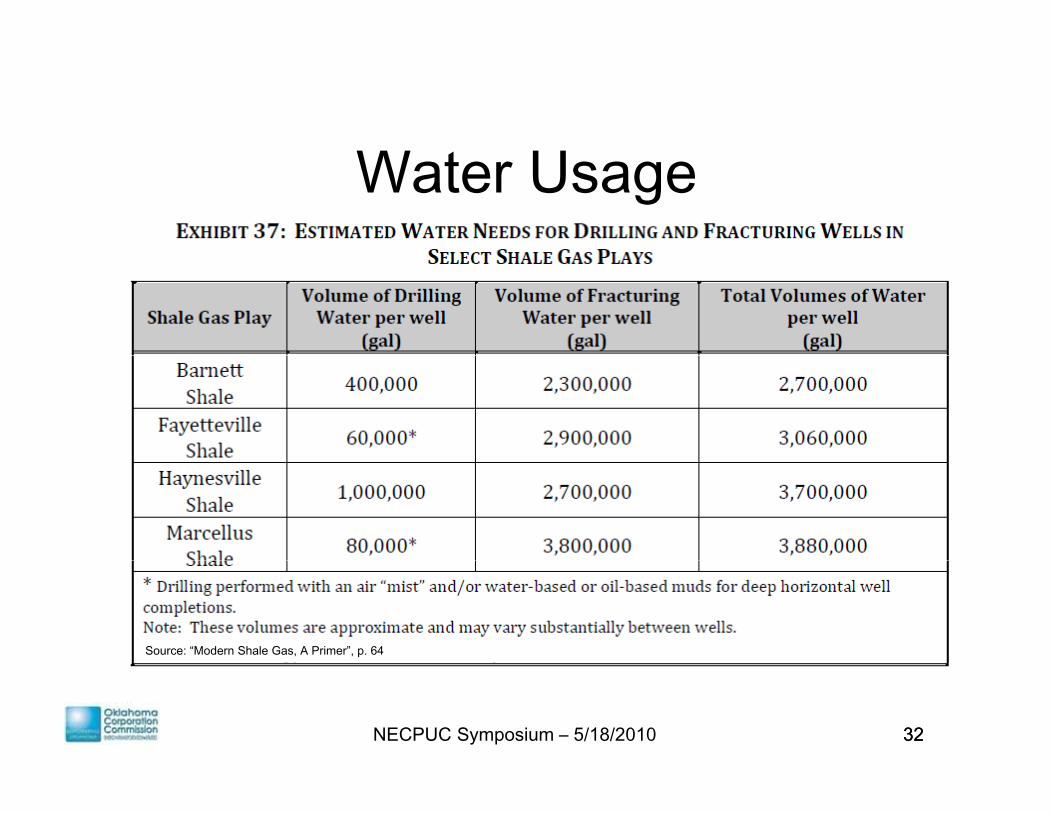
Water Usage
Source: “Modern Shale Gas, A Primer”, p. 64
NECPUC Symposium – 5/18/2010 3232
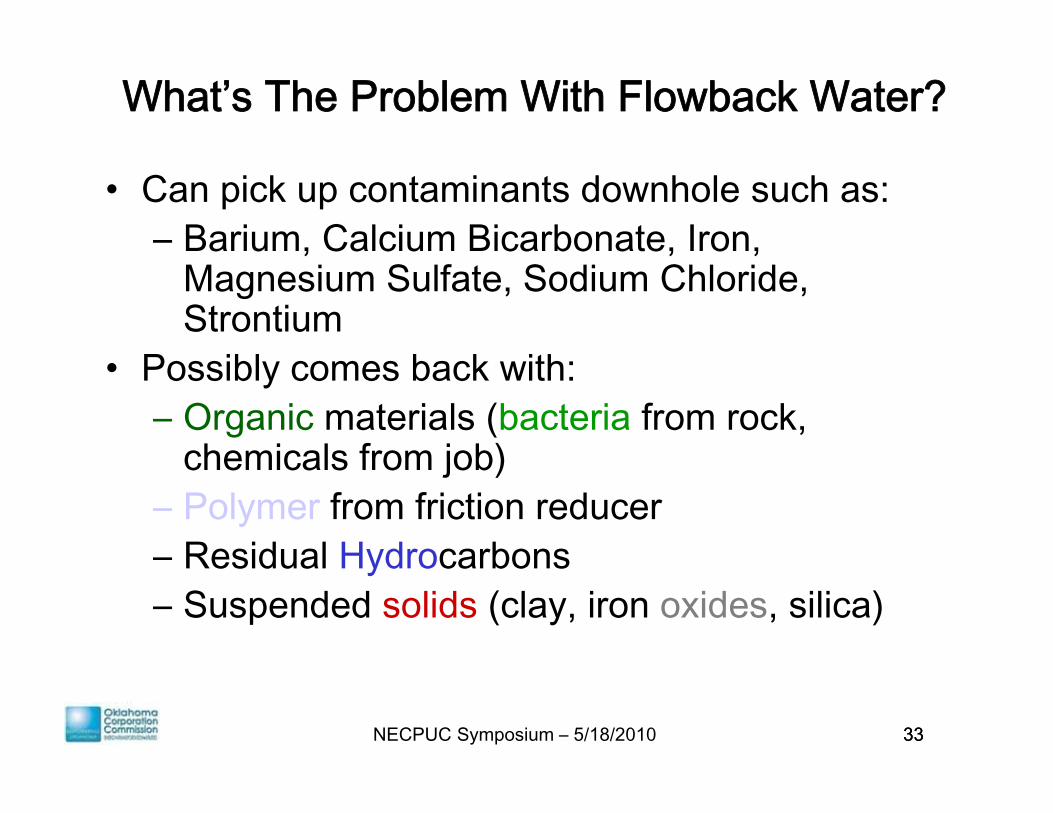
What’s The Problem With Flowback Water?
• Can pick up contaminants downhole such as:– Barium, Calcium Bicarbonate, Iron, , , ,
Magnesium Sulfate, Sodium Chloride, Strontium
P ibl b k ith• Possibly comes back with:– Organic materials (bacteria from rock,
chemicals from job)chemicals from job)– Polymer from friction reducer– Residual HydrocarbonsResidual Hydrocarbons– Suspended solids (clay, iron oxides, silica)
NECPUC Symposium – 5/18/2010 3333
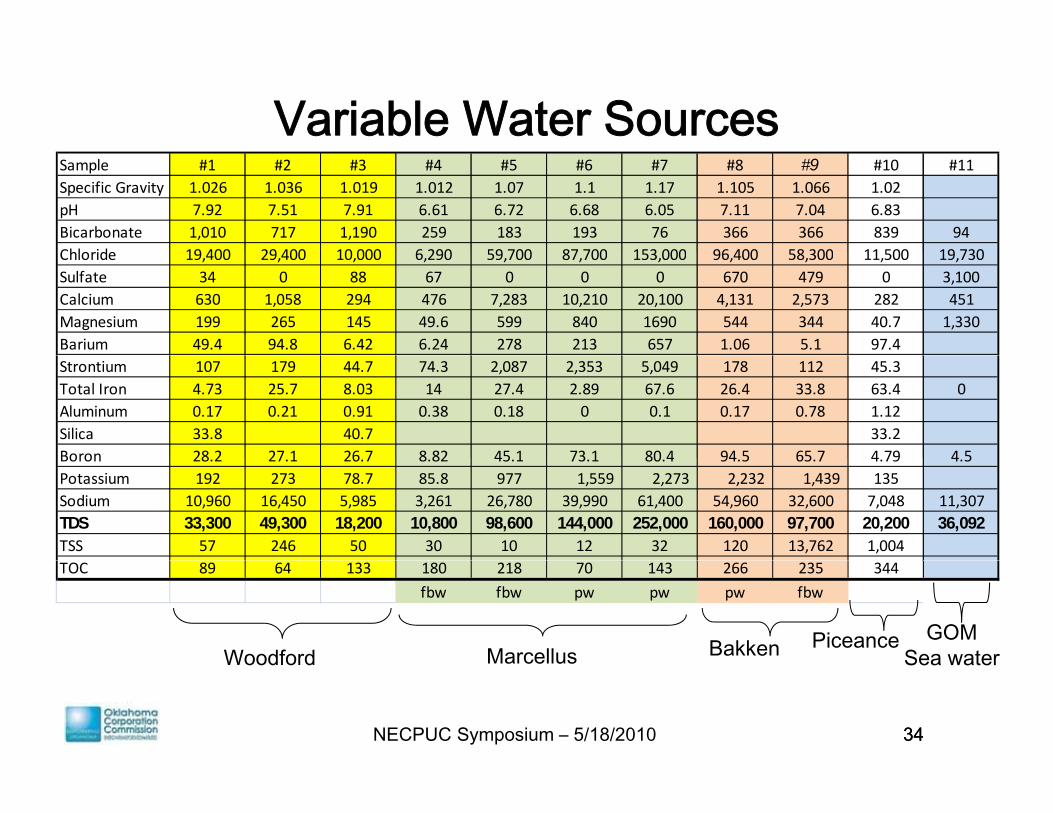
Variable Water SourcesSample #1 #2 #3 #4 #5 #6 #7 #8 #9 #10 #11Specific Gravity 1.026 1.036 1.019 1.012 1.07 1.1 1.17 1.105 1.066 1.02pH 7.92 7.51 7.91 6.61 6.72 6.68 6.05 7.11 7.04 6.83Bicarbonate 1,010 717 1,190 259 183 193 76 366 366 839 94Chloride 19 400 29 400 10 000 6 290 59 700 87 700 153 000 96 400 58 300 11 500 19 730Chloride 19,400 29,400 10,000 6,290 59,700 87,700 153,000 96,400 58,300 11,500 19,730Sulfate 34 0 88 67 0 0 0 670 479 0 3,100Calcium 630 1,058 294 476 7,283 10,210 20,100 4,131 2,573 282 451Magnesium 199 265 145 49.6 599 840 1690 544 344 40.7 1,330Barium 49.4 94.8 6.42 6.24 278 213 657 1.06 5.1 97.4Strontium 107 179 44.7 74.3 2,087 2,353 5,049 178 112 45.3Total Iron 4.73 25.7 8.03 14 27.4 2.89 67.6 26.4 33.8 63.4 0Aluminum 0.17 0.21 0.91 0.38 0.18 0 0.1 0.17 0.78 1.12Silica 33.8 40.7 33.2Boron 28 2 27 1 26 7 8 82 45 1 73 1 80 4 94 5 65 7 4 79 4 5Boron 28.2 27.1 26.7 8.82 45.1 73.1 80.4 94.5 65.7 4.79 4.5Potassium 192 273 78.7 85.8 977 1,559 2,273 2,232 1,439 135Sodium 10,960 16,450 5,985 3,261 26,780 39,990 61,400 54,960 32,600 7,048 11,307TDS 33,300 49,300 18,200 10,800 98,600 144,000 252,000 160,000 97,700 20,200 36,092TSS 57 246 50 30 10 12 32 120 13,762 1,004TOC 89 64 133 180 218 70 143 266 235 344
fbw fbw pw pw pw fbw
Woodford MarcellusPiceanceBakken
GOMSea water
NECPUC Symposium – 5/18/2010 34
Woodford Marcellus Sea water
34
State Regulation is better than EPA Regulation• Geology differs among/within states, not one size fits all• Water best allocated by state/local authorities• Local knowledge of specific aquifers and producing gas formations isLocal knowledge of specific aquifers and producing gas formations is
required• States can adopt rules for specific geographic areas--field rules• States can adopt, amend rules quickly to respond to changing p , q y p g g
circumstances, technology• State Inspectors live in the area and are more responsive to citizen
concerns• States can react and make decisions more quickly
– Recent purging well in Bartlesville, OK was dealt with within hours• Historically EPA has not focused on groundwater• EPA has not had adequate financing to address known groundwater
problems• EPA traditionally grants primacy for inspection/enforcement program to
states
NECPUC Symposium – 5/18/2010 35
states
35