response control in full scale irregular buildings using mr dampers
TRANSCRIPT

1
Response Control in Full ScaleIrregular Buildings Using MR Dampers
Osamu Yoshida and Shirley J. Dyke
SUMMARY
This paper considers the capabilities of semiactive control systems using magnetorheo-logical (MR) dampers when applied to numerical models of full scale asymmetric buildings.Two full scale building models exhibiting coupled lateral and torsional motions are studied.The first example considered is a 9-story building with an asymmetric structural plan. Thefootprint of this building is rectangular, and the asymmetry is due to the distribution of shearwalls. The second example considered is an L-shaped, 8-story building with additional verti-cal irregularity due to setbacks. Linear, lumped-parameter models of the buildings areemployed herein to evaluate the potential of the control system to effectively reduce thebuilding responses. In each case a device placement scheme based on genetic algorithms(GA) is used to place the control devices effectively. The proposed control system is evalu-ated by simulating the responses of the model due to the El Centro 1940 and the Kobe 1995earthquake excitations. In second case, simulations are conducted using two-dimensionalground motions. The performance of the proposed semiactive control systems are comparedto that of both ideal active control systems and passive control systems in which constantvoltages are applied to the MR dampers.
1. INTRODUCTION
To protect civil structures from significant damage, the response reduction of civilstructures during severe earthquakes has become an important topic in structural engineer-ing. One issue in seismic response control which has not been studied to a large extent is tor-sionally coupled responses in irregular structures. If a structure has an asymmetricdistribution of either mass or stiffness, a lateral seismic load can cause the torsional and lat-eral motions of the structure to be strongly coupled. This behavior may cause largerresponses than in a symmetric structure, resulting in severe localized structural damage. Asa practical example, a building which had been moderately damaged during the KocaeliEarthquake (Turkey, August 17, 1999) and had been repaired only at one corner of the struc-ture, was subjected to the Duzce Earthquake (Turkey, November 12, 1999). As a result, thestructure was severely damaged due to the torsional irregularity created by the partialstrengthening of the structure [1]. One promising approach for retrofit or new constructionsuch cases is the implementation of control systems designed to be effective for such sys-tems.
Torsional responses in buildings are often induced by wind loads even if the structure issymmetric. This effect becomes more critical when the building is taller, and initial work intorsional response control focused on this issue. The Kyobashi Seiwa building, the first full-scale application of active building control in the world, employs an active mass damper
Submitted to the ASCE Journal of StructuralEngineering, June 2003.

2
(AMD) system to reduce torsional motions [2]. Also, the Riverside Sumida building isequipped with a set of AMDs to reduce the first three translational modes of the building aswell as the first torsional mode [3]. Another example in the United States is the John Han-cock Tower in Boston, where tuned mass dampers (TMD) have been installed to reduce thetorsional responses caused by wind loads as well as translational responses (EngineeringNews Record, Oct. 1975).
One challenge in controlling the coupled lateral and torsional responses of an asymmet-ric structure is the appropriate placement of control devices. In a symmetric building, thecontroller performance is primarily dependent on the floor at which the control device isplaced, and the specific location within the floor is not a critical parameter for controldesign. That is, the building is symmetric and the centers of mass and rigidity coincide, sothe control devices should be distributed symmetrically about this point, with due consider-ation to both the load capacity at the attachment points and the intended purpose of the areawithin the floor. However, in the case of irregular buildings, not only the floor but also theplacement within the floor is fundamental to the control system performance. Thus, thenumber of the combinations of device placement is significantly larger than for symmetricbuildings. Additionally, the magnitude of the control forces required for torsional responsecontrol may be larger than those required to control lateral motions only. Furthermore, it islikely that controllers based on global responses of the structure are needed – controllersbased only on local response measurements may be inadequate for achieving high perfor-mance control systems.
A few researchers have examined methods for controlling seismic responses of suchirregular structures. Singh et al. [4] examined the use of TMDs to control torsional responsesdue to seismic excitations. In this study, four TMDs are applied to control the torsionalresponses of a multi-story building. Optimal controller gains were obtained using geneticalgorithms. Chi et al. [5] studied the performance of passive, active and semiactive controlof a base isolated, four story building with a setback on the third floor. The focus of thisstudy was to develop a smart isolation system to reduce the motion of the structure. Gavin etal. [6] have also examined a base-isolated, L-shaped, eight story building, considering theeffects of yield force, yield displacement, natural period and damping of the isolationdevices. This building is also the subject of a benchmark control problem for smart base iso-lation systems [7].
Recently, semiactive devices have been shown to possess the advantages of active con-trol devices without requiring the associated large power sources, and are inherently stable[8,9]. For these reasons, they have a promising future in structural control. If the power fails,a semi-active device may be designed to behave like a passive device. The inherently stablenature of these devices makes it possible to implement high authority control strategies,which can result in better performance than comparable active systems. One semiactivedevice that appears to be particularly promising is the magnetorheological (MR) damper. Inthe last few years, 200kN MR dampers have been constructed and tested [10–14]. In addi-tion to demonstrating the scalability of MR devices to full scale, these devices are now com-mercially available for implementation in civil engineering structures.

3
Yoshida and Dyke [15] applied semiactive control systems using MR dampers to a non-linear model of a full scale building to verify its effectiveness for reducing responses whennonlinear behavior is considered. The model used in the study is the full scale 20-storybuilding model developed for the benchmark control problem for seismically-excited non-linear buildings [16,17,18]. The responses of the building, including the maximum andnormed interstory drift ratio, maximum and normed acceleration, required control forces,are evaluated due to various earthquake excitations. The results of the proposed control sys-tem compared favorably to active and ideal semiactive systems. Also, Yoshida et al. [19–21]proposed semiactive control systems using MR dampers to control torsionally coupledresponses of irregular buildings. Experimental studies were conducted using a 2-story teststructure with an asymmetric stiffness distribution. To demonstrate the performance of thecontrol system, a shake table is used to reproduce an El Centro 1940 N-S earthquake accel-eration as well as a broadband random excitation. The responses for the proposed controlsystem are also compared to those of passive systems.
This paper addresses the performance of a semiactive control system using MR damp-ers when applied to numerical models of full scale irregular buildings. Two buildings arestudied. The first example considers a 9-story building with an asymmetric structural plandue to the distribution of shear walls. The second example is an L-shaped, 8-story buildingwith additional vertical irregularity due to setbacks. A practical device placement schemeusing genetic algorithms (GA) is adopted to place the devices effectively. The responses dueto the El Centro 1940 and the Kobe 1995 earthquake excitations are evaluated for the pro-posed semiactive control system using MR dampers. These results are compared to those ofideal active control systems and to passive control systems in which constant voltages areapplied to MR dampers. Two dimensional earthquake inputs are considered in the secondcase. The results demonstrate the efficacy of MR devices for seismic response control.
2. Equation of Motion
In general, the equation of motion for an n-story, asymmetric building is written
(1)
where . The terms and are row vectors
of the relative displacements of the center of mass of each floor in the x- and y-directions,
respectively, and is the vector of the rotations of each floor about the ver-
tical axis. The disturbance, , is a vector of the two-directional, horizontal
ground accelerations, and the coefficient matrix is
Msx·· Csx· Ksx+ + MsΓ– X·· g Λf+=
x X Y ΘT
= X x1 … xn= Y y1 … yn=
Θ θ1 … θn=
X·· g x··g y··gT
=

4
. (2)
Also, is the vector of control forces, where its coefficient matrix, , is the matrix deter-mined due to the location of control devices.
A lumped parameter model of the structure is considered. The mass matrix takes theform
, (3)
where is the diagonal matrix of the masses of each floor,
and
, (4)
where is the moment of inertia of the ith floor, and ( , ) are the coordinates ofthe center of the mass of ith floor. The coupling terms in the mass matrix are given by
, (5)
. (6)
The stiffness matrix takes the form
, (7)
where
Γ1– n 1× 0n 1×
0n 1– n 1×
0n 1× 0n 1×
=
f Λ
Ms
M 0 Mxθ
0 M Myθ
Mxθ Myθ Mθ
=
M diag m1 … mn = n n×
Mθ diag I1 m1 LCMx12 LCMy1
2+( )+ … In m+ n LCMxn2 LCMyn
2+( ) =
Ii LCMxi LCMyi
Mxθ diag m– 1LCMy1 … m– nLCMyn =
Myθ diag m1LCMx1 … mnLCMxn =
Ks
Kx 0 Kxθ
0 Ky Kyθ
Kxθ Kyθ Kθ
=
5
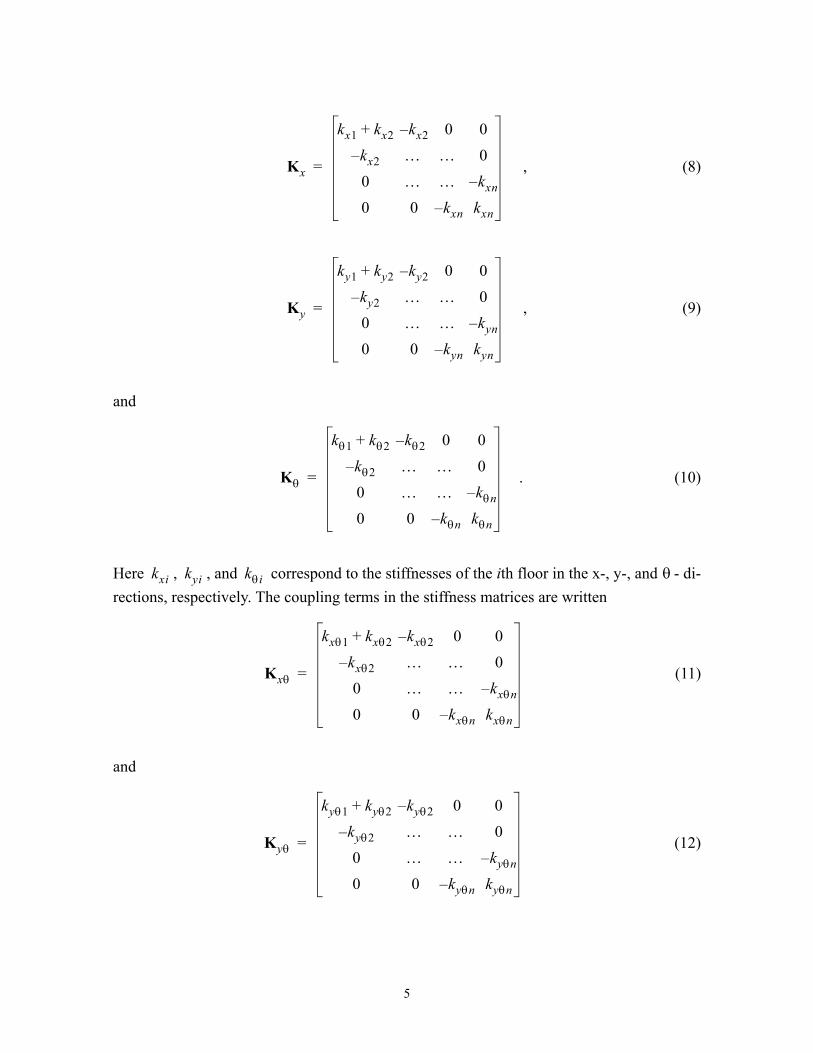
, (8)
, (9)
and
. (10)
Here , , and correspond to the stiffnesses of the ith floor in the x-, y-, and - di-rections, respectively. The coupling terms in the stiffness matrices are written
(11)
and
(12)
Kx
kx1 kx2+ kx2– 0 0kx2– … … 00 … … kxn–0 0 kxn– kxn
=
Ky
ky1 ky2+ ky2– 0 0ky2– … … 00 … … kyn–0 0 kyn– kyn
=
Kθ
kθ1 kθ2+ kθ2– 0 0kθ2– … … 00 … … kθn–0 0 kθn– kθn
=
kxi kyi kθi θ
Kxθ
kxθ1 kxθ2+ kxθ2– 0 0kxθ2– … … 00 … … kxθn–0 0 kxθn– kxθn
=
Kyθ
kyθ1 kyθ2+ kyθ2– 0 0
kyθ2– … … 00 … … kyθn–0 0 kyθn– kyθn
=

6
where , , where ( , ) are the coordinates of the center ofrigidity in the ith floor.
The equation of motion (1) can be written in state-space form as
(13)
(14)
(15)
where , , , , , , , , and define the state-space equations, is thestate vector, is the vector of regulated responses, is the vector of measured outputs,and is the measurement noise vector. For these applications, the measurements typicallyavailable for control force determination include the absolute acceleration of selected pointson the structure, the displacement of each control device, and a measurement of each controlforce.
3. SEMIACTIVE CONTROL SYSTEM USING MR DAMPERS
3.1 Model of MR damper
The semiactive control device used in this study is the MR damper. The MR dampers havedemonstrated a great deal of promise for civil engineering applications in both analyticaland experimental studies. Adequate modeling of the control devices is essential for the ade-quate prediction of the behavior of the controlled system. The simple mechanical modelshown in Fig. 1 was developed and shown to accurately predict the behavior of a prototypeshear-mode MR damper over a wide range of inputs in a set of experiments [22–25].
The equations governing the force produced by this device model are
and (16)
where is the displacement of the device, and is the evolutionary variable that accountsfor the history dependence of the response. By adjusting the parameters of the model , ,
, and , one can control the linearity in the unloading and the smoothness of the transitionfrom the preyield to the postyield region. The functional dependence of the device parame-ters on the command input is modeled as
and . (17)
kxθi kxiLyi–= kyθi kyiLxi= Lxi Lyi
z· Az Bf EX·· g+ +=
yr Crz Drf FrX··
g+ +=
ym Cmz Dmf FmX·· g vm+ + +=
A B E Cr Dr Fr Cm Dm Fm zyr ym
vm
f
f c0q· αz+= z· γ q· z z n 1–– βq· z n– Aq·+=
q zγ β
n A
u
α α u( ) αa αbu+= = c0 c0 u( ) c0a c0bu+= =

7
In addition, the current driver circuit of the MR damper introduces dynamics into thesystem. These dynamics are typically considered to be a first order time lag in the responseof the device to changes in the command input. These dynamics are accounted for with thefirst order filter on the control input given by
(18)
where is the command voltage applied to the control circuit and is the time constantof this first order filter.
The parameters of the MR damper used in this study were selected so that the devicehas a capacity of 1000 kN, as follows: = 1.0872e5 N/cm, = 4.9616e5 N/(cm V),
= 4.40 N sec/cm, = 44.0 N sec/(cm V), = 1, = 1.2, = 3 cm-1, = 3 cm-1, and= 50 sec-1. These parameters are based on the identified model of a shear-mode prototype
MR damper tested at Washington University [22,24] and scaled up to have maximum capac-ity of 1000 kN with maximum command voltage = 10 V.
Typical force-displacement and force-velocity hysteresis loops for this device model areshown in Fig. 2. Here the device response is shown for various constant voltages applied tothe control input to the MR damper, and a 1.0 Hz sinusoidal displacement with an amplitudeof 5 cm. Note that this device has a dynamic range of 50, which is aligned with the expecta-tions of MR damper manufacturers. The dynamic range is defined as the ratio of the maxi-mum force capacity to the minimum force.
3.2 Semiactive Control Algorithm
Dyke et al. [26,27] proposed a clipped-optimal control strategy based on acceleration feed-back for controlling a single MR damper. Dyke and Spencer [28] extended the control algo-rithm for multiple MR devices, and Yi et al. [22,24] experimentally verified its performance.Jansen and Dyke [23] also compared the performance of this algorithm to that of severalother approaches, and for civil engineering applications this algorithm was found to beamong the best performing of several nonlinear semiactive controllers for MR devices. Thiscontrol algorithm was selected as a control algorithm for this study and is summarized here-in.
In the clipped-optimal controller, the approach is to append n force feedback loops toinduce each MR damper to produce approximately a desired control force. Because the forcegenerated in the ith MR damper is dependent on the local responses of the structural sys-tem, the desired optimal control force cannot always be produced by the MR damper.Only the control voltage can be directly controlled to increase or decrease the force pro-duced by the device. Thus, a force feedback loop is incorporated to induce the MR damperto generate approximately the desired optimal control force. To induce the MR damper togenerate approximately the desired optimal control force, the command signal is selected asfollows. When the ith MR damper is providing the desired optimal force (i.e., ),the voltage applied to the damper should remain at the present level. If the magnitude of theforce produced by the damper is smaller than the magnitude of the desired optimal force and
u· η u v–( )–=
v 1 η⁄
αa αb ⋅c0a ⋅ c0b ⋅ n A γ βη
Vmax
fifci
vi
fi fci=

8
the two forces have the same sign, the voltage applied to the current driver is increased to themaximum level so as to increase the force produced by the damper to match the desired con-trol force. Otherwise, the commanded voltage is set to zero. The algorithm for selecting thecommand signal for the ith MR damper is represented in Fig. 3 and can be stated as
(19)
where is the maximum voltage to the current driver, and ( ) is the Heaviside stepfunction.
In this study, /LQG (Linear Quadratic Gaussian) strategies are employed as nominalcontroller to have desired control forces, because of the stochastic nature of earthquakeground motions and because of their successful application in other civil engineering struc-tural control applications [22,24,26,27,28,29]. Note that a modified version of this algorithmwas developed by Yoshida and Dyke [15] but the modified version was found to be moreappropriate for structures with lower natural frequencies, and was not selected for imple-mentation on this structure.
3.3 Design of the Nominal Controller
An /LQG control algorithm is employed for design of the nominal controllersherein. This method is designed by selecting a vector of regulated responses, , containingboth x- and y-components of two accelerations on each floor i.e.,
(20)
for , and , where and are the x- and y-components of the ac-
celeration of one side on ith floor, and and are the x- and y-components of the ac-
celerations on the other side on ith floor. The weighting matrix corresponding to theregulated output vector, , is , while the weighting matrix cor-
responding to the control force vector remains as ,
where is number of devices employed at jth location on ith floor. This approach will re-sult in equal weighting on the forces of each control device location.
4. Optimal Placement of Control Devices
As discussed in the Introduction, there are several challenges to controlling irregularstructures, including determining where to most effectively place control devices. In recentyears in the field of optimization, evolutionary techniques such as genetic algorithms (GA)have become popular for complex, discrete optimization problems that involve, and have the
vi Vmax H( fci fi–{ }fi)=
Vmax H ⋅
H2
H2yr
yr x··a11 … x··aij … x··an2 y··a11 … y··aij … y··an2T
=
i 1…n= j 1 2,= x··ai1 y··ai1
x··ai2 y··ai2
Qyr Q a diag 11 2n×[ ]( )⋅= R
f R diag nd112 … ndij
2 … ndnm2
=
ndij

9
potential for a large number of local minima. GAs function by simulating the process of nat-ural selection (“survival of the fittest”). They have shown promise in determining the opti-mal device placement in civil structures [4,30–32].
In GAs, the parameters to be optimized are coded into a genetic string known as a chro-mosome. Each of these chromosomes has an associated fitness value, which is based, in gen-eral, on an appropriate mathematical combination of the performance criteria that thedesigner is interested in. The designer specifies the population size, which is comprised ofdifferent chromosomes. In each generation, the fitness of each chromosome is determined,and a new generation is developed by combining features of chromosomes with the highestfitness values. The GA proceeds by reproducing only the fittest chromosomes in the nextgeneration. The goal is to find new chromosomes with increasing fitness, resulting inincreasing the average fitness of each successive generation. GAs use three basic operationsto produce the next generation, selection, cross-over, and mutation. Selection is the processof choosing the fittest chromosome from the current population. Cross-over is the process bywhich new chromosomes are generated from individual strings in the current generation bycutting each chromosome at a random location and replacing the tail with that of anotherchromosome. Mutation is the random process by which values of elements in a chromosomeare changed randomly.
Herein, the fitness of each chromosome is determined based on a mathematical combi-nation of the actively controlled responses of the structure for a white noise disturbance.Alternatively, a filtered white noise could easily be considered as well to account for knowl-edge of the site ground conditions if available. Specifically, in this study, the response ofinterest is selected to be the maximum of the rms absolute acceleration of the structure,determined using the Lyapunov equation, given by
, (21)
where is the jth absolute acceleration on ith floor. Also, the maximum interstory drift is observed to ensure that this response is not adversely effected while reducing the ac-
celerations. This response is given by
, . (22)
where , is the jth interstory drift on ith floor. The GA codes using in this analysis are im-plemented in MATLAB ([33]; See http://www.geatbx.com/). Note that the use of GA doesnot always guarantee a global minimum is obtained. However, in practice, there is a trade-off in the design process between performance and time. Significant amounts of additionaltime should not be spent to achieve the optimal solution if a near-optimal solution can beachieved in a short time. GAs generally provide a practical approach to achieving such anear-optimal device placement scheme.
Amax maxi j,
x··aij( )= i 1…n= j 1 2,=
x··aijDmax
Dmax maxi j,
dij( )= i 1…n= j 1 2,=
dij

10
5. Full Scale Numerical Studies
5.1 Description of the Buildings
5.1.1 Case I: 9-Story, Plan-Irregular Building
Case I of this study considers a 9-story building with plan irregularities subjected to onedimensional seismic excitation. This building is an office building designed and constructedin Japan before the new building code in Japan has been enforced. A project for retrofittingthis building to agree with the new building code has been planned and successfully com-pleted. The building is 34.4 m (113 ft) by 25.6 m (84 ft) in plan and 40.25 m (132 ft) in ele-vation. The main structural system of this building is steel reinforced concrete (SRC). Theplan of this structure is shown in Fig. 4. Dimensions are given in millimeters. On each floorthere are five bays in the x-direction and four bays in the y-direction. The important featureof this building is that the distribution of shear walls makes this structure behave asymmetri-cally, coupling the lateral and torsional motions.
A linear, lumped-parameter model of this building is developed. The columns andbeams of this building are modeled as reinforced concrete (RC), where the contribution ofthe steel members is taken into account as equivalent steel bars. Each shear wall is modeledas three RC columns, where the center column resists moments and shear forces and the twoside columns resist only the vertical loads assuming pin connections at the ends. A nonlinearanalysis of this structure was performed by Obayashi Corporation, Technical Research Insti-tute [34]. Here a bilinear hysteresis model was used for the RC members and a static push-over analysis was performed to obtain the shear force-story drift diagrams for each frame.From the results of that analysis, a linear stiffness coefficient of each frame is estimatedassuming linearity between the origin and the yielding point. The first two calculated naturalfrequencies are 0.83 Hz (translation), and 1.29 Hz (torsion). The damping is assumed to be2% for all modes of the structural model.5.1.2 Case II: L-Shaped, 8-Story Building
The full scale building considered for Case II is based on the superstructure of thebenchmark problem on base isolation systems for buildings [7]. The benchmark structure issimilar to existing buildings in Los Angeles. This building is a 8-story, steel-braced framebuilding, 270.4 ft (81.9 m) by 178 ft (53.9 m) in plan and 116 ft (35.1 m) in elevation. Thestructural details are shown in Fig. 5. Dimensions are given in feet. For control studies, thisbuilding is modeled as a linear elastic system with a rigid floor slab assumption. The firstthree calculated natural frequencies are 1.26 Hz (primarily x-direction), 1.33 Hz (primarilyy-direction), and 1.71 Hz (primarily torsion). The damping ratio is assumed to be 2% in allmodes.
5.2 Optimal Control Device Placement and Controller Design
The next step in the design of the controllers for these structures is to optimally placecontrol devices using genetic algorithms. In Case I, the acceleration responses at Frame Aand Frame E on 3FL, 6FL, and 9FL, total 6 acceleration responses, are used as feedback sig-

11
nal for the controller. Potential locations for control devices to be installed are within eachframe on each floor, for a total of 45 possible locations in the structure, as shown in Fig. 6. Amaximum of 9 control device locations are to be selected from these 45. Thus, to performthe optimization, the chromosome is defined as a vector with 9 elements. Each element isassociated with a potential control device location and has an integer value between 1 and45. The population size in each generation is selected to be 120.
Genetic algorithms are applied to find the optimal control device location for a range ofconstant weighting values, , that are found to be appropriate for this structure. The perfor-mance of each weighting case is shown in Fig. 7. The corresponding optimal placements forthe actuators are schematically shown in Fig. 8. Note that there is a trade-off between reduc-ing the maximum rms absolute acceleration and reducing the maximum rms interstory dis-placement. As the weighting increases, the acceleration continues to decrease, while thedisplacements tend to increase above a value of . From these results, a weighting of
is found to reduce both absolute acceleration and interstory drift, and is used todesign the subsequent controllers for this structure. The corresponding optimal controldevice locations are shown in Fig. 8. The damping ratios with the resulting active controldesign are increased to 13%, 9%, and 28% for the first three natural modes, respectively.
To determine the control forces required to realize this control design, earthquakeresponses are simulated. Among the earthquakes used in this study, the Kobe 1995 N-S isselected because this earthquake requires the largest forces among earthquakes considered inthe following section. Using the total control force required at each control device locationto realize the performance, the number of control devices which have a capacity of 1,000kNare determined. The results are shown in Table 2 and a total of 110 devices are used.
As in the previous example, the optimal placement of control devices is also determinedusing GAs for Case II. The study is conducted independently for the x- and y- directions. Inthe x-direction, the acceleration responses at Frame Y-163.25 and Frame Y107 on both 4FLand 8FL, for a total of 4 acceleration responses, are used as feedback for the control systems.In the y-direction, the acceleration responses at Frame X-62 and Frame X115 on 4FL, and atFrame X-62 and Frame X52.05 on 8FL, total 4 acceleration responses, are used as feedbackfor the control systems.
The potential locations for control devices to be installed are within three specificframes on each floor in each direction. These include Y-163.25, Y-44.5, and Y107 in the x-direction, and X-62, X52.05, and X115 in the y-direction, as shown in Fig. 9. Here, it isnoted that in the y-direction on the 7th and 8th floors, control devices can be installed in onlytwo frames, X-62 and X52.05, due to the setbacks. Studies are conducted to find eight opti-mal locations in each direction out of 24 and 22 possible locations in the x and y-directions,respectively. Thus, to perform the optimization (independently for the x- and y-directions),the chromosome is defined as a vector with 8 elements. Each element is associated with apotential control device location and has integer value between 1 and 24 for x-direction andbetween 1 and 22 for y-direction. The population size for each generation is selected to be40.
Genetic algorithms are applied to find the optimal control device location for each con-stant weighting . The performance of each weighting case is shown in Fig. 10. The corre-
a
a 108=a 108=
a

12
sponding optimal placements of the actuators are schematically shown in Fig. 11. As isdescribed in the previous case study, there is a trade-off between reducing the maximum rmsabsolute acceleration and reducing the maximum rms interstory displacement. As theweighting increases, the acceleration continues to decrease, while the displacements tend toincrease above a value of . From these results, the case with weighting seems to be the optimal case reducing both acceleration and interstory drift effectively.However, there is another factor to be considered, that is, the control force required to realizethe control design.
To study the control force required to realize the each control design, earthquakeresponses are calculated. In this study, Kobe 1995 N-S is used as the input in the x-directionand Kobe 1995 E-W is used as the input in the y-direction. Maximum acceleration responseand maximum interstory drift responses, normalized by those of the uncontrolled building,are shown in Fig. 12 as well as required total control force for each direction, which is nor-malized by total weight of the building kN (15,000 ton).
From these results, the required control force to realize the control design with weight-ing is twice the total weight of the building in each direction, which is well beyondacceptable force capacity for practical implementation. So, for this structure, the controldesign with weighting is chosen. The damping ratio of the first three modes withthe resulting active control design are increased to 18%, 10%, and 19%.
The optimal control device location for weighting and the required number ofdevices assuming that actuators with maximum capacity of 1,000 kN are used is shown inTable 3 for each direction. As shown in this table, 146 1,000 kN control devices are used inthe x-direction, and 168 devices are used in the y-direction.
5.3 Response Due to Earthquake Excitation
Next, the performance of the proposed semiactive control system applied to the fullscale building models is evaluated by calculating the responses due to earthquake excita-tions. Because application of the semiactive control system results in a nonlinear system, theamplitude of the earthquakes are varied for evaluation of the control systems. The El Centroearthquake (1940) and the Kobe earthquake (1995) are used. The El Centro earthquake isscaled in magnitude by factors of 0.5, 1.0 and 1.5, and are denoted El Centro 0.5, El Centro1.0, and El Centro 1.5, respectively. The Kobe earthquake is scaled in magnitude by factorsof 0.5 and 1.0, and are denoted Kobe 0.5 and Kobe 1.0, respectively. A total of five earth-quake records are employed. In Case I, North-South component is used for both El Centroand Kobe earthquake. In Case II, both North-South and East-West components are used asearthquake excitations for the x- and y-directions of the corresponding building, respec-tively.
Three separate control systems are studied: passive-on, clipped-optimal control, andideal active control. The passive-on controllers correspond to the situations in which a con-stant maximum voltage is applied to the MR dampers. The clipped-optimal controllers cor-respond to the semiactive control systems using MR dampers, which is denoted MR-OCO.The ideal active controller employs an active control system which can apply ideal control
a 109= a 109=
147 103×
a 109=
a 108=
a 108=

13
forces to the building. Note that the nominal /LQG controller for the semiactive controlsystems and the ideal active control system are identical.
To evaluate the control performance quantitatively, five nondimensional evaluation cri-teria are defined in Table 1. Note that the first four evaluation criteria are normalized by thecorresponding maximum uncontrolled responses of the structure, and the fifth evaluationcriteria corresponding to the maximum control force is normalized by the total weight of thebuilding.
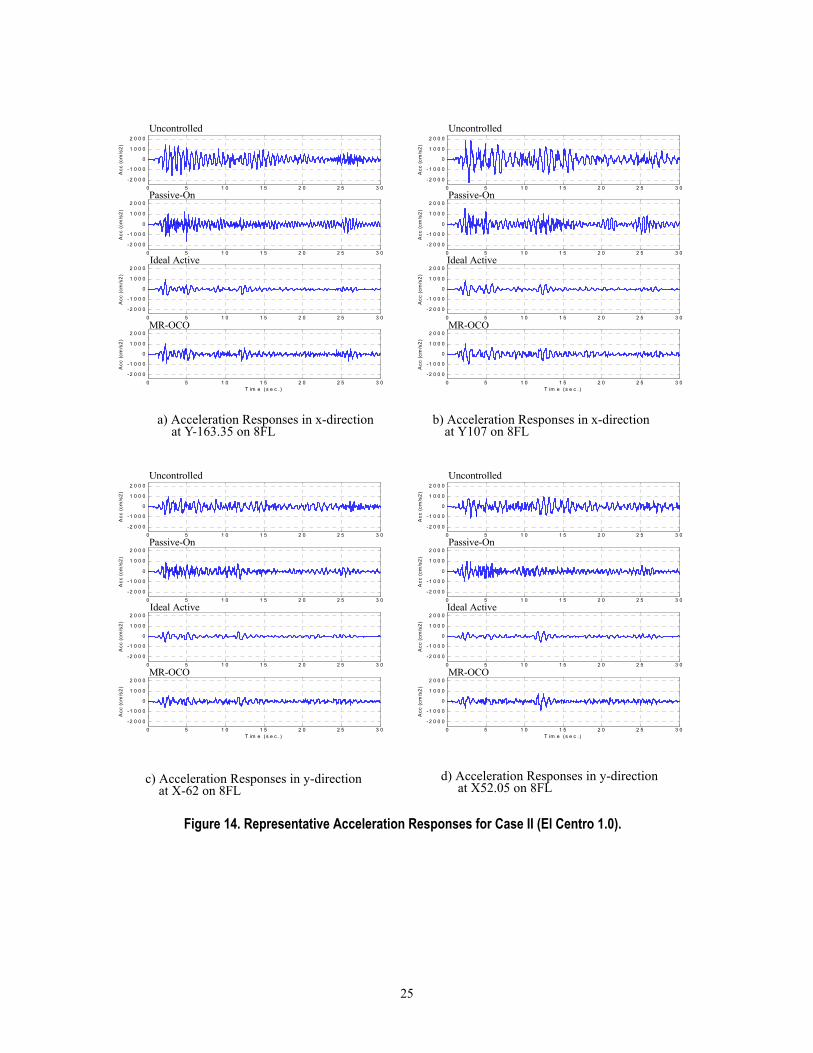
Representative time history responses due to the El Centro 1.0 excitation are shown inFigs. 13 and 14. Fig. 13 shows the absolute acceleration responses of the weak side (atFrame A) and the strong side (at Frame E) on 9FL for Case I, and Fig. 14 shows the acceler-ation responses at Frame Y-163.35 and at Frame Y107 on 8FL in the x-direction, and theacceleration responses at Frame X-62 and at Frame Y52.05 on 8FL in the y-direction. Theresults for the uncontrolled system, passive-on controller, ideal active controller, and semi-active clipped-optimal controller (with MR dampers) are shown.
In Case I, the passive-on system can only reduce the acceleration of the weak side(Frame A) on 9FL, while the acceleration of the strong side (Frame E) is not effectivelyreduced. However, with the ideal active and semiactive control systems, the acceleration ofboth sides on 9FL is effectively reduced. The results of the semiactive controller are as goodas those of the ideal active controller.
In Case II, when applying the passive-on controller, modest reduction is found for theacceleration responses in the x-direction. However, the acceleration responses on both sidesof 8FL in both the x- and y-directions are reduced effectively by the semiactive control sys-tem, and the performance is found to be as good as that of the ideal active control system.
Numerical values corresponding to the five evaluation criteria defined for this problemare graphically shown in Fig. 15. First we compare the semiactive clipped-optimal controllerand the ideal active controller. In general, the clipped-optimal control system achieves a per-formance similar to that of the ideal active controller. In Case I, the clipped-optimal control-ler reduces both the maximum interstory drift and the maximum acceleration by 40–45% forthe El Centro earthquakes, and by 35–40% for the Kobe earthquakes. In Case II, the clipped-optimal controller reduces the maximum acceleration responses by 40–52% for the El Cen-tro earthquake and by 49–51% for the Kobe earthquakes, and the maximum interstory driftis reduced by 45–48% for the El Centro earthquakes and by 46–47% for the Kobe earth-quakes. In most cases, the ideal active controller achieves a modest improvement over theclipped-optimal controller. However, in some cases, in reducing the normed interstory drift,the clipped-optimal performs slightly better than the ideal active control system, although ituses very little power.
In comparing the performance of the clipped-optimal controller and the passive-on con-troller, it is clearly shown that the clipped-optimal controller is significantly better than thepassive-on system in reducing the acceleration responses of both maximum and normed val-ues. This observation is more pronounced for the acceleration responses due to smallerearthquakes. Note that the acceleration responses of both maximum and normed values inCase I and normed values in Case II using the passive-on controller for the El Centro 0.5 is
H2

14
increased compared to those of the uncontrolled building, while the clipped-optimal canreduce this response effectively. It is also noted that, in most cases, the maximum andnormed interstory drift responses with the clipped-optimal controller are better than those ofthe passive-on controller (except the maximum value for the El Centro 1.5 and the maxi-mum and normed values for the Kobe 1.0 in Case I and the maximum value for the El Cen-tro 0.5 and the maximum and normed values for all levels of the Kobe in Case II). Also notethat the passive-on controller applies larger control forces than the clipped-optimal control-ler, while achieving a much lower performance level. So, it is concluded that the passivecontrol forces are not always effectively used to reduce the building responses.
6. CONCLUSION
In this paper, the semiactive control system proposed for coupled torsional-lateralresponse control was applied to numerical models of two full scale buildings, and the perfor-mance when subjected to earthquake excitations was evaluated. Two numerical examplesconsidering full-scale building models were employed. GAs were applied to determine theoptimal placement of the control devices for each structure. A bi-directional earthquakeinput was considered in the second case. Several evaluation criteria were selected to assessthe performance of the proposed passive, active and semiactive designs.
The results of these studies indicated that, in general, the semiactive clipped-optimalcontroller using MR damper achieves similar performance to an ideal active control systemin reducing the evaluated responses due to earthquakes. With a few exceptions, the idealactive controller performed slightly better than the clipped-optimal controller, although theclipped-optimal controller achieved higher reductions in interstory drift responses in somecases. When comparing the semiactive clipped-optimal controller using MR dampers andthe passive-on controllers, the clipped-optimal controller offered significant performancegains in reducing acceleration responses. In reducing interstory drift responses, in somecases, the clipped-optimal performed slightly better, and the other cases, the passive-on con-trol performed slightly better.
ACKNOWLEDGMENTS
This research is partially supported by National Science Foundation Grant No. CMS 97-33272 (Dr. Chi Liu, Program Director). This support is gratefully acknowledged. Additionalsupport for the lead author from Obayashi Corporation is also acknowledged. The authorsalso appreciate the input of Dr. Satish Nagarajaiah in providing detailed information on theL-shaped structure.
REFERENCES
1. Tezcan S.S. and Alhan, C. Parametric Analysis of Irregular Structures under SeismicLoading According to the New Turkish Earthquake Code. Engineering Structures,2001; 23(6):600-609.

15
2. Sakamoto, M., Kobori, T., Yamada, T. and Takahashi, M. Practical Application of Activeand Hybrid Response Control Systems and Their Verification by Earthquake and StrongWind Observations. Proc. of First World Conference on Structural Control, Los Angels,CA, August 3-5 1994; WP2:90-99.
3. Suzuki, T., Kageyama, M., Nobata, A., Inaba, S. and Yoshida, O. “Active Vibration Con-trol System Installed in a High-rise Building.” Proc. of First World Conference onStructural Control, Los Angels, CA, August 3-5 1994; FP3:3-11.
4. Singh, M.P., Singh, S. and Moreschi, L.M. Tuned Mass Dampers for Response Control ofTorsional Buildings. Earthquake Engineering and Structural Dynamics, 2002; 31:749-769.
5. Chi, Y., Sain, M.K., Pham, K.D. and Spencer, Jr. B.F. Structural Control Paradigms for anAsymmetric Buildings. Proc. of 8th ASCE Special Conference on ProbabilisticMechanics and Structural Reliability, PMC2000-152.
6. Gavin, H. and Alhan, C. Control of Torsionally Asymmetric Structures. Proc. of theAmerican Control Conference, Anchorage, AK, May 8-10 2002.
7. Narasimhan, S., Nagarajaiah, S., Gavin, H., and Johnson, E.A. Benchmark Problem forControl of Base Isolated Buildings. Proc. of 15th ASCE Engineering Mechanics Con-ference, New York, NY, June 2-5 2002.
8. Fujino, Y., Soong, T.T. and Spencer, Jr. B.F. Structural Control: Basic Concepts andApplications. Proc. of the ASCE Struct. Cong., Chicago, Illinois, 1996; 361-370.
9. Spencer, Jr. B.F. Recent Trends in Vibration Control in the U.S. Proc. of the 3rd Int. Conf.on Motion and Vibration Control, Chiba, Japan, 1996; 2:K1-K6.
10. Carlson, J.D., and Spencer Jr., B.F. (1996). “Magneto-Rheological Fluid Dampers: Scal-ability and Design Issues for Application to Dynamic Hazard Mitigation.” Proc. 2nd Int.Wkshp. on Struc. Control, Hong Kong, pp. 99-109, Dec.
11. Spencer, Jr. B.F., Carlson, J.D., Sain M.K. and Yang, G. On the Current Status of Mag-netorheological Dampers: Seismic Protection of Full-Scale Structures. Proc. of theAmer. Control Conf., 1997; 458-62.
12. Fujitani, H., Soda, S., Iwata, N., Sodeyama, H., Hata, K., Sunakoda, K. and Komatsu, Y.“Dynamic Performance Evaluation of Magneto-rheological Damper by Experimentaland Analytical Methods.” Proc. of the US-Japan Workshop on Smart Structures forImproved Seismic Performance in Urban Regions, Seattle, Washington, August 142001; 237-248.
13. Sodeyama, H., Sunakoda, K., Suzuki, K., Carlson, J.D. and Spencer, Jr. B.F. “Develop-ment of Large Capacity Semi-active Vibration Control Device using Magnetorheologi-cal Fluid.” Seismic Engineering, ASME, PVP, 2001; 428-2:109-114.
14. Sodeyama, H., Sunakoda, K., Suzuki, K., Carlson, J.D. and Spencer, Jr. B.F. “A BasicStudy on Dynamic Characteristics of MR Dampers.” Seismic Engineering, ASME, PVP,2001; 428-2:115-120.
15. Yoshida, O. and Dyke, S.J. “Seismic Control of a Nonlinear Benchmark Building Using

16
Smart Dampers.” Journal of Engineering Mechanics ASCE 2003 (in press). 16. Ohtori, Y., Christenson, R.E., Spencer, Jr. B.F. and Dyke, S.J. “Summary of Benchmark
Control Problems for Seismically Excited Nonlinear Buildings.” Proc. of the 2000Engineering Mechanics Conf., ASCE, Austin, Texas, May 21-24 2000.
17. Ohtori, Y., Christenson, R.E., Spencer, Jr. B.F. and Dyke, S.J. “Benchmark ControlProblems for Seismically Excited Nonlinear Buildings.” Journal of EngineeringMechanics: Special Issue on Structural Control Benchmark Problems, ASCE, 2003 (inpress).
18. Yoshida, O. Torsionally Coupled Response Control of Earthquake Excited AsymmetricBuildings: Development and Application of Effective Control Systems Using SmartDampers, Doctoral Dissertation, Washington University in St. Louis, St. Louis, Mis-souri, May 2003.
19. Yoshida, O., Dyke, S.J., Giacosa, L.M. and Truman, K.Z. “Torsional Response Controlof Asymmetric Buildings Using Smart Dampers.” Proc. of 15th ASCE EngineeringMechanics Conference, New York, NY, June 2-5 2002.
20. Yoshida, O., Dyke, S.J., Giacosa, L.M. and Truman, K.Z. “An Experimental Study onSeismic Response Control of Asymmetric Buildings Using MR Dampers.” Proc. of The11th Japan Earthquake Engineering Symposium, Tokyo, Japan, November 20-22 2002.
21. Yoshida, O., Dyke, S.J., Giacosa, L.M. and Truman, K.Z. (2002). “Experimental Verifi-cation on Torsional Response Control of Asymmetric Buildings Using MR Dampers.”Earthquake Engineering and Structural Dynamics, 2003 (in press).
22. Yi, F., Dyke, S.J., Caicedo, J.M. and Carlson, J.D. “Experimental Verification of Multi-Input Seismic Control Strategies for Smart Dampers.” Journal of Engineering Mechan-ics ASCE 2001; 127(11):1152–1164.
23. Jansen, L.M. and Dyke, S.J. “Semiactive Control Strategies for MR Dampers: Compar-ative Study.” Journal of Engineering Mechanics ASCE 2000; 126(8):795-803.
24. Yi, F., Dyke, S.J., Caicedo, J.M. and Carlson, J.D. “Seismic Response Control UsingSmart Dampers.” Proc. of 1999 American Control Conference, San Diego, CA, June23–25 1999; 1022–26.
25. Dyke, S.J., Yi, F. and Carlson, J.D. “Application of Magnetorheological Dampers toSeismically Excited Structures.” Proc. of the International. Modal Analysis Conference,Kissimmee, FL, Feb. 8–11 1999.
26. Dyke, S.J., Spencer, Jr. B.F., Sain, M.K. and Carlson, J.D. “Modeling and Control ofMagnetorheological Dampers for Seismic Response Reduction.” Smart Materials andStructures 1996; 5:565–575.
27. Dyke, S.J., Spencer, Jr. B.F., Sain, M.K. and Carlson, J.D. “Seismic Response Reduc-tion Using Magnetorheological Dampers.” Proc. of IFAC World Congress, San Fran-cisco, CA, Jun. 30–Jul. 5 1996.
28. Dyke, S.J. and Spencer, Jr. B.F. “Seismic Response Control Using Multiple MR Damp-ers.” Proc. of the 2nd Intl. Workshop on Structural Control, Hong Kong, 1996; 163–

17
173. 29. Dyke, S.J., Spencer, Jr. B.F., Sain, M.K. and Carlson, J.D. “An Experimental Study of
MR Dampers for Seismic Protection.” Smart Materials and Structures, 1998; 7:693–703.
30. Singh, M.P. and Moreschi, L.M. “Optimal placement of dampers for passive responsecontrol.” Earthquake Engineering and Structural Dynamics, 2002; 31:955-976.
31. Abdullah, M., Richardson, A., Hanif, J. “Placement of Sensors/Actuators on CivilStructures Using Genetic Algorithms.” Earthquake Engineering and Structural Dynam-ics, 2001; 30:1167-1184.
32. Li, Q.S., Liu, D.K., Zhang, N., Tam, C.M., Yang, L.F. “Multi-level design model andgenetic algorithm for structural control system optimization.” Earthquake Engineeringand Structural Dynamics, 2001; 30:927-42.
33. Pohlheim, H. “Evolutionary Algorithms: Overview, Methods and Operators.” Docu-mentation for: Genetic Evolutionary Algorithm Toolbox for Use with Matlab version:toolbox 1.92 documentation 1.92, 1999 (http://www.geatbx.com/).
34. Obayashi Corporation Technical Research Institute, Internal Report, 2002; 63024-6. (inJapanese, not publically available).

18
c0
Bouc-Wenq
f
Figure 1. Mechanical Model of the MR Damper.
Figure 2. Typical Responses of Employed MR Damper.
(a) Force-Displacement Hysteresis Loop (b) Force-Velocity Hysteresis Loop
-6 -4 -2 0 2 4 6-1.5
-1
-0.5
0
0.5
1
1.5x 10⁶
For
ce (N
)
Displacement (cm)
0.0volt1.0volt5.0volt10.0volt
-40 -30 -20 -10 0 10 20 30 40-1.5
-1
-0.5
0
0.5
1
1.5x 10⁶
For
ce (N
)
Velocity (cm/sec)
0.0volt1.0volt5.0volt10.0volt

19
vi V max=
fci
fi
vi 0=
vi 0=
vi 0=
vi 0=
Figure 3. Graphical Representation of Clipped-Optimal Control Algorithm.
vi V max=
Figure 4. Plan of 9-Story Asymmetric Building.
E
D
C
B
1 6 2 3 4 5
7,600 7,600 6,400 6,400 6,400 7,
000
6,00
0 6,
600
6,00
0
A
34,400
25,6
00 X
Y
CM17,050
13,2
00

20
-50
050
100 -150
-100
-50
0
50
100
0
20
40
60
80
100
Figure 5. Structural Diagram of the 8-story L-shaped Building.
z
x
y
EDCBA
1 2 1 2 ………….. 5.. 5
41 42 41 42 ………….. 45.. 45…
……
……
……
……
…..
yy
zz
EDCBA
1 2 1 2 ………….. 5.. 5
41 42 41 42 ………….. 45.. 45…
……
……
……
……
…..
yy
zz
EDCBA
1 2 1 2 ………….. 5.. 5
41 42 41 42 ………….. 45.. 45…
……
……
……
……
…..
EDCBA EEDDCCBBAA
1 2 1 2 ………….. 5.. 5
41 42 41 42 ………….. 45.. 45…
……
……
……
……
…..
yy
zz
Figure 6. Potential Locations for Control Devices (Case I).

21
107 108 109 10100
0.2
0.4
0.6
0.8
1
Weighting on Acc. a
Per
form
ance
Am
ax, D
max
AmaxDmax
Figure 7. Performance of the GA Results (Case I).
Figure 8. Optimal Device Locations (Case I).
E D C B A
a=107 E D C B A
a=108
E D C B A
a=109 E D C B A
a=1010 Device Location

22
-50 0 50 100
-150
-100
-50
0
50
100Y107
Y-44.5
Y-163.35
X-62 X52.05
X116
Figure 9. Potential Control Device Locations (Case II).
Figure 10. Results of Optimal GA Control Designs (Case II).
107 108 109 10100
0.2
0.4
0.6
0.8
1
Weighting on Acc. a
Per
form
ance
Am
ax, D
max
X-direction
AmaxDmax
107 108 109 10100
0.2
0.4
0.6
0.8
1
Weighting on Acc. a
Per
form
ance
Am
ax, D
max
Y-direction
AmaxDmax

23
-100 -50 0 50 100 150
0
50
100
-100 -50 0 50 100 150
0
50
100
-100 -50 0 50 100 150
0
50
100
a=108
X-62 X52.05 X116-100 -50 0 50 100 150
0
50
100
a=107
-150 -100 -50 0 50 100
0
50
100
a=107
Y-163.35 Y-44.5 Y107
-150 -100 -50 0 50 100
0
50
100
a=108
Y-163.35 Y-44.5 Y107
-150 -100 -50 0 50 100
0
50
100
-150 -100 -50 0 50 100
0
50
100
a=109
Y-163.35 Y-44.5 Y107
a=1010
Y-163.35 Y-44.5 Y107
X-Direction
X-62 X52.05 X116
a=109
X-62 X52.05 X116
a=1010
X-62 X52.05 X116
Y-Direction
Figure 11. Resulting Device Locations (Case II).
Device Location

24
Table 1. Evaluation Criteria.
Maximum Interstory Drift
Figure 12. Responses Due to the Kobe 1.0 Earthquake (Case II).
107 108 109 10100
0.5
1
1.5
2
2.5
3
3.5
4
Weighting on Acc. a
Nor
mal
ized
Res
pons
e
Kobe 1.0
AmaxDmaxFmax-XdirFmax-Ydir
Figure 13. Representative Acceleration Responses for Case I (El Centro 1.0).
a) Acceleration Responses at Frame A on 9FL b) Acceleration Responses at Frame E on 9FL
0 5 1 0 1 5 2 0 2 5 3 0-1 0 0 0
- 5 0 0
0
5 0 0
1 0 0 0
Acc
(cm
/s2)
0 5 1 0 1 5 2 0 2 5 3 0-1 0 0 0
- 5 0 0
0
5 0 0
1 0 0 0
Acc
(cm
/s2)
0 5 1 0 1 5 2 0 2 5 3 0-1 0 0 0
- 5 0 0
0
5 0 0
1 0 0 0
Acc
(cm
/s2)
0 5 1 0 1 5 2 0 2 5 3 0-1 0 0 0
- 5 0 0
0
5 0 0
1 0 0 0
Acc
(cm
/s2)
T im e (s e c . )
0 5 1 0 1 5 2 0 2 5 3 0-1 0 0 0
- 5 0 0
0
5 0 0
1 0 0 0
Acc
(cm
/s2)
0 5 1 0 1 5 2 0 2 5 3 0-1 0 0 0
- 5 0 0
0
5 0 0
1 0 0 0
Acc
(cm
/s2)
0 5 1 0 1 5 2 0 2 5 3 0-1 0 0 0
- 5 0 0
0
5 0 0
1 0 0 0
Acc
(cm
/s2)
0 5 1 0 1 5 2 0 2 5 3 0-1 0 0 0
- 5 0 0
0
5 0 0
1 0 0 0
Acc
(cm
/s2)
T im e (s e c . )
Uncontrolled Uncontrolled
Passive-On Passive-On
Ideal Active Ideal Active
MR-OCO MR-OCO
25
0 5 1 0 1 5 2 0 2 5 3 0-2 0 0 0
-1 0 0 0
0
1 0 0 0
2 0 0 0
Acc
(cm
/s2)
0 5 1 0 1 5 2 0 2 5 3 0-2 0 0 0
-1 0 0 0
0
1 0 0 0
2 0 0 0
Acc
(cm
/s2)
0 5 1 0 1 5 2 0 2 5 3 0-2 0 0 0
-1 0 0 0
0
1 0 0 0
2 0 0 0
Acc
(cm
/s2)
0 5 1 0 1 5 2 0 2 5 3 0-2 0 0 0
-1 0 0 0
0
1 0 0 0
2 0 0 0
Acc
(cm
/s2)
T im e (s e c . )
0 5 1 0 1 5 2 0 2 5 3 0-2 0 0 0
-1 0 0 0
0
1 0 0 0
2 0 0 0
Acc
(cm
/s2)
0 5 1 0 1 5 2 0 2 5 3 0-2 0 0 0
-1 0 0 0
0
1 0 0 0
2 0 0 0
Acc
(cm
/s2)
0 5 1 0 1 5 2 0 2 5 3 0-2 0 0 0
-1 0 0 0
0
1 0 0 0
2 0 0 0
Acc
(cm
/s2)
0 5 1 0 1 5 2 0 2 5 3 0-2 0 0 0
-1 0 0 0
0
1 0 0 0
2 0 0 0
Acc
(cm
/s2)
T im e (s e c . )
Figure 14. Representative Acceleration Responses for Case II (El Centro 1.0).
a) Acceleration Responses in x-direction b) Acceleration Responses in x-direction
Uncontrolled Uncontrolled
Passive-On Passive-On
Ideal Active Ideal Active
MR-OCO MR-OCO
at Y-163.35 on 8FL at Y107 on 8FL
0 5 1 0 1 5 2 0 2 5 3 0-2 0 0 0
-1 0 0 0
0
1 0 0 0
2 0 0 0
Acc
(cm
/s2)
0 5 1 0 1 5 2 0 2 5 3 0-2 0 0 0
-1 0 0 0
0
1 0 0 0
2 0 0 0
Acc
(cm
/s2)
0 5 1 0 1 5 2 0 2 5 3 0-2 0 0 0
-1 0 0 0
0
1 0 0 0
2 0 0 0
Acc
(cm
/s2)
0 5 1 0 1 5 2 0 2 5 3 0-2 0 0 0
-1 0 0 0
0
1 0 0 0
2 0 0 0
Acc
(cm
/s2)
T im e (s e c . )
Uncontrolled
Passive-On
Ideal Active
MR-OCO
0 5 1 0 1 5 2 0 2 5 3 0-2 0 0 0
-1 0 0 0
0
1 0 0 0
2 0 0 0
Acc
(cm
/s2)
0 5 1 0 1 5 2 0 2 5 3 0-2 0 0 0
-1 0 0 0
0
1 0 0 0
2 0 0 0
Acc
(cm
/s2)
0 5 1 0 1 5 2 0 2 5 3 0-2 0 0 0
-1 0 0 0
0
1 0 0 0
2 0 0 0
Acc
(cm
/s2)
0 5 1 0 1 5 2 0 2 5 3 0-2 0 0 0
-1 0 0 0
0
1 0 0 0
2 0 0 0
Acc
(cm
/s2)
T im e (s e c . )
Uncontrolled
Passive-On
Ideal Active
MR-OCO
c) Acceleration Responses in y-direction d) Acceleration Responses in y-direction at X-62 on 8FL at X52.05 on 8FL

26
0 0.5 1
ElCentro0.5
ElCentro1.0
ElCentro1.5
Kobe0.5
Kobe1.0
J10 0.5 1
J20 0.5 1
J30 0.5 1
J40 0.01 0.02
J5
Passive-OnActiveMR-OCO
Figure 15. Evaluation Criteria.
a) Case I
0 0.5 1
ElCentro0.5
ElCentro1.0
ElCentro1.5
Kobe0.5
Kobe1.0
J10 0.5 1
J20 0.5 1
J30 0.5 1
J40 0.005 0.01
J5
Passive-OnActiveMR-OCO
b) Case II

27
Maximum Acceleration
Normed Interstory Drift
Normed Acceleration
Maximum Control Force
Table 2. Location and Number of Control Devices for Case I.
Floor 2 3 4 4 5 5 6 6 7
Frame A A A E A B A E A
No. 11 11 11 13 12 11 13 14 14
Table 3. Location and Number of Control Devices for Case II.
Floor 1 3 4 5 5 6 6 7
x-directionFrame Y-163.35 Y-44.5 Y-44.5 Y-44.5 Y107 Y-163.35 Y107 Y-44.5
No. 22 18 17 18 21 16 21 13
y-directionFrame X116 X52.05 X-62 X52.05 X-62 X52.05 X-62 X52.05
No. 20 17 28 23 25 22 18 15
Table 1. Evaluation Criteria.
J1maxt i j, ,
dij t( )
d max-----------------------------------=
J2maxt i j, ,
x··aij t( )
x··amax
-------------------------------------=
J3maxt i j, ,
dij t( )
d max-------------------------------------=
J4maxt i j, ,
x··aij t( )
x··amax
---------------------------------------=
J5max
t i,fi t( )
W-----------------------------=