response of a sodium-iodide scintillation spectrometer to
TRANSCRIPT

Journal of Research of the National Bureau of Standards Vol. 56, No.6, June 1956 Research Paper 2682
Response of a Sodium-Iodide Scintillation Spectrometer to 10- to 20-Million-Electron-Volt Electrons and X-Rays 1
H. W . Koch and 1. M. Wyckoff
The response of a la rge-crystal sodium-iodide spectrometer was studied fo[' individual monoenergetic electrons extracted from a 50-million-electron-volt betatron operatcd between 1 a nd 20 Mev. The energy resolut ion with crystals 5 inches in diameter by 4 inches in length a nd 5 inches in diameter by 9 inches in length reaches its optimum value fo r electrons of 6 Mev where t he total width of t he pulse-height distribut ion at half max imum is 4 percent. Synthese~ of pulse- height distribu t ions for 11- a nd 19-Mev monoenergetic X-ray photons a re made by using the experimental electron pulse-height distributions. The computed result compare favorably with the measured pulse-height distri butio ns for 11 .6- and 17.6-Mev gamma ra.vs. Syntheses provide one of the few procedures for predicting spectrometer respo nse function s in t his X-ray energy range.
1. Introduction The pulse-height distributions produced in total
absorption spectrometers by mono energetic X-rays show a nal'l'OW peak with small tail at low pulse heights [1].2 These spectrometers are. therefoTe suitable for the accmate study of contmuous dIStributions of X-rays and for analyses of the shape of the continuum. However, an analysis of the spectrometer output in terms of the number of X-ray photons at each photon energy requires detailed information n.bout the response function of the spectrometer to monoenergetic X-rays or gamma rays in the energy range of interest.
For energies below 3 NIev, gamma rays from long-lived radioactive sources arc available at sufficiently small energy in tervals to permit t he accurate evaluation of the spectrometer response.
At energies above 3 Mev, the avail able nuelear gamma rays are few, weak in intensity, and generally unsuitable for the determination of response functions. For example, the relatively monoenerget ic Li7(p.'y)Be8 gamma rays are a 17.6-Mev gamma ;ay accompanied by a broad line at 14.8 .Mev. 'I he lower energy line is sufficiently broad as to obscure somewhat the interpre ta tion of the shape of the 17.G-Me pulse-heigh t clistribution. Similarly, the Bll (p,,),)C12 and the Be9 (a,n,),)CI2 reactiOJ:s provide 11.6- and 4.43-Mev gamma rays, respectIvely, that are weak in intensity, and experiments with t hem are conseq uently t roubled by large relative bacl\:grounds.
The response function can also be obtained by a Monte Carlo calculation [2]. However, these calculations are tedious and very time-consuming even when performed with the aid of au tomatic computers . The difficulty arises from the multiple interactions that must be followed in some detail at energies above 3 Mev.
In order to provide some detailed data on t he response of a large-crystal spectrometer for 10- to 20-.Mev monoenergetic X-rays, the response to monoenergetic electrons was examined [3] as described in this report, and then the pulse-heigh t distributions for
1 This rescarch was supported by the United States Air Force, through the Office of Scicntific Research of the Air Research and Development Command .
2 Figures iu brackets indicate the literature references at the end of this paper.
t wo X-ray energies were synthesized from these data. Specific X-ray energy values of 11 and 19 Mev were chosen for the syntbesis on the basis of a planned matrL~ covering the 10- to 20-Mev region. These value are also reasonably near experImentally measured monoenergetic gainma-ra~T peaks of 11.6 and 17.6 Mev, and so the calculations lend themselves to a comparison with the experimental resul t .
The sodium-iodide crystals in the scintillation spectrometer used in tbe electron part of the experiment were 5-in. diameter by 4 in. long, 5 in. diameLer by 5 in. long, and 5 in. diameter by 9 in. long. Pulse-height distribu tions were obtained for electron with energies between 1 and 20 Mev. The result gave the shapes of the distributions, the variation of t he r elative resolution (full-width at half maximum divided by the pulse heigh t at the maximum) ' y-ith electron energy; and the linearity of the pulse hmght of the peak of the pulse-height distribution versu electron energy.
The pulse-height distributions for monoenergetic X-rays were synthesized for a 5-in.-diameter by 9-in.long-crystal spectrometer from the electron results. This work, which is also described in this report, was motivated by the fact that good predictions of pulseheight distributions produced by X-rays are di1f~cult to obtain . By using t he experimentally determm.ed pulse-height distribu t ion for electrons with energw above 6 Mev, one removes the necessity for following the electron through its detailed interactions, a would ordinarily have to be done in a complete calculation.
2. Response of the Spectrometer to Electrons
The electron beam was removed from a 50-Mev betatron by a pulsed electromagnetic extractor [4]. Individual electrons with fixed energies in the range 1 to 20 :Mev were directed against the center of the flat surface of the sodium-iodide crystal, as shown in figure 1.
Electrons were available from the extractor during a time interval of approximately 0.2 /-L sec every 5 500 /-Lsec. The electrons from the betatron should b~ monoenergetic to at lea t 0.1 percent over period
319

5
8 FIGUR E 1. Experimental arrangement.
The electrons from the betatron accelerati ng tube (1) are extracted by an electron beam extractor (2) into a vacuum tube. Tbe electrons proceed through foils at (3), a low pressure ionization cbamber at (4), and a focusing magnet at (5) into the crystal at (6). 'l'he photomultiplier (7) and crystal are located within a 4-in.-thick lead shield (8) .
I
'J / '~
700
600
500
400
1.7 Mev
500
200
S 100
0 > 0::
'" Q. ., !z 1200 :::> 0 lJ
1000
800
600 8 .0 Mev
4 00
200
0 0 10 20 50
'i'
J
ELECTRONS
ELECTRONS 4.2%
40 50
FIGURE 2. The electron beam at the exit of the vacuum tube. Tbe intensity curves shown were taken from a fi lm with a densitometer. The
electron beam current for this picture was of the order of 10- 10 amperes.
1200
1000
800
800
400
200
1000
800
600
400
200
FIGUR E 3. Pulse-height distributions produced by electrons from a betatron in a 5-in.-diameter by 5-in.-long sodiumiodide spectrometer.
The electron energies given on each cur ve were determined from an energy comparison of tbe peak pulse heights with those obtained witb 1.12- or 4.43-Mev gamma rays.
13. 5 Mev ELECTRONS
50 40
15.0 M tv ELECTRONS
9.2%
0~0--L-~'O~~=2~0~~=5O~=C~40~:L~~~-J.~~.b~L-~~~~ PULSE HEIGHT, v
320

of time of the order of minutes [5] . Energy straggling of the electrons produces the largest uncertainty in the energy in the present experim ent because of the three O.00l4-in. aluminum vacuum windows and the aluminum-magnesium-oxide entrdnce window of the crystal container . The most probable energy loss is 300 kev [5], and the energy uncertainty is less than 100 kev.
Adjustments on a beam of 109 electrons/sec were made to direct the elec trons down the collimator hole and to set the focusing magnet current without the spectrometer . The electron-b eam intensity was t.hen adjusted so that the counting rate with the spectrometer was limited to fiv e electrons detected per second. Since 180 bursts of electrons come from the betatron in 1 sec, the coincidence detection of electrons during anyone betatron burst was limited to about 3 percent of all electrons detected . A picture of the electron-beam size at the crystal position is shown in figure 2.
The individual light pulses in the sodium-iodide crystals were detected by the photomultiplier-amplifier arrangements previously described [1] . The output pulses from the linear amplifier were sent into a gain-oI-two amplifier and into a 30-ch annel differential analyzer. Two separate runs at each electron energy were made in order to check , first, the over-all sr ape of the pulse-height distribution, and, second, the detailed shape of the peak. The two runs were separated and followed by calibration runs with a mercury-relay precision sliding pulseI' and a radioactive gamma-ray source. The 4.43-Mev gamma rays from a RaD (a,B e) source or the 1.12-:\llev gamma rays from Zn65 were used as calibration sources.
The betatron energy control de eloped by Saunders [6] in conjunction with the beam extractor arrangement was used to produce electron 'with energies of 1.22, 1.96, 4.04, 5.12 , 6.18, .30, 12 .2, 13.8, 15 .3, 17.15, and 17.9 Mev, respectively. The energy of the electrons entering the crystal was assumed to be 300 kev less than these values.
T ypical pulse-heigh t distributions for 1.7-, 8.0-, 13.5-, and 15-:VIev electrons entering the 5-in .-diameter by 5-in .-long sodium-iodide crystal are shown in figure 3.
R esults of the percentage resolution as a function of the incident electron energy are given in fi gure 4.
The resolution for electrons of energy less than 6 M ev deviates markedly from that expected on the basis of the statistical fluctuations in the number of photons detected by the photomultipliers [1]. This was du e to the scattering and stragglu1g in the crystal entry window, which are unportant at low energies. At about 6 or 7 Mev the resolution values are those one would expect from the statistical fluctuations. B ecause the syn thesis of pul e-heigh t distributions for X-rays that follows depends on pulse height distributions obtained for electrons liberated on the crystal axis and within the crystal, the energy resolu tion values used for electron energies less than 6 1'Iev were those assumed to be determined by statistical fluctuations with a Gaussian half-width infen'ed from previous work with a similar spectrom-
2 4
20 ~ z 0 ;:: 16
" ..J 0
'" w 12 cr o ,. '" cr w 8 z w
4
0 0
PRESENT EXPERIMENT
/ o
12 PULSE HEIGHT. Mev
o
o 0
o
16 20
FIG U RE 4. P ercent energy j·esolution inferred from cw·ves of the type shown in figure 3.
The lower curye from 1 to 6 Mey was derived from earlier data [l] wi th gamma rays.
,. '" cr
15
~ 10 w ENERGY CAUBATION FROM
PHOTONEUTRON THRE SHOLDS !IN TER NAL TA RGET)
PO INTS AR E OBTAINE D FR OM SODIU M IODIDE SPEC T ROMETER
ENE RGY CONTROL SETTINGS. v
FIGURE 5. Energy cali bration of the betall·on with the spectrometer data.
'1'he points are located at energies determined by gamma·ray energy calibrations plus a most probable energy loss correction due to foil s between the betatron and the spectrometer crystal. Th e vertical lin es abo,'e the experimen tal paints indicate the possible error du e to an assignment of energy by a comparison of tbe peak pulse-heigh t positron i.n the electron dis tributions and tbe low-energy gamma-ray distributions.
eter [1] . For electron energies above 6 :Mev, the experimental distributions similar to those in fi gure 3 were used.
Figure 5 provides a crude test of the linearity of the spectrometer response to electron energy. The ordinate is the kinetic energy of the electrons. The
321
abscissa scale is the potentiometer setting in vol ts on the betatron energy control [6] to which the electron energy has b een shown to be related by a linear function. The experimental points are t he energy values assigned to the pulse heights of the peaks in figure 4 plus 300 kev. This assignment was made by a comparison with a known gamma-ray energy of 4.43 or 1.12 Mev.
T ests were also made with a 5-in.-diameter by 4-in.-long crystal and a 5-in.-d iameter by 9-in.-long
90
80
60
60 <J: a: '" .. l! 60 :> z
'" ~ .. 40 <t .J
'" a:
20
0 2 " 4 6 7
120
100
80
60
40
20
0 2 3 4 5 6 7
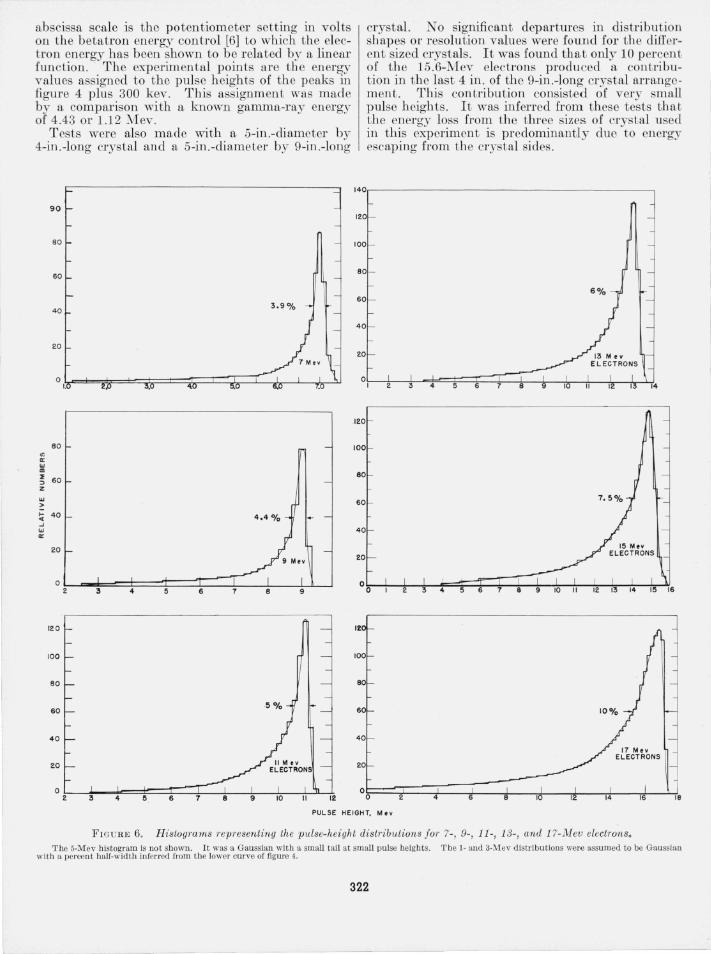
crystal. No significant departures in distribution shapes or resolution values were found for the different sized crystals. It was found that only 10 percent of th e 15 .6-Mev electrons produced a contribution in the last 4 in. of the 9-in.-Iong crystal arrangement. This contribution consisted of very small pulse heights. It was inferred from these tests that the energy loss from the three sizes of crystal used in this experiment is predominantly due to energy escaping from th e crystal sides .
140
120
100
80 -
60
40
20
4 5 6 7 8
120
100
80
60
40
20
0 0 4 5 6 7 8
12
100
80
6
40
20
0 I
0 2 4 18
PULSE HEIGHT. Mev
FIGURE 6. H istograms TepTesenting the pulse-height distribu tions for 7-, 9-, 11-, 13-, and 17-lYlev electrons. The 5·Mev histogram is not shown. It was a Gaussian with a small tail at small pulse heights. The 1- and 3-Mev distributions were assumed to be Gaussian
with a percent half-width inferred from the lower curve of figure 4.
322

3 . Synthesis of X-Ray Pulse-Height Distributions
3.1 . Pair Electron Contributions
The most important contribution to the pulseh eigh t distribution of X-rays above 10 Mev results from th e energy loss in the crystal produced by the pair electrons. Specifically, at 11 Mev, 68 percent and at 19 Mev, 84 percent of the init ial interactions will be by the pair production process.
The origin of the electron pairs produced in the 5-in. by 9-in. crystal will be distributed along the axis of the crystal if the X-rays are assumed apertured into a narrow beam that is directed along the axis. If it is fur th er assumed that the electrons and positrons beh ave sufficiently identically in their scattering and energy -loss ch aracteristics, except for the production of annihilation radiation by the positrons, the resulting pulse-heigh t distributions can b e predicted by folding together the measured distribut ions described in the last section for t hose electron energies th at could combine to form a pair. Th e combined electron energy would be the incoming X-ray energy minus twice the electron rest-mass energy.
1200 .------,--,------,-------__ -;-__ ---,
LEGENO
1000 - - I Mev + 9 Mev -- 3Mev + 7 Mev
---- 5 Mev + 5 Mev
10 12
900 ~ ,---,,..,-~ I
800 ~ __ :: LEGENO = ;~ ~:~ : ~~:~ I i I I
I iii I ~
700 - --- 13 Mev + 5Mev
---- II Mev + 7Mev
600 ... . ····· ··· 9 Mev + 9Mev
500
400
300
200
(b)
10 12 14 16 18 20 22 24
PULSE HEIGHT, Mev
FIGURE 7. Folded pulse-height distributions for various combinations of pair electron energies.
The stru cture at small pulse heights is no t signi ficant and resulted from the detailed , assumed shapes of the histograms of figure 6.
(a) To ta l elJergy of tho two electrons was assnmed to be 11 Mev. (b) Total energy of the two electrons was assnmed to be 19 Mev.
There are obvious differences between the test electrons from the betatron and the pair electrons produced by an absorption of an X-ray photon. One difference is the angular orientation of the elect rons with respect to th e crystal axi. If either of the t wo electrons of a pair h as an energy less than 6 Mev, the probability that i t will lose energy by bremsstrahlung is small . Therefore, th e knowledge of th e angles into which the electrons are emitted is unimportant, because the electrons will ~ose energy by collision los~ and produce a GaussIan-type pulseheigh t distribution (see fig. 4 and its discussion above). On the other hand, if the electron energies are greater than 6 M ev, the electrons will be proj ected into angles less than 10° [7] . For t be present purposes, these angles are small enough to allow one to assume production of all pair electrons parallel to the crystal aXIs.
Another difference between test and pair electrons is th e crystal depth to t he point of init ial interaction. The test electrons interact as soon as they enter th e crystal , whereas the pair electrons interact after ~h e depth of X-ray absorption . However , for the 5-m.diameter by 9-in .-long crystal , 85 percent of the pho tons interact in th e first 5 in. of the crystal. Also very li ttle effect of length fr.om 4 to 9 !n. was detectable in the electron expenment descnbed above. Therefore, there should be little difference in th.e actual available in teraction distance for test and pall' electrons.
'iVith the above assump tions, th e pulse-height distribu tions produced by pair electrons were obtained by folding together the pulse-heigh t distributions for electrons whose combined total energy equaled th e X-ray energy of in terest minus 1 M ev. The indiv idu al distributions were inferred from the exper imental data such as shown in figure 4, and are drawn as histograms in figure 6. The results. of folding together distributions of electrons Wi th kinetic energies of 1 and 9 Mev, 3 and 7 M ev, and 5 and 5 Mev are given in figure 7, a. Similarly, distributions of electrons of 1 and 17 , 3 and 15, 5 and 13 7 and 11 , and 9 and 9 :VIe v are given in figure 7' , b . As all pair electron distr.ibut ions are eauallv nrobable [81. these curves are slmnlv added toge th"er: with do~ble weight beinlS g iven to the 5 plus 5 ::\1ev and the 9 plus 9 M ev curves, respectively. The annihilation radiation contributions are not shown in these curves but are t r eated separately in par t 3.4. These contributions to the final syntheses of the X-ray pulse -heigh t distributions will be shown in figures 9 and 10.
3 .2 . Compton Electron Distributions
The incoming X-rays with energies between 10 and 20 M ev can enter the crystal and undergo Compton scattering as well as produce pairs. In order to include these contributions in the X-ray pulse-height distribution, i t has been assume~ ~~at the distribution of electron energIes for the Imtial Compton interaction of high-energy photons represents the distribution of the sum of the electron energies after multiple Compton interactions of the same initial photons.
323

250
225
200
175
> 150 ~
::;; ....
'" ~ 125 .... '" Q
btl- 100 ."."
75
50
(a)
r"
,
r-J
, , , , , , I
r-J
r-.J r--'
r-""
! r-j
r-S-1-.... J r-"
200
175
150
125
100
75 (b)
50
r·r- , 1 25 r=-- --- - ----T, ll::J_J ~_L_.J- .J
_J---"t-r· ..... ·"\.._r __ ...r-J-lJ---J
PHOTO LlNE~
, (-' I
I : I
r-J
i-J
! I I
r-J
r""
-,
o 8 16 24 32 40 48 56 64 0 8 16 24 32 40 48 56 64
RELATIVE PULSE HEIGHT, v
FIGURE 8. Comparison between J.VIonte Carlo predictions (histograms) and a single-interaction calculation (solid curve) for the Compton electron distributions.
T he predictions apply to a 5-in.-diamcter by 9-in .-long crystal. (a) Incident photon energy was 2.62 Mev. (b) Incident pnoton energy was 4.45 M ev.
The justification for this assumption comes from a consideration of the Monte Carlo predictions of Berger and Doggett [2]. One of their reE'ults [9] was the predicted distribution of electron energies resulting from multiple interactions of an X-ray photon. The histograms in figures 8, a and 8, b are their data , before a Gaussian distribution has been added, for an X-ray energy of 2.6 and 4.4 Mev, respectively. Also drawn on these same figures are the Compton electron distributions for a single interaction [10] for the Stlme X-ray energies. The similarity between the single- and multiple-interaction distributions is striking. As the X-ray energy increases, these distributions will become more peaked and more similar.
Because the 1.fonte Carlo calculation and the single-interaction distribution are similar, the theoretical distribution [10] was used to represent the electron energy distribution resulting from the Compton scattering of X-rays in the range from 10 to 20 M ev. This should be a valid assumption especially because the Compton process is a correction and does not predominate in the determination of the shape of the pulse-height distribution for X-rays.
3.3. Compton Scattering Electron Contribution to the Photoline Energy
Those Compton scattering events for which the scattered X-ray interacts several times within the crystal, can lead to total absorption of the primary X-ray energy. These events have been included as a
Gaussian-shaped contribution at the photoline energy. (The photopeak itself, arising from photons that have lost all their energy by the photoelectric process, is negligibly small at these energies.) In the 10- to 20-Mev energy range, the area of this Gaussian was related to the Compton electron distribution by the following extrapolation from lower energies.
The photofraction, p*, has been defined [2] as the ratio of the area under the photopeak of the pulseheight distribution, which is represented by a Gaussian, to the area under the entire pulse-height distribution. Two constants characteristic of a particular geometry and energy enter the expression for this ratio . The constant a is that fraction of the total pair production events for which both annihilation quanta are absorbed in the crystal. The constant b is that fraction of the Compton scattered photons that are multiply scattered and totally absorbed in the crystal. In terms of the photoelectric (7), pair (7r), Compton (0"), and total ( f.1. ) absorption cross sections, p* is defined as equal to (7+ a7r+ bcr)/f.1..
In order to extrapolate values of b to an energy of 19 Mev, b was calculated up to 5 Mev from the data for a and p* from reference 2. These calculations are shown in table 1 for a 5-in. diameter by 9-in.-Iong sodium-iodide crystal. As will be observed from the sixth column, b varies slowly and should continue to vary slowly up to 19 Mev for a 5-in. by 9-in. crystal. As the Compton cross section ( cr) is small and thus the product bcr is small , errors due
324

TABLE 1. Calculation a of photofraclion, p*, where p* = (r + a".+ bu) !I' ; a= O.633 [2] ; and the sodium-iodide crystal is 5 in. in diameter by 9 in. long
E I' r .. u b p* ---------------
~Mev em'/Y em'/u em'/o em'/y 2 ______ _ 0. 0411 0.0011 0. 0022 0. 0378 0. 681 0.685 3 _______ . 0361 . 0006 . 0059 .0296 . 632 . 640 4 _______ . 0:147 . 0004 . 0096 . 0247 . 615 . 625 5 _______ .0345 .0003 . 0129 . 0213 .600 . 617
o T he values of the absorption coefficicnts 1', r, .. , and u f0r sodium iodide were taken from G. White of the Bureau (privatc commun ication).
TABLE 2. Calculation a of modified photofractions, P *, where P*= (r + A".+ bu)!I'; A = O.633 [2], and the sodium-iodide crystal is 5-in. in diameter by 9 in. long
E I' r .. u b p * ---------------
J11ev em'/y em'/u em'/y em'/!! 6 _______ 0.0347 0. 0003 0.0156 0. 0188 0.590 0.614 8 _______ . 0357 . 0002 . 0201 . 0154 .580 . 613 10 ______ . 0371 . 0002 . 0238 . 0131 . 5iO . 617 1L _____ .0375 . 0001 . 0255 . 0120 . 570 . 619 19 ______ . 0435 . 0001 . 0355 . 0080 .550 .623
a T he values,)f the ahsorpt i::m coefficients J1., .,., 7r, and (J for sodium iodide were taken from G. Whitc of thc Burcau (private communication).
to - the extrapolation of b in the evaluation of the 19-Mev photofraction values should be small .
The extrapolated values of b are given in table 2 together with the lllodified photofraction, P*, from 6 to 19 M ev, and the absorption coefficient data corresponding to those in table 1. p* is differentiated from the low energy p* because the latter values for energies above 5 .Mev cannot be compared directly with experimental values. p* contains a component A lT , contrasted to alT of p*, which includes the total area under the pail' electron contribution and not just the pair clectron area under a Gaussian curve at the photoline position.
In synthesiz ing the X-ray pulse-height distribution, the Compton scattering events that result in contributions at the photoline energy were included as a Gaussian with an area b and a half-width of O.09-fiJ; [1,2]. The area uIlder the Compton electron distribution was, lik:ewise, taken as (1- b) CT.
3.4. Contributions Due to the Esc ape of Annihilation Radiation
The only remaining influence on the broadening of the distribution due to X-rays will result from the escape of one or two annihilation photons from the positron of the electron pair originally produced by the incoming X-ray. Berger and Doggett [2] have calculated the escape of annihilation photons from a 5-in.-diameter by 9-in.-Iong crystal and found that 63 .3 percent of the photons will be completely captured, and 21.5 percent of the events have exactly one annihilation photon escape with no in teraction. The remaining 15.2 percent of the events have some interaction of the one or two annihilation photons before some of their energy escapes from the crystal. For the present purposes it is sufficiently accurate to
assume that 36.7 percent of the events have exactly one annihilation escape and, therefore, that percentage of the folded electron-pan· pulse-height distribution will be displaced downward in energy by 0.51 Mev.
3 .5 . Synthesis of the X-Ray Pulse-Height Distributions
The four contributions discussed above have been used to synthesize the pulse-height distribution for 11- and 19-Mev X-ray pho ton . The areas of these contributions were all referred to the area under the folded electron-pair distribution. The relative contributions are given in table 3.
The component distributions are given in figure 9,a for 11 Mev X-rays and in figure 10,a for 19 Mev X-rays. The sum of these distributions and the final result of the predi ctions are given as the solid lines in the b curves of these figures.
TABLE 3. Relative areas of the Jour contributions to the X-ray pulse-height distribution
Contri bution Fractioll (F) o I I.Mev o 19-Mev value (1'JI ) val ue (F,,)
Compton events to photoline __ bu/a .. 0.423 0. 195 Compton distributioll _________ (l -b)u/a .. .319 . 160 Folded electron pair distri·
bution ______________________ a7r/a7r 1 1 Secondary annihilation dis-
Lribu Lion ________ • ______ ____ (l-a) .. /a .. 0. 580 0. 580
o Values in table 3 were calculated with data from lables 1 and 2.
.8
-~n It \ 1 S"( Py)1I6 Mev /
RESULT:r.,t J
PR EOICT ION WITH \ CHA NNEL SMEAR
6 '
!l6 - 32
" (,(
48 24 ,. -40 - 16
.8
\ -, .
•• '4 '0
20
16
16 (~ ~I
0,,=. ==l==:;:::::=;!=----+---:c--+-~W,.. / J: 1\ ~ .
~~J~ .,
"
8 -
('J
4 5 6 10 " PULSE HEIGHT. M f v
FIG URE 9. Synthesis of th e pulse-height distribution pI·oduced by 11-Mev X-rays in a 5-in.-diarneter by 9-in.-Iong sodium iodide crystal spectrometer.
(a) Four contributions to tbe synthesized distribution: (1) Co mpton electron distribution (dotted cun' e); (2) m ultiple Compton interactions that contribute to the photoline energy (solid curve) ; (3) folded electron-pair distribution nong dashed curve) ; (4) seco ndary distribution due to loss of a(mibilation rad iation (sbort dashed curve) .
(b) Addition of the four cu rves of (a) to obtain the predicted pulse height distribution.
(c) Comparison of the l1·Mev distribution of (b) witb t lle experimental 11.6 Mev distribution. The d istribution of (h) has been smoothed by tbe channel wid ths used in obtaloing the experimental distri bution. 'I'he abscissa and ordi· nate scales of the experimental distribution were normalized to the predicted distribul"ion.
325

48
60 -
j 40
48
" " Ib'
24 U 7(p,y ) 17.6 Mev RESULT
24
PULSE HEIGHT, Mtv
FIGURE 10. Synthesis of the pulse-height distribution p1'Oduced by 19-Mev X -rays in a 5-in.-diametel' by 9-in.-long sodiumiodide crystal spec/rometcl'.
(a) Four contributions to the synthesized distribution: (I) Compton electron distributiou (dotted curve) ; (2) multiple Compton interactions that con tribute to the photoJine energy (solid curve); (3) folded electron·pair distribution (long dashed curve); (4) secondary distribution due to loss of annibila tion radiation (short dasbed curve).
(b) Composite distribution (sol id curve) obtained by adding tbe cu rves in (a) . Comparisou is made with the experimental 17.6·Mev distribution. In tbis case tbe experimen tal spectrum was taken witb small channel widths so tbat the smearin g thus introduced was negligible (dashed curve). 'rhe abscissa and ordinate scales of th e experimen tal d istribu tion were normalized to the pred ioted d ist ribu t ion .
4. Discussion
The synthesized pulse-height distributions for 11-]\![ev and 19-Mev X-rays were compared with experimental distributions obtained previously with 11.6- and 17 .6-Mev gamma rays [I] .
Figure 9,c, shows th e experimental distribution for th e BlI(p;y) gamma-rays [1] . Because the intensity of this source was small, th e channel window size on th e differential pulse-heigh t analyzer had to be made large. The curve of figure 9,b , has been smeared with the channel window used in the experimen t in order to arrive at the prediction shown as the solid curve of figure 9,c. The experimental and predicted curves have been normalized at the peale The experimental curve is higher than the predicted one, at pulse heights smaller th an the one at which the peak occurs, for practically all pulse heights. However, the differences can be attributed to the Compton scattered gamma rays from th e thick copper target assembly, and to the collimator wall effects used in the work described in reference [1] . The wall of the %-in. -diameter collimator hole sabtended a relatively large solid angle for th e gamm a rays from th e target.
H ence gamma rays could interact and lose energy in th e wall and then penetrate into the large-diameter crystal. Both effects of target and collimator would result in degraded-energy gamma rays entering th e crystal. Similar comments can be made regarding the comparison in figure 10,b, of the 19-Mev prediction with that obtained with the 17.6-Mev gamma rays from the LF(p,'Y) reaction [I].
No detailed calculation to correct the experimental curves bas been made because the experimental data [1 ], particularly that of the 11 .6-Mev line, were too poor to warrant extensive interpretations. N evertheless, the comparison between prediction and experiment is considered to b e good.
The method of synthesizing pulse-height distributions due to X-rays, which has been outlined, is the best procedure known to the present authors in the X-ray range from 10 to 20 Mev. Because of the general success and the expected validity of the predictions, it is planned to apply a similar procedure for energies from 5 to 19 J'v1ev in 2-Mev incremen ts. These results, combined wit h the work of Berger and Doggett [2], will allow an interpretation of experimental pulse-height distributions in the range from 100 kev to 20 M ev, when a total absorption spectrometer with a 5-in . diameter and a 9-in.-long crystal are used.
The work of B. Petree and E. G. Fuller in obtaining a well-controlled electron beam for the present experiment is gratefully acknowledged. Discussions with M. Berger and N. Starfelt were very helpful.
5 . References
[1] R . S. Foote and H. W. Koch, R ev. Sci . lnstr. 25, 746 (1954) .
[2] M. J . Berger and J . Doggett, J . Research NBS 56, 355 (19 56) RP2686 .
[3] H . W. Koch, J . Wyckoff, and B . P etree, Phys. R ev. 99, 663 (1955).
[4] R. S. Foote a nd Ben P etr ee, R ev. Sci. Instr . 25, 694 (1954) .
[5] E . L. Goldwasser, F . E. Mills, and A. O. Hanson, Phys. R ev. 88, 1137 (1952).
[6] E. Saunders (private communi cation) . [7] H . W. Koch and R. E. Carter, Phys. Rev . 77, 165 (1950) . [8] W. H eitler, The quant um t heory of ra.diation, 2d ed.
(Oxford Univ. Press, Oxford, England, 1949). [9] M. Berger and J. Doggett (private communication).
[10] Ann Nelms, N BS Circular 542 (1953).
WA SHINGTON, December 5, 1955.
326