response time and click position: cheap indicators of ... · response time and click position:...
TRANSCRIPT

ORIGINAL PAPER
Response time and click position: cheap indicatorsof preferences
Fadong Chen1,2,3 • Urs Fischbacher1,2
Received: 29 November 2015 / Revised: 26 August 2016 / Accepted: 29 August 2016 /
Published online: 14 September 2016
� Economic Science Association 2016
Abstract This paper investigates how process data like response time and click
position relates to economic decisions. We use a social value orientation experi-
ment, which can be considered as a prototypical multi-attribute decision problem.
We find that in the social value orientation task more individualistic subjects have
shorter response times than prosocial subjects. Individualistic subjects click more
often on their own payoffs than on the others’ payoffs, and they click more often on
their own payoffs than prosocial subjects. Moreover, the response time information
and the click position information are complementary in explaining subjects’
preferences. These results show that response times and click positions can be used
as indicators of people’s preferences.
Keywords Click position � Response time � Social preferences � Experiment
JEL Classification C72 � C91 � D87
Electronic supplementary material The online version of this article (doi:10.1007/s40881-016-0026-6)
contains supplementary material, which is available to authorized users.
& Urs Fischbacher
Fadong Chen
1 Department of Economics, University of Konstanz, Universitatsstr. 10, 78457 Konstanz,
Germany
2 Thurgau Institute of Economics, Hauptstr. 90, 8280 Kreuzlingen, Switzerland
3 Graduate School of Decision Science, University of Konstanz, Universitatsstr. 10,
78457 Konstanz, Germany
123
J Econ Sci Assoc (2016) 2:109–126
DOI 10.1007/s40881-016-0026-6

1 Introduction
There is an increasing interest in using process data to get a better understanding
of economic decision making. Different methods such as response times
(Rubinstein 2007), pupil dilations (Wang et al. 2010), eye movements (Reutskaja
et al. 2011) and even neural activity (Smith et al. 2014) have been introduced
and have shown significant correspondences between this kind of data and
people’s decisions. These methods vary significantly in their complexity and
some of them are quite costly. We show that simple by-product data in lab or
online economic experiments, such as response times and click positions, can
provide information about people’s preferences. With a proper design, this data
can be collected at almost no cost. While response time analysis has been used
frequently (for a review, see Spiliopoulos and Ortmann 2015), click positions
have received attention mainly in computer science. There, click positions are
analyzed routinely, in particular for the optimization of web pages (Guo et al.
2009; Liu et al. 2010). However, these studies use the click position only to
determine the choice. We study what attributes of a choice subjects click on and
show that the personally attractive attributes of a choice have a higher
probability to be clicked.
Specifically, we use a social value orientation (SVO) experiment in which the
response times and the click positions are recorded. The SVO task consists of
several decision situations, each consisting of a menu of allocations between the
deciding subject and an anonymous partner. Thus, the SVO measures how much
people care about their own as compared to the other player’s welfare. The SVO
task represents a prototypical situation in which people have to assess and trade off
different attributes of an option—in the case of the SVO their own vs the other’s
payoff. Our results show that more prosocial subjects take longer to make their
decisions in the SVO task. Concerning the click position, we find that individualistic
subjects click more often on their own payoffs than on the others’ payoffs, and they
click more often on their own payoffs than prosocial subjects. Moreover, the
response time information and the click position information are complementary in
explaining subjects’ SVO. Thus, response time and click position can be used as
indicators of people’s preferences.
Response time has increasingly been used in economic experiments (Hutcherson
et al. 2015; Krajbich et al. 2010, 2014), in particular as an indicator of whether a
decision is made intuitively or deliberatively (Achtziger and Alos-Ferrer 2014;
Krajbich et al. 2015; Piovesan and Wengstrom 2009; Rand et al. 2012; Schulz et al.
2014). Most closely related to our study is Fiedler et al. (2013), who use eye-
tracking technology to investigate the underlying processes of social decision
making. They find that differences in SVO are accompanied by consistent
differences in information search and response times. In another study by Liebrand
and McClintock (1988) they find that the processing times vary systematically
between different types of subjects. Specifically, cooperators and competitors are
slower than altruists and individualists. There is a tradition of using the mouse to
track the information search process or information processing. The most prominent
110 F. Chen, U. Fischbacher
123

example is probably MouseLab (Brocas et al. 2014; Payne et al. 1993).1 In this
environment, subjects access the information hidden behind boxes on the computer
screen by moving the cursor over the boxes. Another method that uses the natural
interaction is ‘‘response dynamics’’ (Kieslich and Hilbig 2014; Koop and Johnson
2011; Spivey et al. 2005). In this paradigm, the mouse response is tracked as
subjects move from a central location to one of two disparately spaced options. The
curvature of the mouse movement is taken as an indicator of cognitive conflicts and
more curved response trajectories indicate stronger conflicts.
We confirm previous evidence that the response time correlates with subjects’
preferences and find that the click position also correlates with subjects’
preferences. The click position provides much less detailed information than
MouseLab since it does not record the information search process, but it has the
advantage that it records natural behavior while in MouseLab people need to move
the mouse explicitly to acquire information. In this sense, the analysis of the click
position is similar to the response dynamics paradigm, which also uses the computer
interaction as an additional source of information. Our study highlights the potential
benefits of recording response times and click positions in economic experiments
involving multiple attribute decision making and using this data to infer people’s
preferences.
2 Experimental design and procedure
The experiment is built on the SVO Slider Measure by Murphy et al. (2011). In this
task, subjects make a series of allocation decisions. In each allocation decision, the
subject chooses one out of nine allocations involving varying payoffs for herself and
another anonymous participant. A screenshot of one item is shown in Fig. 1. In this
example, the subject can choose one of nine options from the most individualistic
distribution on the right to the most altruistic distribution on the left. In the SVO
task, there are six primary items that allow the assessment of the subject’s concern
for the payoff of the other player. The sum of the chosen allocations determines a
vector in the plane of the own and the other player’s payoff and provides a scale of
SVO that indicates the concern for the welfare of others.2 In addition, there are nine
secondary items, which makes it possible to distinguish the prosocial motives of
inequality aversion and efficiency.3 We do not refer to this distinction in our study,
but we use the secondary items to check the robustness of our results.
The subjects made their decisions by clicking on the allocation that they
preferred most by clicking on one of the dark grey areas. For each decision, we
recorded the subject’s response time and the coordinate of the position that the
subject clicked. This shows whether the subject clicked on the side of their own
payoff or on the side of the payoff of the other player. Before the distributional
decision, the subjects needed to click on a button that appeared in the lower region
1 For details about MouseLab see http://www.mouselabweb.org.2 The definition of the scale can be found in the Sect. 3.3 Both the primary and the secondary items are shown in Appendix ‘‘The items in the SVO task’’.
Response time and click position: cheap indicators of… 111
123

of the screen to get into the decision situation. Thus, the mouse was always
positioned horizontally in the middle and vertically in the lower part of the screen
immediately preceding each decision.
The experiment was computerized using z-Tree (Fischbacher 2007). A total of
132 students recruited via ORSEE (Greiner 2015) took part in the experiment
between October and November 2014. The experiment took place in the Lakelab at
the University of Konstanz. Upon entering the laboratory, subjects were randomly
assigned into pairs. We randomized the order of the 15 items for each pair. At the
end of the session, one of the 15 items was randomly selected to be paid out in each
pair according to one person’s choice, who was randomly determined as well. The
SVO task was part of another experiment and conducted at the beginning of the
session (see Instructions in the ‘‘Appendix’’). The whole experiment lasted for about
one and a half hours and the subjects earned 13.80 Euros on average.
3 Results
3.1 Social value orientation
All choice items in the SVO measure correspond to nine equidistant points on a line
in the self/other allocation plane. The six primary items correspond to the six lines
that connect four points on a circle with center (50, 50) and radius 50. The points
correspond to four SVO types: altruistic, prosocial, individualistic, and competitive
types. The average of the chosen allocations in the primary items determines the
SVO angle as follows:
SVO angle ¼ arctan�PO � 50�PS � 50
� �
where �PS is the average of the own payoff, and �PO is the average of the other’s
payoff in the chosen allocations. The SVO angle is a (practically) continuous
measure of social value orientation and a higher angle indicates greater concern for
the welfare of others. SVO angles of -16.26�, 0� and 61.39� indicate perfect
competitiveness, perfect selfishness, and perfect altruism, respectively. Given the
computed SVO angles, subjects can also be categorized into four types: altruists
(SVO[ 57.15�), prosocials (22.45�\SVO\ 57.15�), individualists (-12.04�\SVO\ 22.45�), and competitors (SVO\-12.04�).4
Fig. 1 The screenshot of one item in the SVO task (translated from German)
4 For further details, see Murphy et al. (2011).
112 F. Chen, U. Fischbacher
123

Subjects’ SVO angles are reported in Fig. 2. In line with the previous findings
(Ackermann et al. 2016; Murphy et al. 2011), subjects vary considerably in their
SVOs. In our study, the average SVO angle equals 21.69� (sd. = 14.15�) with the
lowest observation being an angle of -16.26� and the highest observation being an
angle of 52.91�. Among the 132 subjects, 68 (51.52 %) subjects are prosocial, 63
(47.73 %) subjects are individualistic, and 1 (0.76 %) subject is competitive.
3.2 Response time and preferences
Next we study the correlation between SVOs and response times. There are two
reasons why we expect shorter response times for individualistic subjects in the
SVO task. First, individualistic subjects have smaller information requirements
because they do not care about the payoff of the other player. This has also been
shown in eye tracking studies (Fiedler et al. 2013). Second, for the individualistic
subjects the decision does not involve a conflict (or involves a weak conflict)
between different motives while for prosocial subjects most of the decisions are
associated with a stronger conflict between the own payoff and the payoff for the
other player. It has been shown that the number of cognitive conflicts between
motives and the degree of conflict lead to longer response times (Chen and
Fischbacher 2015; Evans et al. 2015). Therefore, we expect that on average, the
subjects with higher SVOs are slower in making decision in the SVO task.5
Fig. 2 The distribution of the SVO angles
5 If there are many subjects in each SVO type, the response time should increase from pure
individualistic subjects to pure altruistic subjects, as well as from pure individualistic subjects to pure
competitive subjects. That is, there should exist a U-relationship between response times and SVO angles.
In the SVO slider measure, a perfectly consistent individualistic subject yields an angle between -7.82�and 7.82�. In our experiment, there are no altruistic subjects and only 1 subject whose SVO angle is less
than -7.82�. Therefore, we expect that, on average, the response time increases with the SVO angle in
our study.
Response time and click position: cheap indicators of… 113
123

The distributions of response times and common logarithm of response times are
shown in Appendix ‘‘Distributions of response times and the common logarithm of
response times’’. The figures show that the distribution of response time is right
skewed, but the common logarithmic transformation makes it symmetric and
removes outliers.6 The average of the logarithm of response times (ALRT) in the
primary items is 0.898 with a standard deviation of 0.293, and the ALRT in the
secondary items is 0.797 with a standard deviation of 0.310. The left panel of Fig. 3
shows the relationship between the ALRT in the primary items and the SVO angle
for each subject. The response times are positively correlated with the SVO angles
(Spearman two-sided test, q = 0.506, p\ 10-9).7 That is, the subjects with higher
SVOs are slower in making decisions in the SVO task.
Result 1 The subjects who are more prosocial are slower in making decisions in
the SVO task.
This result is based on the data of the primary items, which we use to determine the
subjects’ SVOs. The secondary items are used to assess the degree of inequality
aversion vs. the degree of joint gainmaximization among prosocial subjects. Thus, the
data of the secondary items allows us to check the robustness of our first result. The
right panel of Fig. 3 indicates that the response times in the secondary items are also
positively correlated with the SVO angles (Spearman two-sided test, q = 0.514,
p\ 10-9), which confirms our first finding. Moreover, regressions (1) and (2) in
Table 1 show that the coefficients of SVO angle are significantly positive in both
primary and secondary items for individualistic subjects, also if we control for the
decision number and the distance that the cursor has to move from the button in the
bottom-center to the chosen option. The coefficients of SVO angle are also positive for
prosocial subjects (significant in the primary items, but not significant in the secondary
items, p = 0.109). The sign of the distance that the cursor has to move is negative,
Fig. 3 The relationship between the average logarithm of response times and the SVO angles
6 After the logarithm transformation, all observations lie within (-2.792, 3.403) standard deviations.7 To test the robustness of our findings, we also conducted the analysis using the untransformed response
times, which essentially led to the same results.
114 F. Chen, U. Fischbacher
123

which is counterintuitive at first glance. The reason is that the extreme decisions are
easier tomake. This is consistent with a view that at least some subjects werewilling to
take an evenmore extreme decision and, therefore, the decision is particularly easy. In
regressions (3) and (4) of Table 1, we exclude the decisions in which the leftmost or
the rightmost optionswere chosen. The results show that the distance has no significant
effect on response time in the primary items and has significantly positive effect on
response time in the secondary items. The horizontal extent of the decision area is
larger than the vertical extent and only this direction directly affects the decision.
Nevertheless, the vertical click position could affect decision time. Because the own
payoff was also on top and further away from the initial mouse position, we would
expect that selfish decisions would be slower. We analyzed this question in a
regression analysis and found that it is not the case. If anything, decisions in the upper
part are quicker but this effect is far from significant.
3.3 Click position and preferences
Now, we turn to the correlation between the click positions and people’s
preferences. In the experiment, the subjects make decisions by clicking on the
Table 1 OLS regressions of response times
(1) (2) (3) (4)
Primary
items
Secondary
items
Primary items without
extreme decisions
Secondary items without
extreme decisions
SVO angle 0.012* 0.012 0.012 0.008
(0.007) (0.007) (0.012) (0.009)
Individualist -0.243 -0.261 -0.358 -0.099
(0.241) (0.256) (0.396) (0.337)
SVO
angle 9 individualist
0.021** 0.020** 0.031* 0.016
(0.009) (0.009) (0.018) (0.013)
Decision number -0.023*** -0.037*** -0.024** -0.034***
(0.005) (0.005) (0.012) (0.007)
Distance from the
bottom-center
-0.014*** -0.012*** -0.006 0.020**
(0.004) (0.004) (0.014) (0.009)
Constant 4.239*** 3.886*** 3.074 -1.093
(0.611) (0.659) (2.343) (1.461)
R2 0.192 0.220 0.142 0.081
Adj. R2 0.187 0.217 0.123 0.073
Num. obs. 786 1179 239 549
The dependent variable is ln (RT). Individualist is a dummy variable for SVO type (1 for individualistic
type and 0 for prosocial type). Decision Number is the number of the decision situation which measures
the subjects’ experiences. Distance from the Bottom-Center is the linear distance that the cursor has to
move from the continue button in the bottom-center to the center of the chosen option. The distance is
measured using the same unit as the click position analysis. The robust standard errors are clustered on
each subject and reported in parentheses
*** p\ 0.01, ** p\ 0.05, * p\ 0.1
Response time and click position: cheap indicators of… 115
123
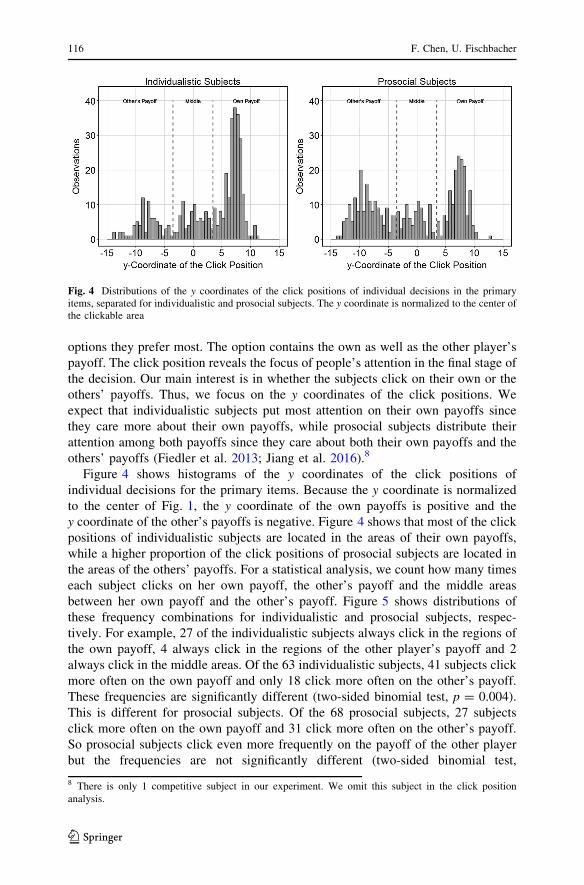
options they prefer most. The option contains the own as well as the other player’s
payoff. The click position reveals the focus of people’s attention in the final stage of
the decision. Our main interest is in whether the subjects click on their own or the
others’ payoffs. Thus, we focus on the y coordinates of the click positions. We
expect that individualistic subjects put most attention on their own payoffs since
they care more about their own payoffs, while prosocial subjects distribute their
attention among both payoffs since they care about both their own payoffs and the
others’ payoffs (Fiedler et al. 2013; Jiang et al. 2016).8
Figure 4 shows histograms of the y coordinates of the click positions of
individual decisions for the primary items. Because the y coordinate is normalized
to the center of Fig. 1, the y coordinate of the own payoffs is positive and the
y coordinate of the other’s payoffs is negative. Figure 4 shows that most of the click
positions of individualistic subjects are located in the areas of their own payoffs,
while a higher proportion of the click positions of prosocial subjects are located in
the areas of the others’ payoffs. For a statistical analysis, we count how many times
each subject clicks on her own payoff, the other’s payoff and the middle areas
between her own payoff and the other’s payoff. Figure 5 shows distributions of
these frequency combinations for individualistic and prosocial subjects, respec-
tively. For example, 27 of the individualistic subjects always click in the regions of
the own payoff, 4 always click in the regions of the other player’s payoff and 2
always click in the middle areas. Of the 63 individualistic subjects, 41 subjects click
more often on the own payoff and only 18 click more often on the other’s payoff.
These frequencies are significantly different (two-sided binomial test, p = 0.004).
This is different for prosocial subjects. Of the 68 prosocial subjects, 27 subjects
click more often on the own payoff and 31 click more often on the other’s payoff.
So prosocial subjects click even more frequently on the payoff of the other player
but the frequencies are not significantly different (two-sided binomial test,
8 There is only 1 competitive subject in our experiment. We omit this subject in the click position
analysis.
Fig. 4 Distributions of the y coordinates of the click positions of individual decisions in the primaryitems, separated for individualistic and prosocial subjects. The y coordinate is normalized to the center ofthe clickable area
116 F. Chen, U. Fischbacher
123

p = 0.694). We can also directly compare the distribution of the individualistic
subjects with the distribution of the prosocial subjects. Individualistic subjects click
significantly more on their own payoffs than prosocial subjects, they click
significantly less often on the others’ payoffs than prosocial subjects, and the
number of times that subjects click on the middle areas are not significantly
different between the two groups (two-sided bootstrap Kolmogorov–Smirnov tests,
p = 0.014, p = 0.007 and p = 0.994, respectively). That is, individualistic subjects
click more often on their own payoffs than on the others’ payoffs; and they click
more often on their own payoffs than prosocial subjects.
Result 2 Individualistic subjects click more often on their own payoffs than on
the others’ payoffs; and they click more often on their own payoffs than prosocial
subjects.
Similar to the response time analysis, we can also use the data of the secondary
items to check the robustness of our result regarding the click positions. Figure 6
displays histograms of the y coordinates of the click positions in the secondary
items. As in the primary items, most of the click positions of individualistic subjects
are located in the regions of their own payoffs, while a higher proportion of the click
positions of prosocial subjects are located in the regions of the others’ payoffs.
Figure 7 shows distributions of the frequency combinations of the click positions in
the secondary items, separately for individualistic and prosocial subjects. Also for
the secondary items, the majority of individualistic subjects click more frequently
on the own payoff, 39 subjects in comparison to 23 who click more frequently on
the other player’s payoff. These frequencies are marginally significantly different
(two-sided binomial test, p = 0.056). This is also different for prosocial subjects. Of
the 68 prosocial subjects, 24 subjects clicked more often on the own payoff and 38
clicked more often on the other’s payoff. Prosocial subjects click more frequently
on the payoff of the other player but the frequencies are only marginally statistically
different (two-sided binomial test, p = 0.098). Nevertheless, the two distributions
are significantly different. Individualistic subjects click significantly more often on
Fig. 5 The frequency combinations of clicking own vs. the other’s payoff in the primary items, separatedfor individualistic and prosocial subjects
Response time and click position: cheap indicators of… 117
123

their own payoffs than prosocial subjects, they click significantly less often on the
others’ payoffs than prosocial subjects, and the number of times that subjects click
on the middle area are not significantly different between the two groups (two-sided
bootstrap Kolmogorov–Smirnov tests, p = 0.022, p = 0.003 and p = 0.777,
respectively). That is, individualistic subjects click more often on their own
payoffs than on the others’ payoffs; and they click more often on their own payoffs
than prosocial subjects. Thus, the data of the secondary items confirm the robustness
of our result regarding the click positions.
We conclude this subsection with an analysis of whether the correlation between
click position pattern and SVO type is driven by the type of the subject or by the
individual decision. In all items that are used to calculate the SVO angle, the other
player’s payoff varies linearly. This makes it possible to define an altruism measure
Fig. 6 Distributions of the y coordinates of the click positions of individual decisions in the secondaryitems, separated for individualistic and prosocial subjects. The y coordinate is normalized to the center ofthe clickable area
Fig. 7 The frequency combinations of clicking own vs. the other’s payoff in the secondary items,separated for individualistic and prosocial subjects
118 F. Chen, U. Fischbacher
123

for every decision. It equals one for the most altruistic choice, zero for the most
selfish choice and is linearly interpolated for the values in between. In Table 2, we
show how these measures affect whether the own payoff is clicked or not. The
regressions show that both the type of the subject measured with the SVO angle as
well as the individual decision are important but the type of the subject is more
important. It has a higher R2 as a single explanatory variable and it is more robust if
we include the other variable.
3.4 Comparison of response time and click position
In this part, we investigate how much of the variation in preferences can be
explained by response time and click position, and whether one is redundant if the
other is available. First, we calculate the classification rate when assigning a subject
to a prosocial or an individualistic type using only the response time measure
(ALRT) or the click position measure (number of clicks on the other’s payoff). As
there are 63 individualistic and 68 prosocial subjects according to the classification
standard of the SVO task, we use the 0.48 [63/(63 ? 68)] quantile of the response
time measure or the click position measure as the classification boundary. The
classification results in Table 3 show that the click position works almost equally as
well as the response time. For instance, in the primary items, 40 of 63 subjects who
are below or equal to the response time boundary are individualistic, and 45 of 68
subjects who are above or equal to the response time boundary are prosocial. With
respect to the click position, 38 of 63 subjects who are below or equal to the click
position boundary are individualistic, and 43 of 68 subjects who are above or equal
to the click position boundary are prosocial.
Next we compare the explanatory power of response time and click position on
subjects’ preferences. Specifically, we use response time (ALRT) and click position
Table 2 Logit regressions of altruism of decision and SVO angle on click position in the primary items
(1) (2) (3)
Constant 0.625*** 1.080*** 1.127***
(0.171) (0.296) (0.299)
Degree of altruism of decision -0.750*** -0.349**
(0.188) (0.153)
SVO angle -0.034*** -0.030***
(0.011) (0.011)
AIC 881.328 863.523 862.833
BIC 890.297 872.492 876.287
Log likelihood -438.664 -429.761 -428.417
R2 0.018 0.037 0.041
Num. obs. 655 655 655
The dependent variable is a dummy variable of clicking on the upper part (1: own payoff) or the lower
part (0: other’s payoff). Item 2 is excluded (selfishness and altruism aligned). The robust standard error
are clustered on each subject and reported in parentheses
*** p\ 0.01, ** p\ 0.05, * p\ 0.1
Response time and click position: cheap indicators of… 119
123

information (number of clicks on the other’s payoff) to predict subjects’ SVO type.9
Table 4 shows the regression results. The dependent variable is a dummy variable
for SVO type (1 for prosocial and 0 for individualistic type). In both primary and
secondary items, the regressions which includes both response time and click
position have higher explanatory power than the regressions in which only response
time or click position is included. We use regressions (3) and (6) to predict subjects’
SVO type, and the results are shown in Table 5. The classification in Table 5 is
clearly better than the classification in Table 3. To compare the classifications in
Table 5 and Table 3 quantitatively, we calculate the u coefficient. The u coefficient
9 We can get similar results if we use response time and click position to predict the SVO angle, results
are shown in Table 6 in ‘‘Appendix’’.
Table 3 Classification based on response time or click position
Primary items Secondary items
Individualistic Prosocial Individualistic Prosocial
Response time
Individualistic (63) 40 23 42 21
Prosocial (68) 23 45 21 47
Click position
Individualistic (63) 38 25 41 25
Prosocial (68) 25 43 29 46
Table 4 Logit regressions of response time and click position information on SVO type
Primary items Secondary items
(1) (2) (3) (4) (5) (6)
ALRT 5.111*** 5.180*** 4.983*** 4.942***
(1.173) (1.222) (1.127) (1.155)
Number of clicks on the
other’s payoff
0.265*** 0.273*** 0.157*** 0.152**
(0.086) (0.096) (0.054) (0.060)
Constant -4.496*** -0.398* -5.045*** -3.889*** -0.401* -4.310***
(1.067) (0.233) (1.144) (0.920) (0.240) (0.970)
AIC 160.890 175.059 153.992 159.248 176.461 154.480
BIC 166.641 180.809 162.618 164.998 182.211 163.106
Log likelihood -78.445 -85.529 -73.996 -77.624 -86.230 -74.240
R2 0.135 0.057 0.184 0.144 0.049 0.182
Num. obs. 131 131 131 131 131 131
This analysis does not include the competitive subject. The dependent variable is a dummy variable for
SVO type (1 for prosocial and 0 for individualistic type). ALRT is the average logarithm of response times
for the subject. Number of clicks on the other’s payoff is how many times the subject clicked on the
other’s payoff
*** p\ 0.01, ** p\ 0.05, * p\ 0.1
120 F. Chen, U. Fischbacher
123
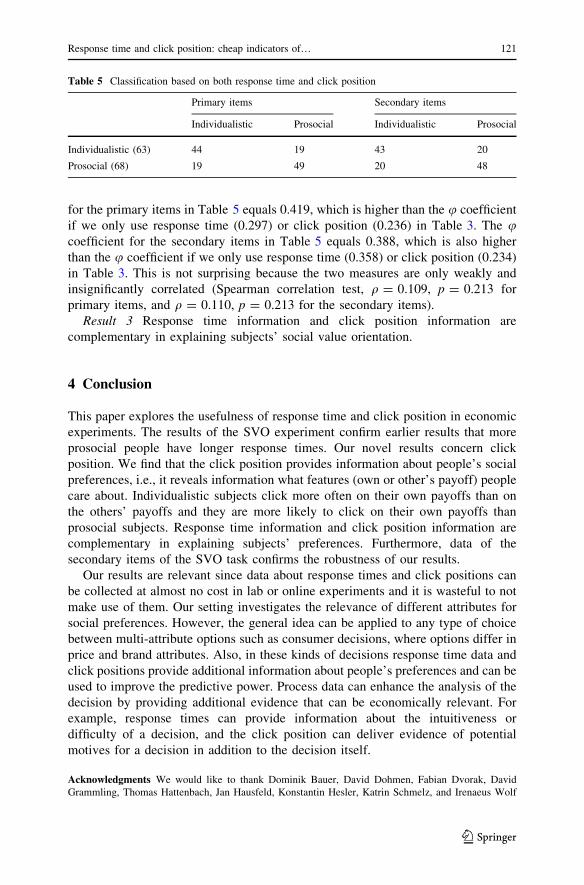
for the primary items in Table 5 equals 0.419, which is higher than the u coefficient
if we only use response time (0.297) or click position (0.236) in Table 3. The ucoefficient for the secondary items in Table 5 equals 0.388, which is also higher
than the u coefficient if we only use response time (0.358) or click position (0.234)
in Table 3. This is not surprising because the two measures are only weakly and
insignificantly correlated (Spearman correlation test, q = 0.109, p = 0.213 for
primary items, and q = 0.110, p = 0.213 for the secondary items).
Result 3 Response time information and click position information are
complementary in explaining subjects’ social value orientation.
4 Conclusion
This paper explores the usefulness of response time and click position in economic
experiments. The results of the SVO experiment confirm earlier results that more
prosocial people have longer response times. Our novel results concern click
position. We find that the click position provides information about people’s social
preferences, i.e., it reveals information what features (own or other’s payoff) people
care about. Individualistic subjects click more often on their own payoffs than on
the others’ payoffs and they are more likely to click on their own payoffs than
prosocial subjects. Response time information and click position information are
complementary in explaining subjects’ preferences. Furthermore, data of the
secondary items of the SVO task confirms the robustness of our results.
Our results are relevant since data about response times and click positions can
be collected at almost no cost in lab or online experiments and it is wasteful to not
make use of them. Our setting investigates the relevance of different attributes for
social preferences. However, the general idea can be applied to any type of choice
between multi-attribute options such as consumer decisions, where options differ in
price and brand attributes. Also, in these kinds of decisions response time data and
click positions provide additional information about people’s preferences and can be
used to improve the predictive power. Process data can enhance the analysis of the
decision by providing additional evidence that can be economically relevant. For
example, response times can provide information about the intuitiveness or
difficulty of a decision, and the click position can deliver evidence of potential
motives for a decision in addition to the decision itself.
Acknowledgments We would like to thank Dominik Bauer, David Dohmen, Fabian Dvorak, David
Grammling, Thomas Hattenbach, Jan Hausfeld, Konstantin Hesler, Katrin Schmelz, and Irenaeus Wolf
Table 5 Classification based on both response time and click position
Primary items Secondary items
Individualistic Prosocial Individualistic Prosocial
Individualistic (63) 44 19 43 20
Prosocial (68) 19 49 20 48
Response time and click position: cheap indicators of… 121
123
for helpful comments and discussions. The authors gratefully acknowledge financial support from the
German Research Foundation (DFG) through research unit FOR 1882 ‘‘Psychoeconomics’’.
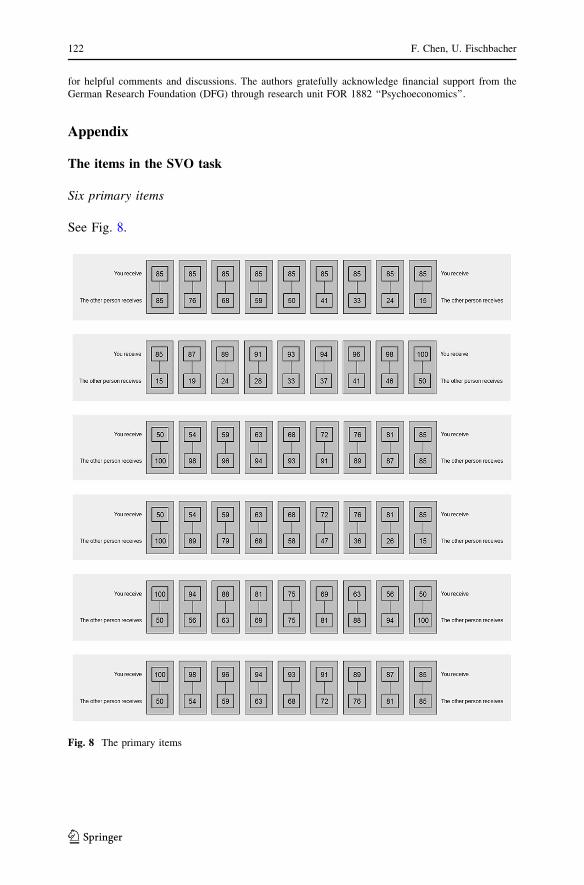
Appendix
The items in the SVO task
Six primary items
See Fig. 8.
Fig. 8 The primary items
122 F. Chen, U. Fischbacher
123

Nine secondary items
See Fig. 9.
Fig. 9 The secondary items
Response time and click position: cheap indicators of… 123
123

Distributions of response times and the common logarithm of responsetimes
Distributions of response times
See Fig. 10.
Distributions of the common logarithm of response times
See Fig. 11.
Fig. 10 Distributions of response times in the primary and secondary items
Fig. 11 Distributions of the common logarithm of response times in the primary and secondary items
124 F. Chen, U. Fischbacher
123

Compare the explanatory power of response time and click position on SVOangle
See Table 6.
References
Achtziger, A., & Alos-Ferrer, C. (2014). Fast or rational? A response-times study of Bayesian updating.
Management Science, 60(4), 923–938.
Ackermann, K. A., Fleiß, J., & Murphy, R. O. (2016). Reciprocity as an individual difference. Journal of
Conflict Resolution, 60(2), 340–367.
Brocas, I., Carrillo, J. D., Wang, S. W., & Camerer, C. F. (2014). Imperfect choice or imperfect attention?
Understanding strategic thinking in private information games. Review of Economic Studies, 81(3),
944–970.
Chen, F., & Fischbacher, U. (2015). Cognitive processes of distributional preferences: A response time
study. TWI Working Paper.
Evans, A. M., Dillon, K. D., & Rand, D. G. (2015). Fast but not intuitive, slow but not reflective: Decision
conflict drives reaction times in social dilemmas. Journal of Experimental Psychology: General,
144(5), 951–966.
Fiedler, S., Glockner, A., Nicklisch, A., & Dickert, S. (2013). Social value orientation and information
search in social dilemmas: An eye-tracking analysis. Organizational Behavior and Human Decision
Processes, 120(2), 272–284.
Fischbacher, U. (2007). z-Tree: Zurich toolbox for ready-made economic experiments. Experimental
Economics, 10(2), 171–178.
Greiner, B. (2015). Subject pool recruitment procedures: Organizing experiments with ORSEE. Journal
of the Economic Science Association, 1(1), 114–125.
Guo, F., Li, L., & Faloutsos, C. (2009). Tailoring click models to user goals. Paper read at Proceedings of
the 2009 workshop on Web Search Click Data.
Hutcherson, C. A., Bushong, B., & Rangel, A. (2015). A neurocomputational model of altruistic choice
and its implications. Neuron, 87(2), 451–462.
Table 6 OLS regressions of response time and click position information on SVO angle
Primary items Secondary items
(1) (2) (3) (4) (5) (6)
ALRT 38.792*** 37.040*** 35.431*** 33.771***
(5.188) (5.058) (4.819) (4.768)
Number of clicks on
the other’s payoff
1.725*** 1.360*** 1.023*** 0.738**
(0.521) (0.442) (0.340) (0.292)
Constant -12.821*** 18.763*** -13.783*** -6.242 18.789*** -7.218*
(4.762) (1.514) (4.624) (3.971) (1.578) (3.909)
R2 0.302 0.078 0.350 0.295 0.066 0.329
Adj. R2 0.297 0.071 0.340 0.290 0.058 0.318
Num. obs. 131 131 131 131 131 131
This analysis does not include the competitive subject. The dependent variable is the SVO angle
ALRT is the average logarithm of response time for the subject. Number of clicks on the other’s payoff is
how many times the subject clicked on the other’s payoff
*** p\ 0.01, ** p\ 0.05, * p\ 0.1
Response time and click position: cheap indicators of… 125
123
Jiang, T., Potters, J., & Funaki, Y. (2016). Eye tracking social preferences. Journal of Behavioral
Decision Making, 29, 157–168.
Kieslich, P. J., & Hilbig, B. E. (2014). Cognitive conflict in social dilemmas: An analysis of response
dynamics. Judgment & Decision Making, 9(6), 510–522.
Koop, G. J., & Johnson, J. G. (2011). Response dynamics: A new window on the decision process.
Judgment & Decision Making, 6(8), 750–758.
Krajbich, I., Armel, C., & Rangel, A. (2010). Visual fixations and the computation and comparison of
value in simple choice. Nature Neuroscience, 13(10), 1292–1298.
Krajbich, I., Bartling, B., Hare, T., & Fehr, E. (2015). Rethinking fast and slow based on a critique of
reaction-time reverse inference. Nature Communications, 6, 7455.
Krajbich, I., Oud, B., & Fehr, E. (2014). Benefits of neuroeconomic modeling: new policy interventions
and predictors of preference. American Economic Review, 104(5), 501–506.
Liebrand, W. B. G., & McClintock, C. G. (1988). The ring measure of social values: A computerized
procedure for assessing individual differences in information processing and social value
orientation. European Journal of Personality, 2(3), 217–230.
Liu, J., Dolan, P., & Pedersen, E. R. (2010). Personalized news recommendation based on click behavior.
Paper read at Proceedings of the 15th international conference on intelligent user interfaces.
Murphy, R. O., Ackermann, K. A., & Handgraaf, M. J. J. (2011). Measuring social value orientation.
Judgment & Decision Making, 6(8), 771–781.
Payne, J. W., Bettman, J. R., & Johnson, E. J. (1993). The Adaptive Decision Maker. New York:
Cambridge University Press.
Piovesan, M., & Wengstrom, E. (2009). Fast or fair? A study of response times. Economics Letters,
105(2), 193–196.
Rand, D. G., Greene, J. D., & Nowak, M. A. (2012). Spontaneous giving and calculated greed. Nature,
489(7416), 427–430.
Reutskaja, E., Nagel, R., Camerer, C. F., & Rangel, A. (2011). Search dynamics in consumer choice
under time pressure: An eye-tracking study. American Economic Review, 101(2), 900–926.
Rubinstein, A. (2007). Instinctive and cognitive reasoning: A study of response times. The Economic
Journal, 117(523), 1243–1259.
Schulz, J. F., Fischbacher, U., Thoni, C., & Utikal, V. (2014). Affect and fairness: Dictator games under
cognitive load. Journal of Economic Psychology, 41, 77–87.
Smith, A., Bernheim, B. D., Camerer, C. F., & Rangel, A. (2014). Neural activity reveals preferences
without choices. American Economic Journal: Microeconomics, 6(2), 1–36.
Spiliopoulos, L., & Ortmann, A. (2015). The BCD of response time analysis in experimental economics.
Working Paper. SSRN 2401325.
Spivey, M. J., Grosjean, M., & Knoblich, G. (2005). Continuous attraction toward phonological
competitors. Proceedings of the National Academy of Sciences of the United States of America,
102(29), 10393–10398.
Wang, Joseph Tao-Yi, Spezio, Michael, & Camerer, Colin F. (2010). Pinocchio’s pupil: Using
eyetracking and pupil dilation to understand truth telling and deception in sender-receiver games.
American Economic Review, 100(3), 984–1007.
126 F. Chen, U. Fischbacher
123