responses of riverbed particles to geomorphologic ... · the relationship between sedimentary...
TRANSCRIPT
March, 2018 Journal of Resources and Ecology Vol. 9 No.2
Received: 2017-09-25 Accepted: 2017-12-19 Foundation: National Natural Science Foundation of China (41371036; 41671004) *Corresponding author: SHI Changxing, E-mail: [email protected]
Citation: GU Zhenkui, SHI Changxing, YANG Hui. 2018. Responses of Riverbed Particles to Geomorphologic Processes in Aeolian-Fluvial Action Area: A Case Study of the Heilaigou Basin in Inner Mongolia of China. Journal of Resources and Ecology, 9(2):191–202.
J. Resour. Ecol. 2018 9(2) 191-202 DOI: 10.5814/j.issn.1674-764x.2018.02.009 www.jorae.cn
Responses of Riverbed Particles to Geomorphologic Processes in Aeolian-Fluvial Action Area: A Case Study of the Heilaigou Basin in Inner Mongolia of China
GU Zhenkui1, 2, SHI Changxing1, *, YANG Hui3
1. Key Laboratory of Water Cycle and Related Land Surface Processes, Institute of Geographic Sciences and Natural Resources Research, Chinese Academy of Sciences, Beijing 100101, China
2. University of Chinese Academy of Sciences, Beijing 100049, China 3. Hebei University of Water Resources and Electric Engineering, Cangzhou, Hebei 061000, China
Abstract: The Heilaigou basin, located in the Inner Mongolia of China, is predominantly influenced by the ae-olian-fluvial actions, with complicated sediment transport conditions on the mainstream riverbed. In order to identify the relationship between sedimentary particles and geomorphic processes, mechanisms for the formation of char-acteristics of grain size composition were investigated by analyzing grain size parameters and external dynamic geomorphologic features. Firstly, the grain size parameters of the riverbed, stream power, maximum grain size of the wind-blown particles and HI values of the mainstream channel were calculated and analyzed, and they were used to establish multiple regression functions of grain size parameters in order to determine the effects of wind and river actions on particles. The results show that sediments in different reaches are formed in different environments: the upper stream is controlled by fluvial and aeolian processes; the sorting properties of riverbed sediments in the middle stream are worse than those in the upper stream since they are affected mainly by fluvial processes as in-dicated by the larger stream power there; and the particles on the downstream riverbed are likely contributed by the Kubuqi Desert. The size of particles on the riverbed depends on the hydrodynamic conditions, but is not signifi-cantly associated with the evolution of landform. Sorting is significantly related to both the hydrodynamic conditions and wind actions. Riverbed deposits brought in by winds likely become finer from the lower to the upper reaches, which are not coarser than 0.88. Generally speaking, the stream power has a major effect on sedimentation characteristics of the riverbed, followed by wind power.
Key words: arroyo; riverbed; grain size; aeolian-fluvial action; HI
1 Introduction
The characteristic of sediment particles is part of the basic properties of sediments. Indexes of natural particulate matter, such as the arrangement structure, grain size and chemical composition, are usually associated with its depositional environment due to the influences of factors, including mineral crystallization and combination, weathering char-acteristics, transportation medium and dynamic mechanism
and bedrock features, and have been one of the basic re-search subjects in sedimentology and environmental sci-ences (Tian and Cheng, 2009; Rowan et al., 2012; Sujatha and Singarasubramanian, 2013; Yasir et al., 2015; Guan et al., 2016). At present, grain size is an effective means to determine the sedimentary environment, explain environ-ment evolution and understand regional and global changes because it contains important information and can be meas-ured quickly. It has been extensively used in the analyses of

192 Journal of Resources and Ecology Vol. 9 No. 2, 2018
loess, desert, river, lake, and ocean sediments and sedimen-tary dynamics (An et al., 1991; Watson et al., 2013; Jia et al., 2016; Liu et al., 2016; Diyabalanage et al., 2017). There are several methods of describing grain size, such as grain size parameters and particle size distribution curves, which have been used not only to analyze the sedimentary envi-ronment, transportation and deposition processes (Visher, 1969; Prins et al., 2000; Zheng et al., 2008; Okeyode and Jibiri, 2013; Zhang et al., 2015a, 2015b), but also to further explain dynamic mechanisms of the processes (Shepard, 1954; Halls, 1967; Friedman, 1967; Walling et al., 2000; Brown and Pastemack, 2004; Opreanu et al., 2007; Remo et al., 2016; Kanhaiya et al., 2017). However, most of the pre-vious studies of sedimentary particles focused on sediments in settings with a single transportation medium. By contrast, formation and transport mechanisms of sediments in ae-olian-fluvial action areas are more complicated. The Heilai-
Heilaigou Arroyo, one of the ten arroyo-type tributaries of the Yellow River in Inner Mongolia of China (Yang and Shi, 2017), is located in a wind and water interactive-erosion region (Liu et al., 2005; Shi et al., 2016). Some scholars have studied the transport mechanism of sediments and the amount of mud flowing into the Yellow River (e.g. Yao et al., 2016; Lin et al., 2014). However, the coupling relation between particles and aeolian-fluvial actions has not been explored, and the major formation dynamic of sediments in the channel is unclear. This study aims to identify the main forces in the complex sedimentary environment of the ar-royo and the effects of aeolian and fluvial actions on sedi-ments.
2 Study site
The Heilaigou basin is located in the administrative region of Dalad Banner of Ordos in Inner Mongolia of China (Fig. 1),
Fig. 1 Study area and sediment sampling sites. A: the Heilaigou basin; B: Sand drift potentials calculated using meteorological data recorded at Dalad Banner (a), Baotou (b) and Haggin Banner (c). In this figure, DP is the sand drift potential, RDP is the resultant drift potential, RDD is the resultant drift direction and VU is the vector unit (Fryberger and Dean, 1979; Al-Awadhi et al., 2005).

GU Zhenkui, et al: Responses of Riverbed Particles to Geomorphologic Processes in Aeolian-Fluvial Action Area 193
with a population density of about 14 people per square kilometer. It covers an area of about 900 km2 controlled by a continental monsoon climate with an average annual tem-
perature of 6 ℃ and an average annual precipitation of
about 350 mm. Altitude of the basin is between 1,000 m in the north and 1,600m in the south. It is in a mountain-basin coupling zone, where the southern hilly region lies in the uplift zone in northern Ordos-massif, while the downstream plain belongs to Hetao Basin (Teng et al., 2008, 2010). In addition, under the constant control of stable continental environments since the Paleozoic era, the tectonic features within the region are relatively simple. The southern hill is mainly covered by chestnut soil and the widely exposed substrata including yellow-green or purple-red shale, sand-stone and conglomerate, which have a loose structure and are prone to weathering. The middle part of the basin is the Kubuqi Desert, mainly dominated by active sand dunes and partly by fixed ones. In its lower reaches, the river flows on its alluvial fan and the alluvial plain of the Yellow River, where there are irrigation-silted soil, saline soil and alkaline soil, with vegetation coverage higher than that of the south-ern basin. Among the rest, erosion in the southern basin is the most serious, with the actions of wind and water alter-nating with and enhancing each other throughout the year. Rainfall concentrates in July and August, accounting for about 70 percent of the annual total and generating high floods, through which the river discharges an average of about 3.67 million tons of sediment annually. Surface runoff is mainly generated by precipitation (Shi et al., 2016), so the river stays dry during the dry seasons with strong winds, especially in spring. Human activities are carried out mostly in the periphery of the desert and the hilly region in the river basin, which focus primarily on agricultural and pastoral practices (Song and Zhang, 2007).
3 Materials and methods
3.1 Characteristics of grain size 3.1.1 Sample collection and treatment Sediment samples were collected from the mainstream channel of the Heilaigou basin in November, 2015 when the arroyo was dry and exposed. Several representative samples, including riverbed and floodplain ones, were collected at each of the nine sites along the channel. Firstly, particles larger than 2 mm were separated using sieves. Secondly, 0.3 to 0. 5 g of particles smaller than 2 mm were applied, in turn, with hydrogen peroxide (H2O2) and hydrochloric acid (HCl) to remove the organic matter and calcium carbonate (Ca-CO3), followed by immersion in the distilled water for 12 hours. Then, the upper water was removed to get rid of strong flocculation ions like Ca2+ and H+. Afterwards, an
amount of 0.05 mol/L sodium pyrophosphate was added as the dispersion agent into beakers that were shaken for an appropriate period of time using the ultrasonic oscillation instrument (Chen et al., 2013; Liu et al., 2016). Finally, the Mastersizer 2000 made by Malvern in the United Kingdom was used to measure particles from 0.02 to 2000 µm. 3.1.2 Calculation of grain size parameters The Moment Method was used to calculate grain size pa-rameters (Table 1), which can reveal more comprehensive information compared with the Graph Method (Folk and Ward, 1957), because all grain sizes are involved in the op-eration (Blott and Pye, 2001).
3.2 Analysis of landform and sedimentary environment 3.2.1 HI values along the mainstream With multiple landform units and in a wind-water ero-sion-prone area, the Heilaigou basin has a high spatial vari-ation of conditions for erosion and sediment delivery. To quantify the surface erosion conditions, hypsometric inte-gral (HI) was utilized (Strahler, 1952, 1957; Singh et al., 2008; Guo et al., 2015). Within the range of 0–1, the higher the HI value is, the larger the volume of the undisturbed geological body; the lower the HI value, the smaller the volume of the geological body. The best conditions of ero-sion appear while the HI value ranges from about 0.35 to 0.6 because a catchment with an HI value of 0.35 - 0.6 usu-ally has a higher relief and a higher drainage density (Pike and Wilson, 1971; Singh et al., 2008). HI value can be cal-culated by the following formula:
mean min max min( ) / ( )HI H H H H (1)
where Hmean, Hmax and Hmin are, respectively, the mean, minimum and maximal elevations of a basin (Pike and Wil-son, 1971; Sigh et al., 2008). In this study, the distribution of HI in the Heilaigou basin was analyzed on DEM using a circle window with a diameter of 10 km in ArcGIS 9.3. This spatial analysis scale can cover the areas near the main-stream, which are the main sources of channel bed sediments. 3.2.2 Environmentally sensitive components (ESCs) of grain size ESCs of grain size are a simple indicator in the analysis of its characteristics. A “grain size vs. standard deviation” method was used to extract ESCs (e.g. Fan et al., 2011; Zhang et al., 2014), which calculated the standard deviation of each grain size range in a sample group and treated the grain size ranges of maximum parts as environmentally sen-sitive factors, indicating the changes and properties of the sedimentary environment and representing certain kinds of dynamic actions. For instance, if the standard deviation values in a certain grain size range are large, the dynamic environment of particles in this range is spatially and

194 Journal of Resources and Ecology Vol. 9 No. 2, 2018
Table 1 Calculation and classification of grain size parameters (McManus, 1988; Blott and Pye, 2001)
Mean Standard deviation
( ) /100iiMz f m 1/22
( )[ ]iiSd f m Mz
Values Qualitative descriptions Values Qualitative descriptions
<0.35 Very well sorted
0.35 to 0.50 Well sorted
0.50 to 0.71 Moderately well sorted
0.71 to 1.00 Moderately sorted
1.00 to 2.00 Poorly sorted
2.00 to 4.00 Very poorly sorted
<–1
–1~4
4~8
>8
Gravel Sand Silt Clay
>4.00 Extremely poorly sorted
Skewness Kurtosis
3 3( ) /100i iSk f m Mz Sd 4 4( ) /100i iKu f m Mz Sd
Values Qualitative descriptions Values Qualitative descriptions
<0.72 Extremely leptokurtic
0.72 ~ 1.03 Very leptokurtic
1.03 ~ 1.42 Mesokurtic
1.42 ~ 2.75 platykurtic
2.75 ~ 4.5 Very Platykurtic
<–1.50 –1.50 ~ –0.33 –0.33 ~ 0.33 0.33 ~ 1.50 >1.50
Extremely negative skewness Negative skewness Near symmetry Positive skewness Extremely positive skewness
>4.5 Extremely platykurtic
fi is the frequency percentage of each group and mi is the median value of each group; = –log2D, where D is the grain size in millimeter.
temporarily variable (An et al., 1991; Sun et al., 2003; Xiao and Li, 2005; Xiao et al., 2006; Fan et al., 2011; Zhang et al., 2014). The ranges of grain size distribution in different environments were collected and compared with the ex-tracted ESCs so as to determine the effect of wind on sedi-ment particles.
3.3 Dynamic characteristics of channel sedimentation 3.3.1 Acquisition of stream power The stream power per unit length was defined as (Font et al.,
2010): Qs (2)
where is the specific weight of water (9800 N/m3) and s
is the slope of the water surface, which is generally ap-proximated as the slope of the channel bed. The stream dis-charge and channel slope were obtained using the Tan-DEM-X DEM (http://eoweb.dlr.de) with a 30 m spatial reso-lution and a higher vertical precision of about 3.2 m (Avtar et al., 2015; Dong et al., 2015; Du et al., 2015). The pre-cipitation data are the records at 10 meteorological stations around the basin during the last thirty years (http:// data.cma.cn/), with the annual rainfall being extracted from the spatial interpolation surface of rainfall (Fig. 2). Stream discharge along the channel was calculated as:
11 1
1 1( )i ii i i
Q qcA
cQ q QA A
(3)
where Q1, A1 and q1 represent, respectively, the discharge, confluence area, and annual rainfall near the river source, Qi
and qi are the discharge and rainfall at point i, (AiAi1)qi is the approximate discharge generated by added confluence
areas at point i, Qi1 is the discharge at point i1 and c is the runoff coefficient. As there are not hydrologic records in the Heilaigou basin, the runoff coefficient was identified as the average (0.02) of those of nearby basins, the Xiliugou and the Maobula (Shi et al., 2016; Yao et al., 2016). 3.3.2 Ranges of particle size affected by aeolian actions As winds have the highest speed in spring and deliver the maximum amount of grains, the size of particles at incipient motion in winds was analyzed. A number of factors account for the incipient motion of particles. In order to analyze par-ticle transportation over a long distance, a simple equation was used (Bagnold, 1941):
* ( ) /pp g gA gu d (4)
where u* is the incipient motion velocity of winds, A is the empirical constant (0.09–0.11) and is assigned 0.1 as usual
in this study, p is the particle density that is usually about

GU Zhenkui, et al: Responses of Riverbed Particles to Geomorphologic Processes in Aeolian-Fluvial Action Area 195
Fig.2 Stream power acquisition process
2.65 g·cm–3; g is the air density that is usually about 1.29×10⁻³ g·cm–3 and dp is the size of particles at incipient motion (Bagnold, 1941; Qi et al., 2001). The near surface wind velocity (the height of 2 m) was converted from the wind velocity measured at the height of 10 m at meteoro-logical stations according to the empirical formula, u10 = 1.30 u2 (Ma et al., 2013), and the near surface velocity was spatially interpolated by using the Inverse Distance Weighted (IDW) method.
4 Results
4.1 Variations of grain size parameters along the channel
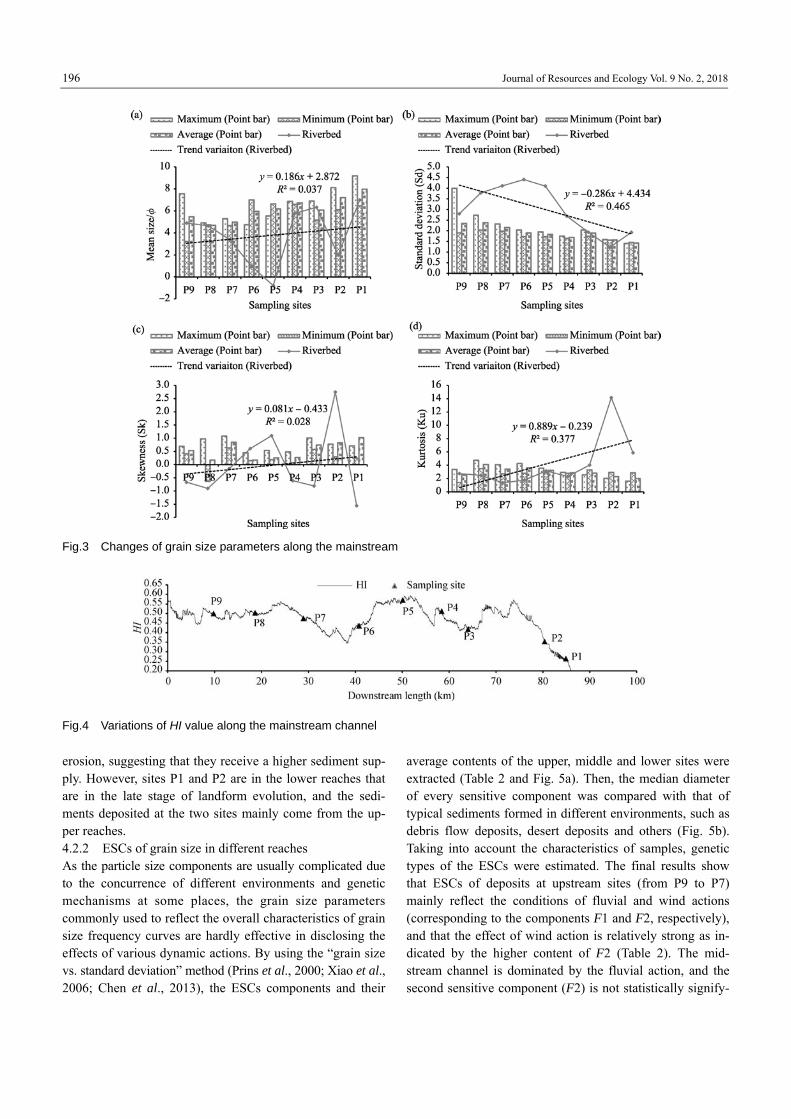
The commonly used grain size parameters include mean size (Mz), standard deviation (Sd), skewness (Sk) and kurto-sis (Ku) calculated using formulas in Table 1. They are comprehensive reflections of grain size characteristics of sediment sources and quantitative indicators of sedimentary environment. It is clear that the mean size of riverbed sedi-ments increases downstream from sites P9 to P5 and be-comes finer in the lower reaches except for P2, reflecting that the mean energy of the flows in upper reaches increases downstream (Fig. 3a). At sampling sites P2, P5, P6 and P7, the grain size of riverbed sediments is coarser than that of point bar sediments. As for sorting features, the standard deviations of both riverbed and point bar sediments decrease to “1”, suggesting that sediments tend to be gradually better sorted downstream (Fig. 3b). However, compared with point bar sediments, riverbed sediments of most sampling sites are poorly sorted, especially at sites P1, P4, P5, P6, P7 and P8. The skewness was used to represent the asymmetry of a grain size frequency curve. Along the Heilaigou Arroyo, the skewness of riverbed sediments increases downstream, as
shown by the linear relation in Fig. 3c, where the grain size frequency curves at the upper five sites (from P9 to P5) change from negatively biased through nearly symmetric to positively biased, with those at the lower sites being mainly negatively biased apart from P2. The skewness values of riverbed sediments at most sampling sites are different from those of point bar and have a large variation range. In con-trast, kurtosis values of riverbed sediments do not vary con-siderably but also grow downstream (Fig. 3d), suggesting that the frequency distribution curves becomes increasingly flatter. The kurtosis gradually decreases to approximately 1 from P9 to P7 (or P6), revealing that frequency distribution curves change from a platykurtic to a nearly normal distri-bution.
4.2 Landform and sedimentary environment of the riverbed particles
4.2.1 The influence of HI value on grain size parameters The HI value can quantitatively indicate the erosion evolu-tion of geomorphic bodies (Strahler, 1952, 1957; Pike and Wilson, 1971; Sharma and Tiwari, 2009). In this paper, the spatial distribution of HI values in the basin was analyzed using a window with a diameter of 10 km and the HI values along the mainstream were extracted (Fig. 4). The HI value at any point in the channel is related to the geomorphic ero-sion condition within a certain space. As mentioned above, the erosion is most intense when HI = 0.35~0.6. Intensive erosion means that there will be a large input of sediments from the slopes to the mainstream channel and that these particles may not be sorted well. When HI<0.35 or HI>0.6, surface erosion becomes weak and fewer particles are de-livered to the channel, which may also have an effect on grain size characteristics. Fig. 4 shows that most reaches (P3 to P9) of the mainstream channel are in regions of active
196 Journal of Resources and Ecology Vol. 9 No. 2, 2018
Fig.3 Changes of grain size parameters along the mainstream
Fig.4 Variations of HI value along the mainstream channel
erosion, suggesting that they receive a higher sediment sup-ply. However, sites P1 and P2 are in the lower reaches that are in the late stage of landform evolution, and the sedi-ments deposited at the two sites mainly come from the up-per reaches. 4.2.2 ESCs of grain size in different reaches As the particle size components are usually complicated due to the concurrence of different environments and genetic mechanisms at some places, the grain size parameters commonly used to reflect the overall characteristics of grain size frequency curves are hardly effective in disclosing the effects of various dynamic actions. By using the “grain size vs. standard deviation” method (Prins et al., 2000; Xiao et al., 2006; Chen et al., 2013), the ESCs components and their
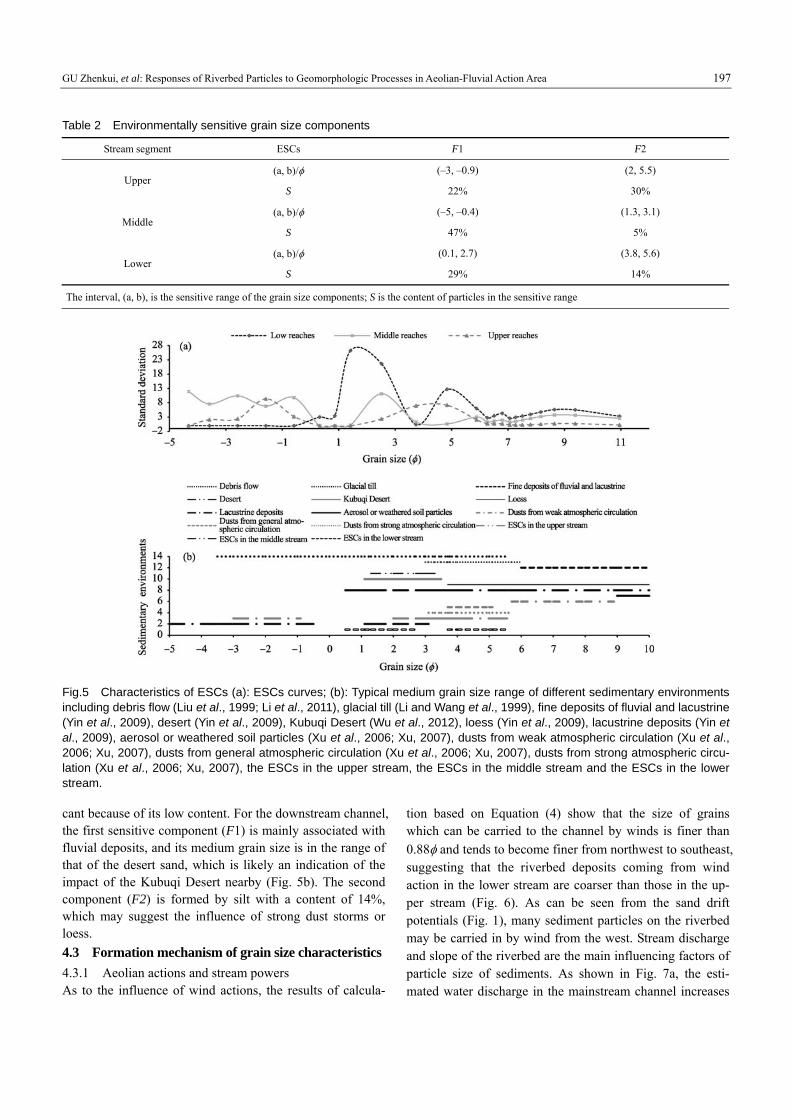
average contents of the upper, middle and lower sites were extracted (Table 2 and Fig. 5a). Then, the median diameter of every sensitive component was compared with that of typical sediments formed in different environments, such as debris flow deposits, desert deposits and others (Fig. 5b). Taking into account the characteristics of samples, genetic types of the ESCs were estimated. The final results show that ESCs of deposits at upstream sites (from P9 to P7) mainly reflect the conditions of fluvial and wind actions (corresponding to the components F1 and F2, respectively), and that the effect of wind action is relatively strong as in-dicated by the higher content of F2 (Table 2). The mid-stream channel is dominated by the fluvial action, and the second sensitive component (F2) is not statistically signify-
GU Zhenkui, et al: Responses of Riverbed Particles to Geomorphologic Processes in Aeolian-Fluvial Action Area 197
Table 2 Environmentally sensitive grain size components
Stream segment ESCs F1 F2
(a, b)/ (–3, –0.9) (2, 5.5) Upper
S 22% 30%
(a, b)/ (–5, –0.4) (1.3, 3.1) Middle
S 47% 5%
(a, b)/ (0.1, 2.7) (3.8, 5.6) Lower
S 29% 14%
The interval, (a, b), is the sensitive range of the grain size components; S is the content of particles in the sensitive range
Fig.5 Characteristics of ESCs (a): ESCs curves; (b): Typical medium grain size range of different sedimentary environments including debris flow (Liu et al., 1999; Li et al., 2011), glacial till (Li and Wang et al., 1999), fine deposits of fluvial and lacustrine (Yin et al., 2009), desert (Yin et al., 2009), Kubuqi Desert (Wu et al., 2012), loess (Yin et al., 2009), lacustrine deposits (Yin et al., 2009), aerosol or weathered soil particles (Xu et al., 2006; Xu, 2007), dusts from weak atmospheric circulation (Xu et al., 2006; Xu, 2007), dusts from general atmospheric circulation (Xu et al., 2006; Xu, 2007), dusts from strong atmospheric circu-lation (Xu et al., 2006; Xu, 2007), the ESCs in the upper stream, the ESCs in the middle stream and the ESCs in the lower stream.
cant because of its low content. For the downstream channel, the first sensitive component (F1) is mainly associated with fluvial deposits, and its medium grain size is in the range of that of the desert sand, which is likely an indication of the impact of the Kubuqi Desert nearby (Fig. 5b). The second component (F2) is formed by silt with a content of 14%, which may suggest the influence of strong dust storms or loess.
4.3 Formation mechanism of grain size characteristics 4.3.1 Aeolian actions and stream powers As to the influence of wind actions, the results of calcula-
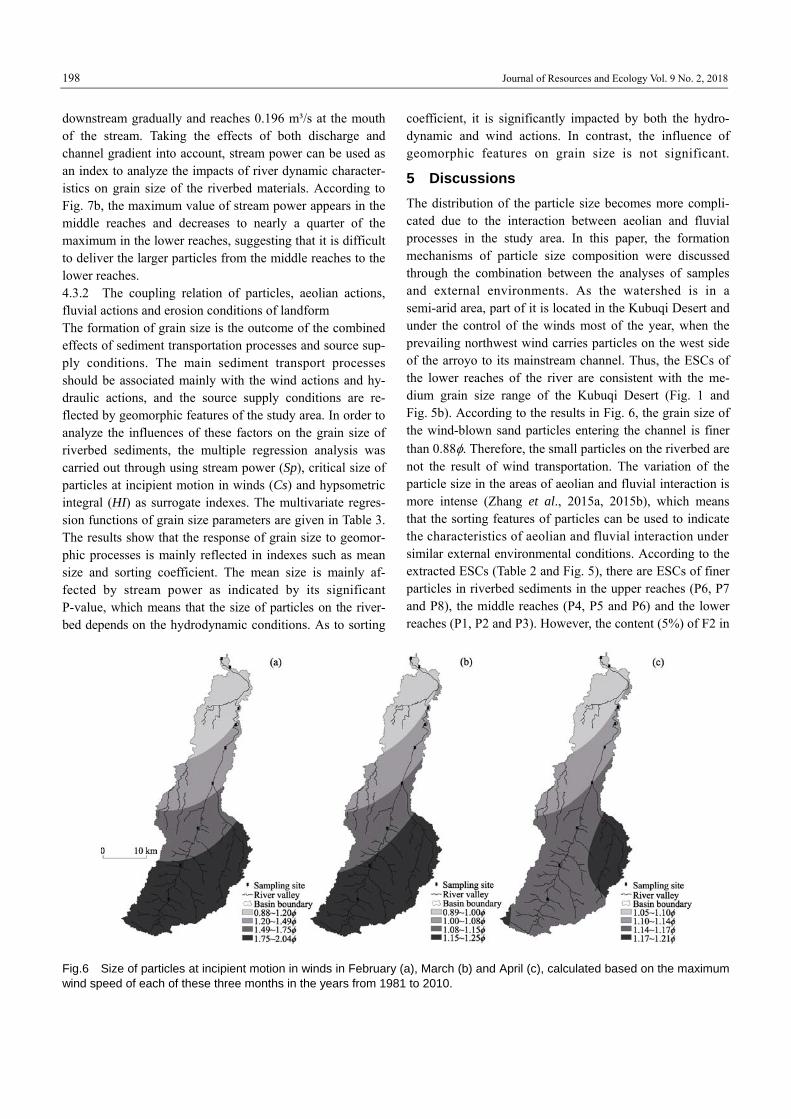
tion based on Equation (4) show that the size of grains which can be carried to the channel by winds is finer than
0.88 and tends to become finer from northwest to southeast, suggesting that the riverbed deposits coming from wind action in the lower stream are coarser than those in the up-per stream (Fig. 6). As can be seen from the sand drift potentials (Fig. 1), many sediment particles on the riverbed may be carried in by wind from the west. Stream discharge and slope of the riverbed are the main influencing factors of particle size of sediments. As shown in Fig. 7a, the esti-mated water discharge in the mainstream channel increases
198 Journal of Resources and Ecology Vol. 9 No. 2, 2018
downstream gradually and reaches 0.196 m³/s at the mouth of the stream. Taking the effects of both discharge and channel gradient into account, stream power can be used as an index to analyze the impacts of river dynamic character-istics on grain size of the riverbed materials. According to Fig. 7b, the maximum value of stream power appears in the middle reaches and decreases to nearly a quarter of the maximum in the lower reaches, suggesting that it is difficult to deliver the larger particles from the middle reaches to the lower reaches. 4.3.2 The coupling relation of particles, aeolian actions, fluvial actions and erosion conditions of landform The formation of grain size is the outcome of the combined effects of sediment transportation processes and source sup-ply conditions. The main sediment transport processes should be associated mainly with the wind actions and hy-draulic actions, and the source supply conditions are re-flected by geomorphic features of the study area. In order to analyze the influences of these factors on the grain size of riverbed sediments, the multiple regression analysis was carried out through using stream power (Sp), critical size of particles at incipient motion in winds (Cs) and hypsometric integral (HI) as surrogate indexes. The multivariate regres-sion functions of grain size parameters are given in Table 3. The results show that the response of grain size to geomor-phic processes is mainly reflected in indexes such as mean size and sorting coefficient. The mean size is mainly af-fected by stream power as indicated by its significant P-value, which means that the size of particles on the river-bed depends on the hydrodynamic conditions. As to sorting
coefficient, it is significantly impacted by both the hydro-dynamic and wind actions. In contrast, the influence of geomorphic features on grain size is not significant.
5 Discussions
The distribution of the particle size becomes more compli-cated due to the interaction between aeolian and fluvial processes in the study area. In this paper, the formation mechanisms of particle size composition were discussed through the combination between the analyses of samples and external environments. As the watershed is in a semi-arid area, part of it is located in the Kubuqi Desert and under the control of the winds most of the year, when the prevailing northwest wind carries particles on the west side of the arroyo to its mainstream channel. Thus, the ESCs of the lower reaches of the river are consistent with the me-dium grain size range of the Kubuqi Desert (Fig. 1 and Fig. 5b). According to the results in Fig. 6, the grain size of the wind-blown sand particles entering the channel is finer than 0.88. Therefore, the small particles on the riverbed are not the result of wind transportation. The variation of the particle size in the areas of aeolian and fluvial interaction is more intense (Zhang et al., 2015a, 2015b), which means that the sorting features of particles can be used to indicate the characteristics of aeolian and fluvial interaction under similar external environmental conditions. According to the extracted ESCs (Table 2 and Fig. 5), there are ESCs of finer particles in riverbed sediments in the upper reaches (P6, P7 and P8), the middle reaches (P4, P5 and P6) and the lower reaches (P1, P2 and P3). However, the content (5%) of F2 in
Fig.6 Size of particles at incipient motion in winds in February (a), March (b) and April (c), calculated based on the maximum wind speed of each of these three months in the years from 1981 to 2010.

GU Zhenkui, et al: Responses of Riverbed Particles to Geomorphologic Processes in Aeolian-Fluvial Action Area 199
Fig.7 Characteristics of water discharge and stream power Table 3 Response functions of grain size parameters to wind, stream and geomorphological conditions
Grain size parameters Regression equation Significance P-value R2
Sp* 0.04
Cs 0.79
Mean size 6.93 2.76 0.34 5.04Mz Sp Cs HI
HI 0.96
0.68
Sp* 0.01
Cs* 0.02
Standard deviation 2.55 8.53 1.03 9.78Sd Sp Cs HI
HI 0.56
0.90
Sp 0.38
Cs 0.22
Skewness 1.22 6.82 0.34 6.13Sk Sp Cs HI
HI 0.92
0.50
Sp 0.83
Cs 0.44
Kurtosis 1.22 17.52 2.04 11.84Ku Sp Cs HI
HI 0.89
0.22
*Significant factor
the middle reaches is significantly less than that in the upper and lower reaches, indicating that fewer aeolian particles deposit in the middle reaches. In contrast, stream power and mean size in the middle reaches are the largest among the three reaches (Fig. 7), and deposits on the riverbed are coarser than those in the beach. These phenomena indicate that the effects of hydrodynamic forces in the middle reaches are significant, and that the effects of the wind are weak. As the wind speed is larger in the lower reaches, a large volume of particles will be transported to the arroyo. The grain size range of ESCs of the downstream reaches passing through the Kubuqi Desert from south to north is the same as the median grain size range of particles in the Kubuqi Desert (Fig. 5), implying that these sediments on the riverbed are affected by the Kubuqi Desert. The mean size of the sediments on the riverbed is in direct proportion to
the stream power (Table 3). The stream power decreases from the middle to the lower reaches (Fig. 7). When the stream power is reduced, particles that are coarser or have a higher specific weight will be deposited, while those being transported downstream will have an improved dimensional sorting (Opreanu et al., 2007). Therefore, the lower reaches are liable to deposition of sediments with a slightly higher degree of sorting. The middle reaches of the arroyo have the highest stream power, so most fine particles are taken away by water flows, leaving coarse particles that are difficult to be transported on the riverbed. Stream power of the upper reaches gradually increases along the channel, resulting in the increase of sediment carrying capacity downstream and a same trend of the mean size. However, the sorting be-comes poor downstream in the upper reaches, probably caused by the continuous import of sediments of different

200 Journal of Resources and Ecology Vol. 9 No. 2, 2018
grain sizes from tributaries on both sides of the mainstream. The grain size parameters of P2 are significantly different from those of all the sampling sites, probably resulting from the coarsening effect of the scour by flows released from a nearby dam (Fig. 1).
6 Conclusions
The sediments in the mainstream riverbed of the Heilaigou basin that is characterized by coupled aeolian-fluvial ero-sion have a very complex grain size composition as dis-closed by their variable size parameters. As a whole, the mainstream riverbed of the basin is characterized by poorly sorted particles with a platy-kurtosis. Characteristics of re-sponses of grain size to geomorphic processes are mainly reflected in the indexes such as mean size and sorting coef-ficient. Size of particles on the riverbed depends on the hy-drodynamic conditions, and both fluvial and aeolian actions have a significant impact on the sorting coefficient of sedi-ments, while the influence of geomorphic features on grain size is insignificant. Moreover, the riverbed deposits brought in by winds are not coarser than 0.88 and will likely become finer from the lower to the upper reaches. Sediments in different reaches are formed in different sedi-mentary environments. The riverbed sediments in the upper stream are controlled by fluvial and wind processes, in which dust inputs by the west winds have a slightly stronger effect according to the analysis of environmentally sensitive grain size components. Sorting properties of the riverbed sediments in the middle stream are worse than those in the upper stream and are affected mainly by fluvial processes, which are characterized by a larger stream power. In the lower stream, the particles brought into the channel by winds are generally coarser than those in the middle and upper reaches and are likely contributed by the Kubuqi De-sert. This segment of riverbed has a relatively low stream power and has been controlled by a relatively stable hydro-dynamic condition.
References
Al-Awadhi J M, Al-Helal A, Al-Enezi A. 2005. Sand drift potential in the
desert of Kuwait. Journal of Arid Environments, 63(2): 425–438.
An Z S, Porter S C, Kutzbach J E, et al. 1991. Late quaternary dust flow on
the Chinese Loess Plateau. Catena, 18(2): 125–132.
Avtar R, Yunus A P, Kraines S, et al. 2015. Evaluation of DEM generation
based on interometric SAR using TanDEM-X data in Tokyo. Physics
and Chemistry of the Earth: Parts A/B/C, 83–84: 166–177.
Bagnold R A. 1941. The physics of blown sand and desert dunes. Nature,
18(4): 167–187.
Blott S J, Pye K. 2001. Gradistat: A grain size distribution and statistics
package for the analysis of unconsolidated sediments. Earth Surface
Processes and Landforms, 26(11): 1237–1248.
Brown K L, Pasternack B P. 2004. The geomorphic dynamics and envi-
ronmental history of an upper deltaic floodplain tract in the Sacra-
mento-San Joaquin Delta, California, USA. Earth Surface Processes
and Landforms, 29(10): 1235–1258.
Chen Q, Liu D Y, Chen Y J, et al. 2013. Comparative analysis of
grade-standard deviation method and factors analysis method for envi-
ronment sensitive factor analysis. Earth and Environment, 41(3):
319–324. (in Chinese)
Diyabalanage S, Samarakoon K K, Adikari S B, et al. 2017. Impact of soil
and water conservation measures on soil erosion rate and sediment
yields in a tropical watershed in the Central Highlands of Sri Lanka.
Applied Geography, 79: 103–114.
Dong Y S, Chang H C, Chen W T, et al. 2015. Accuracy assessment of
GDEM, SRTM, and DLR-SRTM in Northeastern China. Geocarto In-
ternational, 30(7): 779–792.
Du Y N, Feng G C, Li Z W, et al. 2015. Generation of high precision DEM
from TerraSAR-X/TanDEM-X. Chinese Journal of Geophysics, 58(9):
3089–3102. (in Chinese)
Fan D J, Qi H Y, Sun X X, et al. 2011. Annual lamination and its sedimen-
tary implications in the Yangtze River delta inferred from high-res-
olution biogenic silica and sensitive grain-size records. Continental
Shelf Research, 31(2): 129-137.
Folk P L, Ward W D. 1957. Brazos River bar: A study in the significance of
grain size parameters. Journal of Sedimentary Petrology, 27(1): 3–26.
Font M, Amorese D, Lagarde J L. 2010. DEM and GIS analysis of the
stream gradient index to evaluate effects of tectonics: The Normandy
intraplate area (NW France). Geomorphology, 119: 172–180.
Friedman G M. 1967. Dynamic processes and statistical parameters com-
pared for size frequency distribution of beach and river sands. Journal
of Sediment Petrology, 37(2): 327–354.
Fryberger S G, Dean G. 1979. Dune forms and wind regime. In: Meckee E
D (ed.). A Study of Global Sand Seas. Washington: U.S. Geological
Survey Professional Paper, 137–169.
Guan H C, Zhu C, Zhu T X, et al. 2016. Grain size, magnetic susceptibility
and geochemical characteristics of the loess in the Chaohu lake basin:
Implications for the origin, palaeoclimatic change and provenance.
Journal of Asian Earth Sciences, 117: 170–183.
Guo J, Wang W, Shi J S. 2015. A quantitative analysis of the stage of geo-
morphologic evolution in Luohe drainage basin, north of Shaanxi
Province. Arid Land Geography, 38(6): 1161–1168. (in Chinese)
Halls J R. 1967. Significance of statistical parameters for distinguishing
sedimentary environments in New South Wales, Australia. Journal of
Sedimentary Petrology, 37(4): 1059–1069.
Jia W, Zhang C, Li S, et al. 2016. Grain size distribution at four develop-
mental stages of crescent dunes in the hinterland of the Taklimakan
Desert, China. Journal of Arid Land, 8(5): 722–733.
Kanhaiya S, Singh B P, Tripathi M, et al. 2017. Lithofacies and parti-
cle-size characteristics of late Quaternary floodplain deposits along the
middle reaches of the Ganga river, central Gange plain, India. Geo-
morphology, 284: 220–228.
Li B, Gao J R, Hu F B. 2011. Granularity parameter of debris flow deposit
in Wanghugou gully, Beijing City. Science of Soil and Water Conserva-
tion, 9(4): 7–10. (in Chinese)
Li C Z and Wang Y Y. 1999. Preliminary exploration on grain characteristic
and discrimination of debris flow deposit, moraine and river and lake
deposit. Journal of Mountain Science, 17(1): 50–54. (in Chinese)

GU Zhenkui, et al: Responses of Riverbed Particles to Geomorphologic Processes in Aeolian-Fluvial Action Area 201
Lin X Z, Guo Y, Hou S Z. 2014. Estimation of sediment discharge of ten
tributaries of Yellow River in Inner-Mongolia. Journal of Sediment Re-
search, (2): 15–20.
Liu M P, Hasi E, Sun Y. 2016. Variation in grain size and morphology of an
inland parabolic dune during the incipient phase of stabilization in the
Hobq Desert, China. Sedimentary Geology, 337: 100–112.
Liu G N, Cui Z J, Wang X H. 1999. Sedimentary macro-structures of debris
flows and their formation mechanism. Geological Review, 41(2):
159–164. (in Chinese)
Liu L Y, Skidomore E, Hasi E, et al. 2005. Dune sand transport as influ-
enced by wind directions, speed and frequencies in the Ordos Plateau,
China. Geomorphology, 67(3–4): 283–297.
Ma Y F, Yan P, Li S Q. 2013. Dynamic process of aeolian-fluvial interac-
tion erosion in the middle reaches of Baerdong River in Ten-Watershed,
Inner Mongolia of China. Journal of Desert Research, 33(4): 990–998.
(in Chinese)
McManus J. 1988. Grain size determination and interpretation. In: Tucker
M (ed.). Techniques in Sedimentology. Blackwell: Oxford, 63–85.
Okeyode I C, Jibiri N N. 2013. Grain size analysis of the sediments from
Ogun River, Southwestern Nigeria. Earth Science Research, 2(1): 43–51.
Opreanu G, Oaie G, Păun F. 2007. The dynamic significance of the grain
size of sediments transported and deposited by the Danube. Geo-Eco-
Marina, 13: 111–119.
Pike R J, Wilson S E. 1971. Elevation-relief ratio, hypsometric integral,
and geomorphic area-altitude analysis. Geological Society of America
Bulletin, 82(4): 1079–1084.
Prins M A, Postma G, Weltje G J. 2000. Controls on the terrigenous sedi-
ment supply to the Arabian Sea during the late Quaternay: The Makran
continental slope. Marine Geology, 169(3): 351–371.
Qi L X, Dong F, Chen Q, et al. 2001. Study on onset-wind-speed of blown
sand. Mechanics in engineering, 23(4): 13–14. (in Chinese).
Remo J W F, Heine R A, Ickes B S. 2016. Particle size distribution of
main-channel-bed sediments along the upper Mississippi River, USA.
Geomorphology, 264:118–131.
Rowan J S, Black S, Franks S W. 2012. Sediment fingerprinting as an
environmental forensics tool explaining cyanobacteria blooms in lakes.
Applied Geography, 32(2): 832–843.
Sharma S, Tiwari K. 2009. Bootsrap based artificial neural network
(BANN) analysis for hierarchical prediction of monthly runoff in Upper
Damodar Valley Catchment. Journal of Hydrology, 374(3–4): 209–222.
Shepard F P. 1954. Nomenclature based on sand-silt-clay ratios. Journal of
Sedimentary Petrology, 24(3): 151–158.
Shi C X, Wang S J, Xu J X, et al. 2016. Mechanisms of Flood-River-
bed-Bank Interaction in Ningxia-Inner Mongolia Reach of the Yellow
River. Beijing: Science Press. (in Chinese)
Singh O, Sarangi A, Sharma M C. 2008. Hypsometric integral estimation
methods and its relevance on erosion status of north-western lesser Hi-
malayan watershed. Water Resources Management, 22(11): 1545–1560.
Song N P, Zhang F G. 2007. The changing process and mechanism of the
farming-grazing transitional land use pattern in Ordos. Acta Geogra-
phica Sinica, 62(12): 1299–1308. (in Chinese)
Strahler A N. 1952. Hypsometric (area-altitude) analysis of erosional to-
pography. Geological Society of America Bulletin, 63(11): 1117–1141.
Strahler A N. 1957. Quantitative analysis of watershed geomorphology.
Transactions of the American Geophysical Union, 38(6): 913–920.
Sujatha K, Singarasubramanian S R. 2013. Sediment characterization and
depositional processes from the pit samples of Poompuhar, Ambanar
river mouth and Tarangambadi, east coast of Tamilnaduu, India. Inter-
national Journal of Recent Scientific Research, 4(3): 177–184.
Sun Y B, Gao S, Li J. 2003. Preliminary analysis of grain-size populations
with environmentally sensitive terrigenous components in marginal sea
setting. Chinese Science Bulletin, 48(2): 184–187.
Teng J W, Wang F Y, Zhao W Z, et al. 2008. Velocity distribution of upper
crust, undulation of sedimentary formation and crystalline basement
beneath the Ordos basin in North China. Chinese Journal of Geophysics,
51(1): 277–291. (in Chinese)
Teng J W, Wang F Y, Zhao W Z, et al. 2010. Velocity structure of layered
block and deep dynamic process in the lithosphere beneath the Yinshan
Orogenic Belt and Ordos Basin. Chinese Journal of Geophysics, 53(6):
1753–1766. (in Chinese)
Tian M Z and Chen J. 2009. Quaternary Geology and Geomorphology.
Beijing: Geological Publishing House. (in Chinese)
Visher G S. 1969. Grain size distribution and depositional processes. Jour-
nal of Sedimentary Petrology 39(3): 1074–1016.
Walling D E, Owens P N, Waterfall B D, et al. 2000. The particle size
characteristics of fluvial suspended sediment in the Humber and Tweed
catchments, UK. The Science of the Total Environment, 251–252: 205–222.
Watson E B, Pasternack G B, Gray A B, et al. 2013. Particle size charac-
terization of historic sediment deposition from a closed estuarine lagoon,
Central California. Estuarine, Coastal and Shelf Science, 126: 23–33.
Wu X, Hasi E, Du H S, et al. 2012. Grain size distribution of parabolic
dunes on the southern fringe of Hobq Desert. Act Sedimentologica
Sinica, 30(5): 938–942. (in Chinese)
Xiao S B and Li A C. 2005. A study on environmentally sensitive grain size
population in inner shelf of the East China Sea. Acta Sedmentologica
Sinica, 23(1): 123–128. (in Chinese)
Xiao S, Li A, Liu J P, et al. 2006. Coherence between solar activity and the
East Asia winter monsoon variability in the past 8000 years from Yang-
tze River-derived mud in the East China Sea. Palaeogeography, Pa-
laeoclimatol, Palaeoecol, 237(2–4): 293–304.
Xu S J. 2007. Analysis of grain-size populations with environmentally
sensitive components in aeolian deposits and their implications. Journal
of Arid Land Resources and Environment, 21(3): 95–98. (in Chinese)
Xu S J, Pan B T, Gao H S, et al. 2006. Analysis of grain-size populations
with environmentally sensitive components of loess during the last in-
terglacial-glacial cycle and their implications. Acta Pedologica Sinica,
43(2): 183–189. (in Chinese)
Yao H, Shi C, Shao W, et al. 2016. Changes and influencing factors of the
sediment load in the Xiliugou basin of the upper Yellow River, China.
Catena, 142: 1–10.
Yasir M A, Brian G J, Errol M. 2015. Spatial distribution of sediment parti-
cles and trace element pollution within Gunnamatta bay, Port Hacking,
NSW, Australia. Regional Studies in Marine Science, 2: 124–131.
Yang H, Shi C X. The fractal characteristics of drainage networks and
erosion evolution stages of ten kongduis in the upper reaches of the
Yellow River, China. Journal of Resources and Ecology, 2017, 8(2):
165–173.
Yin Z Q, Qin X G, Wu J S, et al. 2009. The multimodal grain-size distribu-
tion characteristics of loess, desert, lake and river sediments in some
areas of Northern China. Act Sedmentologica Sinica, 27(2): 343–351.

202 Journal of Resources and Ecology Vol. 9 No. 2, 2018
(in Chinese)
Zhang L, Chen S L, Pan S Q, et al. 2014. Sediment variability and transport
in the littoral area of the abandoned Yellow River Delta, northern Ji-
angsu. Journal of Geographical Sciences, 24(4): 717–730.
Zhang X, Li Z B, Li P, et al. 2015a. A model to study the grain size com-
ponents of the sediment deposited in aeolian-fluvial interplay erosion
watershed. Sedimentary Geology, 330: 132–140.
Zhang X, Li P, Zhang Y, et al. 2015b. The spatial analysis of sediment in
Dongliugou watershed. Journal of Soil and Water Conservation, 29(1):
75–79. (in Chinese)
Zheng H B, Chen G C, Xie X, et al. 2008. Grain size distribution and dy-
namic control of late quaternary terrigenous sediments in the South
China Sea and their implication for East Asian monsoon evolution.
Quaternary Sciences, 28(3): 414–424. (in Chinese)
风水两相作用区内河床沉积粒度对地貌过程的响应:以内蒙古黑赖沟流域为例
顾畛逵 1, 2,师长兴 1,阳 辉 3
1. 中国科学院地理科学与资源研究所,中国科学院陆地水循环及地表过程重点实验室,北京 100101;
2. 中国科学院大学,北京 100049;
3. 河北水力电力学院,河北 沧州 061000
摘 要:黑赖沟流域位于内蒙古风-水两相交互侵蚀区域,主河道的泥沙输移特征较为复杂。为了分析河道沉积粒度与地貌
过程的关系,文中主要通过探讨粒度参数与外营力特征的关系对沉积粒度的成因机制进行了研究。在分析过程中首先对河床沉积
粒度参数、风成颗粒的最大粒径、河流功率和面积-高程积分值沿河道方向的连续变化值进行了计算,分别对不同河段的外营力
活动特征进行分析,并以此为基础,将粒度参数作为因变量,其余三者作为自变量,建立了多元回归函数。分析结果显示不同河
段外营力对河床沉积物的影响特征不同,其中上游河段河床沉积物主要受径流和风力作用影响;中游河段主要受河流作用影响,
沉积颗粒的分选性最差,沉积颗粒的大小与河流功率关系密切,粗质颗粒难以被搬运到下游河段;下游河段受库布齐沙漠影响的
可能性较大。就河道整体特征来讲,河道两侧地貌的侵蚀演化特征对河道内的沉积颗粒影响不显著,河床沉积物特征主要受河流
和风力作用,其中沉积颗粒的平均粒径主要反映了河流功率的大小,风力作用对沉积颗粒的分选性具有一定影响。河道内的风成
颗粒主要来自流域西部,粒径值不会大于 0.88,其中下游河段内的风成颗粒比上游河段略粗。总而言之,河流作用对河道沉积
粒度特征的影响起主要作用,风力作用次之。
关键词:十大孔兑;河床;粒度;风-水两相;HI 值