responses to the audio broadcasts -
TRANSCRIPT
RESPONSES TO THE AUDIO BROADCASTS OF PREDATOR VOCALIZATIONS BY EIGHT SYMPATRIC PRIMATES IN SURINAME, SOUTH AMERICA
A thesis submitted to Kent State University in partial
fulfillment of the requirements for the degree of Master of Arts
by
Orin J. Neal
August, 2009
Thesis written by Orin J. Neal
B.A., Stony Brook University, 2003 M.A., Kent State University, 2009
Approved by:
__________________________________________ Dr. Marilyn Norconk Advisor
__________________________________________ Dr. Richard Meindl Chair, Department of Anthropology
__________________________________________ Dr. Timothy Moerland Dean, College of Arts and Sciences
ii
TABLE OF CONTENTS
LIST OF FIGURES……………………………………………………………… v LIST OF TABLES……………………………………………………………….. vii ACKNOWLEDGEMENTS……………………………………………………… ix ABSTRACT……………………………………………………………………… 1 INTRODUCTION………………………………………………………………. 2 Predation risk in the neotropics…………………………………………… 4 Predation risk versus predation rate………………………………………. 8 Primate alarm vocalizations………………………………………………. 9 Vigilance………………………………………………………………….. 11 Habitat use………………………………………………………………… 12 Playback studies………………………………………………………….. 13 Hypotheses……………………………………………………………….. 13 METHODS………………………………………………………………………. 16 Study area………………………………………………………………… 16 Study subjects…………………………………………………………….. 17
Alouatta…………………………………………………………… 18 Ateles……………………………………………………………… 18 Cebus……………………………………………………………… 19 Chiropotes………………………………………………………… 20 Pithecia…………………………………………………………… 20 Saguinus………………………………………………………….. 21
Saimiri……………………………………………………………. 21 Predation risk in the study areas………………………………………….. 21 Playback experiments…………………………………………………….. 22 Playback vocalizations……………………………………………. 23 Experiment protocol……………………………………………… 25 Data collection……………………………………………………………. 27 Activity data……………………………………………………… 27 Response data…………………………………………………….. 29 Captive experiments………………………………………………………. 30 Sampling problems………………………………………………………… 32 Statistical analysis…………………………………………………………. 32
iii
RESULTS………………………………………………………………………… 48
Total sample sizes…………………………………………………………. 48 Anti-predator response……………………………………………………. 48 Vigilance behavior………………………………………………… 50 Alarm vocalizations……………………………………………….. 51 General habitat use………………………………………………………… 53 Spatial occupation…………………………………………………. 54 Understory density………………………………………………… 56 Percentages of overstory density from densiometer readings……... 57 Activity patterns…………………………………………………………… 59 Differential alarm and vigilance response by location…………………….. 61 DISCUSSION…………………………………………………………………….. 88
General patterns…………………………………………………………… 88 Predator-sensitive habitat use……………………………………………… 90 Spatial distribution and the selfish herd…………………………… 90 Foliage density, visibility, and refugial areas……………………… 92 Activity patterns…………………………………………………………… 95 Vigilance…………………………………………………………………… 96 Alarm vocalizations………………………………………………………... 98 Learned and reinforced response………………………………………….. 100 Explanations for non-responses……………………………………………. 102 Estimates of predator presence by response data………………………….. 104 Interspecific associations………………………………………………….. 105 CONCLUSION…………………………………………………………………… 106 LIST OF REFERENCES………………………………………………………….. 112
iv
LIST OF FIGURES
2.1 Map of Suriname, South America…...…………………………………… 40 2.2 Satellite image of the main study area at Brownsberg Nature Park…........ 41 2.3 Map of the main study area and locations of playback experiments at
Brownsberg……………………………………………………………….. 42 2.4 Map of the main study area with locations of playback experiments and
other important landmarks at Raleighvallen……..………………………… 43 2.5 Photograph documenting harpy eagle predation on a squirrel monkey....... 44 2.6 Spectral analysis of playback vocalizations………………………………. 45 2.7 Degree of dispersion was quantified by neighbor proximity and
intragroup positioning.……………………………………………………. 46
2.8 Concave spherical densiometer………………………………………........ 46 2.9 Model habitats at Brownsberg Nature Park and Raleighvallen used for
understory density estimates……………………………………………… 47 3.1 Mean vigilance frequencies by species across all intervals.……………… 71 3.2 Mean vigilance frequencies increase when the harpy eagle broadcasts
begin………………………………………………………………………. 72 3.3 Frequency of alarm vocalizations in all species averaged across all
playback intervals......................................................................................... 73 3.4 Dichotomous alarm response data for all species, normalized for
duration of playback intervals……………………..………………………. 74 3.5 Length and width of the area occupied by the species during the
experiments……………………………………………………………....... 75 3.6 Maximum and minimum height occupation for each species………..……. 76 3.7 Relationship between alarm frequency and within group spatial
dispersion………………………………………………………………….. 77
v
3.8 Area of occupation and height differential may influence alarm frequency...................................................................................................... 78
3.9 Species comparison of forest types utilized……………….……………… 80 3.10 Mean vigilance rates decrease with increasing degree of understory
density where 0.5 is most open and 3.0 is most closed understory……….. 81 3.11 Frequency of aerial vigilance in high rainforest, low rainforest,
bamboo patches, liana forest, and swamp forest………………………….. 82 3.12 Frequency of alarm vocalizations in high rainforest, low rainforest,
bamboo patches, liana forest, and swamp forest.…………………………. 82 3.13 Overstory density increases with the introduction of harpy eagle
vocalizations across all species………………………….............................. 83 3.14 Mean aerial vigilance rates decrease with an increase of overstory
density........................................................................................................... 83 3.15 Activity budget by playback interval across species………………………. 84 3.16 Mean alarm frequencies per minute by playback interval (corrected for
duration)………….………………………………………………………… 85 3.17 Overall alarm frequency is higher at Raleighvallen than at Brownsberg
or Hiram College………………………………………............................... 86 3.18 There is no significant difference in rates of aerial vigilance between
populations of C. apella at BNP and Hiram College……………………… 86 3.19 Source scanning frequency is significantly higher in the Hiram College
population of C. apella than at either BNP or RV………………………… 87
vi
LIST OF TABLES
2.1 Size and composition of groups encountered at Brownsberg and Raleighvallen............................................................................................... 34
2.2 The documented primate predators of South America…………….……… 35 2.3 Documented predator presence at Brownsberg and Raleighvallen……….. 36 2.4 Predator sightings at Brownsberg during the 2008 field season…….......... 37 2.5 Protocol for playback experiments…..……………………………………. 38 2.6 Descriptions of forest types at Raleighvallen and Brownsberg...…………. 39 2.7 Ethogram of response behaviors…............................................................... 39 3.1 Total field observation minutes by species….……………………………. 64 3.2 Mean alarm vocalizations per minute emitted during five playback
intervals…………………………………………………………………… 64 3.3 Paired samples t-test output of mean differences of alarm vocalizations
in interval A vs. interval B…………………………................................... 65 3.4 General habitat utilization and intraspecific spatial organization by all
species at Brownsberg and Raleighvallen………………………………… 66 3.5 Paired samples t-test of mean differences of overstory densities in
interval A versus interval B……………………………………………..... 67 3.6 Two-way repeated measures analysis of variance showing very
highly significant differences in alarm frequency by playback interval and park………............................................................................... 67
3.7 Post-hoc pairwise comparisons of park within playback interval…....…… 68 3.8 Post-hoc pairwise comparisons of playback interval at Ralighvallen…….. 69 3.9 Post-hoc pairwise comparisons of playback interval at Brownsberg
and Hiram College………………………………………………………… 69

vii
3.10 Three-way analysis of variance examining differences in howler monkey and brown capuchin alarm frequency at BNP and RV, by species, park and group…………………………………………………… 70
viii
ACKNOWLEDGEMENTS
First, I would like to thank Dr. Marilyn Norconk and the other members of my
committee, Dr. Richard Meindl and Dr. Kimberley Phillips, whose support and advice
were instrumental to the completion of this thesis project. Further, the project was
dependent upon the kindness and assistance of many STINASU staff members, including
Marijem Djosetro, Ramond Finisie, Henki, Rani, and Suni. Also, I received invaluable
advice, field assistance, and moral support from Jackson Frechette, Andrew Ritchie, L.
Tremaine Gregory, Rocky Van Ommeren, Arioene Vreedzaam, Errol Gezius, Iwan
Molgo, Muriel Djaspan, and Valerie Gilbert.
Finally, acknowledgements are due to Stacy Neal and my parents, who motivated
and inspired me throughout this project.
1
ABSTRACT
The selective pressures exerted on primate populations from threat of predation
have led to numerous behavioral and morphological adaptations that allow for pre-
emptive detection and evasion of predators. Predators evolve counterstrategies, and an
arms race is born. Anti-predator strategies are costly, in the sense that employing them
may divert energy from activities more directly related to fitness, such foraging or
mating. Therefore, one would expect higher frequencies of more severe anti-predator
behaviors to be expressed by primates who have regular interactions with potential
predators, because temporal allocation of those behaviors would be reinforced.
A snapshot of natural primate populations reveals that predation is often a
substantial source of mortality. Here I investigate the anti-predator strategies of eight
sympatric primates in Suriname, South America, to examine how astute wild primates are
at detecting predators by only audio cues, how strategies vary by taxa, and whether these
strategies vary depending on level or perception of risk within a location. The results
suggest that neotropical primates can identify predators as such by vocalizations alone,
that anti-predator strategies are highly variable, and that some degree of experience and
reinforcement is required for an appropriate level of response behavior. Further, primates
in the neotropics appear to evaluate the relative safety of their surroundings and make
decisions based on them when confronted with the perceived presence of predators.
CHAPTER ONE
INTRODUCTION
“During any given day, an animal may fail to obtain a meal and go hungry, or it may fail to obtain matings and thus realize no reproductive success, but in the long term, the day’s shortcomings may have minimal influence on lifetime fitness. Few failures, however, are as unforgiving as the failure to avoid a predator: being killed greatly decreases future fitness.”
-Lima and Dill, 1990
Threat of predation has been shown to substantially impact the behavior of
primates in a variety of ways. Primates employ a wide variety of adaptive anti-predator
behaviors and characteristics, including sociality (Hamilton, 1971), group size (Stanford,
2002), body size (Dunbar, 1988), social structure (Hill and Lee, 1998), habitat use and
activity patterns (Enstam, 2007; Hill and Weingrill, 2007; Cowlishaw, 1997), sleeping
site selection and activity (Franklin et al., 2007), alarm vocalizations (Zuberbühler,
2007), ingestion of toxic materials (Hagey et al., 2007), mode of locomotion (Crompton
and Sellers, 2007), vigilance (Treves, 1999; Cords, 1990), mobbing (Gursky, 2005;
Stanford, 2002), interspecific associations (Treves, 1999), feeding behavior (Buzzard,
2006), and myriad others (see Isbell, 1994 for a comprehensive review).
Anti-predator strategies can be classified as dichotomous, including behaviors that
are related to avoidance (including pre-emptive detection) and those that are related to
active defense. Variation in anti-predator response may be related to body size, with
smaller primates (< 1kg) tending to adopt avoidance strategies rather than active defense
strategies (Cheney and Wrangham, 1987), though this view has been increasingly
2

3
challenged by documented reports of small-bodied primates engaging in active mobbing
behavior (Bezerra and Souto, 2008; Gursky, 2005). In general, avoidance strategies are
expected to be front-line defenses against predators employed by primates of all body
sizes, as relaxed attention to detection would be decidedly maladaptive and would limit
the effectiveness of coordinated defense strategies.
Perception of risk is also an important factor in shaping the anti-predator
behaviors of animals. Primates have been demonstrated to alter their feeding, resting,
and grooming patterns in risky habitats, range near refugial areas of escape or
concealment, and differentially select sleeping sites, all in terms of minimization of
perceived risk (Enstam, 2007; Hill and Weingrill, 2007; Cowlishaw, 1997). It is
expected that primates will err on the side of caution under perceived presence of
predators, as failure to act appropriately could have dire consequences. Active defense
behavior, such as mobbing, is then expected to supplement avoidance behaviors (flight,
concealment, crypsis) as necessary. Presumably, anti-predator responses are directly
linked to the presence of predators in a given area, in that frequency or severity of
responses by primate groups should correspond with the severity or regularity of the
threat of predation. This has been demonstrated in some recent literature (Gil-da-Costa,
2007; Gil-da-Costa et al., 2003). Response to the perceived presence of predators is also
thought to be predator species specific, because different predator species employ
different strategies that may inflict different selective pressures on different species
(Cheney and Seyfarth, 1981).

4
1.2 – Predation risk in the neotropics
Neotropical primates are mostly frugivorous, mostly diurnal, and strictly arboreal,
and they cohabitate with a high diversity of predators. Because of these factors and
others, overall predation risk is known to be high in the neotropics, and risk of avian
predation is markedly higher than in other biogeographical regions (Hart, 2007). If risk
of raptor predation in the neotropics is higher than Madagascar, where Karpanty (2006)
demonstrated that raptor predation accounted for anywhere between 2 and 100% of
diurnal primate mortality, then it is expected that neotropical primates face substantial
risk. Avian predator guilds are represented by a number of large falconiform raptors,
including hawk eagles, crested eagles, and the most powerful raptor in the world, Harpia
harpyja, all of which prey upon primates (Miranda et al., 2006; Gilbert, 2000; Julliot,
1994; Heymann, 1990; Eason, 1989; Rettig, 1978). Several mammalian predators pose
risks to primate populations, including most felids, some canids, and one mustelid.
Various reptilian predators are also present in the neotropics, including terrestrial and
semi-arboreal vipers and constricting snakes. Most of the predators in the neotropics
could be considered sit-and-wait or ambush predators.
Although hawk eagles are smaller than the harpy or crested eagles, they are also
known to prey upon primates. Black hawk eagles (Spizaetus tyrannus) and ornate hawk
eagles (S. ornatus) forage in the emergent canopy and dive into the understory with
precision and agility to capture prey in their talons (Miranda et al., 2006). These raptors
are capable of capturing juvenile and infant howler monkeys, but possibly not adults
5
(Miranda et al., 2006), suggesting that they are probably also capable of capturing most
or all of the callitrichids, and at least infant and juvenile small- and medium-sized cebids
wherever these raptors and primates are sympatric.
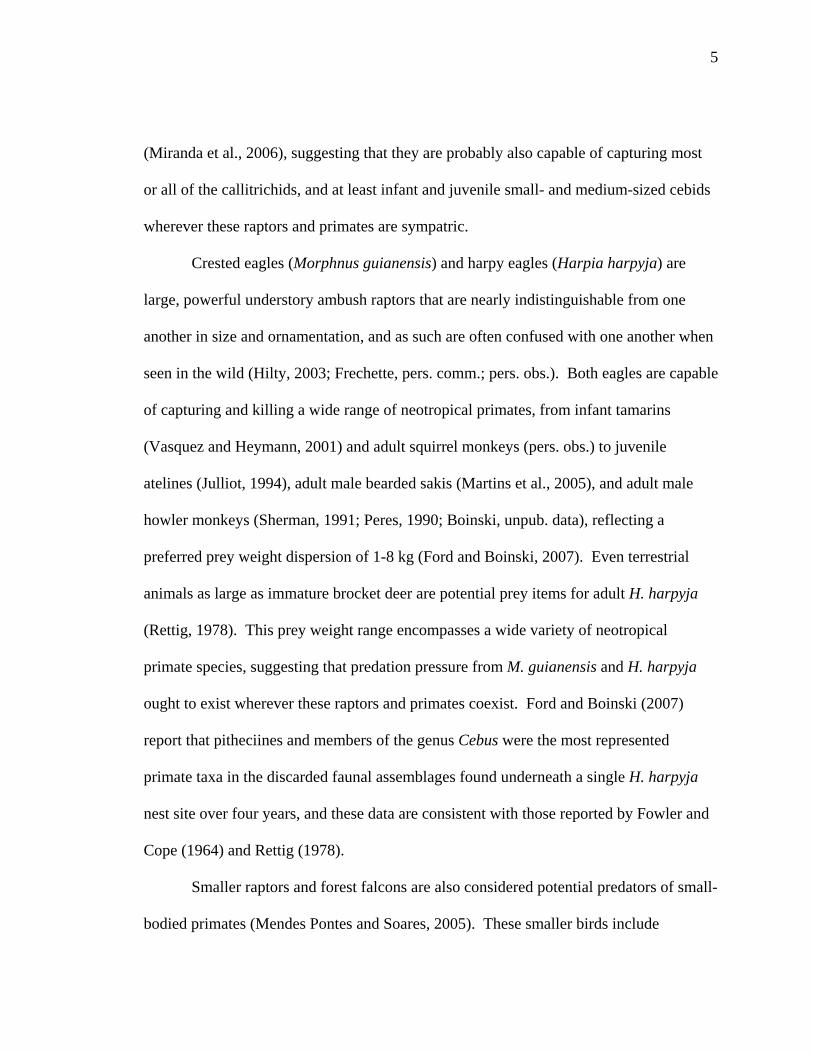
Crested eagles (Morphnus guianensis) and harpy eagles (Harpia harpyja) are
large, powerful understory ambush raptors that are nearly indistinguishable from one
another in size and ornamentation, and as such are often confused with one another when
seen in the wild (Hilty, 2003; Frechette, pers. comm.; pers. obs.). Both eagles are capable
of capturing and killing a wide range of neotropical primates, from infant tamarins
(Vasquez and Heymann, 2001) and adult squirrel monkeys (pers. obs.) to juvenile
atelines (Julliot, 1994), adult male bearded sakis (Martins et al., 2005), and adult male
howler monkeys (Sherman, 1991; Peres, 1990; Boinski, unpub. data), reflecting a
preferred prey weight dispersion of 1-8 kg (Ford and Boinski, 2007). Even terrestrial
animals as large as immature brocket deer are potential prey items for adult H. harpyja
(Rettig, 1978). This prey weight range encompasses a wide variety of neotropical
primate species, suggesting that predation pressure from M. guianensis and H. harpyja
ought to exist wherever these raptors and primates coexist. Ford and Boinski (2007)
report that pitheciines and members of the genus Cebus were the most represented
primate taxa in the discarded faunal assemblages found underneath a single H. harpyja
nest site over four years, and these data are consistent with those reported by Fowler and
Cope (1964) and Rettig (1978).
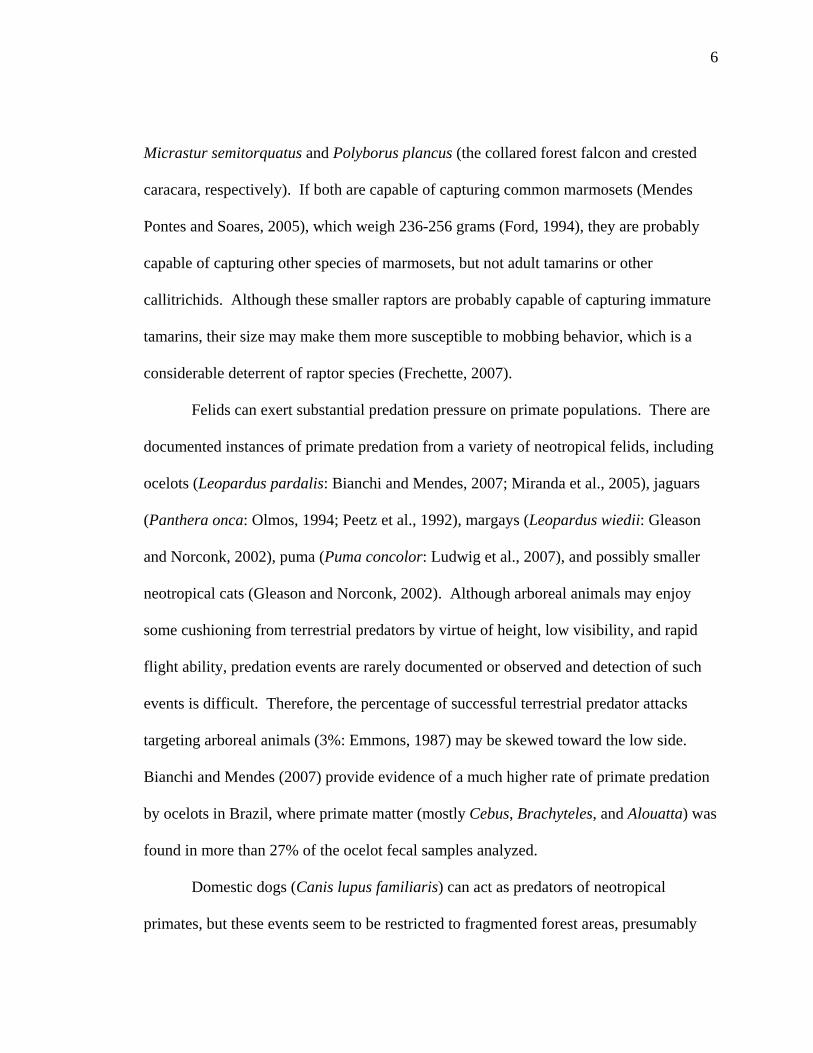
Smaller raptors and forest falcons are also considered potential predators of small-
bodied primates (Mendes Pontes and Soares, 2005). These smaller birds include
6
Micrastur semitorquatus and Polyborus plancus (the collared forest falcon and crested
caracara, respectively). If both are capable of capturing common marmosets (Mendes
Pontes and Soares, 2005), which weigh 236-256 grams (Ford, 1994), they are probably
capable of capturing other species of marmosets, but not adult tamarins or other
callitrichids. Although these smaller raptors are probably capable of capturing immature
tamarins, their size may make them more susceptible to mobbing behavior, which is a
considerable deterrent of raptor species (Frechette, 2007).
Felids can exert substantial predation pressure on primate populations. There are
documented instances of primate predation from a variety of neotropical felids, including
ocelots (Leopardus pardalis: Bianchi and Mendes, 2007; Miranda et al., 2005), jaguars
(Panthera onca: Olmos, 1994; Peetz et al., 1992), margays (Leopardus wiedii: Gleason
and Norconk, 2002), puma (Puma concolor: Ludwig et al., 2007), and possibly smaller
neotropical cats (Gleason and Norconk, 2002). Although arboreal animals may enjoy
some cushioning from terrestrial predators by virtue of height, low visibility, and rapid
flight ability, predation events are rarely documented or observed and detection of such
events is difficult. Therefore, the percentage of successful terrestrial predator attacks
targeting arboreal animals (3%: Emmons, 1987) may be skewed toward the low side.
Bianchi and Mendes (2007) provide evidence of a much higher rate of primate predation
by ocelots in Brazil, where primate matter (mostly Cebus, Brachyteles, and Alouatta) was
found in more than 27% of the ocelot fecal samples analyzed.
Domestic dogs (Canis lupus familiaris) can act as predators of neotropical
primates, but these events seem to be restricted to fragmented forest areas, presumably
7
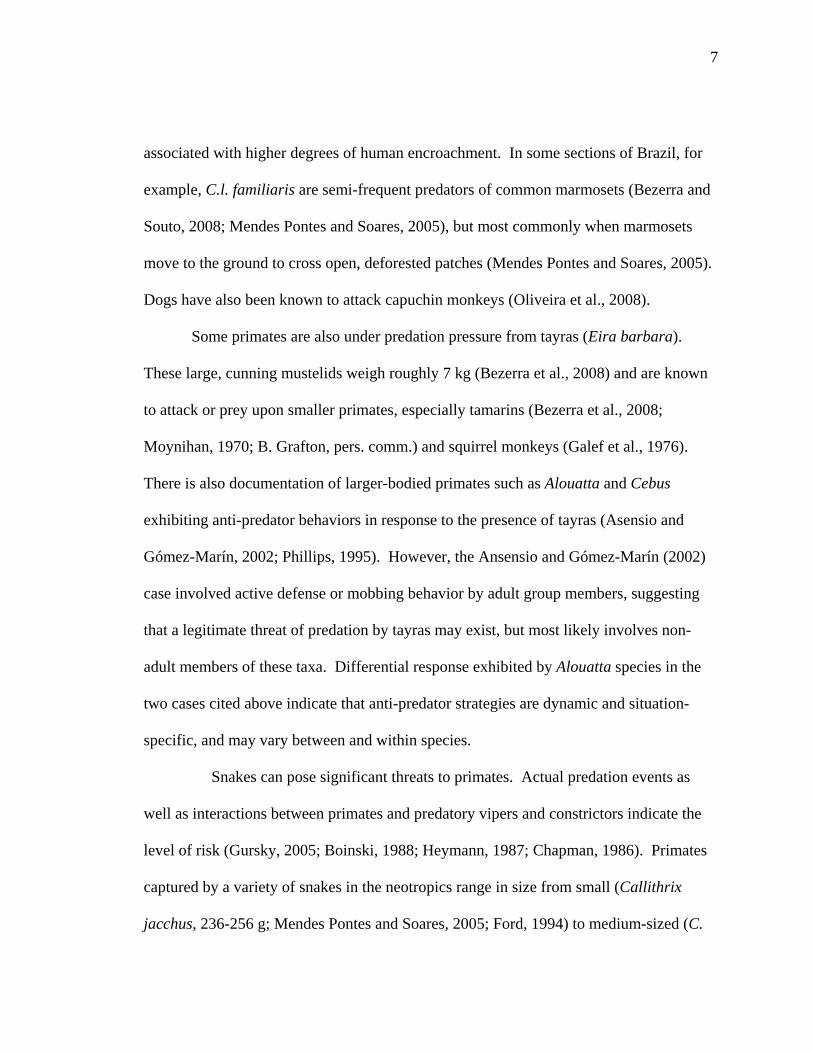
associated with higher degrees of human encroachment. In some sections of Brazil, for
example, C.l. familiaris are semi-frequent predators of common marmosets (Bezerra and
Souto, 2008; Mendes Pontes and Soares, 2005), but most commonly when marmosets
move to the ground to cross open, deforested patches (Mendes Pontes and Soares, 2005).
Dogs have also been known to attack capuchin monkeys (Oliveira et al., 2008).
Some primates are also under predation pressure from tayras (Eira barbara).
These large, cunning mustelids weigh roughly 7 kg (Bezerra et al., 2008) and are known
to attack or prey upon smaller primates, especially tamarins (Bezerra et al., 2008;
Moynihan, 1970; B. Grafton, pers. comm.) and squirrel monkeys (Galef et al., 1976).
There is also documentation of larger-bodied primates such as Alouatta and Cebus
exhibiting anti-predator behaviors in response to the presence of tayras (Asensio and
Gómez-Marín, 2002; Phillips, 1995). However, the Ansensio and Gómez-Marín (2002)
case involved active defense or mobbing behavior by adult group members, suggesting
that a legitimate threat of predation by tayras may exist, but most likely involves non-
adult members of these taxa. Differential response exhibited by Alouatta species in the
two cases cited above indicate that anti-predator strategies are dynamic and situation-
specific, and may vary between and within species.
Snakes can pose significant threats to primates. Actual predation events as
well as interactions between primates and predatory vipers and constrictors indicate the
level of risk (Gursky, 2005; Boinski, 1988; Heymann, 1987; Chapman, 1986). Primates
captured by a variety of snakes in the neotropics range in size from small (Callithrix
jacchus, 236-256 g; Mendes Pontes and Soares, 2005; Ford, 1994) to medium-sized (C.
8
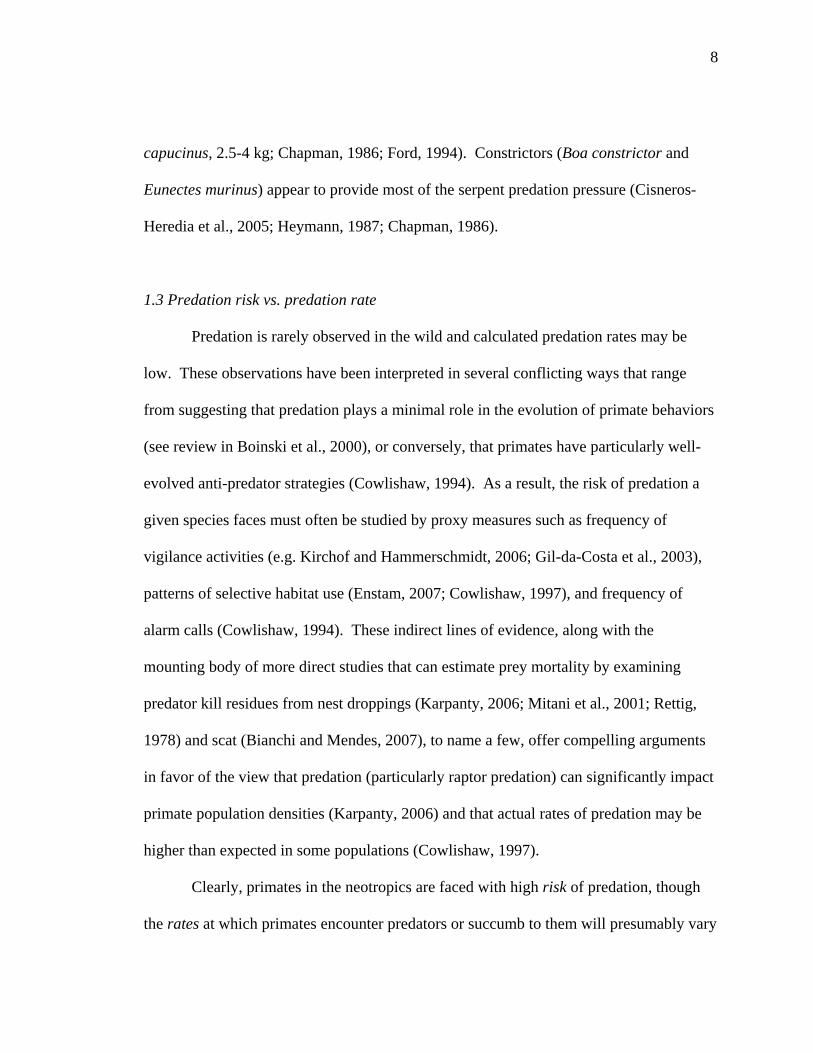
capucinus, 2.5-4 kg; Chapman, 1986; Ford, 1994). Constrictors (Boa constrictor and
Eunectes murinus) appear to provide most of the serpent predation pressure (Cisneros-
Heredia et al., 2005; Heymann, 1987; Chapman, 1986).
1.3 Predation risk vs. predation rate
Predation is rarely observed in the wild and calculated predation rates may be
low. These observations have been interpreted in several conflicting ways that range
from suggesting that predation plays a minimal role in the evolution of primate behaviors
(see review in Boinski et al., 2000), or conversely, that primates have particularly well-
evolved anti-predator strategies (Cowlishaw, 1994). As a result, the risk of predation a
given species faces must often be studied by proxy measures such as frequency of
vigilance activities (e.g. Kirchof and Hammerschmidt, 2006; Gil-da-Costa et al., 2003),
patterns of selective habitat use (Enstam, 2007; Cowlishaw, 1997), and frequency of
alarm calls (Cowlishaw, 1994). These indirect lines of evidence, along with the
mounting body of more direct studies that can estimate prey mortality by examining
predator kill residues from nest droppings (Karpanty, 2006; Mitani et al., 2001; Rettig,
1978) and scat (Bianchi and Mendes, 2007), to name a few, offer compelling arguments
in favor of the view that predation (particularly raptor predation) can significantly impact
primate population densities (Karpanty, 2006) and that actual rates of predation may be
higher than expected in some populations (Cowlishaw, 1997).
Clearly, primates in the neotropics are faced with high risk of predation, though
the rates at which primates encounter predators or succumb to them will presumably vary
9
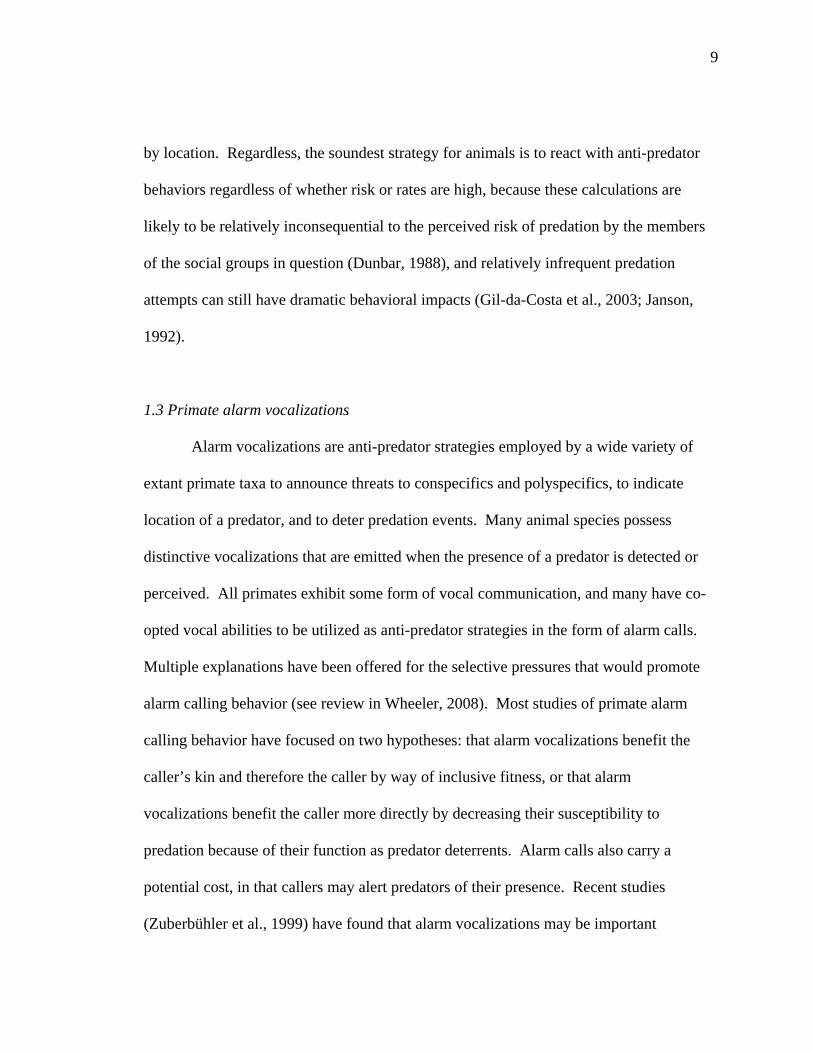
by location. Regardless, the soundest strategy for animals is to react with anti-predator
behaviors regardless of whether risk or rates are high, because these calculations are
likely to be relatively inconsequential to the perceived risk of predation by the members
of the social groups in question (Dunbar, 1988), and relatively infrequent predation
attempts can still have dramatic behavioral impacts (Gil-da-Costa et al., 2003; Janson,
1992).
1.3 Primate alarm vocalizations
Alarm vocalizations are anti-predator strategies employed by a wide variety of
extant primate taxa to announce threats to conspecifics and polyspecifics, to indicate
location of a predator, and to deter predation events. Many animal species possess
distinctive vocalizations that are emitted when the presence of a predator is detected or
perceived. All primates exhibit some form of vocal communication, and many have co-
opted vocal abilities to be utilized as anti-predator strategies in the form of alarm calls.
Multiple explanations have been offered for the selective pressures that would promote
alarm calling behavior (see review in Wheeler, 2008). Most studies of primate alarm
calling behavior have focused on two hypotheses: that alarm vocalizations benefit the
caller’s kin and therefore the caller by way of inclusive fitness, or that alarm
vocalizations benefit the caller more directly by decreasing their susceptibility to
predation because of their function as predator deterrents. Alarm calls also carry a
potential cost, in that callers may alert predators of their presence. Recent studies
(Zuberbühler et al., 1999) have found that alarm vocalizations may be important
10
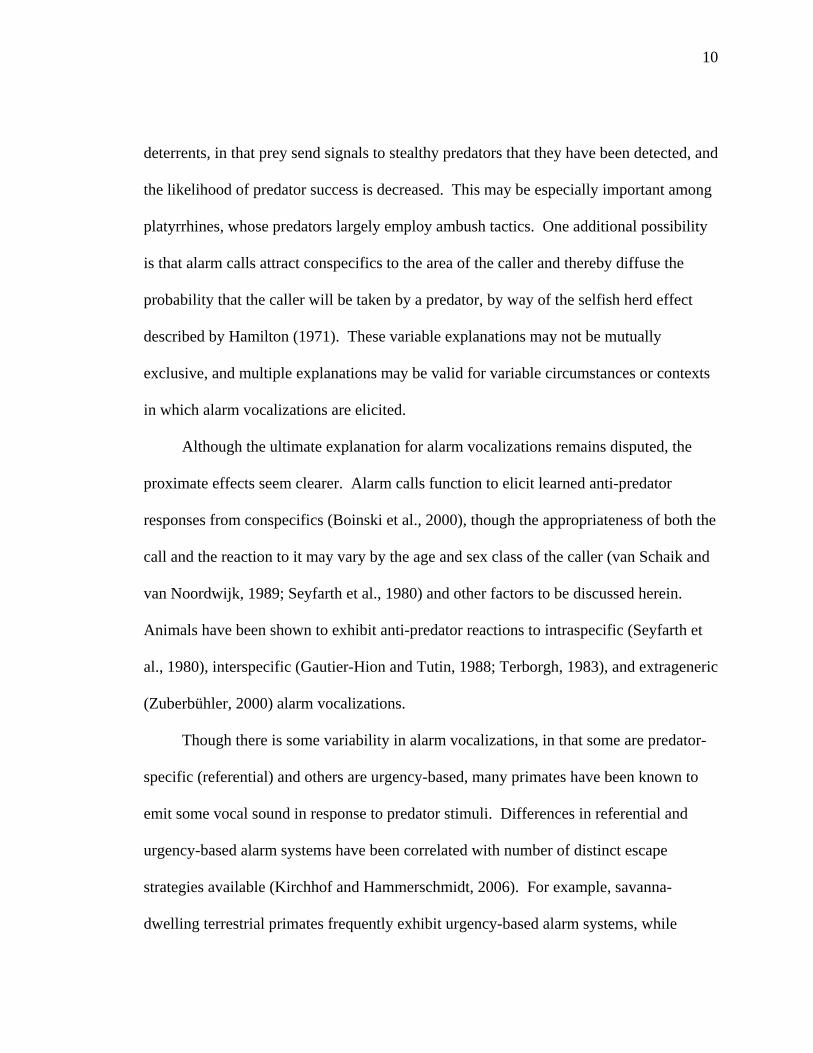
deterrents, in that prey send signals to stealthy predators that they have been detected, and
the likelihood of predator success is decreased. This may be especially important among
platyrrhines, whose predators largely employ ambush tactics. One additional possibility
is that alarm calls attract conspecifics to the area of the caller and thereby diffuse the
probability that the caller will be taken by a predator, by way of the selfish herd effect
described by Hamilton (1971). These variable explanations may not be mutually
exclusive, and multiple explanations may be valid for variable circumstances or contexts
in which alarm vocalizations are elicited.
Although the ultimate explanation for alarm vocalizations remains disputed, the
proximate effects seem clearer. Alarm calls function to elicit learned anti-predator
responses from conspecifics (Boinski et al., 2000), though the appropriateness of both the
call and the reaction to it may vary by the age and sex class of the caller (van Schaik and
van Noordwijk, 1989; Seyfarth et al., 1980) and other factors to be discussed herein.
Animals have been shown to exhibit anti-predator reactions to intraspecific (Seyfarth et
al., 1980), interspecific (Gautier-Hion and Tutin, 1988; Terborgh, 1983), and extrageneric
(Zuberbühler, 2000) alarm vocalizations.
Though there is some variability in alarm vocalizations, in that some are predator-
specific (referential) and others are urgency-based, many primates have been known to
emit some vocal sound in response to predator stimuli. Differences in referential and
urgency-based alarm systems have been correlated with number of distinct escape
strategies available (Kirchhof and Hammerschmidt, 2006). For example, savanna-
dwelling terrestrial primates frequently exhibit urgency-based alarm systems, while
11
arboreal primates that can utilize a wider variety of forest habitats tend to exhibit
referential alarm systems. Availability of predation escape avenues has also been
correlated with predator-sensitive ranging behavior (Lima, 1992).
Many savannah baboons and some lemurs utilize urgency-based alarm systems,
where calls are not necessarily predator-specific, but vary along a continuum of volume
and frequency, indicating the urgency of active or passive defensive strategies. A more
variable set of escape options (ascend or descend) is available to arboreal primates, which
may partially explain why many primarily arboreal species appear to utilize predator-
specific vocalizations more often than their terrestrial counterparts.
Alarm calls vary greatly and exist along a continuum, from a single call having
multiple functions (Alouatta: da Cunha and Jalles-Filho, 2007), to a single call with
variable volume and pitch which portray the urgency of the threat (Papio: Fischer et al.,
2001), to multiple, acoustically distinct calls that are predator specific (Cebus apella:
Wheeler, 2008; Cercopithecus aethiops: Cheney and Seyfarth, 1981). As predicted by
the continuous nature of alarm vocalizations, primates in the neotropics vary greatly in
their vocal repertoires.
1.4 Vigilance
Vigilance behavior has long been quantified as a baseline indicator of predation
risk. Theoretically, animals under less intense risk of predation would devote less energy
to exhibiting vigilance behavior at the expense of allocation to other activities (e.g.
mating, foraging, territorial enforcement), because doing so reflects a considerable fitness
12
trade-off. Vigilance frequency has therefore been the focus of many behavioral studies
(see review in Elgar, 1989), and used as the method of comparison to describe how
groups minimize predation risk via behavioral repertoires, such as the formation of
interspecific associations (Treves, 1999) or selective use of less risky habitats (Boinski et
al., 2003). However, it stands to reason that baseline frequencies will vary with habitat
variables, and that animals ranging in dense habitats will, by virtue of lowered visibility,
reduce the frequency with which they exhibit vigilance (Boinski et. al, 2003). Therefore,
the dense, low-visibility habitats that plague researchers and protect animals in
neotropical forests may foster lower rates of vigilance, regardless of risk perception or
actual predation rates. For this reason, alarm vocalizations rather than vigilance were
chosen as the primary proxy measure of perceived risk in this study, although vigilance
behaviors were recorded.
1.5 Habitat use
Several studies have focused on differential habitat use as it pertains to the
reduction of risk and enhancement of detection, as well as how habitat variables can
structure the anti-predator response of a species. Baboons may selectively engage in
resting and grooming behavior on cliff edges that are difficult for predators to traverse
(Hill and Weingrill, 2007). Other baboons may more frequently travel in areas with
lower risk of leopard encounters and lower quality food resources (Cowlishaw, 1997).
Patas monkeys and vervets exhibit differential responses based on availability of tall trees
and density of cover (Enstam and Isbell, 2004; Enstam and Isbell, 2002). New world
13
monkeys may also alter their behaviors in select habitats, as evidenced by differential
rates of vigilance exhibited by squirrel monkeys in dense liana forests (Boinski et al.,
2003) and reports of white-faced sakis taking refuge in dense cover following a perceived
threat of predation (Gleason and Norconk, 2002).
1.6 Playback studies
Playback studies have been used extensively in studies of predator-prey
interactions to measure the responses of various species to auditory broadcasts of various
stimuli. These stimuli have included intraspecific alarm vocalizations (Kirchof and
Hammerschmidt, 2006; Cheney and Seyfarth, 1981), terrestrial predator vocalizations
(Stephan and Zuberbühler, 2008; Zuberbühler et al., 1999), and aerial predator
vocalizations (Stephan and Zuberbühler, 2008; Gil-de-Costa, 2007; Gil-de-Costa et al.,
2003; Treves, 1999). These studies attempt to elicit anti-predator responses from
primates, either to examine the referential nature of a species’ alarm vocalization or the
responses to the perceived presence of predators. This study attempts to do the latter in
order to measure various habitat variables as potential indicators of anti-predator
behavior and to gauge the appropriateness of the response as a potential indicator of the
frequency with which prey are encountered by specific predators.
Hypotheses
This study sought to evaluate the anti-predator responses to the broadcasts of
avian predator vocalizations by eight sympatric neotropical primates in Suriname, South

14
America. These primates were naturally occurring at two separate parks with assumed
differential predation pressure, and were thus expected to exhibit differential patterns of
response to the perceived presence of a predator. A review of the literature suggests that
anti-predator responses are not necessarily equal or consistent, and may covary with
habitat and predator contexts.
I attempted to elicit anti-predator responses from groups of primates by
broadcasting predator vocalizations, which served to simulate the presence of a predator.
The four major hypotheses tested in this study are as follows:
H1) Frequency of alarm vocalizations emitted by primate groups will be higher during broadcasts of predator vocalizations than during non-predator vocalizations, H2) The audio broadcasts of predator vocalizations will cause primate groups to move into areas with higher overstory density, because canopy cover reduces the risk of predation, H3) Frequency of alarm vocalizations emitted by primate groups will be higher in populations with suspected greater frequencies of aerial predator interactions than in those with unknown or suspected lower frequencies of contact, H4) Frequency of alarm vocalizations emitted by free-ranging primate groups will be more stimulus-appropriate than the frequency of alarms emitted by captive-born groups.
The goal of this project was to describe and test hypotheses about anti-predator
behavior across eight sympatric neotropical primates, to hopefully elucidate subtle
differences in strategies between species, examine how habitat variables may influence
responses of monkeys to the broadcasts of predator vocalizations, and explain how
predator presence may facilitate and reinforce the learning of appropriate alarm response.
CHAPTER TWO
METHODS
2.1 - Study Area
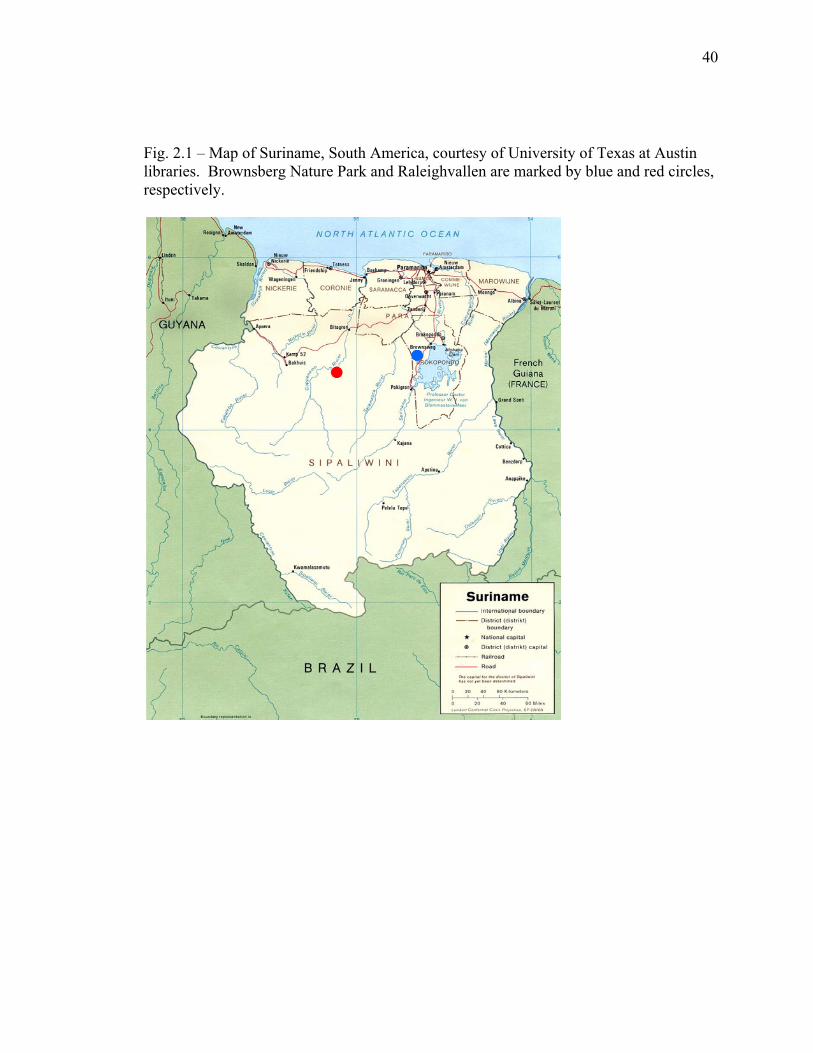
Behavioral research was conducted from 29 May through 7 August 2008 at two
protected natural parks in Suriname, South America: Brownsberg Nature Park (BNP; 5º
01' N, 55º 34' W) and Raleighvallen-Voltzberg Nature Park (RV; 4º 43' N, 56º 12' W)
(fig. 2.1). Suriname is located in Northeastern South America, sandwiched between
Guyana and French Guiana on the Atlantic coast of the continent. The political
boundaries of the country contain over 163 km2, 75% of which is forested habitat where
roughly 5% of the population resides (Baal et al., 1988).
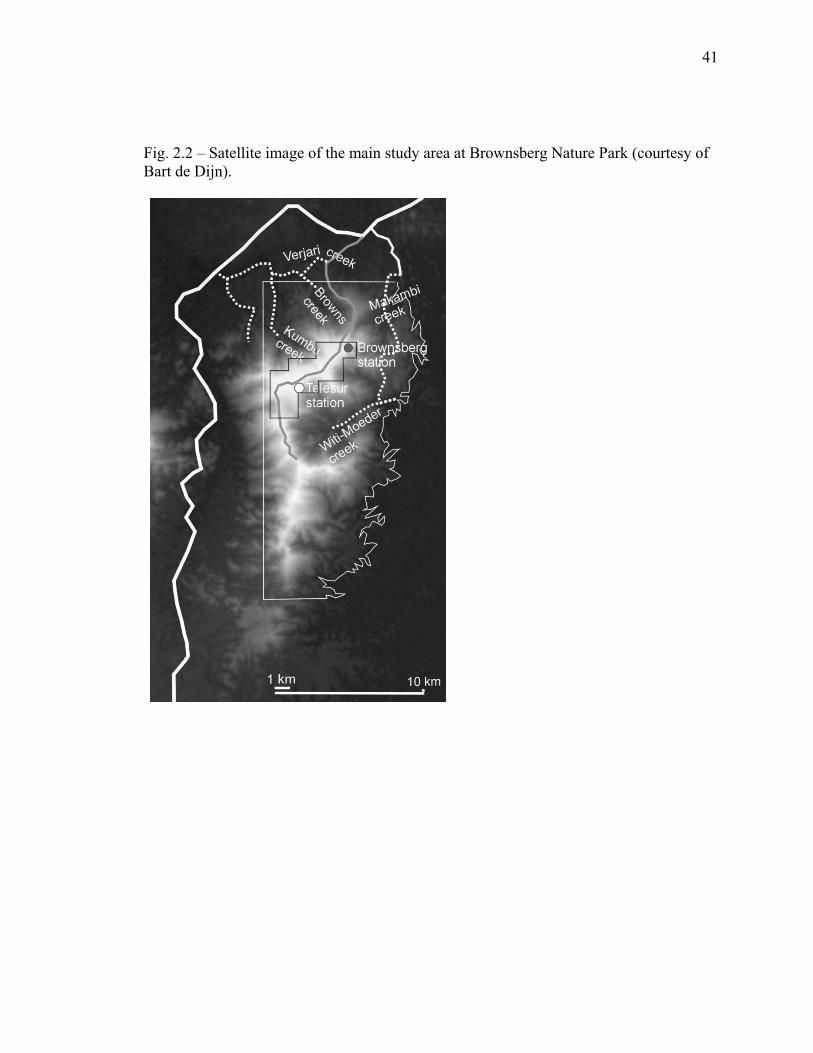
BNP is Suriname’s only national park, consisting of over 12,000 ha (Fitzgerald et
al., 2002). BNP is characterized by montane forest with a variety of incremental
ecozones found along the slopes leading down the mountain. The Mazaroni Plateau
forms the highest elevation of the mountain at 530 m, and the majority of research
activities occurred within 5 km of this plateau (figs. 2.2 and 2.3). The eastern base of the
mountain is formed as the slopes of the plateau cascade down to one of the largest man-
made lakes in the world, Lake Brokopondo. The northern and western bases taper off to
the sparsely populated and minimally developed Brokopondo district, with a population
of roughly 8000 Saramakans Maroons. The faunal diversity on the berg is high because
the rapid rise of the slopes supports a wide range of diverse ecozones (Lim et al., 2005;
Fitzgerald et al., 2002). Hunting and mining activities are legal outside the borders of the
16
17
park, and are practiced illegally near the borders and within the park, to an extent not
fully known. Therefore, the high density and diversity of wildlife in the park may also
reflect the refugial or island nature of BNP’s relatively pristine forest structure, in that
human activities around the base of the mountain have forced wildlife to colonize areas
along the slopes and plateau of the berg.
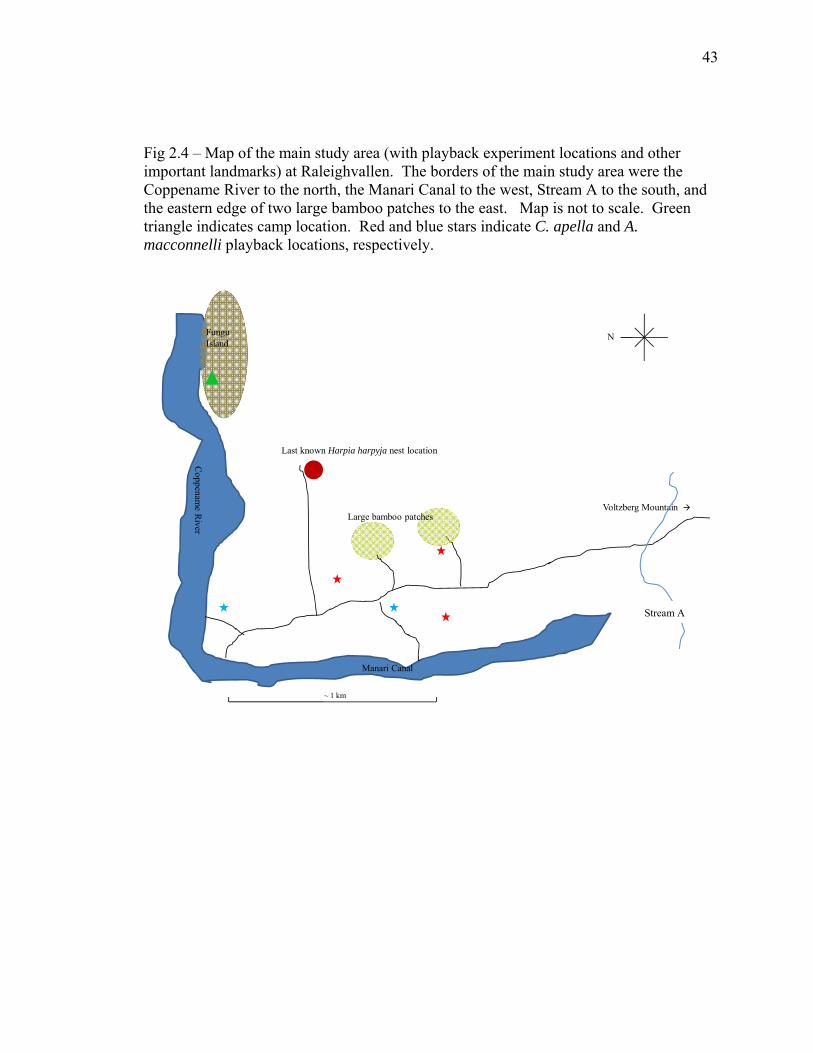
The study area at RV is part of the 1.6 million ha Central Suriname Nature
Reserve (CSNR), and largely consists of lowland riverine habitat supported by the
Coppename River. The lowland forest in which the study was centralized is
characterized by dense secondary vegetation, as well as swamp and bamboo forests.
These bamboo thickets and dense undergrowth are thought to be related to previous
Amerindian settlements in the area (Boinski, 2008). RV also supports a wide variety of
faunal diversity, and the species represented within the boundaries of the study area (fig.
2.4) are similar to those found at BNP and other locations in Suriname (Lim et al., 2005;
Reichart, 1993).
Though there are two Kwinti Maroon villages (Witagron and Kaaimanston) along
the Coppename River, north of the study area at RV, there are no current permanent
settlements within RV or the CSNR.
2.2 - Study subjects
Eight primate species are found within the borders of both parks: Alouatta
macconnelli, Ateles paniscus, Cebus apella, C. olivaceus, Chiropotes sagulatus, Pithecia
pithecia, Saguinus midas, and Saimiri sciureus. These species form a rich primate
18
community, encompassing a wide range of habitats, diet types, group sizes, and social
structures (see table 2.1). That said, all primate species at BNP and RV are arboreal and
diurnal. Body size of the species represented ranges from 0.4-11 kg (Ford, 1994; Ford
and Davis, 1992), which makes them vulnerable to a variety of predators (table 2.2). As
a result, primate species represented in Suriname exhibit a wide variety of anti-predator
strategies and vocal repertoires.
Alouatta
Guianan howler monkeys (Alouatta macconnelli) exhibit vocalizations in
response to perceived threat of predation, like other species of howlers (Gil-da-Costa et
al., 2002). Long roars are also utilized for territory defense and boundary enforcement
(da Cunha and Jalles-Filho, 2007). Although low grunts and barks are also associated
with this species, the roaring vocalizations were classified as anti-predator vocalizations
in this study (as documented by Eason, 1989), and other studies have demonstrated that
singular vocalizations can be used in a variety of contexts, including signaling alarm
(Zuberbühler et al., 1997). Other species of Alouatta possess as many as 22 distinct calls
in their vocal repertoires (Baldwin and Baldwin, 1976).
Ateles
Black spider monkeys (Ateles paniscus) are high-canopy dwellers who employ a
variety of vocalizations in their anti-predator behavior, including non-referential bark-like
alarm vocalizations, as in other species of Ateles (Chapman et al., 1990). There is some
19
suggestion that number of kin in the area of a caller directly impacts the intensity,
duration and frequency of the alarms (Chapman et al., 1990). Spider monkeys also
engage in predator-mobbing behavior, which typically involves breaking and dropping
branches from high in the canopy.
Cebus
Brown capuchin monkeys (Cebus apella) have distinct, functionally referential
alarm vocalizations that identify and are used to distinguish between terrestrial and aerial
predators (Wheeler, 2008; pers. obs.). Some of these vocalizations may be signals of
stress or general disturbance (Boinski et al., 1999), but the aerial alarm vocalization is
thought to be emitted only in response to the presence (or perceived presence) of aerial
predators (Wheeler, 2008). Previous studies have asserted that these alarms were given
only in response to visual cues of predators (Wheeler, 2008).
Like brown capuchins, wedge-capped capuchins (Cebus olivaceus) produce
predator-specific alarm vocalizations (Norris, 1990; Freese and Oppenheimer, 1981),
including an alarm bark that was only heard during intervals 4 and 5 during this study
(see below). Although Robinson (1984) describes a wide variety of vocalizations emitted
by wedge-capped capuchins, an alarm vocalization is not described specifically. Alarm
vocalizations emitted by this species are referred to as “grrah” calls by Freese and
Oppenheimer (1981), and the description provided by the authors is consistent with what
I interpreted as an alarm call emitted by wedge-capped capuchins during this study.
20
Chiropotes
Bearded sakis (Chiropotes satanas) have characteristic whip-like vocalizations
that potentially serve as contact calls, movement indicators, and indicators of general
disturbance. They also emit alarm vocalizations (Silva and Ferrari, 2009), which are
likely more intense forms of the whip vocalization (van Roosmalen et al., 1981).
Observers were able to distinguish loud whip vocalizations from contact whip
vocalizations. As such, all loud whip vocalizations emitted by groups of bearded sakis
were tallied as alarm vocalizations.
Pithecia
White-faced sakis (Pithecia pithecia) are lower-strata dwellers that have a vocal
repertoire of between 12-18 distinct calls, including an “alarm chuck” (Henline, 2007;
Buchanan et al., 1981). Henline also reports several vocalizations as being utilized in the
context of “heterospecific” interactions, and although Buchanan and colleagues (1981)
report an “alarm chuck” vocalization, these vocalizations appear to be used in more
contexts than the specific alarm vocalizations emitted by other neotropical species.
The white-faced saki alarm vocalization was never emitted in any of the playback
experiments at BNP, although some unhabituated groups emitted chuck vocalizations in
apparent response to the presence of observers. Sakis are documented to exhibit multiple
anti-predator strategies (including silence and immobility) in response to real or
perceived threats (Gleason and Norconk, 2002).
21
Saguinus
Several species of Saguinus (though not S. midas, specifically) have been reported
as employing referential alarm call systems in response to various predators (Kirchhof
and Hammerschmidt, 2006; Sproul et al., 2006). Golden-handed tamarins (Saguinus
midas) in Suriname emitted a short, high-pitched call that appeared to be in response to
playback experiments, and this call was recorded as an alarm vocalization in this study.
Day and Elwood (1999) report S. midas alarm vocalizations in response to aerial
predators and “trill” vocalizations in response to snakes, suggesting functional
referentiality in their alarm vocalizations. This is to be expected given the high risk of
predation associated with these small-bodied monkeys (Kirchhof and Hammerschmidt,
2006).
Saimiri (2.2-7)
Unlike many other neotropical monkeys, some species of Saimiri reportedly lack
a dedicated alarm vocalization. Instead, twitters are reportedly given in response to “high
emotional arousal,” including response to threat of predation (based on Saimiri oerstedii
data; Boinksi and Newman, 1988). However, common squirrel monkeys (Saimiri
sciureus) are reported to have a vocal repertoire of 21 distinct calls including a dedicated
“alarm peep” (Winter et al., 1966).
2.3 - Predation risk in the study areas

22
Forests of the Guiana Shield feature diverse predator guilds, comprised of all
major primate predators in the neotropics. Anecdotal evidence from the 2008 field
season (May through August) indicates a relatively high density (or at least a regular
presence) of some of these predators, especially felids, at BNP. On the other hand,
primates ranging within the RV study area may face a particularly high threat from harpy
eagles (Harpia harpyja), due to range proximity to a known harpy nest and documented
reports of regular predation events (Boinski and Ford, 2007)(fig. 2.5). A list of the
known and potential primate predators at BNP and RV, as gathered from personal
observation, animal density surveys, and other published and unpublished accounts,
indicates that predator guilds at BNP and RV are intact (Table 2.3).
Although exact density or distribution of potential primate predators at BNP and
RV is currently unknown, the predator guilds at both parks are intact (Lim et al., 2005;
Reichart, 1993; Trail, 1987), if for no other reason than the ecosystem supports a rich
collection of prey species. Because of this predator diversity, and the inference of high
density or high frequency of contact of some of the felids (based on frequency of animal
or tracks/scat/scratch marks/kills; table 2.4) and/or raptors, it is concluded that the
primates of BNP and RV face substantial predation risk.
2.4 - Playback experiments
For the purposes of studying the general responses to the perceived presence of a
predator in all eight sympatric species, I conducted playback experiments consisting of
both non-predatory (control; screaming piha - Lipaugus vociferans) and predatory
23
(experiment; harpy eagle - Harpia harpyja) bird vocalizations. Because observation of
actual predation is rare (Stanford, 2002), these playback experiments were designed to
measure the responses of primate groups to the perceived presence of predators.
Playback vocalizations
Screaming pihas are small, frugivorous, territorial birds, common in high canopy,
non-flooded neotropical forests. Males frequently emit signature territorial vocalizations,
and these vocalizations are ubiquitous in the forests of Suriname. This vocalization was
chosen for the control group because of the commonality of the bird and the vocalization,
and because the monkeys of Suriname show no apparent reaction to these vocalizations
(pers. obs.). During all but one of the playback experiments at BNP (but none of the
experiments at RV), live conspecifics responded to recorded screaming piha
vocalizations by producing like vocalizations.
Harpy eagles are one of the most powerful raptors in the world (Fowler and Cope,
1964), and are significant threat to primate species in the neotropics (Ford and Boinski,
2007; Rettig, 1978; Fowler and Cope, 1964). These ambush predators mostly occupy
lowland forests (Piana, 2002), can swiftly navigate even dense understory to capture prey
(Fowler and Cope, 1964), and are capable of killing and transporting prey that weigh 5-6
kg (Ferrari, 2009). Kill residue analysis from harpy eagle nest sites suggests that typical
prey body mass ranges from 1 to 8 kg (Ford and Boinski, 2007), and other studies of
below nest kill assemblages have suggested that primates may be important prey items
for these raptors (Touchton et al., 2002; Rettig, 1978).
24
While the high-pitched scream vocalization of harpy eagles is probably a contact
call or a threat response (Piana, 2002; Rettig, 1978), the broadcast call during playback
experimentation was expected to elicit a response to the presence, if not the intention, of
the raptor. There is some evidence to suggest that harpy eagles also emit this scream
vocalization during hunting activity (Gil-da-Costa et al., 2003). In addition, adult harpys
will frequently emit vocalizations from the nest site or after a kill to signal to juveniles
that prey has been captured (Piana, 2002; pers. obs.). As such, the broadcast of these
vocalizations may more closely simulate auditory cues of predator proximity rather than
that of an actual predation attempt, but should elicit a response in either case.
Though harpy eagles are said to inhabit Brownsberg Nature Park through
published reports (De Dijn et al., 2006; Lim et al., 2005; Fitzgerald et al., 2002) as well
as localized reports from knowledgeable staff and park researchers, no nest site is known.
Therefore, the representation, exact range, density, and distribution of harpy eagles at
BNP are unknown. On 6 October, 2008, a predation event on an immature howler
monkey was verified by the presence of multiple bones and numerous associated feathers
(consistent with predation events; Martins et al., 2005; Piana, 2002). This assemblage
was found on the eastern slope of the mountain, roughly 2 km from the top of the plateau.
Additional details about the predation event are unknown, though the presence of bones
may indicate proximity to a nest site, since harpy eagles typically transport their kills to
the nest prior to feeding or discarding bones (pers. obs.; Piana, 2002; Rettig, 1978).
At RV, there was a monitored harpy eagle nest site from 2002 to 2007, containing
at least one adult and one juvenile. At least three troops of brown capuchins and several
25
groups of howler monkeys inhabit home ranges well within the expected harpy eagle
hunting perimeter (up to 10,000 ha; Thiollay, 1989), and several of these groups spent
considerable amounts of time within 1 or 2 km of the nest site (pers. obs.) along with
unknown numbers of groups of spider monkeys, bearded sakis, tamarins, squirrel
monkeys, and white-faced sakis that have been observed in the area (pers. obs.). From
direct anecdotal evidence from previous field seasons, it is concluded that the primates
ranging within the central study area at RV have regular, substantial periods of contact
with harpy eagles.
Experiment protocol
Experiments lasted 31 min in duration and were conducted not more than once
per week per group, to ameliorate the threat of habituation. The experiments themselves
consisted of the broadcast of a single, high-quality audio file through a portable, battery-
powered SME-AFS field speaker (Saul Mineroff Electronics; Elmont, NY; frequency
response: 100 Hz to 12 KHz) using a Zoom H4 digital audio recorder (Samson
Technologies Corp.; Hauppauge, NY). The audio file was created from non-compressed
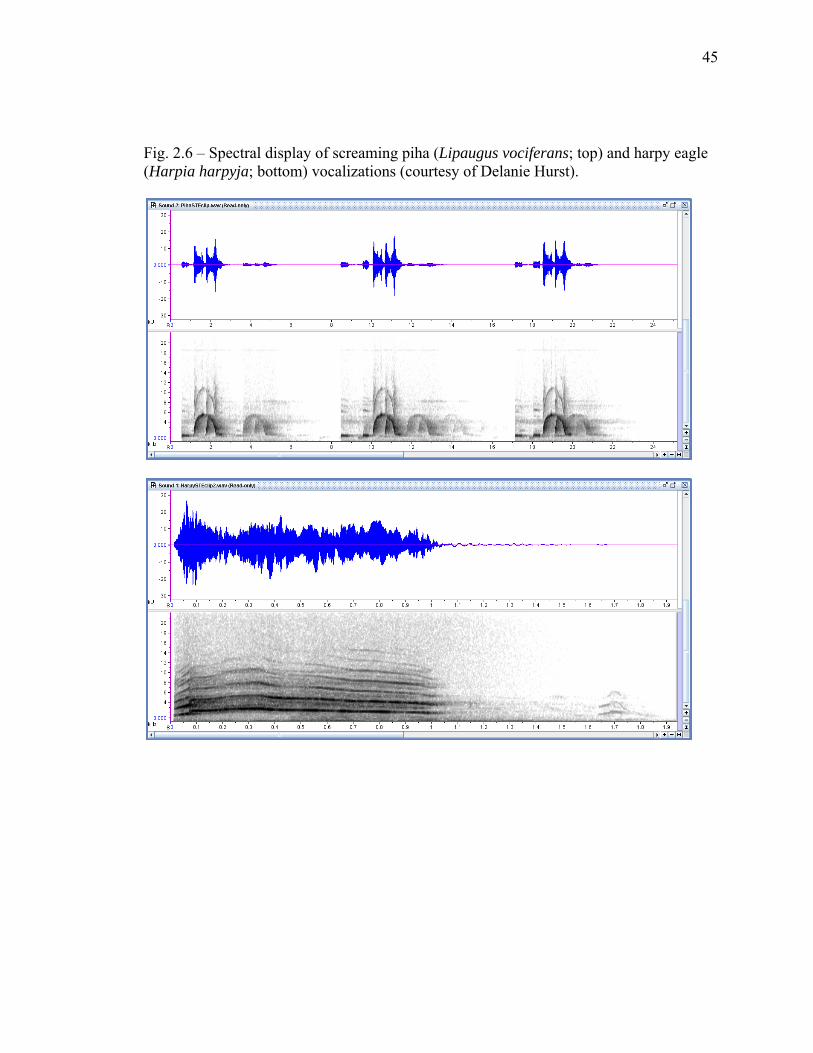
wav. files ordered from the Macauley Sound Library at Cornell University (fig. 2.6).
Vocalizations that were originally recorded at close range and thereby featured minimal
ambient noise were specifically selected from the larger file to maximize the natural
ambient effect of the forest in which they would be broadcast. These selected
26
vocalizations were then spliced together, normalized1 to achieve relatively consistent
volume, and recombined into stereo channels using Sound Forge 5.0 (Sonic Foundry,
Inc.). The final audio file consisted of five distinct intervals (table 2.4).
During experiments, the volume control on the playback speaker was held
constant at maximum volume, and the output volume control on the digital player device
was held constant at unity gain.
Due to logistical and temporal constraints in conducting the playbacks
spontaneously and quickly to unhabituated groups of monkeys, the original goal of
hoisting the playback speaker to a pre-determined and consistent height was abandoned.
Instead, the speaker was positioned on the ground, and placed strategically to be out of
direct view of the monkey troop, usually concealed by understory vegetation. To direct
the audio into the canopy and to obfuscate the exact source of the sound, the speaker was
tilted to roughly 45 degrees. The speaker was routinely placed between 20 m and 50 m
from the group. Whenever possible, the speaker was positioned along a ridge to
broadcast sound to a troop of monkeys along the descending slopes, thereby giving the
illusion of height when the speaker was placed at ground level.
On 4 July 2008, the maximum distance at which piha and harpy eagle audio could
be heard was measured. At maximum speaker volume with the speaker placed on the
ground and facing observers located at 100 m intervals along a straight, cleared trail
through medium-density low rainforest, the audio files were broadcast. The highest,
1Audio normalization is the process through which the amplitude of an audio waveform is increased to its maximum possible peak without distorting. This process was conducted on the audio files used here in order to decrease large gain discrepancies between calls.
27
loudest phrase of the screaming piha vocalization could be heard 300 m away by human
observers with no reported hearing deficits, but the harpy eagle vocalization could not be
detected by those observers beyond 250 m. Therefore, playbacks were never conducted
on any troop located within 250 m of another playback experiment on the same day.
2.5 - Data collection
Two distinct types of behavioral data were harvested during playback
experiments: activity data and response data. Some generalized data were also recorded
for each set, including estimates of troop population size when such estimates could be
made and GPS locations of the speaker during experimentation. Each line of data
consisted of an activity code, troop spatial spread in meters, group dispersion, troop
height range in meters, overstory density, and understory density. In addition, forest type
(table 2.6) was noted at the beginning of each experiment, and again if the monkeys
changed forest type within the 31 min interval.
Activity data
All activity measurements were collected via instantaneous group scans taken at 1
min intervals during 31-min playback experiments. General activity codes recorded what
the majority of the individuals in the group were doing at the time of the scan. Behaviors
addressed included foraging, resting, and traveling. Speed of transport was also
considered with activity measurements, and was qualified as “slow,” “medium,” or
“fast.” For the purposes of analysis, the modal activity during a given playback interval
28
was coded as the activity for that interval sample. In the event of a tie, preference was
given to the activity with the most consecutive observations.
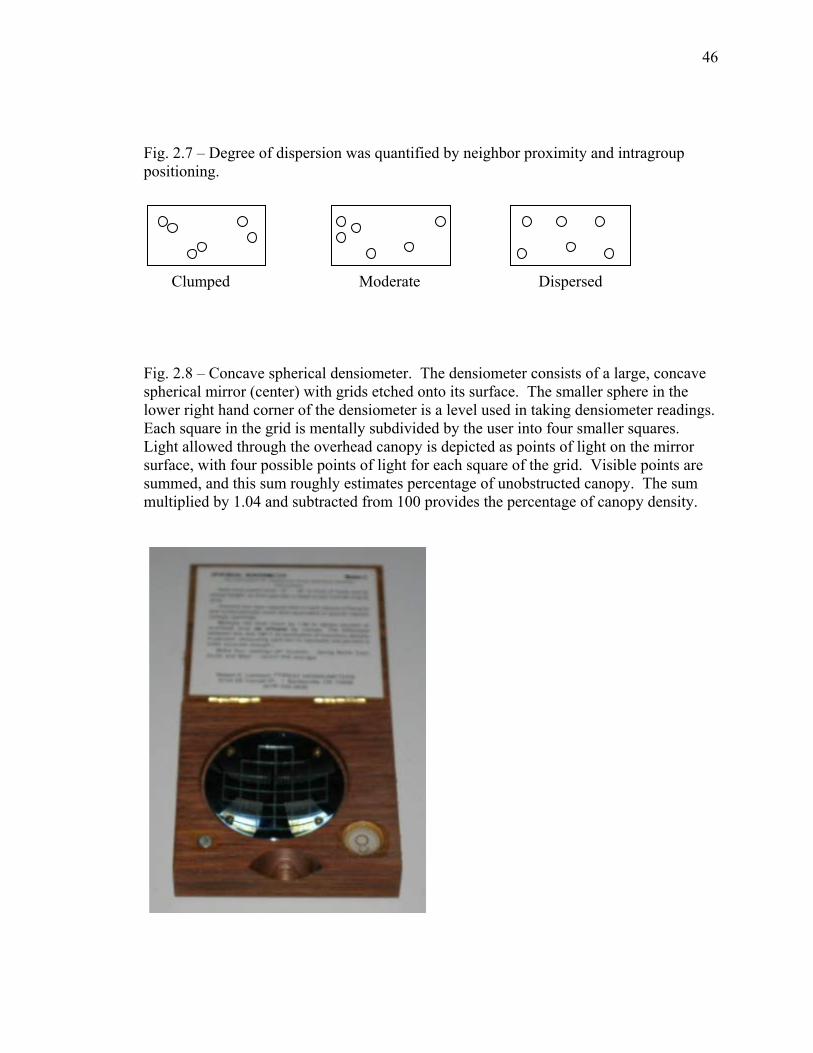
Group spread and dispersion data quantified “intra-group positioning”. Spatial
spread was a widthwise-by-lengthwise measurement in meters that quantified the overall
distribution of the troop in space. Spatial area of occupation (width x length) was
calculated for use in analysis as a measure of group spread in space. Dispersion was a
categorical measurement qualifying the distribution of monkeys within the spatial area of
occupation of the group. The categories of group spatial dispersion were clumped,
uniform, and moderate (figure 2.7).
Height of both the lowest and highest observed monkey was recorded in meters.
Height differential was also calculated for use in analysis (hmax – hmin) as a measurement
of vertical spatial dispersion.
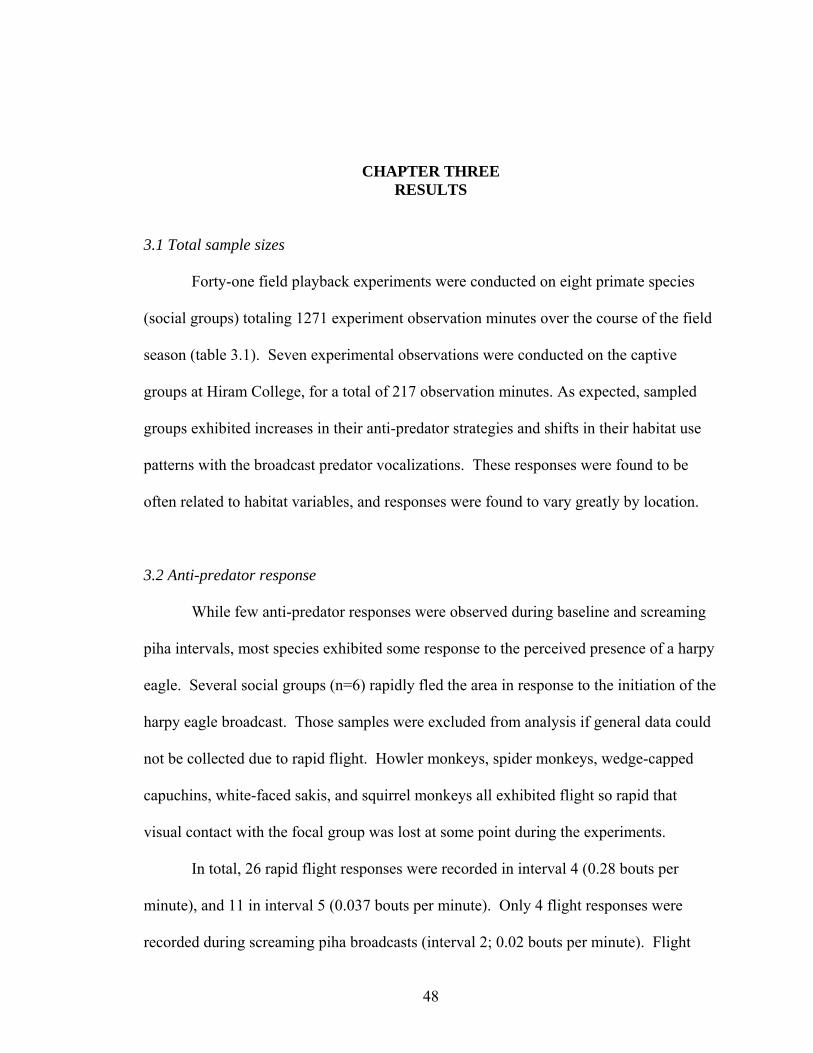
Overstory density was measured at 1-min intervals during experimentation by
using a concave spherical densiometer (Forest Densiometers, Inc.; Arlington, VA). A
densiometer is a small box containing a grid-etched mirror (see fig. 2.8). Each square on
the etched grid is mentally subdivided by the observer into four smaller squares. Points
of light allowed through open areas of the canopy appear on the mirror’s surface, and
each point equal to one of the four subdivisions in each square is counted. Densiometer
measurements (d) are then converted to percentages of canopy cover (c) by using the
following formula:
c = 100 – (d x 1.04)

29
Densiometer readings were taken with every 1-min group scan and were, when possible,
comprised of the average of three densiometer readings taken from the vanguard edge,
middle, and rear edge of the troop.
Understory density (UD) was qualified by visual estimation on a scale from 0
(clear understory) to 3 (impassable growth) in 0.5 increments, similar to the scale used by
Cords (1990). UD was intended to quantify the difficulty with which a skilled understory
raptor would have in moving through the area. As such, and because avian ambush
predators do not hunt from the ground, the understory in question referred to any forest
growth between roughly 5 m and the maximum height at which the monkey troop being
followed was ranging. Model habitats of each were found at each study area and used as
templates for estimating cover. Extreme values of 0 and 3 were reserved for totally open
understory (usually anthropogenically cleared, and found only at BNP) and dense liana
tangles or bamboo thickets, respectively. A UD value of 3 was coded in only 10 samples,
while a UD of 0 was observed, but never coded during observation. (See fig. 2.9 for
examples of UD habitats)
Response data
Response data were collected at 30 s intervals using one/zero continuous group
scan sampling through all playback intervals. With each 30 s interval, the presence or
absence of any anti-predator responses was recorded (see ethogram; table 2.7). If the
behavior was observed to be exhibited by any member of the group during the sample
period, it received a “1”. If not, a zero was entered for that time interval. In analysis,
30
these data were totaled for each interval then normalized for duration of the interval to
provide a frequency of behaviors per 30 s scan.
Alarm vocalizations are energetically expensive (da Cunha and Jalles-Filho,
2007) and ubiquitous in neotropical primates (Ferrari, 2009), and are appropriate proxy
measurements of risk perception (Stanford, 2002). As such, alarm vocalizations are
viewed as critically important and were the primary focus of this study. Frequency of
alarm vocalizations was used to gauge the impact of the harpy eagle vocalization
broadcasts and the appropriateness of the reaction to the perceived presence of a predator.
Vocalization data were collected by all occurrences sampling rather than one/zero, to
capture the true frequency of the behavior.
Vigilance and surveillance behaviors (aerial, terrestrial, and source scan) were
recorded when any individual was observed scanning the sky, the ground, or the source
of the avian vocalizations, where the gaze was fixed upon a point beyond the length of
that individual’s arm. This distinction was used by Treves (1997) and Cords (1990) to
distinguish vigilance behavior from foraging behavior. Although a distinction between
true vigilance and scanning for competitors, food, or mates cannot be made, it is the
contention of this methodological program that scanning for competitors or mates does
not preclude an individual from detecting predators, or vice versa. When observation
scans were being conducted, vigilance behavior was recorded as presence or absence per
scan. Vigilance data were collected when possible, but because of dense forest
conditions at BNP and RV, these data were recorded relatively infrequently. Due to the
31
inefficiency with which vigilance was recorded at RV, these data were excluded from
analysis.
2.6 - Captive experiments
To supplement the free-ranging behavior data, and to test whether appropriate
response to the perceived presence of predators is learned or instinctual, playback
experiments were conducted on two populations of captive-born brown capuchins (C.
apella). One additional playback experiment was conducted with a captive-born group of
squirrel monkeys (S. sciureus). All captive experiments (7 experiments; 217 observation
minutes) were conducted at Hiram College in Hiram, OH. IACUC approval was granted
from Hiram College (IACUC reference number: 08-009).
The data collection protocol used during captive playback experiments was
similar to that used in the field tests. The same 31-min audio file was used, though,
unlike in the field tests, focal animal sampling was possible due to high visibility in the
enclosures. One individual was chosen from each age/sex class (adult male, adult female,
juvenile [one male, one female]) for focal sampling throughout the experiment on each
experiment date (adult male: 11 September; adult female: 18 September; juvenile: 23
October). All three squirrel monkeys were males (data collected on 11 September).
Continuous focal scan sampling occurred in 30 sec intervals, and measured only response
data (see above and in table 2.7). A total of 7 observations were obtained: six with brown
capuchins (two simultaneous observation periods during each of three experiment days)
and one with squirrel monkeys.
32
Each captive colony is housed in a separate enclosure, but the enclosures are on
the same floor. These enclosures are separated by concrete walls and doors, but the area
is not sound-proof. Therefore, the playback speaker was placed in a central hallway in
such a way that the audio broadcasts could be sufficiently heard in each enclosure. With
the assistance of two observers, data were simultaneously harvested from multiple groups
during single broadcasts.
2.7 Sampling problems
The degree to which forest densiometers accurately report canopy cover has been
called into question (Cook et al., 1995). However, the device used in this study served its
purpose by providing an estimate of overall overstory density as a mechanism of
protection from detection by birds of prey circling overhead. Thus, more precise
measurements of canopy cover desired by forest ecologists were not required here.
Some portions of playback experiments have been excluded for analysis due to
loss of visual contact with the troop during the experiment. Because of unpredictable
range behavior, lack of habituation, and lack of knowledge regarding general ranging
area of the troops of squirrel monkeys at BNP, only a single sample was able to be
obtained. As such, this sample has been excluded from analysis.
Some unhabituated, skittish groups (particularly tamarins and wedge-capped
capuchins) had higher flight risk, so the initial ten minute baseline period was reduced to
five or, in some cases, zero minutes. For pairwise analyses, these empty or incomplete
lines of data were removed.
33
2.8 Statistical analysis
All statistical analyses were conducted using SPSS 16.0 and Systat Software
(SigmaStat 11.0). All histograms and boxplots were created using SigmaPlot 11.0.
Comparisons of canopy density measurements and alarm call frequencies between
playback intervals were conducted using paired t-tests. The original canopy density and
alarm frequency data were highly kurtotic (kurtosis=12.487 and 12.972, respectively),
probably due to the frequency of similar values across all five intervals. A square root
transformation (X' =√ 0.5 ; Zar, 1984) was applied to normalize the data. Subsequent
examination revealed that the distribution of the mean differences between pre- and post-
harpy eagle playback values approached normality (post-transformation kurtosis: canopy
density = 0.428; alarm frequency = 2.057). Therefore, parametric tests of hypothesis
were appropriate.
To analyze the differences in alarm call frequency between playback intervals,
different locations in Suriname, and captive-born and free-ranging populations, I
conducted a two-way repeated measures analysis of variance. To analyze possible
species-level, population-level, and treatment-level effects and their interactions, I
conducted a three-way ANOVA on data from free-ranging populations of howler
monkeys and brown capuchins at BNP and RV. Post-hoc analyses were conducted using
Bonferroni t-tests.

34
Figures and tables
Table 2.1 – Size and composition of monkey groups encountered at BNP and RV. Groups in study area at RV denoted with parentheses. Question marks indicate that individual groups were not recognized. In those cases, group differentiation was based on geographic proximity.
Species Relative group size
Social structure
Stratum occupation
Groups in study area
Diet1 Reference
Alouatta macconelli
Medium ♂-♀♀ High 6 (2) FO Julliot, 1996
Ateles paniscus
Variable / large
Fission/fusion; ♀ dispersal
High ? FR Mittermeier and van Roosmalen, 1981
Cebus apella
7-30 ♂♂-♀♀; ♂ dispersal
Mid 1 (3) O Wheeler, 2008; DiBitteti and Janson, 2001; Van Schaik and van Noordwijk, 1989
C. olivaceus
6-30 ♂♂-♀♀ Mid 2 FR, I Freese and Oppenheimer, 1981
Chiropotes satanas
Large Fission/fusion High 2? S Silva and Ferrari, 2009
Pithecia pithecia
Small ♂-♀♀ Low 3 FR, S Buchanan et al., 1981
Saguinus midas
Small ♂♂-♀♀ Low 2 I Mittermeier and van Roosmalen, 1981
Saimiri sciureus
Variable / large
♂♂-♀♀; ♂ dispersal
Low 1 FR, I Baldwin and Baldwin, 1981
2
1Fo=folivore; S=seed predator; Fr=frugivore; I=insectivore; O=omnivore

35
Table 2.2 – The documented and potential predators of primates of South America. Potential predators based on documented cases of predation by exact or similar species in other regions in the neotropics. Domestic dogs were not included as potential prey species because of a lack of significant presence within the boundaries of either park, though they may constitute a higher threat outside the borders of BNP. Species Weight1 Potential predators
Alouatta macconnelli
4.2-9.0 kg Raptors (Sherman, 1991), Tayra (Asensio and Gómez-Marín, 2002) Felids (Peetz et al., 1992)
Ateles paniscus 5.4-11.0 kg Raptors (Julliot, 1994) Felids
Cebus apella 1.3-4.8 kg Raptors (Ford and Boinski, 2007) Felids (Bianchi and Mendes, 2007) Tayra (Phillips, 1995) Serpents (Boinski, 1988)
Cebus olivaceus 2.4-3.0 kg Raptors (Ford and Boinski, 2007) Felids (Bianchi and Mendes, 2007) Tayra (Phillips, 1995) Serpents (Boinski, 1988)
Chiropotes sagulatus
1.9-4.0 kg Raptors (Martins et al., 2005) Serpents
Pithecia pithecia 0.8-2.5 kg Raptors (Ford and Boinski, 2007) Felids (Gleason and Norconk, 2002) Serpents (Gleason and Norconk, 2002) Tayra (Gleason and Norconk, 2002)
Saguinus midas 0.4-0.6 kg Raptors (Vasquez and Heymann, 2001) Tayra (Galef, 1976) Serpents (Heymann, 1987)
Saimiri sciureus 0.5-1.3 kg Raptors (pers. obs.) Tayra (Asensio and Gómez-Marín, 2002)
3
1 Weight estimates are from Ford and Davis, 1992, except C. olivaceus and S. midas, from Ford, 1994.
36
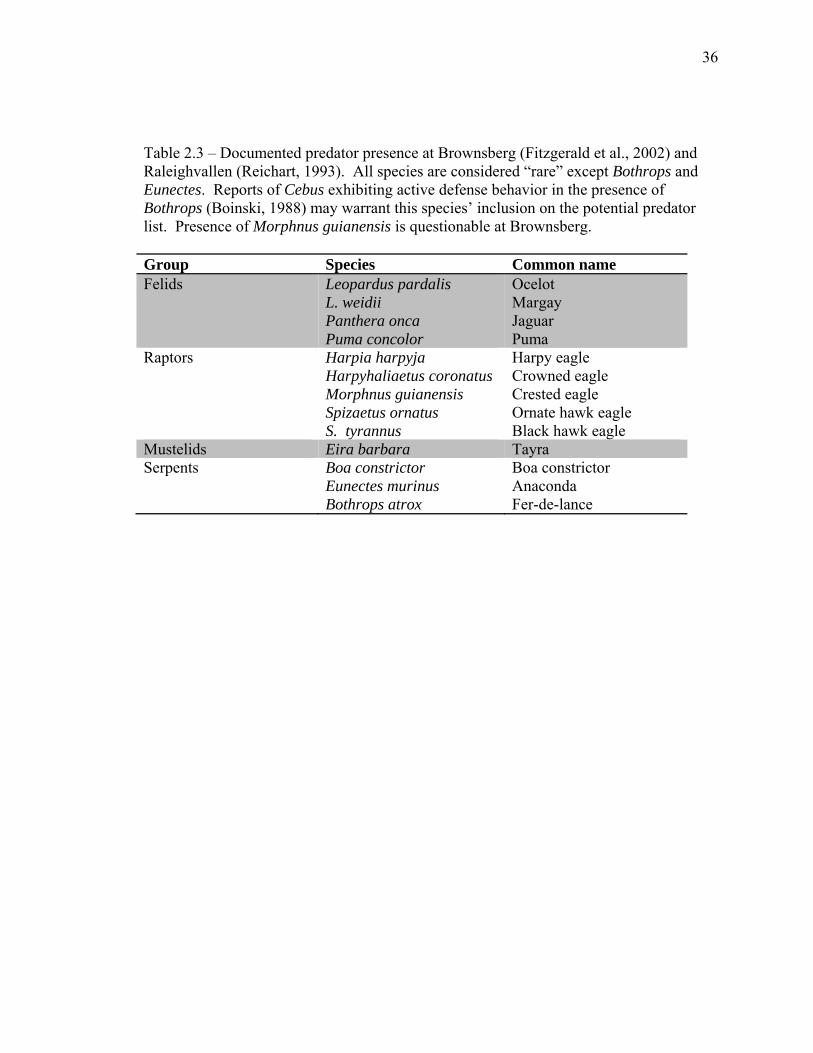
Table 2.3 – Documented predator presence at Brownsberg (Fitzgerald et al., 2002) and Raleighvallen (Reichart, 1993). All species are considered “rare” except Bothrops and Eunectes. Reports of Cebus exhibiting active defense behavior in the presence of Bothrops (Boinski, 1988) may warrant this species’ inclusion on the potential predator list. Presence of Morphnus guianensis is questionable at Brownsberg. Group Species Common name Felids Leopardus pardalis
L. weidii Panthera onca Puma concolor
Ocelot Margay Jaguar Puma
Raptors Harpia harpyja Harpyhaliaetus coronatus Morphnus guianensis Spizaetus ornatus S. tyrannus
Harpy eagle Crowned eagle Crested eagle Ornate hawk eagle Black hawk eagle
Mustelids Eira barbara Tayra Serpents Boa constrictor
Eunectes murinus Bothrops atrox
Boa constrictor Anaconda Fer-de-lance

37
Table 2.4 – Predator sightings at Brownsberg during the 2008 field season. Locations of the felid sightings suggest more than one animal in the study area. Serpent sightings were frequently observed but not recorded. No predators were observed at Raleighvallen during the study period. Date Predator Observation Observer(s)1 29 May 2008 Jaguar Tracks ON 05 June 2008 Jaguar Sighting (eye
shine) RAP Staff
06 June 2008 Ocelot Tracks CT 18 June 2008 Jaguar Sighting CT 22 June 2008 Jaguar Tracks AR, LTG 22 June 2008 Jaguar Sighting AR, LTG 27 June 2008 Tayra Sighting ON 28 June 2008 Ocelot Sighting ON 29 June 2008 Ocelot Tracks ON 30 June 2008 Jaguar Sighting Tourists 04 July 2008 Tayra Sighting ON 09 July 2008 Ornate hawk eagle Sighting MN 15 July 2008 Jaguar Scratch ON 16 July 2008 Puma Tracks AV, EG 16 July 2008 Ocelot Tracks AR, LTG 16 July 2008 Ornate hawk eagle Sighting EG 06 October 2008 Harpy eagle Feathers LTG 4
1Observers are: Andrew Ritchie (AR), Arioene Vreedzaam (AV), Cynthia Thompson (CT), Errol Gezius (EG), L. Tremaine Gregory (LTG), Marilyn Norconk (MN), Orin Neal (ON), and Conservation International Rapid Assessment Team members (RAP)

38
Table 2.5 – Protocol for playback experiments. Interval Duration Description 1 (Baseline) 10 minutes Interval 1 consisted of ten
minutes of silence
2 (Lipaugus vociferans (LV) - control)
5 minutes Interval 2 consisted of 38 intermittent LV vocalizations with slight variation in frequency, amplitude, and volume to preserve the appearance of normality
3 (Intermission) 1 minute Interval 3 was designed to allow an adjustment to any behavioral shift due to Interval 2
4 (Harpia harpyja (HH) – experiment)
5 minutes Interval 4 consisted of 29 intermittent HH vocalizations with slight variation in frequency, amplitude, and volume to preserve the appearance of normality
5 (Post-playback) 10 minutes Interval 5 consisted of ten minutes of silence
39
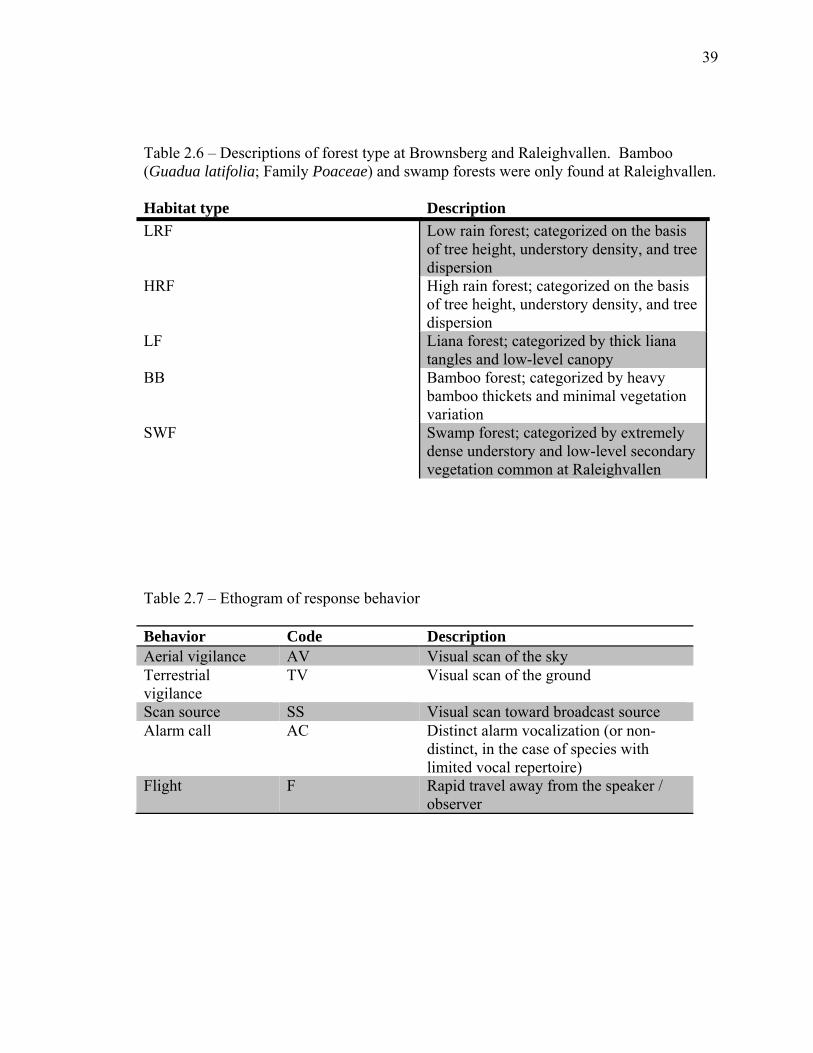
Table 2.6 – Descriptions of forest type at Brownsberg and Raleighvallen. Bamboo (Guadua latifolia; Family Poaceae) and swamp forests were only found at Raleighvallen. Habitat type Description LRF Low rain forest; categorized on the basis
of tree height, understory density, and tree dispersion
HRF High rain forest; categorized on the basis of tree height, understory density, and tree dispersion
LF Liana forest; categorized by thick liana tangles and low-level canopy
BB Bamboo forest; categorized by heavy bamboo thickets and minimal vegetation variation
SWF Swamp forest; categorized by extremely dense understory and low-level secondary vegetation common at Raleighvallen
Table 2.7 – Ethogram of response behavior Behavior Code Description Aerial vigilance AV Visual scan of the sky Terrestrial vigilance
TV Visual scan of the ground
Scan source SS Visual scan toward broadcast source Alarm call AC Distinct alarm vocalization (or non-
distinct, in the case of species with limited vocal repertoire)
Flight F Rapid travel away from the speaker / observer
40
Fig. 2.1 – Map of Suriname, South America, courtesy of University of Texas at Austin libraries. Brownsberg Nature Park and Raleighvallen are marked by blue and red circles, respectively.
41
Fig. 2.2 – Satellite image of the main study area at Brownsberg Nature Park (courtesy of Bart de Dijn).

42
Fig. 2.3 – Map of the main study area (with trails) at Brownsberg (map created by Evan Bailey). Locations of playback experiments are marked by colored stars.
43
Fig 2.4 – Map of the main study area (with playback experiment locations and other important landmarks) at Raleighvallen. The borders of the main study area were the Coppename River to the north, the Manari Canal to the west, Stream A to the south, and the eastern edge of two large bamboo patches to the east. Map is not to scale. Green triangle indicates camp location. Red and blue stars indicate C. apella and A. macconnelli playback locations, respectively.
N
Manari Canal
Coppenam
eR
iver
FunguIsland
Voltzberg Mountain Large bamboo patches
Last known Harpia harpyja nest location
~ 1 km
Stream A

44
Fig. 2.5 – Harpy eagles exert considerable predation on primates. This photograph shows a documented predation event in which a resident harpy eagle at Raleighvallen captured a squirrel monkey (2003; photograph courtesy of Stacy Neal).
45
Fig. 2.6 – Spectral display of screaming piha (Lipaugus vociferans; top) and harpy eagle (Harpia harpyja; bottom) vocalizations (courtesy of Delanie Hurst).
46
Fig. 2.7 – Degree of dispersion was quantified by neighbor proximity and intragroup positioning.
Clumped Moderate Dispersed Fig. 2.8 – Concave spherical densiometer. The densiometer consists of a large, concave spherical mirror (center) with grids etched onto its surface. The smaller sphere in the lower right hand corner of the densiometer is a level used in taking densiometer readings. Each square in the grid is mentally subdivided by the user into four smaller squares. Light allowed through the overhead canopy is depicted as points of light on the mirror surface, with four possible points of light for each square of the grid. Visible points are summed, and this sum roughly estimates percentage of unobstructed canopy. The sum multiplied by 1.04 and subtracted from 100 provides the percentage of canopy density.

47
Fig. 2.9 – Sample of habitats at Brownsberg Nature Park and Raleighvallen used for understory density (UD) estimates. UD = 1 in high rainforest habitat (above); UD = 3 in bamboo forest (below). Bamboo photograph courtesy of Stacy Neal.
CHAPTER THREE
RESULTS
3.1 Total sample sizes
Forty-one field playback experiments were conducted on eight primate species
(social groups) totaling 1271 experiment observation minutes over the course of the field
season (table 3.1). Seven experimental observations were conducted on the captive
groups at Hiram College, for a total of 217 observation minutes. As expected, sampled
groups exhibited increases in their anti-predator strategies and shifts in their habitat use
patterns with the broadcast predator vocalizations. These responses were found to be
often related to habitat variables, and responses were found to vary greatly by location.
3.2 Anti-predator response
While few anti-predator responses were observed during baseline and screaming
piha intervals, most species exhibited some response to the perceived presence of a harpy
eagle. Several social groups (n=6) rapidly fled the area in response to the initiation of the
harpy eagle broadcast. Those samples were excluded from analysis if general data could
not be collected due to rapid flight. Howler monkeys, spider monkeys, wedge-capped
capuchins, white-faced sakis, and squirrel monkeys all exhibited flight so rapid that
visual contact with the focal group was lost at some point during the experiments.
In total, 26 rapid flight responses were recorded in interval 4 (0.28 bouts per
minute), and 11 in interval 5 (0.037 bouts per minute). Only 4 flight responses were
recorded during screaming piha broadcasts (interval 2; 0.02 bouts per minute). Flight
48
49
responses during the 10 min baseline interval (2 by brown capuchins and 1 by tamarins;
0.008 bouts per minute) were probably related to the presence of observers or the level of
anthropogenic noise disturbance (tourist groups, construction, etc.) in the area. No flight
responses were recorded during the 1 min intermission interval.
Although white-faced sakis emitted no alarm vocalizations in response to
playback experiments, they did occasionally emit chucks, whistles and z-trills during
intervals 4 and 5. During one playback experiment with a group of white-faced sakis, the
group became highly agitated, emitting chuck vocalizations and rapidly fleeing the area.
During this period, a relatively independent juvenile repeatedly attempted to climb onto a
neighboring adult female’s dorsum and underbelly. These actions received considerable
resistance from the female, who repeatedly tugged at the juvenile and rejected his
attempts to be carried. The female emitted frequent chucks and scanned the source of the
broadcast while attempting to flee the area.
Spider monkeys also exhibited several interesting anecdotal behaviors. During
one experiment in which the observed social group consisted wholly of an adult female
and a single independent juvenile, the adult female rapidly ascended to the top of a Virola
sp. tree immediately following the initiation of interval 4. The juvenile descended to
mid-strata while the adult female remained vigilant and emitted alarm vocalizations. At
the end of the experiment, the juvenile resumed foraging behavior while the adult female
continued to scan the area around the feeding tree.
During a separate spider monkey experiment, several adult individuals responded
to the initiation of the harpy eagle broadcast by moving immediately to the area directly
50
above the playback speaker and dropping large branches onto it. Anecdotally, there
appeared to be a direct relationship between spider monkey group size and the length of
the display period, the number of calls emitted, and the intensity of response. This
anecdotal evidence may support the suggestion by Chapman and colleagues (1990) that
number of kin in proximity to a caller may impact intensity and duration of alarm calls in
other species of Ateles. On the other hand, the duration and intensity of response may
increase with an increase in population density of a group.
In 4 of 41 experiments (9.76 %), a previously unseen group of howler monkeys
vocalized in response to the harpy eagle broadcast. Also, on one occasion, a group of
spider monkeys was only noticed by observers once they began emitting alarm
vocalizations in response to the initiation of harpy eagle broadcasts. In this situation, the
spider monkey group (N=7) emitted 63 alarm vocalizations and exhibited 3 branch-
break/mob displays over a 15 minute period.
Vigilance behavior
White-faced sakis exhibited the highest rates of vigilance of all species, followed
by brown capuchins, howler monkeys, and spider monkeys (fig. 3.1). Tamarins exhibited
relatively low rates of vigilance. Poor sample sizes, visibility issues, and lack of
habituation led to absent vigilance scores for bearded sakis and squirrel monkeys. No
vigilance data were collected from Ralighvallen due to these visibility issues. Unlike any
other species in this study, spider monkeys exhibited higher mean rates of terrestrial
vigilance and source-scanning behavior than aerial vigilance. This is potentially a
51
reflection of the strata most frequently occupied by the species. Surprisingly, aerial (ρ= -
0.087, p=0.258; n=171) and source-scanning (ρ= -0.0736; p=0.338; n=171) vigilance
rates did not correlate with group size, though terrestrial vigilance rates did show a
slightly negative relationship (ρ= -0.176; p=0.021; n=171).
Rates of vigilance behavior were affected by playback interval, as expected (fig.
3.2). When corrected for interval duration, mean aerial vigilance and source scanning
increased with harpy eagle broadcasts, but the same pattern applied only slightly to
terrestrial vigilance. Rates of aerial and terrestrial vigilance returned to baseline levels
after cessation of the harpy eagle broadcasts, though source scanning behavior remained
at elevated levels when compared to rates exhibited during screaming piha broadcasts.
Alarm vocalizations
A total of 653 total alarm vocalizations were recorded during this study, none of
which were recorded during the 1-min intermission interval between screaming piha and
harpy eagle playback (table 3.2). As such, that interval was discarded from analysis of
alarm frequencies. Thirty alarm vocalizations (4.59% of the total) were recorded during
the baseline period, interval 1, by all species save howler monkeys and white-faced sakis.
26 alarms (3.98%) were recorded during the screaming piha broadcast, all of which were
emitted by bearded sakis. As expected, the harpy eagle broadcast and post-harpy
playback period elicited the highest percentage of alarm vocalizations, with the majority
(344; 52.68%) occurring during interval 4 (harpy eagle playback). The remaining 253
alarm vocalizations occurred during the post-playback interval, constituting 38.74% of

52
the total. It should be noted that the baseline and post-playback intervals were each 10
min in duration, while the broadcast intervals (piha and harpy) each lasted 5 min. Data
were corrected for interval duration prior to analysis.
Wedge-capped capuchins and spider monkeys emitted the most vocalizations,
followed by bearded sakis and brown capuchins (fig. 3.3). Howler monkeys, squirrel
monkeys, and tamarins produced alarm vocalizations at low frequencies, while white-
faced sakis failed to produce a single vocalization during any experiment. There was a
positive relationship found between group size and alarm frequency (ρ=0.371; p<0.0001;
n=172). However, among those species that emitted any alarm vocalizations during any
interval, frequency was higher in interval 4 than any other (table 3.2).
Analysis of alarm frequency was best conducted by paired samples t-tests,
because of repeated measurements of the same groups. Data were paired according to the
available data. Missing lines resulted in exclusion of those pairs, which resulted in 29
paired observations. A considerably higher frequency of alarm vocalizations are
associated with post-initiation of harpy eagle vocalization broadcast intervals than in
intervals before them (intervals B and A, respectively) (see fig. 3.4).
The mean difference between intervals A and B was -1.205 alarm vocalizations,
showing that alarm frequencies significantly (t28= -2.638; p=0.013, 2-tailed) increased
with the onset of harpy eagle broadcasts (table 3.3). Therefore, the probability that harpy
broadcasts in any given sample will increase baseline alarm call frequency by 0.43 to
1.98 is 95%. The standardized distance is 1.206, indicating that the average frequency of
alarm vocalizations in interval A was more than one common standard deviation from the
53
average in interval B. This indicates that the difference in alarm behavior, while
significant, is fairly small. However, this analysis included mean differences between
species that emitted no vocalizations (white-faced sakis) and those who did so
infrequently (tamarins), which may partially explain the results.
In the interest of caution, the non-parametric equivalent to the test of hypothesis
employed above (Wilcoxon signed rank test) was also run on non-transformed variables.
These results were consistent with those described above, in that frequency of alarm
vocalizations was shown to be significantly higher in Interval B than Interval A (Z =
3.455; p=0.001).
No significant relationship was found between time of day and alarm frequency
(ρ=0.0459; p=0.55). There were no significant correlations found between alarm
vocalization behavior and aerial (ρ=0.0358; p=0.641) or terrestrial (ρ= -0.0804; p=0.296)
vigilance, but there may be a slight relationship between alarm vocalizations and source-
scanning behavior (ρ=0.177; p=0.021).
3.3 General habitat use
Data were collected on spatial occupation, overstory density, understory density,
and forest type during experimental observation. Because of the significant anti-predator
responses described above, it was concluded that the broadcasts of harpy eagle
vocalizations was efficient at simulating the presence of a significant neotropical predator
and eliciting responses. Therefore, habitat variables were analyzed by playback interval
to investigate changes in habitat use as they pertained to the perceived presence of
54
predators and as general predator avoidance strategies. Overall, many of the patterns of
habitat use observed in the sampled social groups can be explained in these terms.
Spatial occupation
Estimated height in the forest was examined in terms of height range (average
lowest individual and average highest) and height differential, or hmax - hmin. The
combined mean across species reflected a range of 11-17 m above the ground, with a
range of intraspecifc means from 1 m to 28 m (table 3.4). Squirrel monkeys occupied the
lowest strata, though the range was based on only one experiment. Four other species
(brown capuchins, tamarins, white-faced sakis, and wedge-capped capuchins) were lower
than 10 m at the low end of their mean height ranges. This contrasts with bearded sakis
and spider monkeys, whose minimum height during playback experiments exceeded 20
m. Height differential reflected the vertical area of space occupied by a group. Brown
capuchins and wedge-capped capuchins had the highest mean height differential, while
white-faced sakis had the lowest (table 3.4).
During playback experiments, spatial occupation across all species was highly
variable, ranging from 2 m x 2 m to 100 m x 150 m (table 3.4). A strongly positive
relationship between length and width of spatial dispersion (ρ=0.7; p<0.0001; n=173)
indicates simply that an increase in one dimension is associated with a simultaneous
increase in the other. The overall interspecific mean spatial occupation (21 m x 32 m)
suggests that social groups of many of the species in this study occupy relatively small
patches of forest, and spatial positioning data suggest that they are relatively clumped
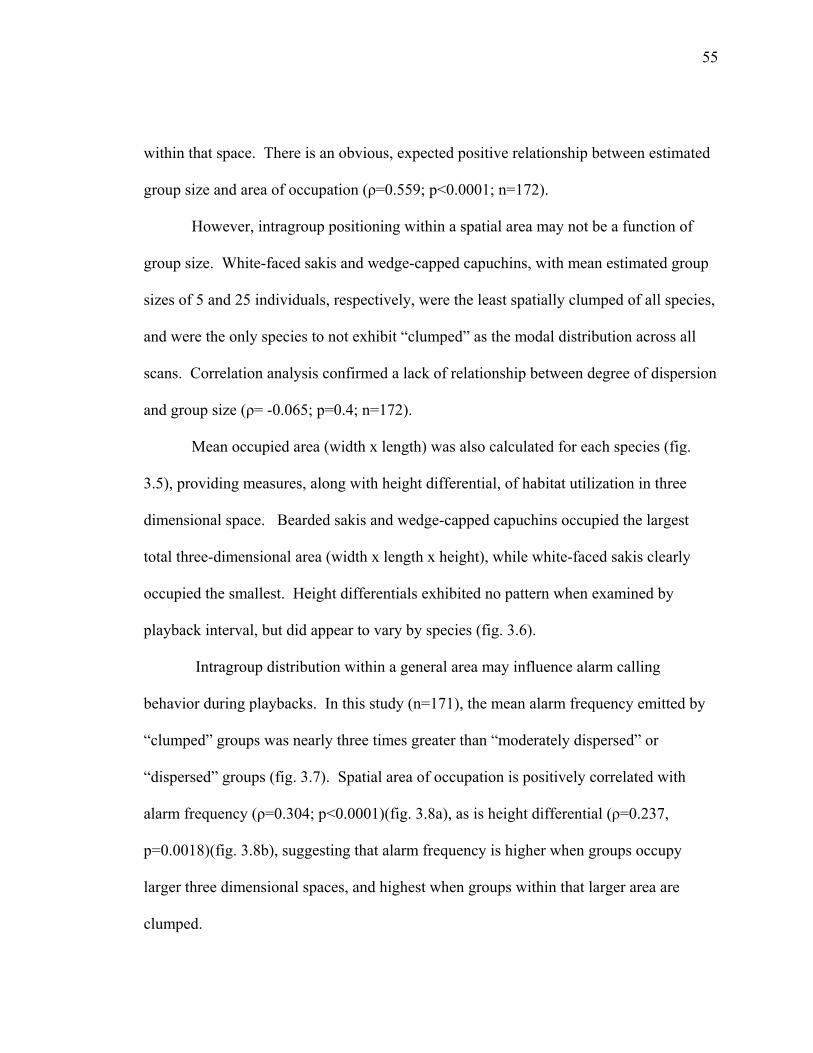
55
within that space. There is an obvious, expected positive relationship between estimated
group size and area of occupation (ρ=0.559; p<0.0001; n=172).
However, intragroup positioning within a spatial area may not be a function of
group size. White-faced sakis and wedge-capped capuchins, with mean estimated group
sizes of 5 and 25 individuals, respectively, were the least spatially clumped of all species,
and were the only species to not exhibit “clumped” as the modal distribution across all
scans. Correlation analysis confirmed a lack of relationship between degree of dispersion
and group size (ρ= -0.065; p=0.4; n=172).
Mean occupied area (width x length) was also calculated for each species (fig.
3.5), providing measures, along with height differential, of habitat utilization in three
dimensional space. Bearded sakis and wedge-capped capuchins occupied the largest
total three-dimensional area (width x length x height), while white-faced sakis clearly
occupied the smallest. Height differentials exhibited no pattern when examined by
playback interval, but did appear to vary by species (fig. 3.6).
Intragroup distribution within a general area may influence alarm calling
behavior during playbacks. In this study (n=171), the mean alarm frequency emitted by
“clumped” groups was nearly three times greater than “moderately dispersed” or
“dispersed” groups (fig. 3.7). Spatial area of occupation is positively correlated with
alarm frequency (ρ=0.304; p<0.0001)(fig. 3.8a), as is height differential (ρ=0.237,
p=0.0018)(fig. 3.8b), suggesting that alarm frequency is higher when groups occupy
larger three dimensional spaces, and highest when groups within that larger area are
clumped.
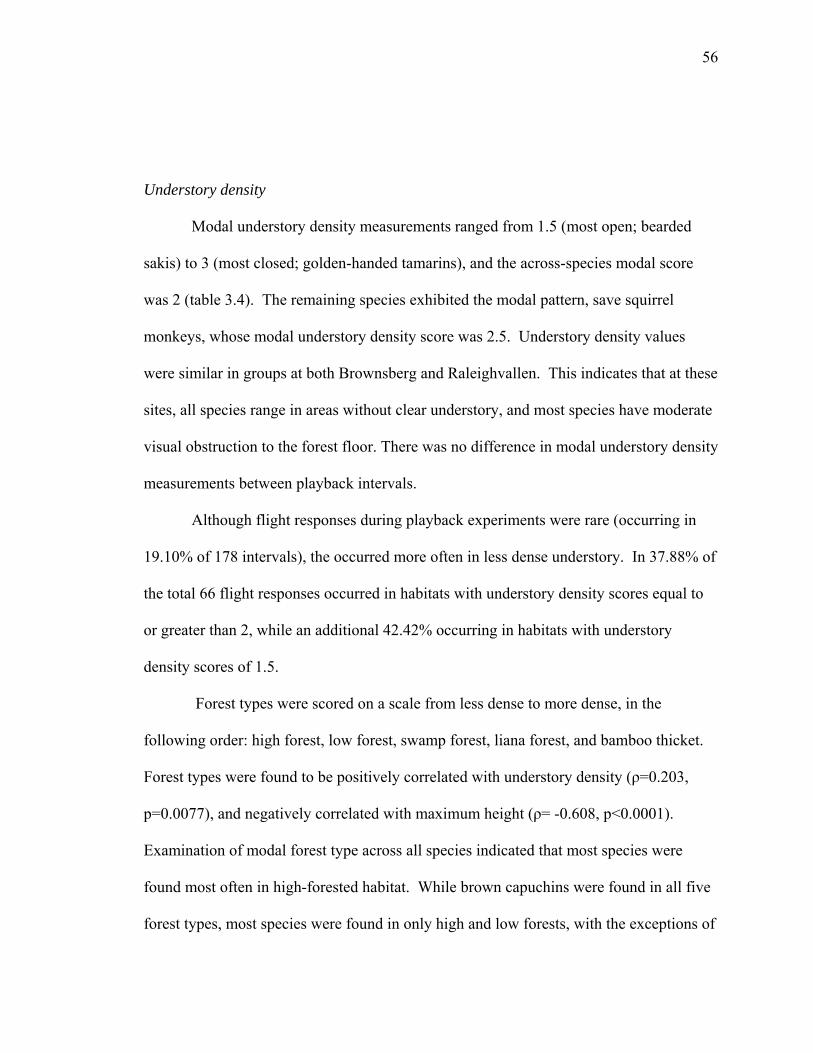
56
Understory density
Modal understory density measurements ranged from 1.5 (most open; bearded
sakis) to 3 (most closed; golden-handed tamarins), and the across-species modal score
was 2 (table 3.4). The remaining species exhibited the modal pattern, save squirrel
monkeys, whose modal understory density score was 2.5. Understory density values
were similar in groups at both Brownsberg and Raleighvallen. This indicates that at these
sites, all species range in areas without clear understory, and most species have moderate
visual obstruction to the forest floor. There was no difference in modal understory density
measurements between playback intervals.
Although flight responses during playback experiments were rare (occurring in
19.10% of 178 intervals), the occurred more often in less dense understory. In 37.88% of
the total 66 flight responses occurred in habitats with understory density scores equal to
or greater than 2, while an additional 42.42% occurring in habitats with understory
density scores of 1.5.
Forest types were scored on a scale from less dense to more dense, in the
following order: high forest, low forest, swamp forest, liana forest, and bamboo thicket.
Forest types were found to be positively correlated with understory density (ρ=0.203,
p=0.0077), and negatively correlated with maximum height (ρ= -0.608, p<0.0001).
Examination of modal forest type across all species indicated that most species were
found most often in high-forested habitat. While brown capuchins were found in all five
forest types, most species were found in only high and low forests, with the exceptions of

57
black spider monkeys (observed only in high forest habitat) and golden-handed tamarins
(observed only in low forest habitat)(fig. 3.9). Bamboo and swamp forest habitats were
only found at Raleighvallen.
Understory density appeared to have an inverse effect on rates of vigilance, with
mean incidences of aerial vigilance and source-scanning behavior per scan decreasing
with an increase in the degree of understory density (fig. 3.10). Paradoxically, forest type
also appeared to influence frequency of aerial vigilance, but not terrestrial vigilance or
source-scanning behavior. Higher aerial vigilance frequencies were recorded in low
forest and liana forest than in high forest habitats (fig. 3.11). This may indicate that
although there is generally a positive relationship between forest type and understory
density, there is a substantial range of variation in understory density within forest type.
Forest type may also have influenced the frequency of alarm calling behavior
(fig. 3.12). The highest frequencies of alarm vocalizations were recorded in bamboo
patches, high rainforest, and swamp forest, though alarm vocalizations were recorded in
all five habitat types.
Percentages of overstory density from densiometer readings
Canopy cover ranged from relatively open (11.60%) to closed (98.96%) (n=176),
with an average densiometer measurement of overstory density of 83.33%. While these
data suggest that primates in Suriname range under relatively dense canopy cover, there
was some noticeable variation when densiometer readings were considered by playback
interval (see below).
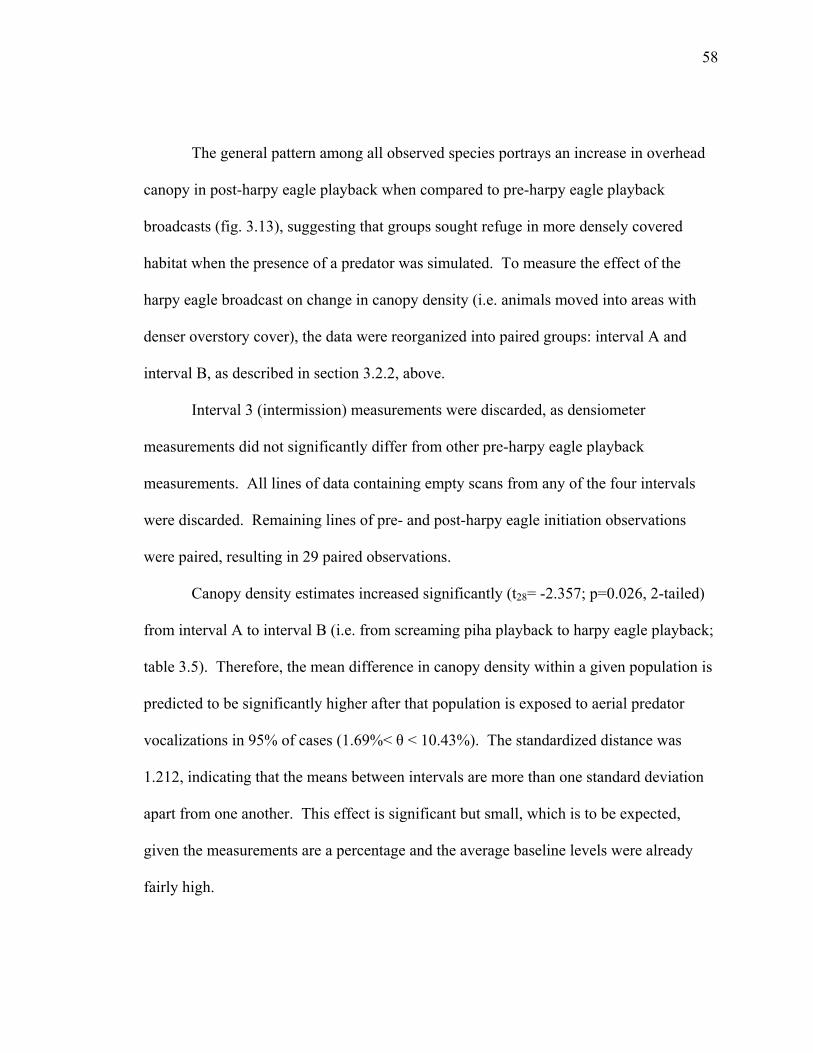
58
The general pattern among all observed species portrays an increase in overhead
canopy in post-harpy eagle playback when compared to pre-harpy eagle playback
broadcasts (fig. 3.13), suggesting that groups sought refuge in more densely covered
habitat when the presence of a predator was simulated. To measure the effect of the
harpy eagle broadcast on change in canopy density (i.e. animals moved into areas with
denser overstory cover), the data were reorganized into paired groups: interval A and
interval B, as described in section 3.2.2, above.
Interval 3 (intermission) measurements were discarded, as densiometer
measurements did not significantly differ from other pre-harpy eagle playback
measurements. All lines of data containing empty scans from any of the four intervals
were discarded. Remaining lines of pre- and post-harpy eagle initiation observations
were paired, resulting in 29 paired observations.
Canopy density estimates increased significantly (t28= -2.357; p=0.026, 2-tailed)
from interval A to interval B (i.e. from screaming piha playback to harpy eagle playback;
table 3.5). Therefore, the mean difference in canopy density within a given population is
predicted to be significantly higher after that population is exposed to aerial predator
vocalizations in 95% of cases (1.69%< θ < 10.43%). The standardized distance was
1.212, indicating that the means between intervals are more than one standard deviation
apart from one another. This effect is significant but small, which is to be expected,
given the measurements are a percentage and the average baseline levels were already
fairly high.
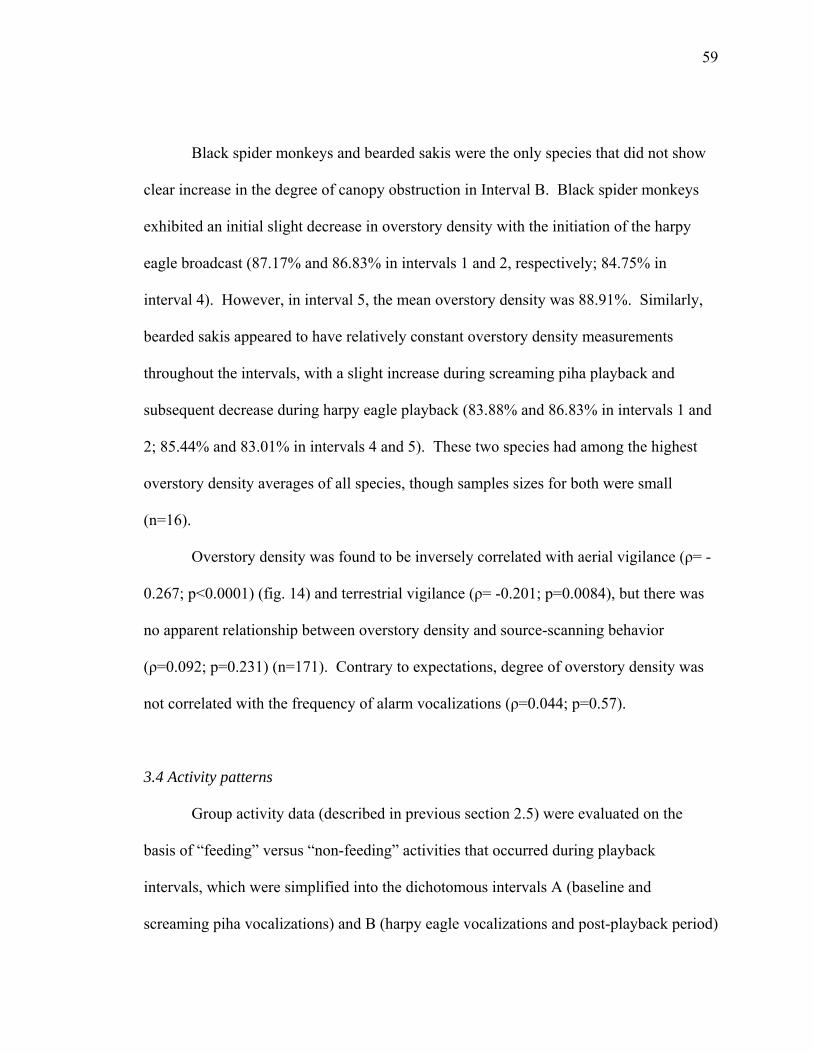
59
Black spider monkeys and bearded sakis were the only species that did not show
clear increase in the degree of canopy obstruction in Interval B. Black spider monkeys
exhibited an initial slight decrease in overstory density with the initiation of the harpy
eagle broadcast (87.17% and 86.83% in intervals 1 and 2, respectively; 84.75% in
interval 4). However, in interval 5, the mean overstory density was 88.91%. Similarly,
bearded sakis appeared to have relatively constant overstory density measurements
throughout the intervals, with a slight increase during screaming piha playback and
subsequent decrease during harpy eagle playback (83.88% and 86.83% in intervals 1 and
2; 85.44% and 83.01% in intervals 4 and 5). These two species had among the highest
overstory density averages of all species, though samples sizes for both were small
(n=16).
Overstory density was found to be inversely correlated with aerial vigilance (ρ= -
0.267; p<0.0001) (fig. 14) and terrestrial vigilance (ρ= -0.201; p=0.0084), but there was
no apparent relationship between overstory density and source-scanning behavior
(ρ=0.092; p=0.231) (n=171). Contrary to expectations, degree of overstory density was
not correlated with the frequency of alarm vocalizations (ρ=0.044; p=0.57).
3.4 Activity patterns
Group activity data (described in previous section 2.5) were evaluated on the
basis of “feeding” versus “non-feeding” activities that occurred during playback
intervals, which were simplified into the dichotomous intervals A (baseline and
screaming piha vocalizations) and B (harpy eagle vocalizations and post-playback period)

60
(as above in section 3.2.2) for evaluation. The modal activity for all species throughout
both periods was “stationary foraging.”
Overall activity patterning of the intermission period was not found to be aberrant
to period A (37.84% stationary feeding, 24.32% stationary non-feeding, 37.84%
traveling). Therefore, the intermission interval (1 min) was excluded to temporally
equate periods A and B. Two categories were excluded from analysis due to their rarity:
stationary resting behavior and medium-rate travel/forage.
When feeding behavior (all intervals containing any combinatorial feeding
behavior: feeding while traveling, feeding while resting, feeding while stationary) was
compared to non-feeding behavior (exclusively stationary behavior), a dramatic pattern
was revealed. Of 137 total activity intervals involving feeding behavior, 103 occurred
during period A (75.18 % feeding, 24.82% non-feeding). In period B, activity patterns
shifted significantly, with 33 of the 44 (75.00%) total non-feeding bouts occurring during
that period. The modal activity budgets during playback intervals show a preference for
stationary, non-foraging behavior during period B, where stationary behavior is
comparatively rare during period A.
Stationary non-feeding behavior (including resting behavior, which contributed to
11.69% of the activity in interval A, but only 1.49% in interval B) constituted 15 of 77
total counts, or 19.48% of scans within period A (fig. 3.15a). Stationary non-feeding
behavior, including rest, constituted 50.75% of all scans within period B (fig. 3.15b).
While stationary foraging behavior was fairly prevalent within interval A scans (45.45%),
it made up only 14.93% of scans in interval B. Finally, with resting behavior excluded
61
from interval A scan samples, only 7.79% of the scans include stationary non-feeding
behavior. When the harpy eagle broadcast interval (interval 4) is isolated (n=35),
stationary behavior is the modal pattern, occurring in 20 samples (57.14%).
Traveling behavior constituted 35.06% and 34.33% of the activity scans in
intervals A and B, respectively. This suggests that while travel behavior appeared
relatively consistent, the modal patterning of stationary non-foraging behavior was highly
variable. In addition, it is worth mention that when all feeding vs. non-feeding categories
are analyzed (travel and stationary non-feeding vs. travel and stationary feeding), the
activity comparison revealed is 71.43% to 20.90% feeding in periods A and B,
respectively. Fast-rate travel behavior was only observed during interval B (5.97% of
scans), and overall non-feeding travel time was more prevalent in interval B (9.09% in
interval A; 28.36% in interval B).
3.5 Differential alarm and vigilance response by location
Brown capuchin response data were isolated and analyzed to compare anti-
predator responses between three locations: Raleighvallen, Brownsberg, and Hiram
College. Brown capuchin reactions to harpy eagle broadcasts varied by location, but
individuals in all three locations emitted alarm vocalizations during playback
experiments. However, alarm frequencies and responses by playback interval varied
between wild and captive populations (fig. 3.16), suggesting that the more “appropriate”
level of alarm response was elicited by wild monkeys. The overall alarm frequency was

62
found to be higher within Raleighvallen populations than in either Brownsberg or Hiram
College populations (fig. 3.17).
A repeated measures two-way analysis of variance was conducted to test the
effects of playback interval and park on alarm call frequency. There were very highly
significant effects of playback interval (F3=17.32; p<0.001) and location (F2=12.033;
p=0.002), as well as a very highly significant interaction between the two (F6=13.034;
p<0.001) (table 3.6). As expected, subsequent Bonferroni t-test pairwise comparisons
(table 3.7) illustrated that the only note-worthy, significant comparison in alarm
frequency was “park” by “interval 4” (Brownsberg vs. Raleighvallen vs. Hiram College,
during the harpy eagle broadcast). Difference in brown capuchin alarm frequency was
significantly expressed when comparing the response of Raleighvallen populations to
harpy eagle broadcasts with captive response to the same (t=9.563; p<0.001), and in
comparing Raleighvallen response to harpy broadcasts with Brownsberg response to the
same (t=8.428; p<0.001). Comparisons of response to harpy broadcasts between brown
capuchin groups at Brownsberg and Hiram College were not significant (t=0.503).
Similarly, brown capuchin mean alarm frequency was significantly higher in playback
interval 4 than in intervals 1, 2 (t=8.46; p<0.001), and 5(t=8.195; p<0.001) at RV (table
3.8), but not significantly different at Brownsberg or Hiram College (table 3.9). The
results obtained from running repeated measures ANOVA were not substantially
different from those obtained by a standard two-way ANOVA.
A two-way analysis of variance was conducted to measure differences in
response behavior between Brownsberg and Raleighvallen populations of brown
63
capuchins and howler monkeys. Results were consistent with two-way analyses
described above. Significant differences in mean alarm call frequencies were found in
“playback interval” (F4=14.803; p<0.001) and “park” (F1=8.687; p=0.004), with a highly
significant interaction between the two (F1=11.271; p<0.001).
Within the Raleighvallen subset, alarm response to interval 4 (harpy eagle
broadcast) was significantly higher than all other intervals, and none of the other intervals
were significantly different from any other. Likewise, the bulk of the “park” variation in
mean was explained by comparing alarm response within interval 4 between
Raleighvallen and Brownsberg, the results of which indicated that alarm response
frequency was significantly higher at Raleighvallen (t=7.202; p<0.001).
A three-way ANOVA was also conducted, to measure the effect, if any, of species
membership on differences between mean alarm frequencies by location. A significant
interaction (table 3.10) was found between species, location, and playback interval
(F4=6.875; p<0.001). However, the source of this variance appears to be largely
attributed to higher species-interval interaction within howlers and brown capuchins at
Brownsberg (p<0.001) than at Raleighvallen (p=0.734).
Aerial and terrestrial vigilance frequencies did not appear to be significantly
different between Brownsberg and Hiram College locations (fig. 3.18), and insufficient
data prevented a comparison between Raleighvallen and these two locations. However,
the Hiram College population of brown capuchins exhibited a substantially greater
frequency of source scanning behavior than those populations at either Brownsberg or
Raleighvallen (fig. 3.19).
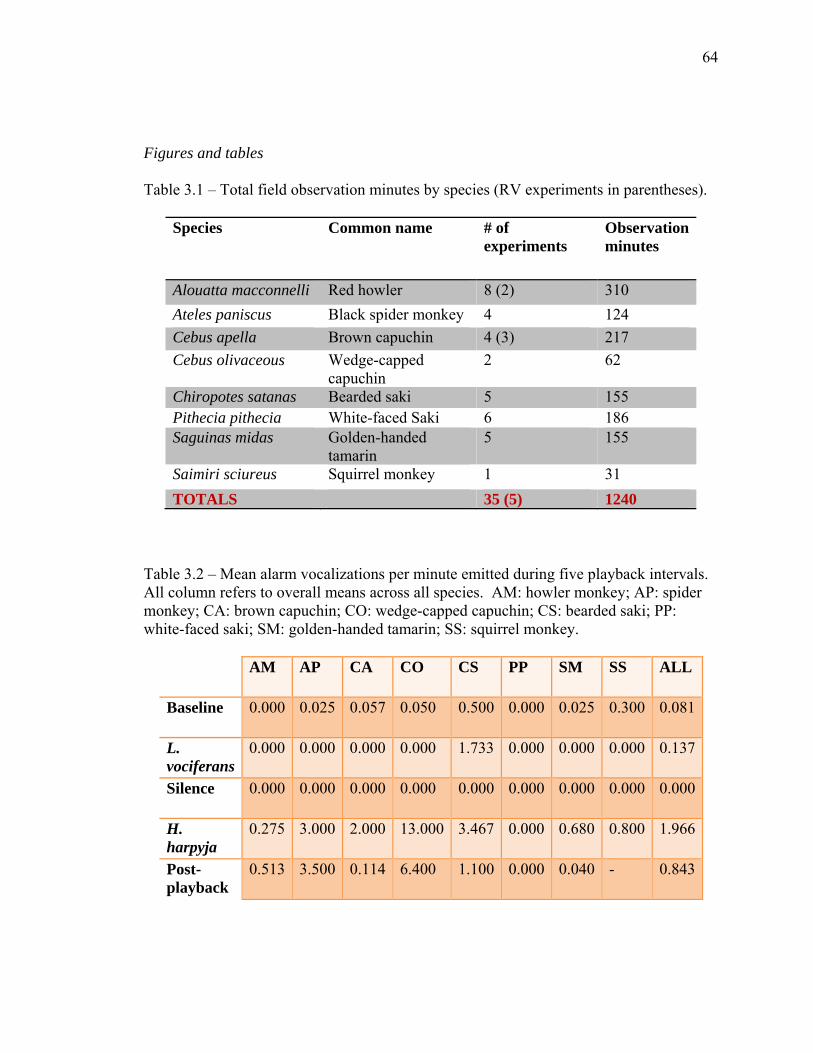
64
Figures and tables
Table 3.1 – Total field observation minutes by species (RV experiments in parentheses).
Species Common name # of experiments
Observation minutes
Alouatta macconnelli Red howler 8 (2) 310 Ateles paniscus Black spider monkey 4 124 Cebus apella Brown capuchin 4 (3) 217 Cebus olivaceous Wedge-capped
capuchin 2 62
Chiropotes satanas Bearded saki 5 155 Pithecia pithecia White-faced Saki 6 186 Saguinas midas Golden-handed
tamarin 5 155
Saimiri sciureus Squirrel monkey 1 31 TOTALS 35 (5) 1240
Table 3.2 – Mean alarm vocalizations per minute emitted during five playback intervals. All column refers to overall means across all species. AM: howler monkey; AP: spider monkey; CA: brown capuchin; CO: wedge-capped capuchin; CS: bearded saki; PP: white-faced saki; SM: golden-handed tamarin; SS: squirrel monkey.
AM AP CA CO CS PP SM SS ALL
Baseline 0.000 0.025 0.057 0.050 0.500 0.000 0.025 0.300 0.081
L. vociferans
0.000 0.000 0.000 0.000 1.733 0.000 0.000 0.000 0.137
Silence 0.000 0.000 0.000 0.000 0.000 0.000 0.000 0.000 0.000
H. harpyja
0.275 3.000 2.000 13.000 3.467 0.000 0.680 0.800 1.966
Post-playback
0.513 3.500 0.114 6.400 1.100 0.000 0.040 - 0.843
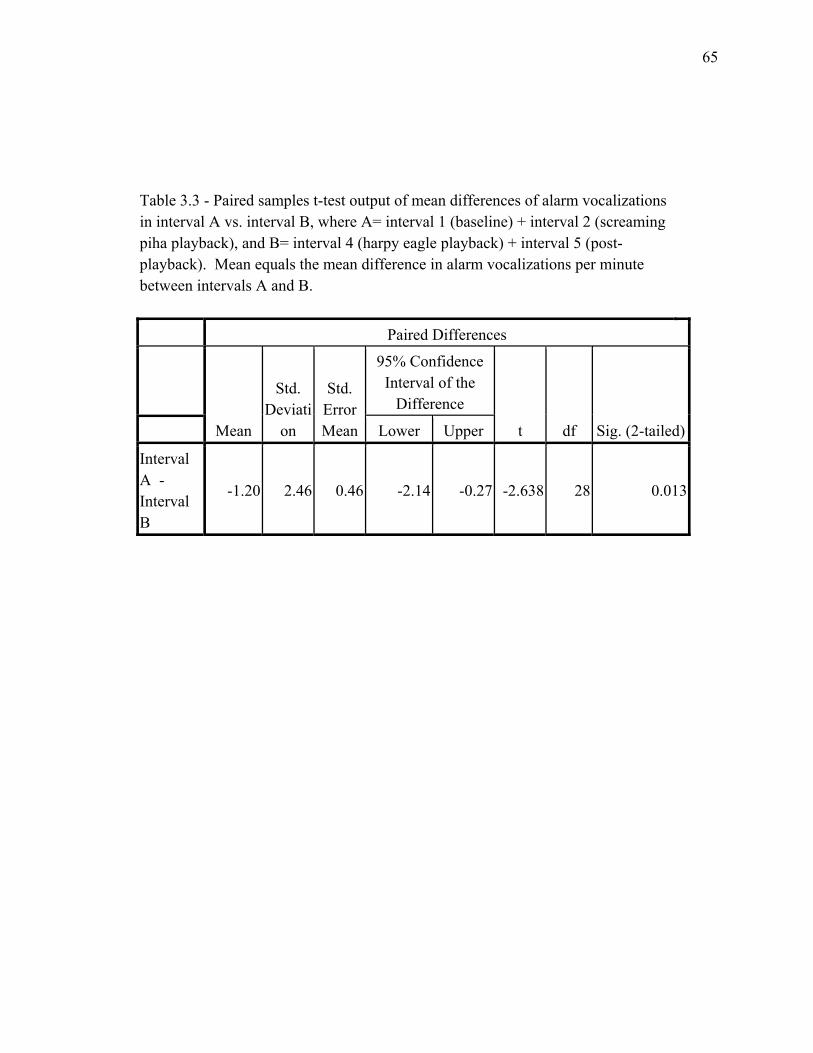
65
Table 3.3 - Paired samples t-test output of mean differences of alarm vocalizations in interval A vs. interval B, where A= interval 1 (baseline) + interval 2 (screaming piha playback), and B= interval 4 (harpy eagle playback) + interval 5 (post-playback). Mean equals the mean difference in alarm vocalizations per minute between intervals A and B.
Paired Differences
Mean
Std. Deviati
on
Std. Error Mean
95% Confidence Interval of the
Difference
t df Sig. (2-tailed) Lower Upper
Interval A - Interval B
-1.20 2.46 0.46 -2.14 -0.27 -2.638 28 0.013
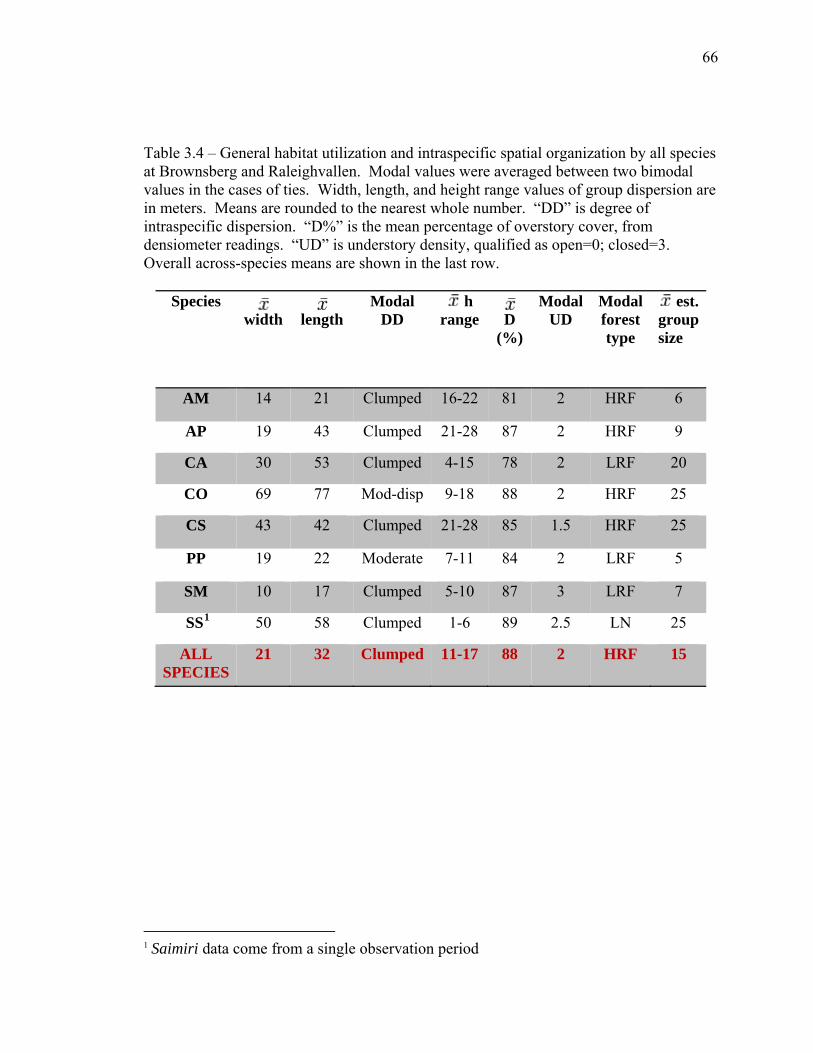
66
Table 3.4 – General habitat utilization and intraspecific spatial organization by all species at Brownsberg and Raleighvallen. Modal values were averaged between two bimodal values in the cases of ties. Width, length, and height range values of group dispersion are in meters. Means are rounded to the nearest whole number. “DD” is degree of intraspecific dispersion. “D%” is the mean percentage of overstory cover, from densiometer readings. “UD” is understory density, qualified as open=0; closed=3. Overall across-species means are shown in the last row.
Species width
length
Modal DD
h range
D
(%)
Modal UD
Modal forest type
est. group size
AM 14 21 Clumped 16-22 81 2 HRF 6
AP 19 43 Clumped 21-28 87 2 HRF 9
CA 30 53 Clumped 4-15 78 2 LRF 20
CO 69 77 Mod-disp 9-18 88 2 HRF 25
CS 43 42 Clumped 21-28 85 1.5 HRF 25
PP 19 22 Moderate 7-11 84 2 LRF 5
SM 10 17 Clumped 5-10 87 3 LRF 7
SS1 50 58 Clumped 1-6 89 2.5 LN 25
ALL SPECIES
21 32 Clumped 11-17 88 2 HRF 15
1 Saimiri data come from a single observation period
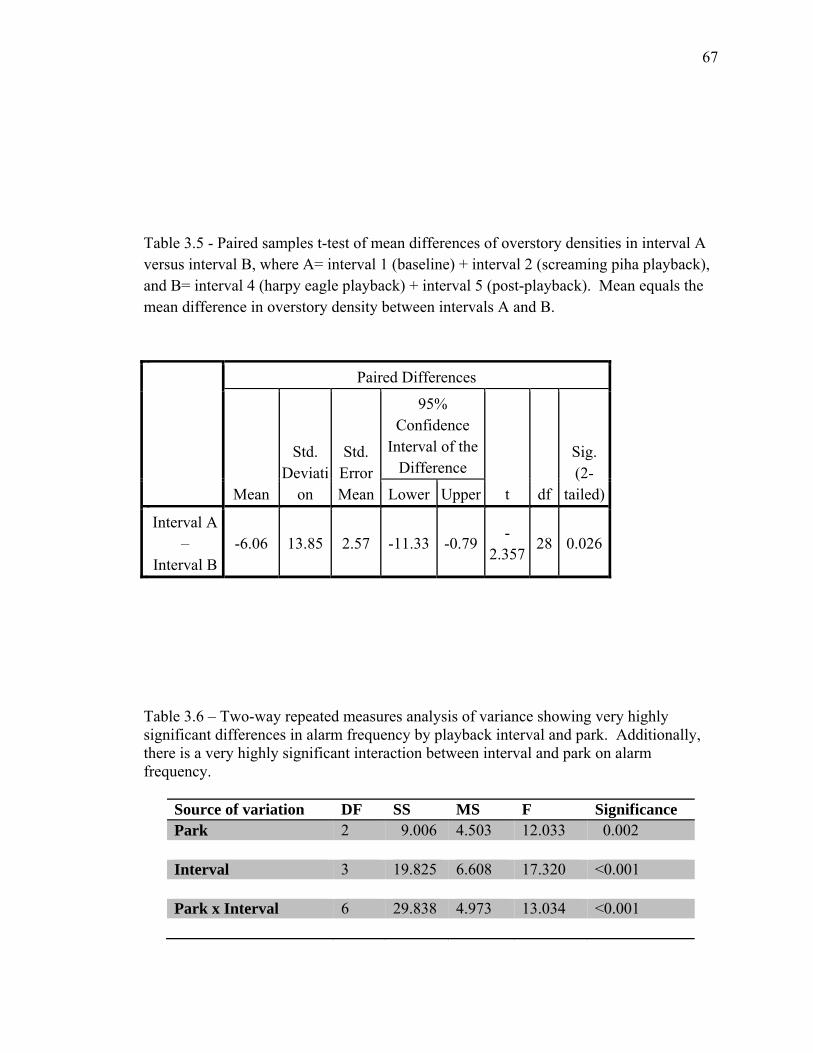
67
Table 3.5 - Paired samples t-test of mean differences of overstory densities in interval A versus interval B, where A= interval 1 (baseline) + interval 2 (screaming piha playback), and B= interval 4 (harpy eagle playback) + interval 5 (post-playback). Mean equals the mean difference in overstory density between intervals A and B. Paired Differences
Mean
Std. Deviati
on
Std. Error Mean
95% Confidence
Interval of the Difference
t df
Sig. (2-
tailed) Lower Upper
Interval A –
Interval B -6.06 13.85 2.57 -11.33 -0.79
-2.357
28 0.026
Table 3.6 – Two-way repeated measures analysis of variance showing very highly significant differences in alarm frequency by playback interval and park. Additionally, there is a very highly significant interaction between interval and park on alarm frequency.
Source of variation DF SS MS F Significance Park 2 9.006 4.503 12.033 0.002 Interval 3 19.825 6.608 17.320 <0.001 Park x Interval 6 29.838 4.973 13.034 <0.001
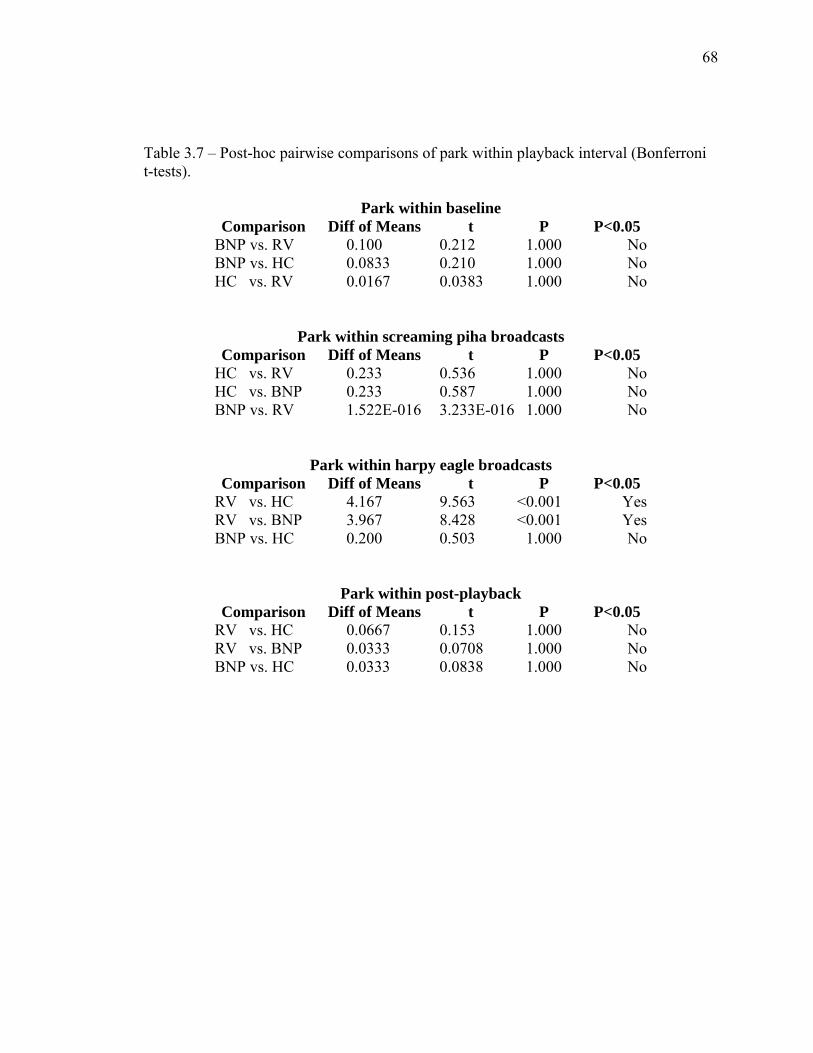
68
Table 3.7 – Post-hoc pairwise comparisons of park within playback interval (Bonferroni t-tests).
Park within baseline
Comparison Diff of Means t P P<0.05 BNP vs. RV 0.100 0.212 1.000 No BNP vs. HC 0.0833 0.210 1.000 No HC vs. RV 0.0167 0.0383 1.000 No
Park within screaming piha broadcasts Comparison Diff of Means t P P<0.05
HC vs. RV 0.233 0.536 1.000 No HC vs. BNP 0.233 0.587 1.000 No BNP vs. RV 1.522E-016 3.233E-016 1.000 No
Park within harpy eagle broadcasts Comparison Diff of Means t P P<0.05
RV vs. HC 4.167 9.563 <0.001 Yes RV vs. BNP 3.967 8.428 <0.001 Yes BNP vs. HC 0.200 0.503 1.000 No
Park within post-playback Comparison Diff of Means t P P<0.05
RV vs. HC 0.0667 0.153 1.000 No RV vs. BNP 0.0333 0.0708 1.000 No BNP vs. HC 0.0333 0.0838 1.000 No
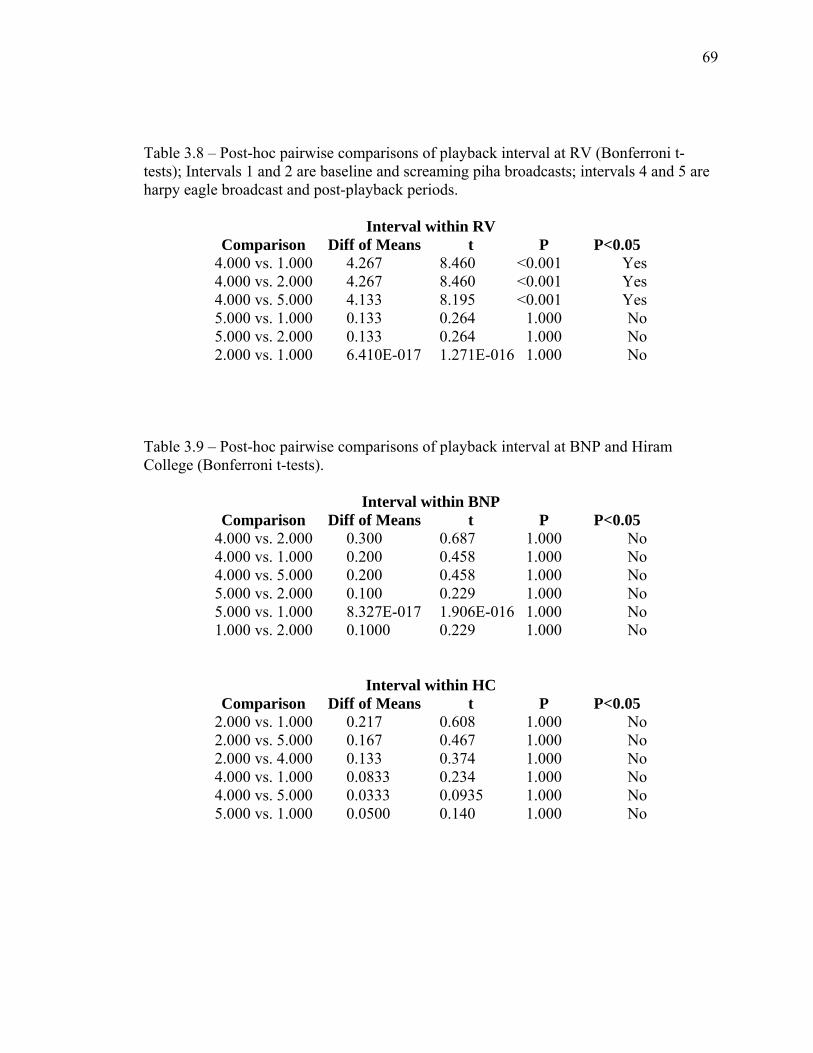
69
Table 3.8 – Post-hoc pairwise comparisons of playback interval at RV (Bonferroni t-tests); Intervals 1 and 2 are baseline and screaming piha broadcasts; intervals 4 and 5 are harpy eagle broadcast and post-playback periods.
Interval within RV
Comparison Diff of Means t P P<0.05 4.000 vs. 1.000 4.267 8.460 <0.001 Yes 4.000 vs. 2.000 4.267 8.460 <0.001 Yes 4.000 vs. 5.000 4.133 8.195 <0.001 Yes 5.000 vs. 1.000 0.133 0.264 1.000 No 5.000 vs. 2.000 0.133 0.264 1.000 No 2.000 vs. 1.000 6.410E-017 1.271E-016 1.000 No
Table 3.9 – Post-hoc pairwise comparisons of playback interval at BNP and Hiram College (Bonferroni t-tests).
Interval within BNP
Comparison Diff of Means t P P<0.05 4.000 vs. 2.000 0.300 0.687 1.000 No 4.000 vs. 1.000 0.200 0.458 1.000 No 4.000 vs. 5.000 0.200 0.458 1.000 No 5.000 vs. 2.000 0.100 0.229 1.000 No 5.000 vs. 1.000 8.327E-017 1.906E-016 1.000 No 1.000 vs. 2.000 0.1000 0.229 1.000 No
Interval within HC Comparison Diff of Means t P P<0.05
2.000 vs. 1.000 0.217 0.608 1.000 No 2.000 vs. 5.000 0.167 0.467 1.000 No 2.000 vs. 4.000 0.133 0.374 1.000 No 4.000 vs. 1.000 0.0833 0.234 1.000 No 4.000 vs. 5.000 0.0333 0.0935 1.000 No 5.000 vs. 1.000 0.0500 0.140 1.000 No
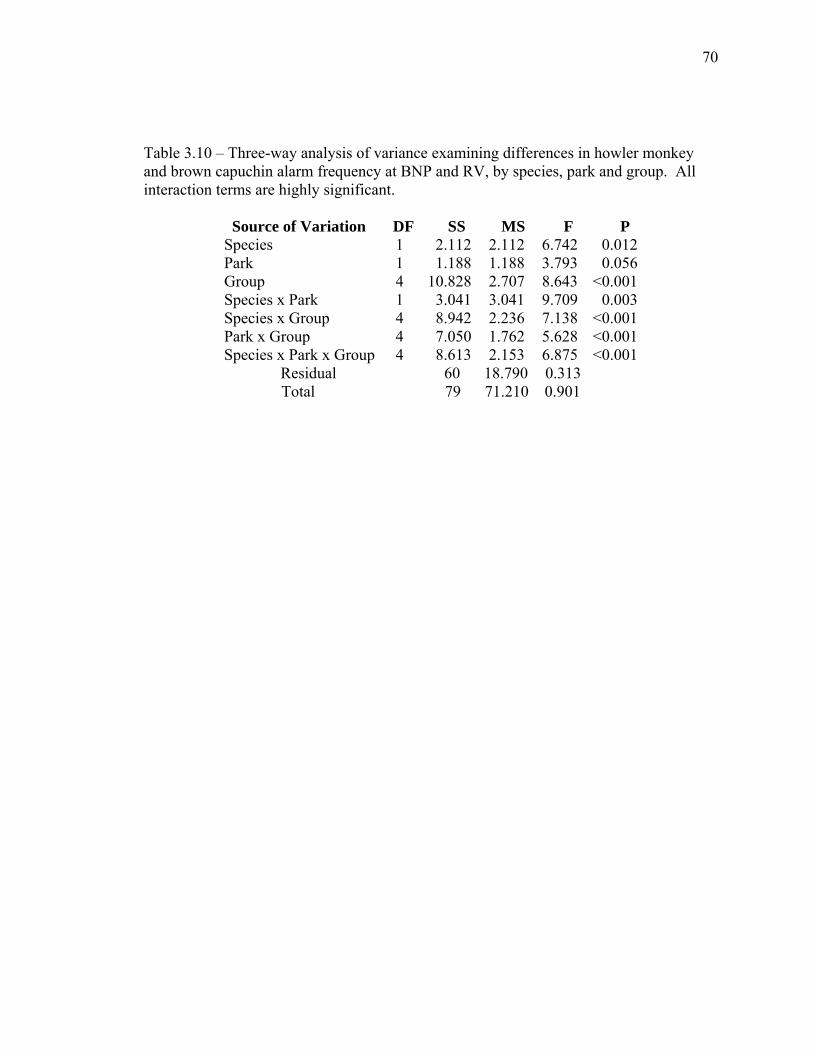
70
Table 3.10 – Three-way analysis of variance examining differences in howler monkey and brown capuchin alarm frequency at BNP and RV, by species, park and group. All interaction terms are highly significant.
Source of Variation DF SS MS F P Species 1 2.112 2.112 6.742 0.012 Park 1 1.188 1.188 3.793 0.056 Group 4 10.828 2.707 8.643 <0.001 Species x Park 1 3.041 3.041 9.709 0.003 Species x Group 4 8.942 2.236 7.138 <0.001 Park x Group 4 7.050 1.762 5.628 <0.001 Species x Park x Group 4 8.613 2.153 6.875 <0.001
Residual 60 18.790 0.313 Total 79 71.210 0.901
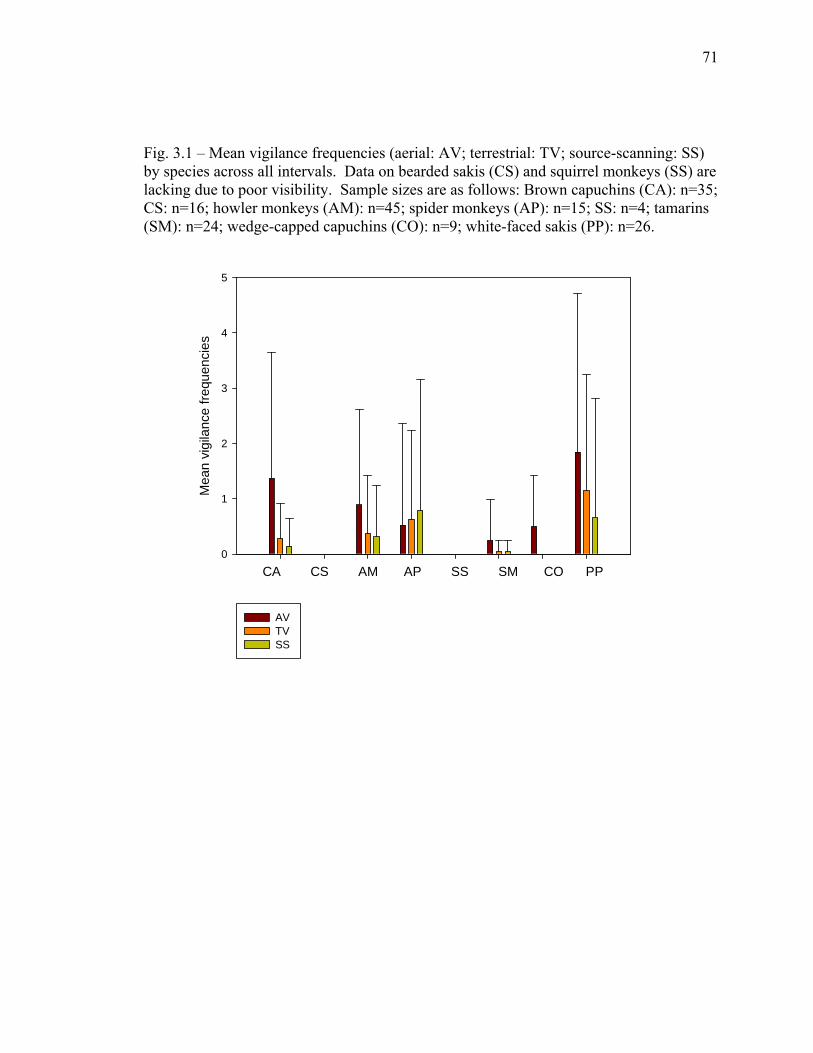
71
Fig. 3.1 – Mean vigilance frequencies (aerial: AV; terrestrial: TV; source-scanning: SS) by species across all intervals. Data on bearded sakis (CS) and squirrel monkeys (SS) are lacking due to poor visibility. Sample sizes are as follows: Brown capuchins (CA): n=35; CS: n=16; howler monkeys (AM): n=45; spider monkeys (AP): n=15; SS: n=4; tamarins (SM): n=24; wedge-capped capuchins (CO): n=9; white-faced sakis (PP): n=26.
CA CS AM AP SS SM CO PP
Mea
n vi
gila
nce
frequ
enci
es
0
1
2
3
4
5
AV TV SS
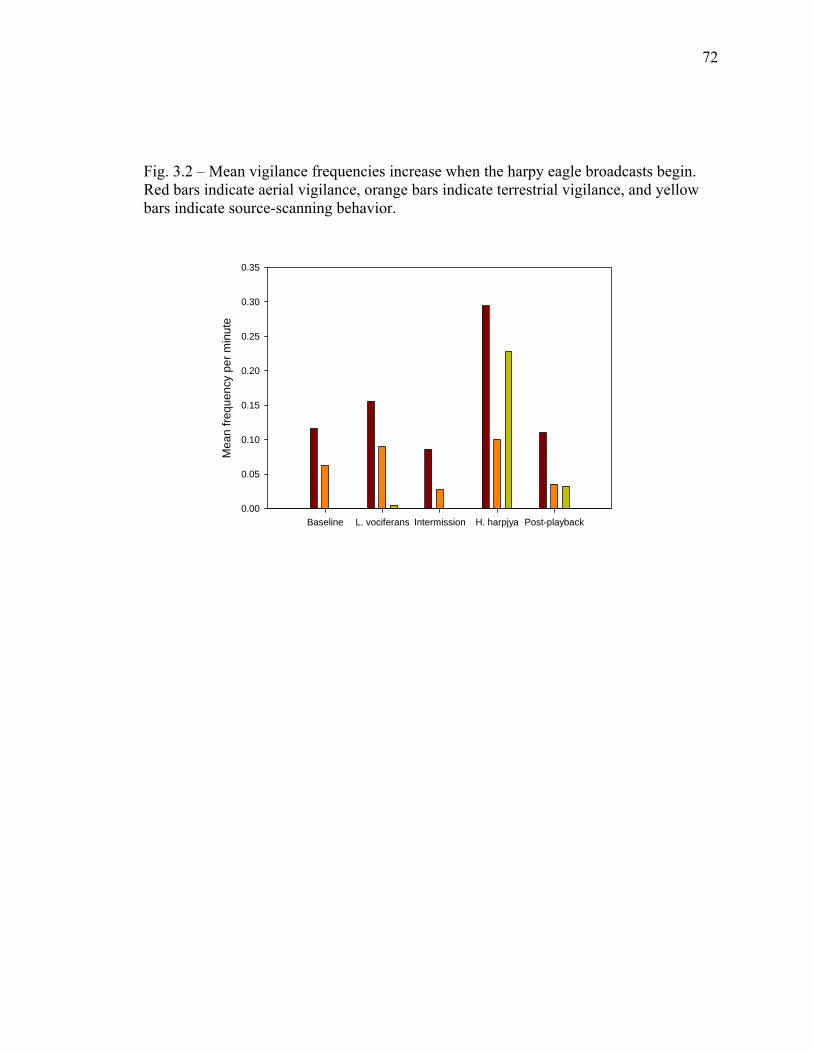
72
Fig. 3.2 – Mean vigilance frequencies increase when the harpy eagle broadcasts begin. Red bars indicate aerial vigilance, orange bars indicate terrestrial vigilance, and yellow bars indicate source-scanning behavior.
Baseline L. vociferans Intermission H. harpjya Post-playback
Mea
n fre
quen
cy p
er m
inut
e
0.00
0.05
0.10
0.15
0.20
0.25
0.30
0.35

73
Fig. 3.3 – Frequency of alarm vocalizations in all species averaged across all playback intervals. Wedge-capped capuchins, spider monkeys, bearded sakis, and brown capuchins had the highest alarm frequencies. Species codes (x axis) are the same as described in Fig. 3.1.
CA CS AM AP SS SM CO PP
Mea
n al
arm
freq
uenc
y ac
ross
all
inte
rval
s
0
20
40
60

74
Fig. 3.4 – Dichotomous alarm response data for all species, normalized for duration of playback intervals. Mean alarm frequencies were substantially higher in interval B, which included the harpy eagle broadcasts and post-playback periods, compared to interval A, which included the baseline and screaming piha broadcast periods.
A B
Mea
n al
arm
voc
aliz
atio
ns p
er m
inut
e
0
1
2
3
4
5
6

75
Fig. 3.5 – Length and width of the area occupied by the species during the experiments. Wedge-capped capuchins occupied the largest overall area; golden-handed tamarins occupied the smallest. Spider monkeys and bearded sakis were the most variable in area occupied by social groups at the time of the experiments. This is possibly a reflection of the highly variable nature of their social organizations.
Width, in meters
0 20 40 60 80 100 120
Leng
th, i
n m
eter
s
0
20
40
60
80
100
120
140
160
Howler monkeysSpider monkeysBrown capuchinsWedge-capped capuchinsBearded sakisWhite-faced sakisGolden-handed tamarinsSquirrel monkeys
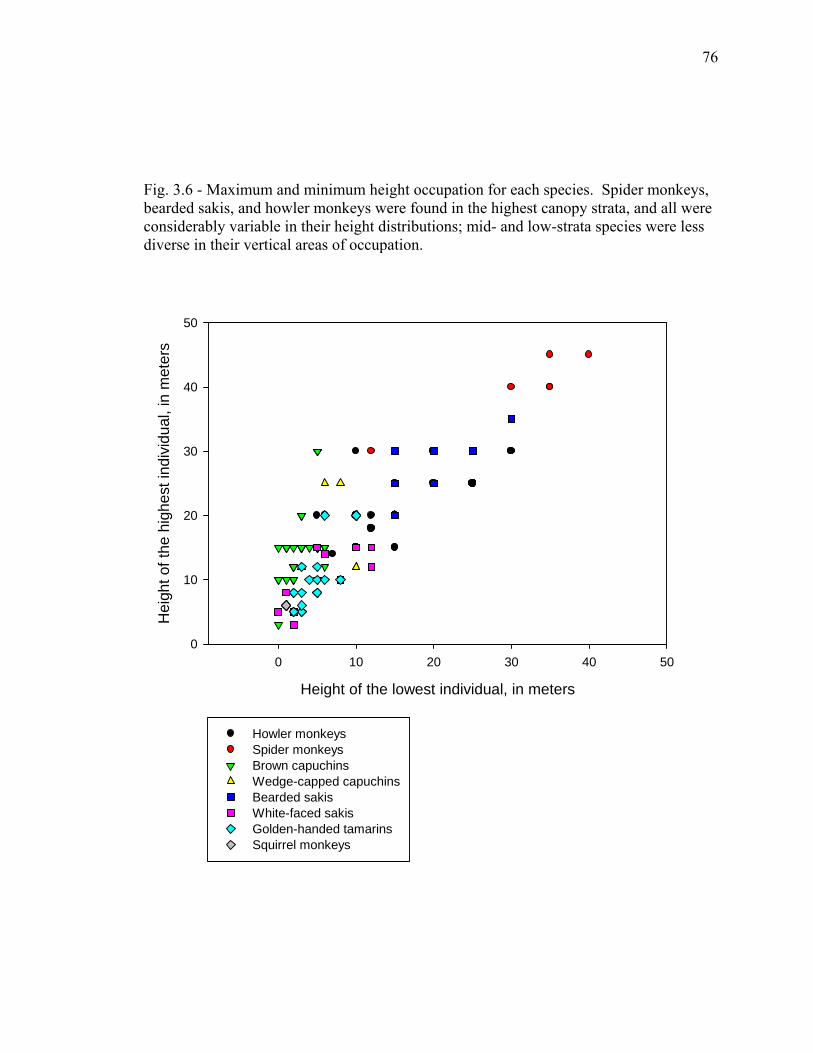
76
Fig. 3.6 - Maximum and minimum height occupation for each species. Spider monkeys, bearded sakis, and howler monkeys were found in the highest canopy strata, and all were considerably variable in their height distributions; mid- and low-strata species were less diverse in their vertical areas of occupation.
Height of the lowest individual, in meters
0 10 20 30 40 50
Hei
ght o
f the
hig
hest
indi
vidu
al, i
n m
eter
s
0
10
20
30
40
50
Howler monkeysSpider monkeysBrown capuchinsWedge-capped capuchinsBearded sakisWhite-faced sakisGolden-handed tamarinsSquirrel monkeys

77
Fig. 3.7 – Relationship between alarm frequency and within group spatial dispersion.
n=171
Clumped Moderate Dispersed
Mea
n al
arm
freq
uenc
y
0
10
20
30
40
50
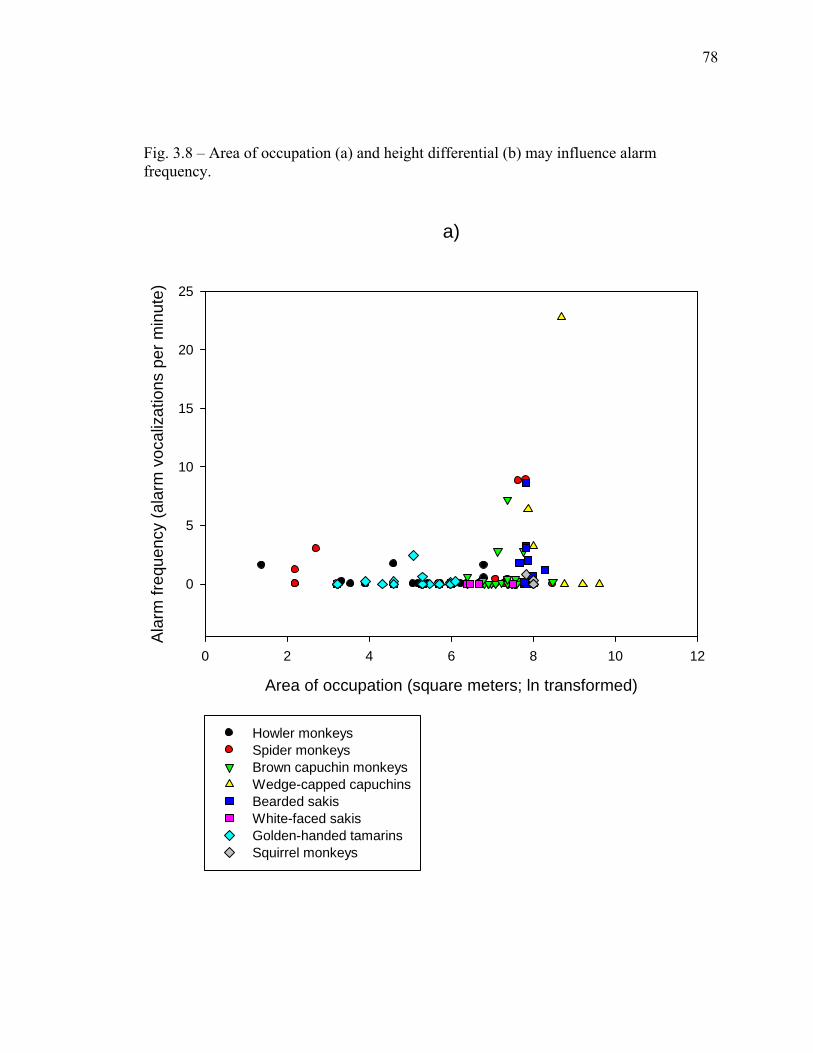
78
Fig. 3.8 – Area of occupation (a) and height differential (b) may influence alarm frequency.
a)
Area of occupation (square meters; ln transformed)
0 2 4 6 8 10 12
Ala
rm fr
eque
ncy
(ala
rm v
ocal
izat
ions
per
min
ute)
0
5
10
15
20
25
Howler monkeysSpider monkeysBrown capuchin monkeysWedge-capped capuchinsBearded sakisWhite-faced sakisGolden-handed tamarinsSquirrel monkeys

79
b)
Height differential, in meters
0 5 10 15 20 25 30
Ala
rm fr
eque
ncy
(ala
rm v
ocal
izat
ions
per
min
ute)
0
5
10
15
20
25
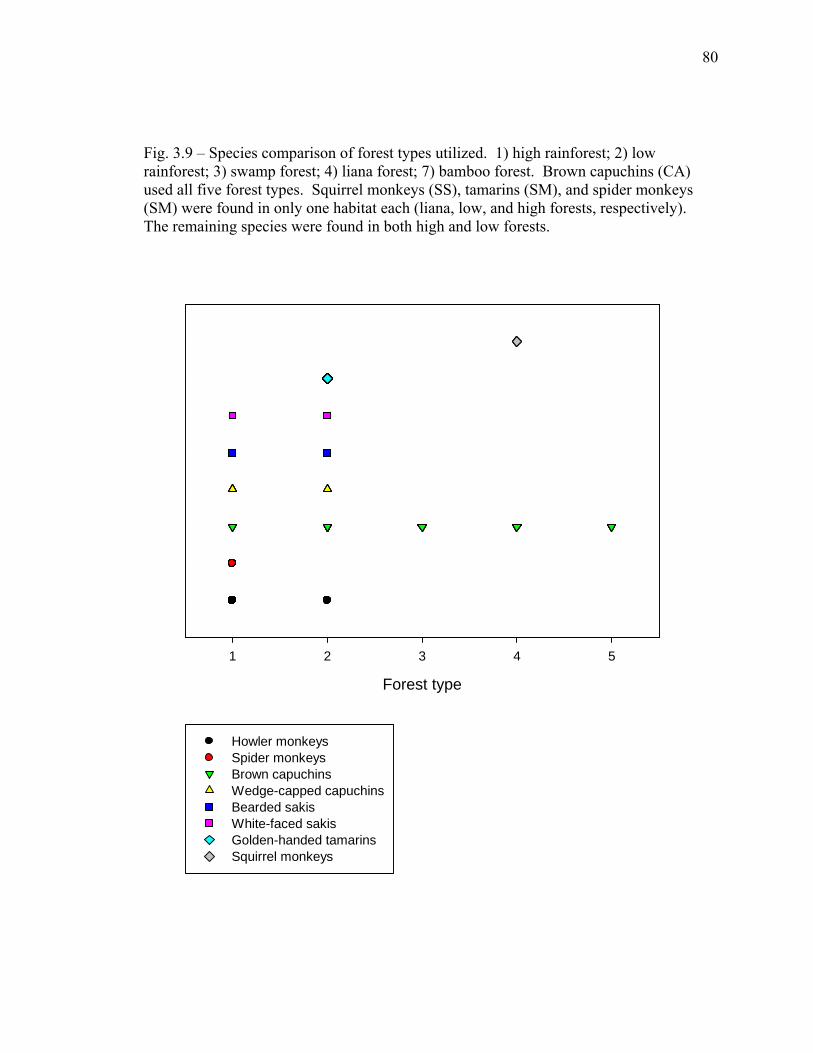
80
Fig. 3.9 – Species comparison of forest types utilized. 1) high rainforest; 2) low rainforest; 3) swamp forest; 4) liana forest; 7) bamboo forest. Brown capuchins (CA) used all five forest types. Squirrel monkeys (SS), tamarins (SM), and spider monkeys (SM) were found in only one habitat each (liana, low, and high forests, respectively). The remaining species were found in both high and low forests.
Forest type
1 2 3 4 5
Howler monkeysSpider monkeysBrown capuchinsWedge-capped capuchinsBearded sakisWhite-faced sakisGolden-handed tamarinsSquirrel monkeys
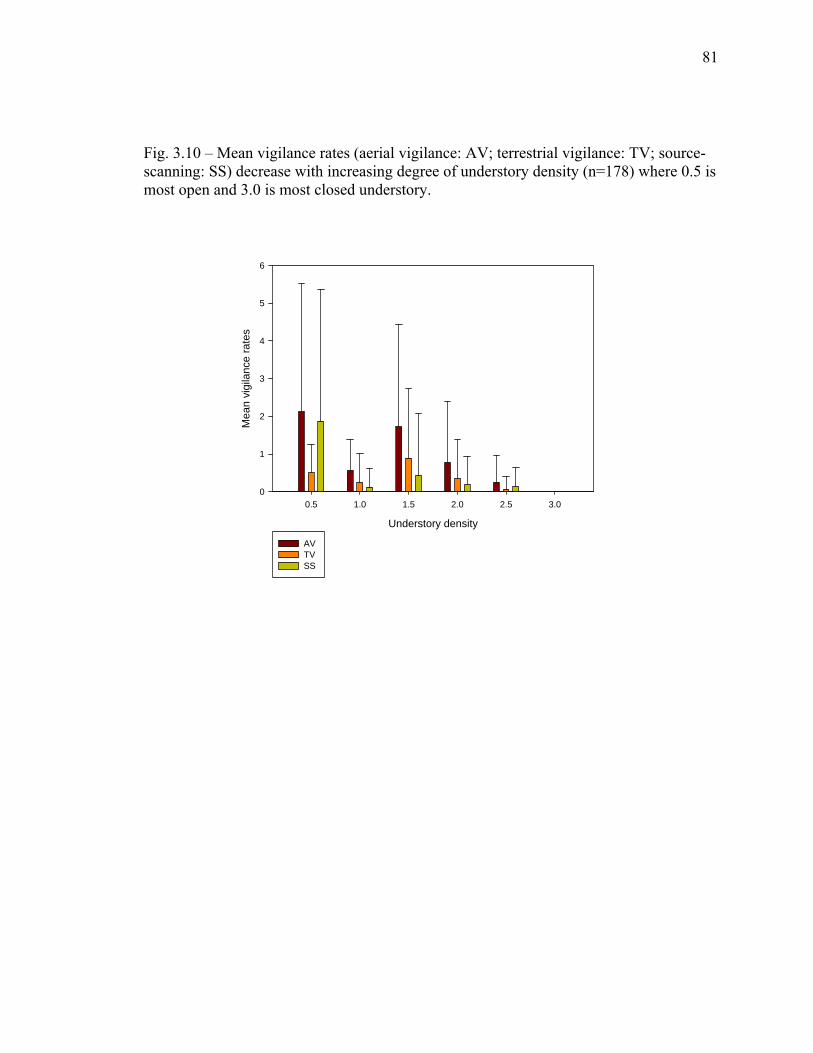
81
Fig. 3.10 – Mean vigilance rates (aerial vigilance: AV; terrestrial vigilance: TV; source-scanning: SS) decrease with increasing degree of understory density (n=178) where 0.5 is most open and 3.0 is most closed understory.
Understory density
0.5 1.0 1.5 2.0 2.5 3.0
Mea
n vi
gila
nce
rate
s
0
1
2
3
4
5
6
AV TV SS
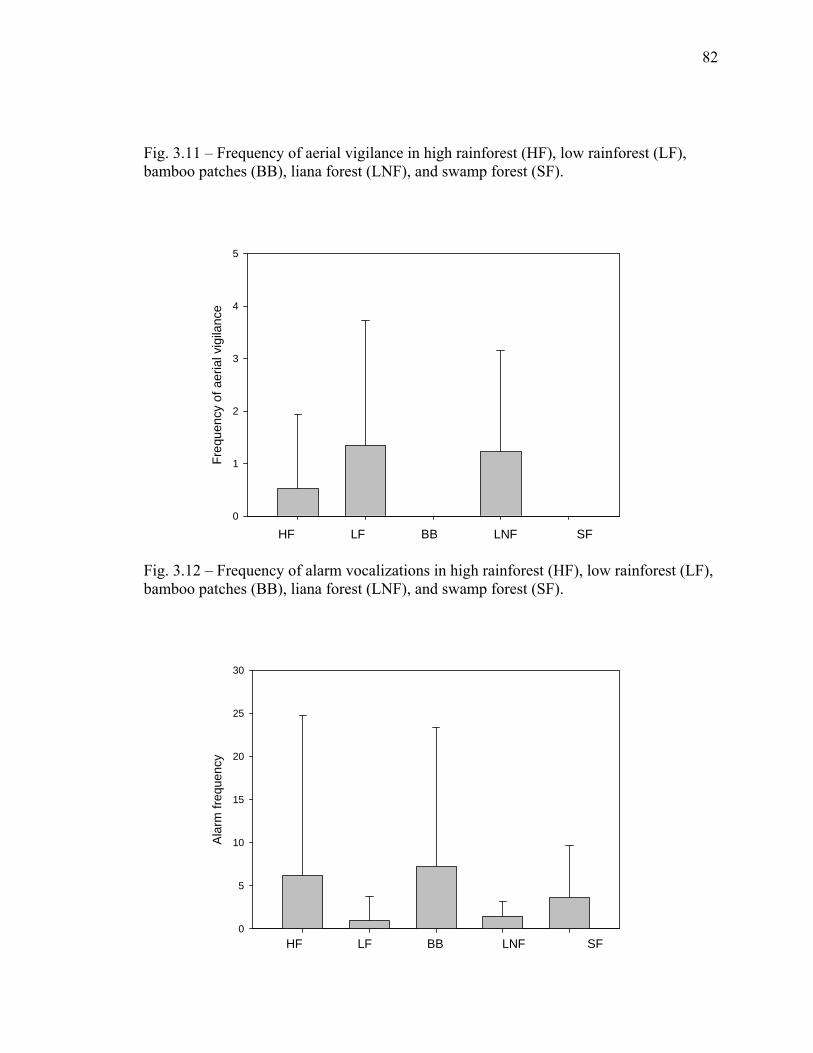
82
Fig. 3.11 – Frequency of aerial vigilance in high rainforest (HF), low rainforest (LF), bamboo patches (BB), liana forest (LNF), and swamp forest (SF).
HF LF BB LNF SF
Freq
uenc
y of
aer
ial v
igila
nce
0
1
2
3
4
5
Fig. 3.12 – Frequency of alarm vocalizations in high rainforest (HF), low rainforest (LF), bamboo patches (BB), liana forest (LNF), and swamp forest (SF).
HF LF BB LNF SF
Ala
rm fr
eque
ncy
0
5
10
15
20
25
30
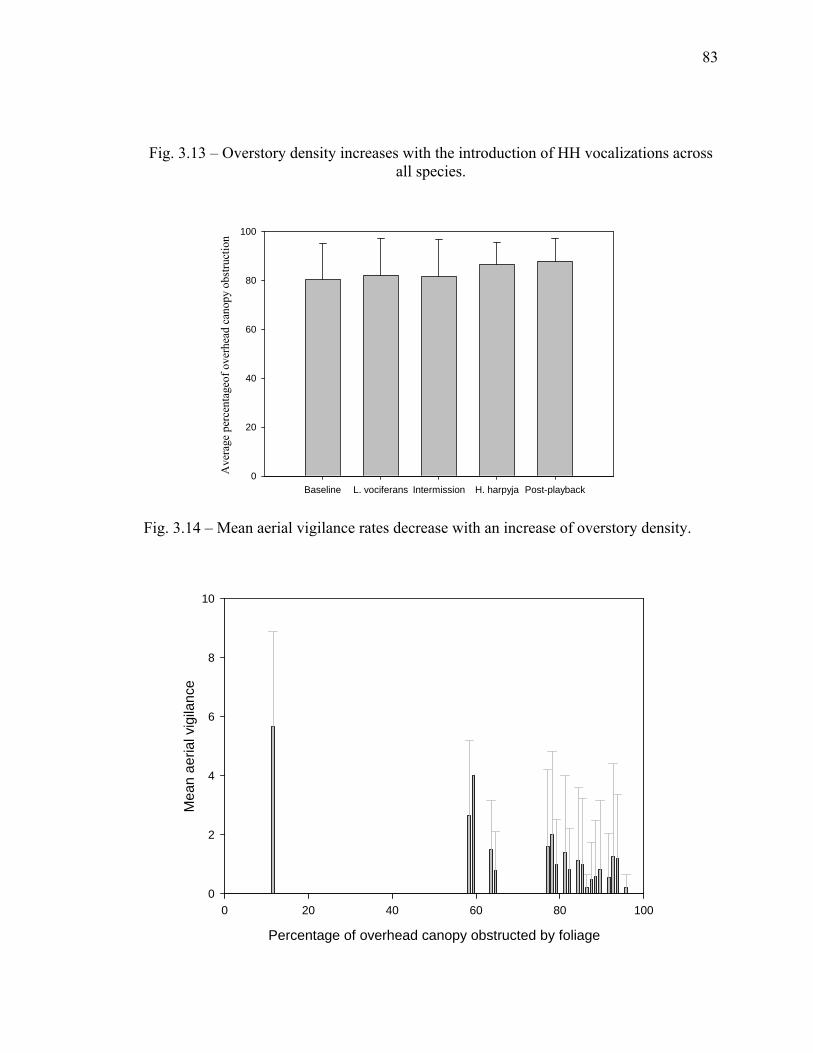
83
Fig. 3.13 – Overstory density increases with the introduction of HH vocalizations across all species.
Baseline L. vociferans Intermission H. harpyja Post-playback
Ave
rage
per
cent
ageo
f ove
rhea
d ca
nopy
obs
truct
ion
0
20
40
60
80
100
Fig. 3.14 – Mean aerial vigilance rates decrease with an increase of overstory density.
Percentage of overhead canopy obstructed by foliage
0 20 40 60 80 100
Mea
n ae
rial v
igila
nce
0
2
4
6
8
10
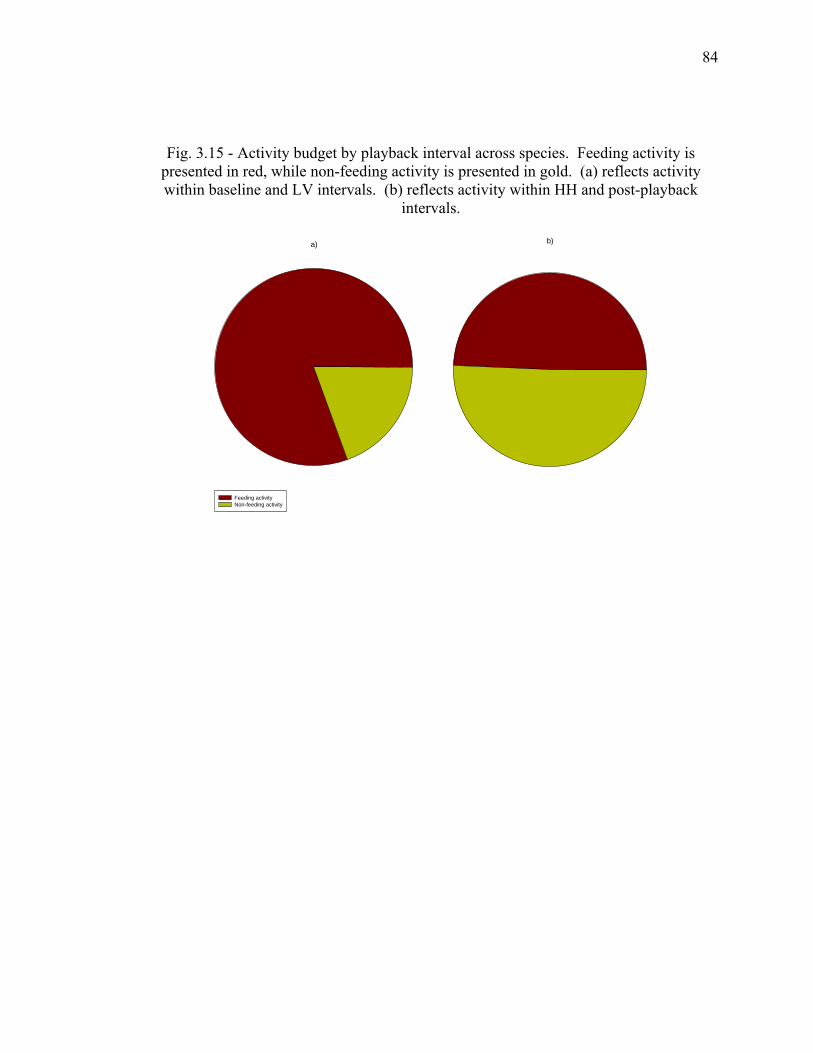
84
Fig. 3.15 - Activity budget by playback interval across species. Feeding activity is presented in red, while non-feeding activity is presented in gold. (a) reflects activity within baseline and LV intervals. (b) reflects activity within HH and post-playback
intervals.
a)
Feeding activityNon-feeding activity
b)
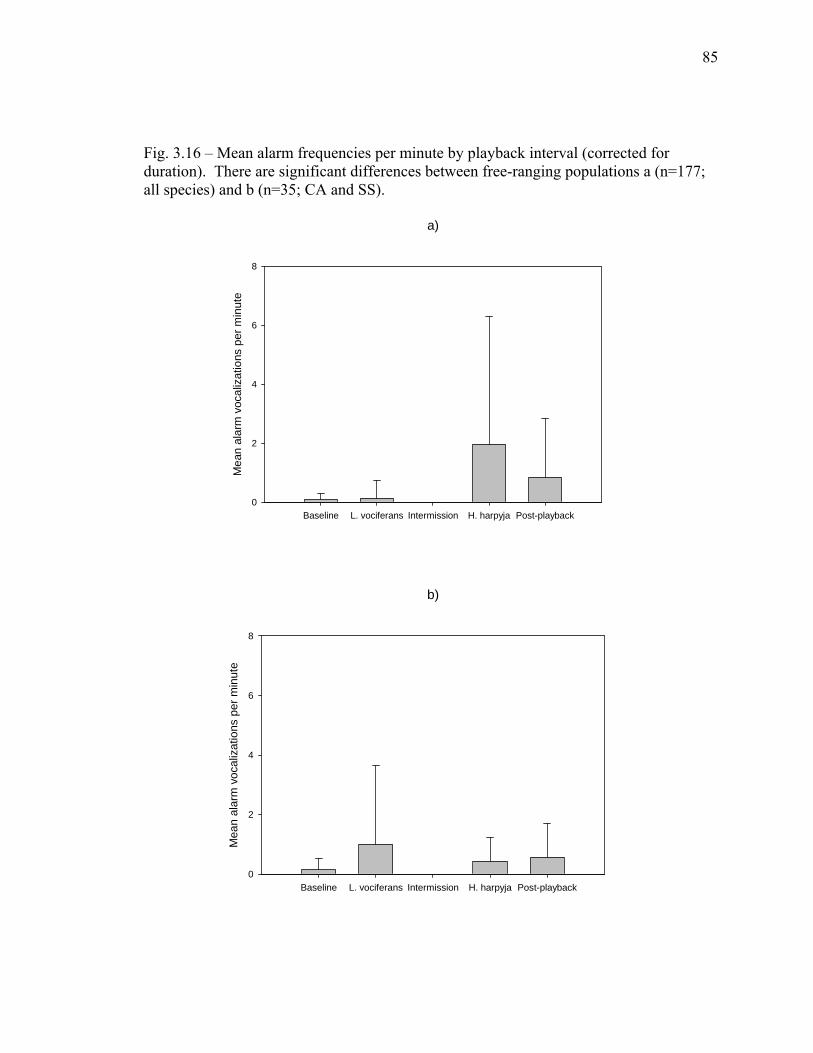
85
Fig. 3.16 – Mean alarm frequencies per minute by playback interval (corrected for duration). There are significant differences between free-ranging populations a (n=177; all species) and b (n=35; CA and SS).
a)
Baseline L. vociferans Intermission H. harpyja Post-playback
Mea
n al
arm
voc
aliz
atio
ns p
er m
inut
e
0
2
4
6
8
b)
Baseline L. vociferans Intermission H. harpyja Post-playback
Mea
n al
arm
voc
aliz
atio
ns p
er m
inut
e
0
2
4
6
8

86
Fig. 3.17 – Overall alarm frequency is higher at RV than at BNP or Hiram College.
Location
BNP RV HC
Mea
n al
arm
voc
aliz
atio
ns p
er m
inut
e
0
1
2
3
4
Fig. 3.18 – There is no significant difference in rates of aerial vigilance between populations of C. apella at BNP and Hiram College.
BNP RV HC
AV
freq
uenc
y
0
2
4
6
8
10
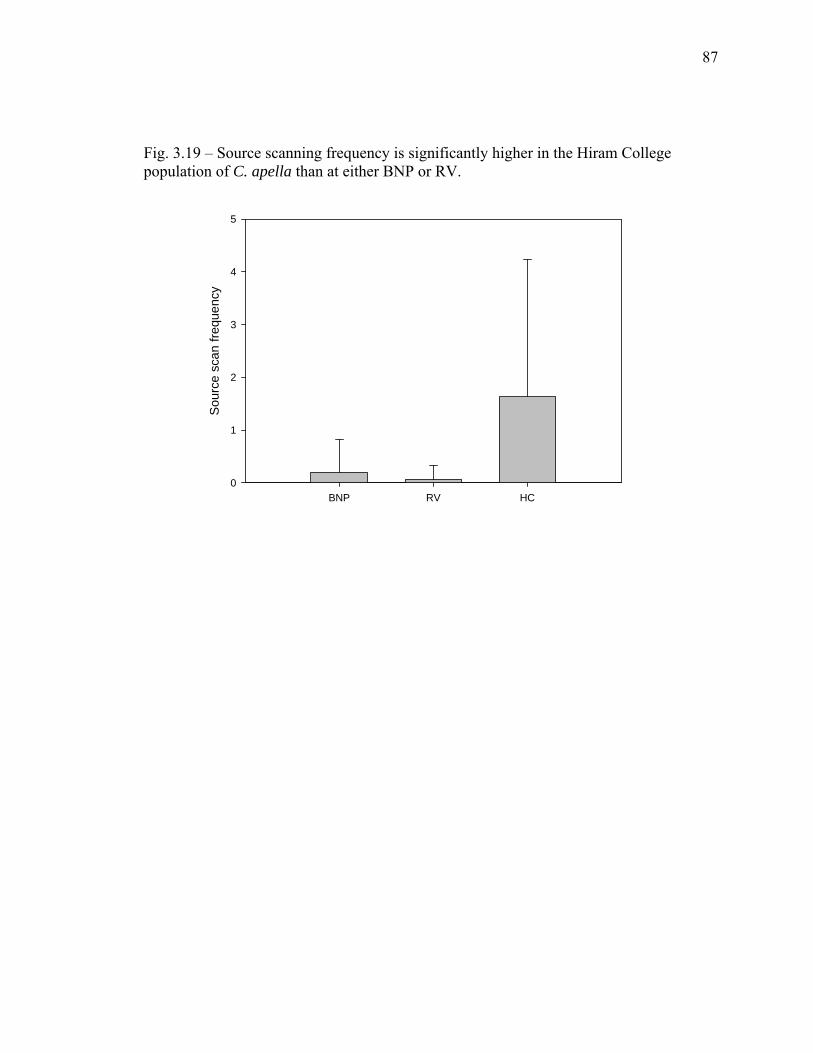
87
Fig. 3.19 – Source scanning frequency is significantly higher in the Hiram College population of C. apella than at either BNP or RV.
BNP RV HC
Sou
rce
scan
freq
uenc
y
0
1
2
3
4
5
CHAPTER FOUR
DISCUSSION
The results clearly indicate that anti-predator behaviors were elicited by primates
who were exposed to vocalizations of predator species. Alarm call vocalizations were
given in greater frequencies in playback interval 4 (harpy eagle vocalization) than in any
other playback interval. Groups at both parks differentially used their habitats dependent
on playback interval, and more often sought areas with more densely covered overstory
in intervals 4 and 5 (post-playback silence). Once these areas of the forest were attained,
the groups were observed to act cryptically and exhibit stationary behavior at higher
rates, while vigilance frequencies were increased.
Moreover, they suggest that, in order for primates to most effectively and most
appropriately react to predators, some exposure to those predators is required. Alarm
vocalizations were emitted with greater frequencies at Raleighvallen than at Brownsberg
or Hiram College, and overall response was most severe among Raleighvallen capuchins.
4.1 - General patterns
The striking differences in alarm call frequencies, vigilance rates, and general
behavioral response between intervals prior to and after the initiation of harpy eagle
vocalizations are important in several ways. First, these results are consistent with other
studies that indicate that primates react appropriately to auditory cues of predation (Gil-
da-Costa, 2007; Gil-da-Costa et al., 2003; Treves, 1999; Zuberbuhler et al., 1999;
Zuberbuhler et al., 1997; Gebo et al., 1994), adding to the mounting body of empirical
88
89
evidence suggesting that animals can identify potential predators by auditory cues alone,
and not only by visual contact.
Second, these results suggest that primates exhibit anti-predator responses to the
vocalizations of potential predators (whether or not the primates recognize those audio
cues as belonging to predators), and that the severity of response may depend on the
degree of familiarity with the predator in question. The extent to which primates at
Brownsberg have exposure to harpy eagles is unknown, but the primates there responded
to the broadcast vocalizations of the raptor with anti-predator behaviors. The captive-
born primates housed at Hiram College have had no known prior exposure to harpy
eagles or any other predator (Phillips, pers. comm.), and although their responses were
not consistent with those exhibited by their free-ranging counterparts, they did seem to
respond to unfamiliar noises with anti-predator response behaviors.
Some free-ranging primate groups at Raleighvallen have regular, substantial
contact with harpy eagles, and exhibited the most severe response of all groups sampled.
These results suggest that the most appropriate (and likely most effective) responses to
threat of predation from specific predators are learned and reinforced by regular
antagonistic interactions with them, providing evidence in agreement with Ferrari’s
(2009) position that the production of alarm calls may be instinctual, but departing from
the author’s position in the suggestion that any anti-predator responses are “universal”.
Third, these results show that vigilance frequencies, while valid and widely used
indicators of predation risk (Gil-da-Costa, 2007; Boinski et al., 2003; Treves, 1997;
Cords, 1990), are not its only applicable measurements. Components of this study
90
suggest that frequencies of alarm vocalizations are valid measurements of risk perception
by primates. As visibility is often constrained by the dense foliage associated with the
neotropics, alarm vocalizations provide a reliable estimate of predation risk and risk
perception when vigilance cannot be reliably measured.
4.2 - Predator-sensitive habitat use
The perceived presence of a predator appeared to have a major effect on the
habitat use patterns of the primates in this study. Analysis of this data set indicates that
not only do forest type, spatial occupation, and foliage density appear to influence anti-
predator strategies (as in Boinski et al., 2003; Enstam and Isbell, 2002), but also that
primates within these habitats evaluate their surroundings and seek refuge in more
densely covered areas when faced with threat of predation, as suggested by other studies
(Gil-da-Costa, 2007; Gil-da-Costa et al., 2003; Gleason and Norconk, 2002). These
results add additional empirical evidence to previous studies documenting that habitats
are selected in part to ameliorate the risk of predation, and that habitat use patterns are
related to risk perception and risk reduction (Frechette, 2007; Boinski et al., 2003;
Cowlishaw, 1997; Lima and Dill, 1990).
Spatial distribution and the selfish herd
Spatial occupation data indicate that an increase in area in one dimension (width,
length, and height) is associated with corresponding increases in area in all other
dimensions. However, modal spatial distribution patterns indicate that primates
91
preferentially range in clumped distributions, seemingly regardless of spatial occupation
variables. This suggests that small areas of occupation in all dimensions allow larger
clumps that are more closely spatially packed, but larger areas of occupation demand
clumps that consist of fewer individuals who are more widely dispersed throughout
space.
Two patterns of spatial organization observed in this study may support the
“selfish herd” function of alarm calling behavior, as hypothesized by Owens and Goss-
Custard (1976). The authors suggest that alarm calls in shore birds, rather than serving to
benefit close kin of the caller, instead serve to congregate more widely dispersed group
members around the caller, thus reducing by diffusion the likelihood that the caller would
be taken by a predator.
First, roughly three times as many alarm calls were associated with clumped
groups in this study than with moderately dispersed or dispersed groups. Some
observations support that non-clumped groups had a tendency to become clumped
following alarm vocalizations (observed in spider monkeys, brown capuchins, wedge-
capped capuchins, and potentially others), though it is difficult to tease apart whether the
call or the clumped dispersion came first in the data, as well as whether both alarm
frequency and clumped dispersion were both functions of the harpy eagle broadcasts.
Additionally, individuals in more clumped groups may emit more frequent alarm
vocalizations to diffuse the conspicuity of the alarm vocalizations themselves, limiting
the amount to which the caller is faced with additional threat of predation or detection,
and serving the same essential purpose as the selfish herd function.
92
Secondly, the frequency of alarm vocalizations increased with an increase in area
(both spatial occupation and height differential). These results support the hypothesis
that alarm calling functions to bring conspecifics in closer proximity to the caller.
Already clumped groups have the benefit of near neighbors to dilute the effects of
predation on any given individual, whereas dispersed individuals may emit alarm calls to
bring other individuals closer to them.
As with distribution data above, causes and effects of alarm call behaviors are
difficult to distinguish. It is difficult to ascertain whether spatial occupation increases as
part of an anti-predator response, or whether the anti-predator response increases due to
larger areas of occupation. Therefore, additional study is warranted to determine the
causal nature of spatial organization and dispersion data on anti-predator strategies. The
predator deterrence function of alarm behavior (Zuberbühler et al., 1999) is presumed to
be very important for neotropical primates, as the majority of their predators employ
ambush strategies.
Foliage density, visibility, and refugial areas
The modal degree of understory density was relatively high, and there was no
difference in modal density between pre- and post-harpy eagle broadcast intervals.
Significant increases in the degree of overstory density after the initiation of harpy eagle
playback suggests that most of the study species utilize the density of overhead canopy as
part of their anti-predator behavioral suite. This is consistent with documented
93
observations by van Schaik and van Noordwijk (1989) that brown capuchins sought
cover in dense vegetation in response to conspecific alarm vocalizations.
Further, these results suggest that perceived risk of predation within densely-
covered canopy is lower. Theoretically, aerial predators would have a more difficult time
capturing prey moving laterally or diving through obstructed canopy than they would
through open, less continuous canopy. Boinski and colleagues (2003) have argued that
liana forests pose serious risk of injury to understory raptors. Gleason and Norconk
(2002) have demonstrated that white-faced sakis may remain motionless in dense
understory for several hours after exposure to predator stimuli. As such, the pattern of
refuge seeking behavior in neotropical primates is a potentially sound anti-predator
strategy.
In addition, the unexpectedly high average overstory density and modal degree of
understory density suggest that even when not directly faced with a perceived threat,
primates preferentially range in areas more densely covered than not. This is consistent
with observations that old world monkeys minimize predation risk by refraining from
foraging in risky habitats (Cowlishaw, 1997; Isbell, 1994), that some primates are
cognizant of the effect of habitat structure on predator efficacy (Enstam, 2007), and that
primates may seek out refugial areas because of a reduced predation risk within them
(Ferrari, 2009; Boinski et al., 2003).
Several researchers have proposed that some animals tend to forage in high risk
areas despite being conspicuous to prey because the limited cover that led to their
conspicuity would also necessarily leave ambush predators without concealment
94
(Cowlishaw, 1997; Lima, 1992). Theoretically, this strategy would be effective against
harpy eagles and other sit and wait raptors in the neotropics, due to the tendency of those
raptors to rely on concealment for hunting efficacy (Boinski et al., 2003). However, the
pattern of habitat use described above suggests that the study populations do not employ
that strategy. This may support raptor efficacy, as predators are suggested to be most
attracted to areas that a) support high densities of prey species, and b) support efficient
hunting behaviors (Cowlishaw, 1997).
Lima (1992) also describes a pattern of predator-sensitive habitat use in which
groups may prefer to range in areas that offer escape or refuge opportunities. This may
explain the apparent tendency of monkeys to range in dense understory, and the
frequency with which Raleighvallen primates exploit bamboo patches and liana forests
(Frechette, 2007; Boinski et al., 2003; pers. obs.)
The patterns of habitat use exhibited by spider monkeys and bearded sakis did not
conform to those exhibited by all other species, which can be explained in a variety of
ways. First, the overall overstory density means were high for both species, suggesting
that species consistently ranging within highly-covered canopy would not further alter
their habitat in response to the perceived presence of a predator because the preferred
risk-reducing cover had already been achieved.
Alternatively, higher overstory densities may correlate with lower visibility, so
that these high canopy dwelling species may move to more open canopy areas in order to
more rapidly locate and identify a predator and its position. This may be critically
important for groups under high threat of predation from raptors, as detection prior to an
95
attack is thought to substantially reduce predator efficacy (van Schaik and van
Noordwijk, 1989).
Finally, sample sizes were relatively small for both spider monkeys and bearded
sakis (n=16 lines of observation; n=3 full experiment periods), so sampling error could
have contributed to these seemingly abnormal responses.
4.3 – Activity patterns
Though cryptic behavior, in which animals freeze in hopes of escaping detection
by predators, is over-used to explain the anti-predator strategies of species whose anti-
predator strategies are not well understood (e.g. Stanford, 2002), the modal activity
pattern across all primates in this study suggests that crypsis is a dominant and important
anti-predator strategy. Stationary, non-foraging behavior was significantly more frequent
after the initiation of the harpy eagle vocalizations than in any interval before them, not
unlike observations of the reactions in other taxa to predator presence described
elsewhere (Ferrari, 2009; see review in Boinski et al., 2000). When combined with
patterns of increasing canopy density following harpy eagle broadcasts, these results
suggest that neotropical primates evaluate the presence of a predator, seek refuge in dense
areas of the forest, and remain there for a period of time.
This pattern, observed across all species observed in this study, may contradict
Ferrari’s (2009) suggestion that elongated stationary response exhibited by howler
monkeys following a predation attempt or event was a consequence (or luxury) of a
folivorous lifestyle. Conversely, the reduction of activity budget devoted to feeding
96
across all species in this study may indicate a considerable devotion of more time and
energy to predator detection (vigilance) and evasion (alarm calling, mobbing, flight,
refuge-seeking) when the presence of a predator is perceived.
What was not expected was the reduction of travel time after the initiation of the
harpy eagle broadcast. The emergent activity pattern suggests the following sequence of
events: a) detection of a perceived predator, b) movement into a refugial area, c) then
modal activity budget expenditure to detection and deterrence, exhibited by lack of
movement and feeding behaviors, with an increase in vigilance behaviors and alarm
vocalizations. These results are consistent with observations made by Gleason and
Norconk (2002) regarding white-faced saki anti-predator strategies.
4.4 - Vigilance
Vigilance behavior was shown to be positively associated with perceived risk, as
the frequency of aerial vigilance and source-scanning behavior was substantially higher
after the initiation of harpy eagle vocalization broadcasts. This finding suggests that
aerial vigilance and source scanning behaviors are important anti-predator responses and
that these behaviors are emphasized with greater activity budget allocation (and possibly
greater opportunity costs) in the presence of a potential predator stimulus. This is
exceptionally important for the prey species of large-bodied raptors that employ ambush
tactics, as once they are detected, their hunting efficacy rapidly and significantly
decreases (Touchton et al., 2002; van Schaik and van Noordwijk, 1989). Therefore,
primates theoretically benefit greatly from devoting time to attempting to detect
97
predators. These findings reflect the prediction of Lima and Bednekoff (1999), which
suggests predators are more effectively detected by prey when greater time is allocated
toward vigilance behaviors.
Aerial vigilance frequency is lower in both denser understory and overstory,
suggesting that primates evaluate the relative safety of their habitats and potentially
benefit from allocating time to activities other than vigilance behavior while ranging in
areas where perceived risk of predation is low. Findings of relationships between foliage
density and vigilance are quite variable (Treves, 1997; Cords, 1990). Because understory
raptors are predicted to be less likely to attempt an attack in very dense vegetation due to
risk of injury (Boinski et al., 2003), it is presumed that denser patches of forest carry
reduced perception of risk. Additionally, several researchers (Hill and Weingrill, 2007;
Boinski et al., 2003) have suggested that fewer bouts of preemptive vigilance are required
in denser habitats because detection is compromised due to low visibility. Both or either
explanation that lower vigilance is a function of lower perception of risk or lower
visibility may be supported by these results.
In a curious contrast, low forest and liana forest, which are considered relatively
low-risk habitats in terms of their comparatively higher understory density, were
associated with increases of aerial vigilance. This may reflect a height differential
between high and low forest types: because the most significant avian threats to
Surinamese primates are mid-canopy ambush predators, groups found in the emergent
regions of high forest habitats are logically less likely to scan the sky for aerial predators
98
because the presence of soaring hawks is low, whereas groups ranging in lower strata
may need to increase their vigilance frequency to detect perched raptors.
Unfortunately, vigilance data were not gathered at Raleighvallen due to observer
visibility constraints, so a comparison of vigilance rates between Raleighvallen and
Brownsberg is not possible at this time. However, because alarm vocalizations and
vigilance rates are honest indicators of perceived risk of predation, and because of the
results of the comparisons between Raleighvallen and Brownsberg on the basis of alarm
vocalizations, it is assumed that vigilance rates at Raleighvallen are higher than those at
Brownsberg.
4.5 - Alarm vocalizations
As predicted, mean alarm vocalizations emitted during and after harpy eagle
vocalization broadcasts were substantially higher than any other interval, strongly
indicating that alarm vocalizations are indicators of perceived risk and proxy measures of
predation risk. However, alarm vocalizations were emitted with greater frequencies in
denser overstory and understory. This is perhaps contrary to suggestions that actual and
perceived risk of avian attack is lower in dense habitats because of predator mobility
limitations (Boinski et al., 2003), and the findings of other studies that evaluated the
influence of habitat variables on anti-predator behaviors of other neotropical primates
(Frechette, 2007).
Alternately, the higher frequencies of alarm vocalizations in denser cover could
indicate the perception of lower risk. Because alarm vocalizations (and presumably the
99
frequencies with which they are emitted) can be indicators of the urgency of the threat
(Stanford, 2002) but also serve to reduce the inconspicuity of prey, primates may more
effectively emit more alarm calls in denser cover without incurring additional risk while
also diffusing the identity of the caller.
The low frequency of alarm vocalizations emitted in liana and low forest habitats
may reflect a minimized perception of risk, but there are many variables that may
confound useful analysis of these data. First, high frequencies of alarm vocalizations in
high forest may reflect the high frequencies exhibited by spider monkeys and wedge-
capped capuchins rather than the actual forest conditions. Further, the unexpectedly high
alarm frequencies in bamboo and swamp forest habitats are from smaller sample sizes
and exclusively at Raleighvallen, where the predation risk is thought to be higher, and
therefore the sensitivities to harpy eagle playbacks were expected to be greater. There
does appear to be a direct relationship between alarm frequency and maximum height,
possibly indicating that higher-strata species emit more alarm vocalizations because they
range higher in the canopy. Indeed, the four most vocal species (wedge-capped
capuchins, spider monkeys, bearded sakis, and brown capuchins) are observed more
frequently in mid- and upper-levels of the canopy (Fleagle, 1999; Mittermeier and van
Roosmalen, 1981). These observations may oppose the hypothesis that predation risk (or
perception thereof) decreases with an increase in ranging height (see review in Boinski et
al., 2000).
100
4.6 - Learned and reinforced response
Owren and Rendall (2001) argue that sounds themselves do not have encoded
meaning in the referential sense, but that continued exposure to stimulus, alarm
vocalizations, and response patterns can condition an organism to appropriately react to
subsequent vocal cues. Bachorowski and Owren (2003) further suggest that reactions to
alarm calls are learned and reliant upon context. Therefore, one can extrapolate that
primates may learn, through exposure and contact, how to appropriately respond to audio
cues from potential predators in the same way they experientially learn proper responses
to conspecific alarm vocalizations. Similar suggestions have been made in previous
studies, in that exposure to predation attempts may benefit survivors by either reinforcing
anti-predator behaviors (Friant et al., 2008; Boinski et al., 2000) or encouraging the rapid
development of them (Gil-da-Costa et al., 2003).
Therefore, I expected differences in mean alarm vocalizations between the
following primate populations: a) those with a significant rate of contact with a known
population of harpy eagles and overlapping home ranges with the same, b) those with an
unknown rate of contact ranging in an area without regular sightings or evidence of harpy
eagle presence, and c) those born and reared in captivity with no prior exposure to
predatory raptors. Significant differences were observed, further supporting Owren and
Rendall’s assertions and indicating that severity and appropriateness of anti-predator
response is, in part, dependent upon degree and regularity of contact between predator
and prey.
101
That said, it is also suggested by my results that prey species respond with
increased vigilance, increased alarm frequency, or both, to apparently unfamiliar sounds.
These observations are also consistent with Owren and Rendall’s (2001) perspective that
vocalizations, and particularly alarm calls, are best explained as resultant from the
caller’s psychological state of arousal, and reactions to those calls reactions to that
portrayed arousal rather than to encoded signals. Captive-born primate groups expressed
anti-predator behaviors to both screaming piha and harpy eagle vocalizations, including
alarm vocalizations, which is consistent with playback studies conducted on some
captive-born groups but not others (see review in Friant et al., 2008). Therefore, it is
suggested that the ability and capacity to emit alarm vocalizations in response to
unfamiliar noises or otherwise stressful situations is not dependent upon exposure to
predator species in the wild. In fact, as suggested by Boinski and colleagues (1999),
alarm vocalizations in some species may be used to measure overall stress levels of
captive primates.
Free-ranging primates at Raleighvallen and Brownsberg appeared to recognize
piha vocalizations as non-threatening and did not react to them with anti-predator
behaviors, but did respond to the broadcast vocalizations of harpy eagles. This further
suggests that reinforcement is critical to the appropriateness of both the response to the
innocuous piha vocalizations, as well as the hazard or unfamiliarity of the harpy eagle
vocalizations, but that exposure to predators is not a necessary condition of behavioral
anti-predator response. This is consistent with Janson’s (1998) suggestion that animals
need not be faced with predators to exhibit adaptive counter-strategies.
102
However, because alarm calls and other anti-predator behaviors are costly, the
cognitive ability to distinguish potential threats from myriad other forest sounds is
critical. Further, the ability to effectively gauge the riskiness of a given habitat and make
appropriate subsequent decisions is paramount. Failure to appropriately evaluate the
riskiness of a given habitat can result in the ultimate negative consequence: death.
4.7 - Explanations for non-responses
White-faced sakis in this study were routinely observed in lower canopy and
understory habitats ( =9.37 m; min=4.86 m; max=10.33 m), which is not unusual for
the species (Fleagle, 1999; Mittermeier and van Roosmalen, 1981). Groups on which
experiments were conducted were mostly found on the Brownsberg plateau, and no
groups of sakis were located at Raleighvallen. Therefore, unlike with other groups that
were observed along the slopes of the Brownsberg mountain, that allowed me to
obfuscate the position or perceived height of the broadcast source, the perceived height of
the speaker was assumed to be the true height. It is possible that the lack of response
from white-faced saki groups is related to unrealistic portrayal of harpy eagle
vocalization conditions due to the vertical proximity to the speaker.
However, many plateau groups occupying high and low canopy strata exhibited
minimal responses to harpy eagle vocalization broadcasts, including groups of howler
monkeys, tamarins, and brown capuchins. Therefore, positioning of the speaker is a less
likely explanation for the lack of responses from these groups. It is possible that the
frequency of other anthropogenic noises (chainsaws, water pumps, machetes, automobile
103
engines) that have elicited alarm (or at least agitation) vocalizations in groups at
Raleighvallen (pers. obs.) have dulled the response to the vocalizations of potential
predators in groups at Brownsberg, that may lack the regular, consistent reinforcement
for appropriate response provided by contact with real predators.
It is also probable that since cryptic foragers such as white-faced sakis (Boinski et
al., 2000; Walker, 1996) are less likely to emit alarm vocalizations because alarm
vocalizations announce their presence to a predator (Janson, 1998). This may be
especially true when the predator in question is vocalizing, because a vocalizing ambush
predator would be unlikely to be aware of the presence of the prey species (Janson,
1998). This may be the best explanation of why white-faced sakis were so reticent to
respond to harpy eagle vocalizations. Alternately, some observations of response
reactions that did not involve alarm vocalizations may have been responses to relatively
“strong” threats, as described by Gleason and Norconk (2002).
Anti-predator responses appear to be highly variable, on a population, group, and
even individual level across species. The only reliable, consistent alarm responses
throughout the study were emitted by brown capuchins at Raleighvallen. Considering
that brown capuchins are a major prey item of harpy eagles (Ford and Boinski, 2007) and
that the groups measured at Raleighvallen closely neighbored a harpy eagle nest from at
least 2002 (Boinski et al., 2003) through roughly 2007 (J. Frechette, pers. comm.), this is
not unexpected.
Although highly variable alarm responses emitted by howler monkeys is
documented elsewhere (Gil-da-Costa, 2007), howler responses at Raleighvallen were less
104
intense than expected. Multiple “grunt” vocalizations were emitted each time harpy
eagle vocalizations were broadcast at Raleighvallen, but no loud call vocalizations were
emitted. This may suggest that some groups under extreme risk of predation alter their
strategies, as Janson (1998) and Gil-da-Costa (2007) suggest is possible, or that there are
few consistencies in anti-predator response between groups and populations. This is not
unexpected, as a certain level of behavioral plasticity based on predation risk and
predator density is anticipated to be beneficial, not only in terms of activity budget
allocation, but also in terms of the strategies of the predators in question. For instance,
ranging in high canopy strata with little overhead cover is likely to be an ineffective
strategy in an area rife with soaring raptors (Boinski et al., 2000).
4.8 - Estimates of predator presence by response data
If regularity of contact with a given predator is one determinant of alarm response
of a prey species, then likely territorial ranges of a given predator may be estimated by
frequency of alarm responses in that area. If this assumption is accurate, and if harpy
eagles do in fact exist at Brownsberg, then the alarm data, as proxy measures of
perceived risk, suggest that the most likely area of regular occupation is along the slopes
of the mountain near WK trail, where the most severe alarm and mobbing responses were
noted. This is also the area where suspicious kill residue was found associated with a
feather identified by park staff and researchers as belonging to a harpy eagle.
Although the last known harpy eagle nest site is now abandoned at Raleighvallen
(J. Frechette, pers. comm.), one can infer by the reactions from the brown capuchins at

105
the park that the raptors presence is either still established, which is supported by reports
from researchers who observed harpy eagles at Raleighvallen several times during a
week-long visit in 2009 (J. Frechette, pers. comm.), or that appropriate responses, once
learned, are not easily forgotten, as suggest by Gil-da-Costa and colleagues (2003).
4.9 – Interspecific associations
This study attempted to compare responses between species, populations, and
geographic locations. One peculiar anecdotal observation was that primate groups at
Brownsberg were only found in mixed-species associations on one occasion (squirrel
monkeys and bearded sakis), unlike the frequent mixed-species associations at
Raleighvallen and elsewhere throughout the neotropics, particularly between squirrel
monkeys and brown capuchins. Studies have shown mixed-species associations to be
profitable in terms of potential reduced predation risk and actual reduced anti-predator
activity responsibilities per individual among cercopithecines (Treves, 1999) and in the
new world (Frechette, 2007; Terborgh, 1983).
CHAPTER FIVE CONCLUSION
Clearly, predation is a significant factor in the behavioral and ecological
repertoires of primates and other animals. The threat of being preyed upon has been a
major factor in the evolution of behavioral and morphological traits, and even if the risk
of predation is relatively slight, the selective pressure exerted on a population from it can
be very strong. Animals are expected to react to the perceived risk of predation rather
than the actual observed rate, and as such, correlates of perceived risk are expected to be
high even when rate of predation is not. That said, anti-predator responses are variable
between species, populations, and social groups, and may depend on several factors: a)
presence of predator species, b) frequency of interaction between predators and prey, and
c) reinforcement of ultimate predator-prey relationships by observation of successful
predator attacks.
Animals in the neotropics may face a substantial threat of predation from intact,
diverse predator guilds. Potential predators include several raptors (including harpy
eagles, crested eagles, and ornate hawk eagles), felids (including jaguars, ocelots, and
pumas), and other mammals (including tayras). All of these predators are suspected or
documented at Brownsberg and Ralighvallen. The encounter rates of primates and
primates within these parks is unknown, but it is presumed, through anecdotal,
observational, and documented evidence, that some primates at Raleighvallen have
regular, substantial contact with harpy eagles whose home ranges overlap with their own.
106
107
Therefore, it is presumed that primates at Raleighvallen likely experience higher risk of
predation than many of those studied at Brownsberg, and the empirical evidence gather in
this study may suggest that that presumption is warranted.
Habitat variables (understory density, overstory density, forest type) were found
to be effective components of species’ anti-predator strategy, as well as reasonable
predictors of the severity of other responses. Further, a variety of social and behavioral
variables appeared to influence anti-predator behavior (spatial positioning and dispersal)
and be influenced by the perceived presence of predators (activity patterns).
Use of a densiometer in this study provided a way to measure habitat variables as
they pertain to risk of predation and prey perception thereof. This is encouraging, and to
my knowledge, few primate behavioral studies have employed the use of these devices to
quantify habitat cover. Phillips and colleagues (1998) used densiometer measurements to
calibrate the effectiveness of GPS signal acquisition in different environments, while
Gross-Camp and Kaplan (2005) used them in a seed dispersal study. Vidal and Cintra
(2006) are the only study that examined canopy density and attempted to relate it to
predation risk in primates. Usefulness is not limited to predation studies, as densiometers
may be effective for the quantification of ecological and phonological variables in a
variety of research areas.
Alarm vocalizations are emitted in response to audio cues of predator presence or
the presence of unknown, alarming noises. The production of alarm vocalizations by
captive-born primates with no prior exposure to predators suggests that the production of
alarm vocalizations in certain contexts has an instinctual basis. However, frequency and
108
severity of response appears to be related to the prey species’ ability to identify the
predator vocalizations as such, and that likely depends upon frequency of interaction. If
this is accurate, alarm responses elicited by broadcasts of predator vocalizations may
provide information about the presence of predators in a given area. This is a useful
measure for researchers studying predator-prey interactions, as it may be an additional
inferential tool for estimating predator densities.
Alarm vocalizations probably serve multiple functions, possibly including
signaling predator detection, encouraging an increase in neighbor proximity, and alerting
close kin of danger. Overall frequency of alarm vocalizations is apparently related to
group size, but not exclusively, as several medium-sized groups emitted no or infrequent
alarm vocalizations.
Playback studies may be particularly effective means of studying prey response to
specific predators, because a) the predator cue eliciting the response is selected by the
observer, which allows measurement of predator-specific responses, b) measuring the
response to perceived threats of predation may be more indicative of avoidance and
deterrence strategies than the collection of baseline behaviors (such as vigilance), and c)
the observer presents minimal risk of upsetting the natural predator-prey relationship by
interfering with predation events. Therefore, playback studies featuring broadcasts of
predator vocalizations can yield valuable information regarding the anti-predator
responses within and between species.
Vigilance behavior decreased with areas of dense cover and limited visibility,
suggesting that primates perceive lower visibility, lower predation risk, or both within
109
dense habitats, and alter their strategies accordingly. This strategy would be adaptive for
any animal, because even non-intensive anti-predator strategies may limit activity
allocation to other activities, such as foraging or mating (Boinski et al., 2003; Janson,
1998; but see Treves, 1997 who argues that scanning for predators does not preclude an
individual from looking for food or mates). Therefore, those animals that can selectively
engage in differential anti-predator strategies based on the relative safety afforded by a
given habitat will theoretically have increased fitness opportunities.
Further comparative studies between groups of primates at Raleighvallen and
Brownsberg could shed additional light on the importance of intense predation threat on
the behavioral ecology of prey species, and how the threat of being eaten can foster
substantial behavioral differences between groups. This study is lacking reliable
information of vigilance behaviors at Raleighvallen, due to brief study period and
visibility issues. Bolstering of vigilance data would improve the overall comparative
quality of the study.
Additionally, future directions for the primate-community-minded study of anti-
predator strategies include attempting to use predator models to elicit response behaviors
based on visual rather than auditory cues. Lack of responses in some primates (white-
faced sakis, in particular) may indicate a stronger reliance on visual cues, which is
suggested by some reports of their responses to perceived threat (Gleason and Norconk,
2002). Therefore, to attempt to understand the intricacies of anti-predator behaviors as
completely as possible, auditory and visual stimuli should be presented to prey species,

110
and in addition, the behaviors and population densities of predators themselves should be
more intimately measured by whatever means possible.

LITERATURE CITED
Asensio N, Gómez-Marín F (2002) Interspecific interaction and predator avoidance
behavior in response to tayra (Eira barbara) by mantled howler monkeys (Alouatta palliata). Primates 43(4):339-341
Baal FLJ, Mittermeier RA, van Roosmalen MGM (1988) Primates and protected areas in
Suriname. Oryx 21(1):7-14 Bachorowski J, Owren M (2003) Sounds of emotion: Production and perception of
affect-related vocal acoustics. Annals of the New York Academy of Sciences 1000: 244-265
Baldwin JD, Baldwin JI (1976) Primate populations in Chiriqui, Panama. In: Thorington,
Jr. RW, Heltne PG (eds) Neotropical primates: field studies and conservation: pp. 20-31. Proceedings of a symposium on the distribution and abundance of Neotropical primates, National Academy of Sciences, Washington, D.C
Bezerra BM, Barnett AA, Souto A, Jones G (2008) Predation by the tayra on the common
marmoset and the pale-throated three-toed sloth. J Ethol (online advance):1-6 Bezerra BM, Souto AS (2008) The structure and useage of the vocal repertoire of
common marmosets. Int J Primatol 29:671-701 Bianchi RC, Mendes SL (2007) Ocelot (Leopardus pardalis) predation on primates in
Caratinga Biological Station, Southeast Brazil. Am J Primatol 69(10):1173-1178 Boinski S (2008) Central Suriname Nature Reserve: Primates and harpy eagles are the
beneficiaries of ten millennia of anthropogenic activity. Proceedings of the 2008 meeting of the Association for Tropical Biology and Conservation, June 9-13, Paramaribo, Suriname
Boinski S (1988) Use of a club by a wild white-face capuchin (Cebus capucinus) to
attack a venomous snake (Bothrops asper). Am J Primatol 14(2):177-179 Boinski S, Ford SM (2007) Primate predation by harpy eagles in the Central Suriname
Nature Reserve. (abstract) Am J Phys Anth (supp 44):109
111
112
Boinski S, Kauffman L, Westoll A, Stickler CM, Cropp S, Ehmke E (2003) Are vigilance, risk from avian predators and group size consequences of habitat structure? A comparison of three species of squirrel monkey (Saimiri oerstedii, S. boliviensis, and S. sciureus). Behaviour 140:1421-1467
Boinski S, Treves A, Chapman CA (2000) A critical evaluation of the influence of
predators on primates: effects of group travel. In: Boinski S, Garber PA (eds) On the Move: How and Why Animals Travel in Groups. University of Chicago Press:Chicago:43-72
Boinski S, Gross TS, Davis JK (1999) Terrestrial predator alarm vocalizations area a
valid monitor of stress in captive brown capuchins (Cebus apella). Zoo Biol 18:295-312
Boinski S, Newman JD (1988) Preliminary observations on squirrel monkey (Saimiri
oerstedi) vocalizations in Costa Rica. Am J Primatol 14:329-343 Buchanan DB, Mittermeier RA, van Roosmalen MGM (1981) The saki monkeys, genus
Pithecia. In: Coimbra-Filho AF, Mittermeier RA (eds) Ecology and Behavior of Neotropical Primates. Academia Brasileira de Ciências:Rio de Janeiro:p.391-417
Buzzard PJ (2006) Cheek pouch use in relation to interspecific competition and predator
risk for three guenon monkeys (Cercopithecus spp.). Primates 47:336-341 Chapman CA (1986) Boa constrictor predation and group response in white faced Cebus
monkeys. Biotropica 18:171-172 Chapman CA, Chapman LJ, Lefebvre L (1990) Spider monkey alarm calls: Honest
advertisement or warning kin? Anim Behav 39:197-198 Cheney DL, Seyfarth RM (1981) Selective forces affecting the predator alarm calls of vervet
monkeys. Behaviour 76(1/2):25-61 Cheney DL, Wrangham RW (1987) Predation. In: Smuts BB, Cheney DL, Seyfarth RM,
Wrangham RW, Strusaker TT (eds) Primate Societies. University of Chicago Press:Chicago:227-239
Cisneros-Heredia DF, Leon-Reyes A, Seger S (2005) Boa constrictor predation on a titi
monkey, Callicebus discolor. Neotrop Primates 13(3):11-12 Cook JG, Stutzman TW, Bowers CW, Brenner KA, Irwin LL (1995) Spherical densiometers
produce biased estimates of forest canopy cover. Wildlife Society Bulletin 23(4):711- 717

113
Cords M (1990) Vigilance and mixed-species association of some East African forest monkeys. Behav Ecol Sociobiol 26:297-300
Cowlishaw CG (1997) Trade-offs between foraging and predation risk determine habitat use in
a desert baboon population. Anim Behav 53: 667-686 Cowlishaw G (1994) Vulnerability to predation in baboon populations. Behaviour
131(3/4):293-304 Crompton RH, Sellers WI (2007) A consideration of leaping locomotion as a means of predator
avoidance in prosimian primates. In: Gursky S, Nekaris KAI (eds) Primate Anti-Predator Strategies. Springer:New York: p.127-145
da Cunha RGT, Jalles-Filho E (2007) The roaring of southern brown howler monkeys
(Alouatta guariba clamitans) as a mechanism of active defense of borders. Folia Primatol 78(4):259-271
Day RT, Elwood RW (1999) Sleeping site selection by the golden-handed tamarin Saguinas
midas midas: the role of predation risk, proximity to feeding sites, and territorial defence. Ethology 105: 1035-1051
de Dijn BPE, Molgo IE, Norconk MA, Gregory LT, O’Shea B, Marty C, Luger M, Ringler M,
Crothers S IV, Noonan B, Fitzgerald K, Mitro S, Vreedzaam A, Satyawan D (2006) The biodiversity of the Brownsberg.
Di Bitetti MS, Janson CH (2001) Social foraging and the finder’s share in capuchin monkeys,
Cebus apella. Anim Behav 62:47-56 Dunbar RIM (1988) Primate Social Systems Cornell University Press:Ithaca
Eason P (1989) Harpy eagle attempts predation on adult howler monkey. Condor 91(2):469-
470 Elgar MA (1989) Predator vigilance and group size in mammals and birds: a critical review of
the empirical evidence. Biol Rev 64:13-33 Emmons LH (1987) Comparative feeding ecology of felids in a Neotropical rainforest. Behav
Ecol Sociobiol 20:271-283 Enstam KL (2007) Effects of habitat structure on perceived risk of predation and anti-predator
behavior of Vervet (Cercopithecus aethiops) and Patas (Erythrocebus patas) monkeys. In: Gursky S, Nekaris KAI (eds) Primate Anti-Predator Strategies. Springer:New York: p.308-338
114
Enstam KL, Isbell LA (2004) Microhabitat preference and vertical use of space by patas monkeys (Erythrocebus patas) in relation to predation risk and habitat structure. Folia Primatol 75:70-84
Enstam KL, Isbell LA (2002) Comparison of responses to alarm calls by patas (Erythrocebus patas) and vervet (Cercopithecus aethiops) monkeys in relation to habitat structure. Am J Phys Anth 119:3-14
Ferrari, SF (2009) Predation risk and anti-predator strategies. In: Garber PA, Estrada A, Bicca-Marques JC, Heymann EW, Strier KB (eds) South American Primates: Comparative Preerspectives in the Study of Behavior, Ecology, and Conservation. Springer:New York:p. 251-277
Fischer J, Metz M, Cheney DL, Seyfarth RM (2001) Baboon responses to graded bark
variants. Anim Behav 61:925-931 Fitzgerald KA, de Dijn BPE, Mitro S (2002) Brownsberg Nature Park: Ecological research and
monitoring program 2001-2006. Paramaribo, Suriname: STINASU, Foundation for Nature Conservation in Suriname
Fleagle JG (1999) Primate Adaptation and Evolution, Second Edition. Academic Press:New
York Ford SM, Boinski S (2007) Primate predation by Harpy eagles in the Central Suriname
Nature Reserve. Am J Phys Anth Supp 44: 109
Ford SM (1994) Evolution of sexual dimorphism in body weight in platyrrhines. Am J Primatol 34:221-244
Ford SM, Davis LC (1992) Systematics and body size: implications for feeding
adaptations in New World monkeys. Am J Phys Anth 88:415-468 Fowler JM, Cope JB (1964) Notes on the harpy eagle in British Guiana. Auk 81(3):257-
273 Franklin SP, Hankerson SJ, Baker AJ, Dietz JM (2007) Golden lion tamarin sleeping-site
use and pre-retirement behavior during intense predation. Am J Primatol 69:325- 335
Frechette JL (2007) Squirrel monkey aerial alarm calls and predator aversion as proxy
measures of perceived risk in a heterogeneous Suriname forest. Master’s Thesis, University of Florida
Freese CH, Oppenheimer JR (1981) The capuchin monkeys, genus Cebus. In: Coimbra-
Filho AF, Mittermeier RA (eds) Ecology and Behavior of Neotropical Primates, vol. 1.Academia Brasileira de Ciências:Rio de Janeiro:p.331-390
115
Friant SC, Campbell MW, Snowdon CT (2008) Captive-born cotton-top tamarins (Saguinas oedipus) respond similarly to vocalizations of predators and sympatric non-predators. Am J Primatol 70:707-710
Galef BG Jr., Mittermeier RA, Bailey RC (1976) Predation by the tayra (Eira barbara). J
Mammal 57:760-761 Gautier-Hion A, tutin CEG (1988) Simultaneous attack by adult males of a polyspecific troop
of monkeys against a crowned hawk eagle. Folia Primatol 51:149-151 Gebo DL, Chapman CA, Chapman LJ, Lambert J (1994) Locomotor response to predator threat
in red colobus monkeys. Primates 35(2):219-223 Gil-da-Costa R (2007) Howler monkeys and harpy eagles: a communications arms race.
In: Gursky S, Nekaris KAI (eds) Primate Anti-Predator Strategies. Springer:New York: p. 289-307
Gil-da-Costa R, Palleroni A, Hauser MD, Touchton J, Kelley JP (2003) Rapid acquisition
of an alarm response by a neotropical primate to a newly introduced avian predator. Proc R Soc Lond 270:605-610
Gilbert KA (2000) Attempted predation on a white-faced saki in Central Amazon.
Neotrop Primates 8(3):103-104 Gleason TM, Norconk MA (2002) Predation risk and antipredator adaptations in white-
faced sakis, Pithecia pithecia. In: Miller LE (ed) Eat or Be Eaten: Predator Sensitive Foraging Among Primates. Cambridge University Press:New York:169- 184
Gross-Camp NG, Kaplan BA (2005) Chimpanzee (Pan troglodytes) seed dispersal in an afromontane forest: An examination of microhabitat influences on the post-dispersal fate of large seeds. Biotropica 37(4):641-649
Gursky S (2005) Predator mobbing in Tarsius spectrum. Int J Primatol 26(1): 207-221 Hagey LR, Fry BG, Fitch-Snyder H (2007) Talking defensively, a dual use for the brachial
gland exudates of slow and pygmy lorises. In: Gursky S, Nekaris KAI (eds) Primate Anti-Predator Strategies. Springer:New York: p.253-272
Hamilton WD (1971) Geometry for the selfish herd. J Theor Biol 31: 295-311
Hart D (2007) Predation on primates: a biogeographical analysis. In: Gursky S, Nekaris KAI
(eds) Primate Anti-Predator Strategies. Springer:New York: p. 27-59
116
Henline WT (2007) Vocal repertoire of white-faced sakis (Pithecia pithecia). Master’s Thesis, Eastern Kentucky University
Heymann EW (1987) A field observation of predation on a moustached tamarin
(Saguinas mystax) by an anaconda. Int J Primatol 8(2):193-195 Heymann EW (1990) Reactions of wild tamarins, Saguinas mystax and Saguinas fuscicollis to
avian predators. Int J Primatol 11(4):327-337 Hill RA, Lee PC (1998) Predation risk as an influence on group size in cercopithecoid
primates: Implications for social structure. J Zool Lond 245: 447-456
Hill RA, Weingrill T (2007) Predation risk and habitat use in Chacma Baboons (Papio hamadryas ursinus). In: Gursky S, Nekaris KAI (eds) Primate Anti-Predator Strategies. Springer:New York: p.253-272
Hilty SL (2003) Birds of Venezuela Princeton University Press:Princeton Isbell LA (1994) Predation on primates: ecological patterns and evolutionary
consequences. Evol Anthrop 3:61-71 Janson CH (1998) Testing the predation hypothesis for vertebrate sociality: prospects and
pitfalls. Behaviour 135(4):389-410 Janson CH (1992) Evolutionary ecology of primate social structure. In: Smith EA,
Winterhalder B (eds) Evolutionary Ecology and Human Behavior. Aldine de Gruyter:New York:95-110
Julliot C (1994) Predation of a young spider monkey (Ateles paniscus) by a crested eagle
(Morphnus guianensis). Folia Primatol 63(2):75-77 Karpanty SM (2006) Direct and indirect impacts of raptor predation on lemurs in
southeastern Madagascar. Int J Primatol 27(1):239-261 Kirchof J, Hammerschmidt K (2006) Functionally referential alarm calls in tamarins
(Saguinas fuscicollis and S. mystax) – evidence from playback experiments. Ethology 112:346-354
Lim BK, Engstrom MD, Genoways HH, Catzeflis FM, Fitzgerald KA, Peters SL,
Djosetro M, Brandon S, Mitro S (2005) Results of the ALCOA Foundation- Suriname Expeditions. XIV. Mammals of the Brownsberg Nature Park, Suriname. Annals of Carnegie Museum 74(4):225-274

117
Lima SL (1992) Strong preferences for apparently dangerous habitats? A consequence of differential escape from predators. Oikos 64(3):597-600
Lima SL, Bednekoff PA (1999) Temporal variation in danger drives antipredator
behavior: the predation risk allocation hypothesis. Am Nat 153(6):649-659 Lima SL, Dill LM (1990) Behavioral decisions made under the risk of predation: a
review and prospectus. Can J Zool 68:619-640 Ludwig G, Aguiar LM, Miranda JMD, Teixeira GM, Svoboda WK, Malanski LS,
Shiozawa MM, Hilst CLS, Navarro IT, Passos FC (2007) Cougar predation on Black-and-Gold Howlers on Mutum Island, Southern Brazil. Int J Primatol 28(1):39-46
Martins SS, Lima EM, Silva JS Jr. (2005) Predation of a bearded saki (Chiropotes utahicki) by
a harpy eagle (Harpia harpyja). Neotrop Primates 13(1): 7-10 Mendes Pontes AR, Soares ML (2005) Sleeping sites of common marmosets (Callithrix
jacchus) in defaunated urban forest fragments: a strategy to maximize food intake. J Zool Lond 266:55-63
Miranda JMD, Bernardi IP, Moro-Rios RF, Passos FC (2006) Antipredator behavior of
brown howlers attacked by black hawk-eagle in southern Brazil. Int J Primatol 27(4):1097-1101
Miranda JMD, Bernardi IP, Abreu KC, Passos FC (2005) Predation on Alouatta guariba
clamitans Cabrera (Primates, Atelidae) by Leopardus pardalis (Linnaeus)(Canivora, Felidae). Rev Bras Zool 22:793-795
Mitani JC, Sanders WJ, Lwanga JS, Windfelder TL (2001) Predatory behavior of
crowned hawk-eagles (Stephanoaetus coronatus) in Kibale National Park, Uganda. Behav Ecol Sociobiol 49:187-195
Mittermeier RA, van Roosmalen MGM (1981) Preliminary observations on habitat
utilization and diet in eight Surinam monkeys. Folia primatol 36:1-39 Moynihan M (1970) Some behavioral patterns of platyrrine monkeys. II. Saguinus
geoffroyi and some other tamarins. Smith Cont Zool 28:1-77 Norris JC (1990) The semantics of Cebus olivaceous alarm calls: object designation and
attribution (abstract). Am J Primatol 20:216
118
Oliveira VB, Linares AM, Corrêa GLC, Chiarello AG (2008) Predation on the black capuchin monkey Cebus nigritus (Primates: Cebidae) by domestic dogs Canis lupus familiaris (Carnivora: Canidae) in the Parque Estadual Serra do Brigadeiro, Minas Gerais, Brazil. Rev Bras Zool 25(2):376-378
Olmos F (1994) Jaguar predation on muriqui Brachyteles arachnoids. Neotrop Prim 2:16 Owens NW, Goss-Custard JD (1976) The adaptive significance of alarm calls given by
shorebirds on their winter feeding grounds. Evolution 30(2):397-398 Owren MJ, Rendall D (2001) Sound on the rebound: bringing form and function back to
the forefront in understanding nonhuman primate vocal signaling. Evol Anthrop 10(2):58-71
Peetz A, Norconk MA, Kinzey WG (1992) Predation by jaguar on howler monkeys
(Alouatta seniculus) in Venezuela. Am J Primatol 28:223-228 Peres CA (1990) A harpy eagle successfully captures an adult male red howler monkey.
Wilson Bulletin 102(3):560-561 Phillips K (1995) Differing responses to a predator (Eira barbara) by Alouatta and
Cebus. Neotrop Primates 3(2):45-46 Phillips K, Elvey CR, Abercrombie CL (1998) Applying GPS to the study of primate
ecology: a useful tool? Am J Primatol 46:167-172 Piana RP (2002) The Harpy Eagle (Harpia harpyja) in the Infierno native community.
Unpublished Report. Rainforest Expeditions. Lima, Peru Reichart H A (1993) Raleighvallen/Voltzberg Nature Reserve Management Plan 1993 -1997.
LBB, STINASU, WWF Rettig NL (1978) Breeding behavior of the Harpy Eagle. Auk 95: 629-643 Robinson JG (1984) Syntactic structures in the vocalizations of wedge-capped capuchin
monkeys, Cebus olivaceus. Behaviour 90(1/3):46-79 Seyfarth RM, Cheney DL, Marler P (1980) Monkey responses to three different alarm
calls: evidence of predator classification and semantic communication. Science 210:801-803
Sherman PT (1991) Harpy eagle predation on a red howler monkey. Folia Primatol
56(1):53-56
119
Silva SSB, Ferrari SF (2009) Behavior patterns of southern bearded sakis (Chiropotes satanas) in the fragmented landscape of eastern Brazilian Amazonia. Am J Primatol 71:1-7
Sproul C, Palleroni A, Hauser MD (2006) Cottontop tamarin, Saguinas oedipus, alarm calls
contain sufficient information for recognition of individual identity. Anim Behav 72:1379-1385
Stanford C (2002) Avoiding predators: expectations and evidence in primate antipredator
behavior. Int J Primatol 23(4): 741-757 Stephan C, Zuberbühler K (2008) Predation increases acoustic complexity in primate
alarm calls. Biol Lett 4:641-644 Terborgh J (1983) Five New World Primates Princeton University Press:Princeton Thiollay JM (1989) Area requirements for the conservation of rain forest raptors and game
birds in French Guiana. Conserv Biol 3:128-137 Touchton JM, Hsu YC, Palleroni A (2002) Foraging ecology of reintroduced captive-bred
subadult harpy eagles (Harpia harpyja) on Barro Colorado Island, Panama. Ornit Neotrop 13:365-379
Trail PW (1987) Predation and antipredator behavior at Guianan Cock-of-the-Rock leks. Auk
104:496-507 Treves A (1999) Has predation shaped the social systems of arboreal primates? Int J Primatol
20(1): 35-67 Treves A (1997) Vigilance and use of micro-habitat in solitary rainforest animals. Mammalia
61(4):511-525
van Roosmalen MGM, Mittermeier RA, Fleagle JG (1988) Diet of the northern bearded saki (Chiropotes satanas chiropotes): A neotropical seed predator. Am J Primatol 14:11-35
van Schaik CP, van Noordwijk MA (1989) The special role of male Cebus monkeys in
predation avoidance and its effect on group composition. Behav Ecol Sociobiol 24:265- 276
Vasquez MRO, Heymann EW (2001) Crested eagle (Morphnus guianensis) predation on infant tamarins (Saguinas mystax and Saguinas fuscicollis, Callitrichinae). Folia Primatol 72(5):301-303

120
Vidal MD, Cintra R (2006) Effects of forest structure components on the occurren, group size, and density of groups of bare-faced tamarin (Saguinus bicolor – Primates:Callitrichinae) in Central Amazonia. Acta Amazonica 36(2):237-248
Walker SE (1996) Leaping behavior of Pithecia pithecia and Chiropotes satanas in
eastern Venezuela. Am J Primatol 66:369-387 Wheeler BC (2008) Selfish or altruistic? An analysis of alarm call function in wild
capuchin monkeys, Cebus apella nigritus. Anim Behav 76:1465-1475 Winter P, Ploog D, Latta J (1966) Vocal repertoire of the squirrel monkey (Saimiri
sciureus), its analysis and significance. Experimental Brain Res 1:359-384 Zar, JH (1984) Biostatistical Analysis: Second Edition. Prentice Hall:Englewood Cliffs. Zuberbühler K (2007) Predation and primate cognitive evolution. In: Gursky S, Nekaris KAI
(eds) Primate Anti-Predator Strategies. Springer:New York: p. 3-26 Zuberbühler K (2000) Causal cognition in a non-human primate: field playback
experiments with Diana monkeys. Cognition 76: 195-207 Zuberbühler K, Jenny D, Bsharry R (1999) The predator deterrence function of primate
alarm calls. Ethology 105:477-490 Zuberbühler K, Nöe R, Seyfarth RM (1997) Diana monkey long-distance calls: messages
for conspecifics and predators. Anim Behav 53: 589-604