responsiveness and minimal important change of the
TRANSCRIPT

RESEARCH ARTICLE Open Access
Responsiveness and minimal importantchange of the QuickDASH and PSFS whenused among patients with shoulder painTarjei Rysstad1*, Margreth Grotle1,2, Lars Petter Klokk3 and Anne Therese Tveter1
Abstract
Background: The Quick Disabilities of the Arm, Shoulder and Hand questionnaire (QuickDASH) and the Patient-Specific Functional Scale (PSFS) are commonly used outcome instruments for measuring self-reported disability inpatients with shoulder pain. To date, few studies have evaluated the responsiveness and estimated their minimalimportant change (MIC). Further assessment will expand the current knowledge and improve the interpretability ofthese instruments in clinical and research practice. The purpose of this prospective cohort study with 3 monthsfollow-up was to evaluate the responsiveness of the QuickDASH and PSFS in patients with shoulder pain, and toestimate their MICs by using two different anchor-based methods.
Methods: Patients with shoulder pain recruited at a multidisciplinary hospital outpatient clinic completed theQuickDASH and PSFS at baseline and at 3 months follow-up. The responsiveness was evaluated by using a criterionapproach with the area under the receiver operating characteristic curve (AUC) and a construct approach by testing9 a-priori hypotheses. The MIC was assessed using two anchor-based MIC methods.
Results: 134 patients participated at baseline and 117 (87.3%) at 3 months follow-up. The AUC was acceptable forboth QuickDASH (0.75) and PSFS (0.75). QuickDASH met 7 (77.8%) and PSFS 8 (88.9%) of the hypotheses. None ofthe instruments showed signs of floor and ceiling effects. The MIC estimates ranged from 10.8 to 13.6 forQuickDASH and from 1.9 to 2.0 for PSFS, depending on the method used.
Conclusion: This study demonstrates that both the QuickDASH and PSFS are responsive measures of disability inpatients with shoulder pain. The estimated MIC values were presented.
Keywords: Clinimetrics, Outcome measures, Functional limitation, COSMIN
BackgroundShoulder pain is a common musculoskeletal conditionthat can often lead to considerable disability [1], impact-ing the performance of daily activities and restrict par-ticipation in major life areas such as work, education,community, social and civil life [2, 3].
It is important to capture the patients’ functional dis-ability in both clinical practice and research. Patient-reported outcome measures (PROMs) can be used to as-sess patients’ perceived degree of disability at both indi-vidual and group level. In the last decade, several region-specific and patient-specific questionnaires for assessingfunctional status in shoulder patients have been devel-oped [4–6]. Of these, the Disabilities of the Arm, Shoul-der and Hand questionnaire (DASH) and its shortversion (QuickDASH) are frequently used PROM andtheir measurement properties have been widely
© The Author(s). 2020 Open Access This article is licensed under a Creative Commons Attribution 4.0 International License,which permits use, sharing, adaptation, distribution and reproduction in any medium or format, as long as you giveappropriate credit to the original author(s) and the source, provide a link to the Creative Commons licence, and indicate ifchanges were made. The images or other third party material in this article are included in the article's Creative Commonslicence, unless indicated otherwise in a credit line to the material. If material is not included in the article's Creative Commonslicence and your intended use is not permitted by statutory regulation or exceeds the permitted use, you will need to obtainpermission directly from the copyright holder. To view a copy of this licence, visit http://creativecommons.org/licenses/by/4.0/.The Creative Commons Public Domain Dedication waiver (http://creativecommons.org/publicdomain/zero/1.0/) applies to thedata made available in this article, unless otherwise stated in a credit line to the data.
* Correspondence: [email protected] of Health Sciences, Department of Physiotherapy, Oslo MetropolitanUniversity, P.O. Box 4, St Olavs Plass, Oslo, NorwayFull list of author information is available at the end of the article
Rysstad et al. BMC Musculoskeletal Disorders (2020) 21:328 https://doi.org/10.1186/s12891-020-03289-z

evaluated in patients with proximal upper extremity dis-orders [7–12]. A recent systematic review highlightedthe scant evidence investigating the measurement prop-erties of the QuickDASH in patients with shoulder pain[13]. Another questionnaire that has received consider-able attention is the Patient-Specific Functional Scale(PSFS), which is eliciting activities that are most import-ant to the individual patient. Several guidelines have rec-ommended the use of the PSFS in management ofdifferent musculoskeletal conditions [14–16]. Othershave also recommended the use of the PSFS in additionto condition-specific measures to complement the activ-ity and participation components [6, 17]. If used asPROMs in clinical or research settings, high-qualitystudies to thoroughly evaluate their measurement prop-erties are required [18].The measurement properties of a PROM are popula-
tion and context-specific, and should therefore be evalu-ated in different patient populations and clinical studycontexts before they are used in clinical and researchpractice [19, 20]. In addition to reliability and validity,responsiveness is an important measurement propertywhich aims to evaluate the PROMs ability to capturechange over time [21]. Ideally, the responsiveness of aninstrument used as an outcome in clinical or researchenvironments should be high [20].For the interpretation of change scores among individual
patients, the Minimal Important Change (MIC) is an im-portant estimate for both clinicians and researchers whoare using the PROM. The MIC is defined as ‘the smallestchange in score that patients perceive to be important’ [20],where a change score exceeding this value would provideinformation to the clinician that a change in treatment hasoccurred [19]. A number of anchor-based and distribution-based methods have been used to determine the MIC [19,22, 23]. The COSMIN group recommends anchor-basedmethods for estimating the MIC because they relate to anexternal anchor regarding the patient’s perceived change ofthe treatment [20]. It has been recommended that re-searches use multiple methods to triangulate MIC resultsbecause the MIC is not a fixed value but influenced by con-text, calculation method and baseline severity [19, 22, 24].Recently, a predictive modelling MIC method has beenfound to be a more accurate calculation of the anchor-based MIC [23, 25]. However, this method has never beenused to calculate the MIC for PROMs used in patients withshoulder pain. Moreover, the responsiveness and MICvalues of the Norwegian versions of the QuickDASH andPSFS has not been assessed before in a cohort of patientswith shoulder pain undergoing physical therapy.This study aims to expand on this current know-
ledge by evaluating the responsiveness and the MICof both the QuickDASH and PSFS in patients withshoulder pain.
MethodsStudy designThis study is a prospective cohort study with 3-monthsfollow-up. Outcomes were measured at baseline and 3months after undergoing physiotherapy treatment. Eth-ical committee approval was obtained from the localethical committee (2018/1191 C). All participants signedinformed consent.
ParticipantsParticipants were recruited from a multidisciplinary hos-pital outpatient clinic for shoulder patients at ÅlesundHospital in Norway between March 2015 to January2018. All potential participants received a detailed ex-planation of the study from the research coordinator.Participants were eligible for inclusion if they were diag-nosed with shoulder pain by one of the physicians at theclinic, aged 18 years or older, and adequately understoodthe Norwegian language. Exclusion criteria were system-atic disease or generalised pain, cardiac disease, symp-toms of cervical spine disease or surgery in the affectedshoulder within the last 6 months.
TreatmentThe patients were referred to ‘usual physiotherapy treat-ment’ for the management of their shoulder pain withinprimary and secondary care. The physiotherapy sessionswere not standardised when it comes to how many treat-ment sessions were given, length and components of theintervention.
Outcome measuresAt baseline, all included patients completed a booklet ofquestions (paper and pen administered) prior to theirfirst consultation with the physician at the outpatientclinic. The booklet consisted of demographic variables,QuickDASH, PSFS and comparator instruments, all inNorwegian. At the 3-month follow-up, the participantswere also requested to fill out a Global Rating of Changescale in addition to the baseline questions.
QuickDASHThe QuickDASH consists of 11 questions covering 6 do-mains (daily activities, symptoms, social function, workfunction, sleep, and confidence) [26]. Each item is ratedon a 5-point Likert scale, from 1 (no difficulty) to 5 (un-able). The score is converted into a 100-point scale, where100 represents greatest disability. Ten of 11 items are ne-cessary for calculating the QuickDASH score [9, 10]. Astrong correlation has been found between the Quick-DASH and its longer version (DASH) [10, 27], and sup-port for both these questionnaires in shoulder patients hasbeen reported recently [4, 11, 28, 29]. The MIC has beenreported in patients with upper extremity conditions,
Rysstad et al. BMC Musculoskeletal Disorders (2020) 21:328 Page 2 of 12

ranging from 8.2 to 13.4 [30–32]. The cross-culturaladapted Norwegian version was used in this study [33].
The Patient-Specific Functional ScaleThe PSFS consists of a standardised script for elicitingactivities that are most important to an individual pa-tient [34]. In the original version of the PSFS, patientsare asked to define 3 to 5 activities they are having diffi-culty with. In this study, patients were asked to define 3main activities currently difficult or impossible to per-form as a result of their condition or injury. Of these 3activities, the patients were asked to identify the mostimportant one. Each activity was rated on an 11-pointscale, 0–10, where 0 is “Unable to perform the activity”and 10 is “Able to perform the activity at the same levelas before injury or problem”. An average PSFS score wasobtained by summing the ratings of the nominated activ-ities and dividing by the number of defined activities (upto 3). Studies have supported the use of PSFS in patientswith shoulder pain [5, 6, 35]. The MIC has also been re-ported in patients with upper extremity conditions, ran-ging from 1.4 to 2.7 [36, 37].
Comparator instrumentsPain intensity was measured asking patients to rate theiraverage shoulder pain over the last 2 weeks on a Nu-meric Rating Scale (NRS), ranging from 0 (´no pain´) to10 (´the worst imaginable pain´). The NRS has shown tohave good validity and responsiveness in patients withshoulder disorders [35]. Workability was measured bythe single item “Current workability compared with thelifetime best” from the Work Ability Index (WAI),scores range from 0 to 10, higher score indicates betterwork ability [38]. Kinesiophobia was measured with asingle question, referred to as the single Substitute Ques-tion of Kinesiophobia (SQK): “How much ‘fear’ do youhave that these complaints would be increased by phys-ical activity?”, scores range from 0 to 10, where higherscore indicates more kinesiophobia [39, 40]. Emotionaldistress was measured with the Hopkins SymptomChecklist (HSCL-25), consisting of 25 items that arerated from 1 (´not at all´) to 4 (´extremely´). The totalscore, average of the 25 items, was calculated [41].
Global Perceived Effect scale (GROC)At the 3 months follow-up, the participants also com-pleted a global rating of change scale (GROC) and wereasked to rate their change in shoulder function in rela-tion to the most important activity (“Compared to thestart of the treatment and related to my most importantactivity rated in the PSFS, I am now feeling:”) on a 7-point Likert scale with the response categories: (1) verymuch improved, (2) much improved, (3) slightly im-proved, (4) unchanged, (5) slightly worsened, (6) much
worsened, and (7) very much worsened. Different GROCscales have shown good test-retest reliability in severalmusculoskeletal disorders, including shoulder pain [42].
Statistical analysisAll statistical analyses were performed with SPSS version24 for Mac (IBM Corporation, Armonk, NY). Descrip-tive statistics were computed to describe the sociodemo-graphic and clinical characteristics. Change scores of theQuickDASH, PSFS and comparator instruments wereobtained by subtracting the follow-up score (3 months)from the baseline score. Data were considered incom-plete if more than 2 items of the QuickDASH weremissing, if none activities were reported in the PSFS, orthe GROC score was missing. These incomplete datawere not included in the data analysis. For both respon-siveness and MIC assessment, Cohen’s correlationthreshold of 0.35 was used to define an acceptable asso-ciation between the anchor (GROC) and the PROMschange scores [19, 43].This study followed the recommendation of the COS-
MIN group [20] and the COSMIN Risk of Bias checklist[18] when determining responsiveness and MIC of theQuickDASH and PSFS.
Floor and ceiling effectsThe presence of floor or ceiling effects has a conse-quence for the responsiveness and MIC of a PROM,since the patients cannot show any further change. Flooror ceiling effects were considered to be present if morethan 15% of the respondents achieved the minimum ormaximum of possible score [20].
Responsiveness assessmentResponsiveness was, according to the COSMIN guide-lines [21, 44], assessed by 2 methods: (1) the criterionapproach by assessing the area (AUC) under the Re-ceiver Operating Curve (ROC) and (2) the construct ap-proach by hypotheses testing.To assess the criterion approach, the population was
dichotomised into an ‘improved’ group and an ‘un-changed’ group. There is no consensus of the categorisa-tion of the GROC concerning the improved andunchanged group, and various categories have been used[31, 45, 46]. In this study, patients classified as ‘verymuch improved’ and ‘much improved’ on the GROCwere considered improved, and those classified as‘slightly improved’, unchanged’ and ‘slightly worsened’were considered unchanged [20]. Slight changes aretherefore considered as less likely to be clinically mean-ingful. Patients who reported deterioration were ex-cluded. The AUC was calculated as the ability of theQuickDASH and PSFS to discriminate between patients
Rysstad et al. BMC Musculoskeletal Disorders (2020) 21:328 Page 3 of 12
classified as ‘improved’ and ‘unchanged’. An AUC of atleast 0.70 was regarded as acceptable responsiveness [20].To assess the construct approach, 9 a-priori hypoth-
eses were formulated and tested for both the Quick-DASH and PSFS. These hypotheses were based onreported evidence about the PROMs and consensusamong the study investigators, described in Table 1. Thedata were assumed to be normally distributed if therewas no or minimal difference between the mean andmedian value, confirmed by histograms, Q plot and theShapiro-Wilk test. Pearson correlation coefficient wasused if the data were normally distributed, otherwise, aSpearman’s rank correlation coefficient was used. A cor-relation of less than 0.30 indicates a weak correlation, atleast 0.30 and less than 0.60 indicates moderate correl-ation, and a correlation at least 0.60 indicates good cor-relation [53]. The standardised response mean (SRM)was calculated by dividing the mean change score by thestandard deviation (SD) of the change. The effect size(ES) was calculated by dividing the mean change scoreby the SD of the baseline scores [54]. An instrument wasconsidered having acceptable responsiveness, based onthe construct approach, if meeting at least 75% of thehypotheses according to the COSMIN guidelines [20].
MIC assessmentThe MICs were calculated with 2 anchor-based methodsfor MIC estimation; the ROC method (MICROC) and thepredictive modelling method (MICpred). The GROC wasused as an anchor in both methods. When it comes tothe estimation of the PSFS MIC, the PSFS scale wasreversed.To assess the MICROC, the anchor distinguishes be-
tween patients who are ‘improved’ and patients who areconsidered ‘unchanged’, based on the same criteria asthe responsiveness assessment. The MIC was estimatedas the optimal cut-off point on the ROC curve, the valuethat represents the lowest overall misclassificationswhere both sensitivity and 1-specificity are maximised[19, 20]. The sensitivity relates to the proportion of im-proved patients according to the anchor who is correctlyclassified as improved by the PROM. The specificity isthe proportion of unchanged patients according to theanchor who is correctly identified by the PROM as notchanged.The MICpred is based on a logistic regression, using
the dichotomised anchor response to predict whether apatient belongs to the improved or unchanged groupusing the change in the QuickDASH/PSFS scores as the
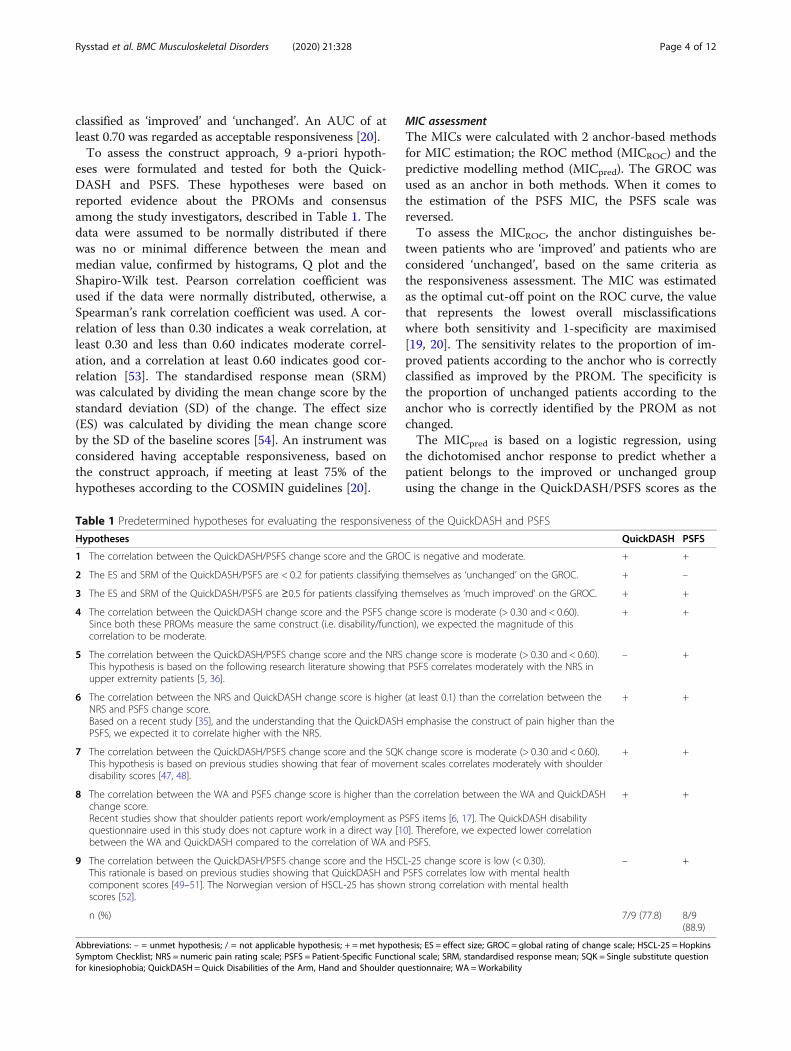
Table 1 Predetermined hypotheses for evaluating the responsiveness of the QuickDASH and PSFS
Hypotheses QuickDASH PSFS
1 The correlation between the QuickDASH/PSFS change score and the GROC is negative and moderate. + +
2 The ES and SRM of the QuickDASH/PSFS are < 0.2 for patients classifying themselves as ‘unchanged’ on the GROC. + –
3 The ES and SRM of the QuickDASH/PSFS are ≥0.5 for patients classifying themselves as ‘much improved’ on the GROC. + +
4 The correlation between the QuickDASH change score and the PSFS change score is moderate (> 0.30 and < 0.60).Since both these PROMs measure the same construct (i.e. disability/function), we expected the magnitude of thiscorrelation to be moderate.
+ +
5 The correlation between the QuickDASH/PSFS change score and the NRS change score is moderate (> 0.30 and < 0.60).This hypothesis is based on the following research literature showing that PSFS correlates moderately with the NRS inupper extremity patients [5, 36].
– +
6 The correlation between the NRS and QuickDASH change score is higher (at least 0.1) than the correlation between theNRS and PSFS change score.Based on a recent study [35], and the understanding that the QuickDASH emphasise the construct of pain higher than thePSFS, we expected it to correlate higher with the NRS.
+ +
7 The correlation between the QuickDASH/PSFS change score and the SQK change score is moderate (> 0.30 and < 0.60).This hypothesis is based on previous studies showing that fear of movement scales correlates moderately with shoulderdisability scores [47, 48].
+ +
8 The correlation between the WA and PSFS change score is higher than the correlation between the WA and QuickDASHchange score.Recent studies show that shoulder patients report work/employment as PSFS items [6, 17]. The QuickDASH disabilityquestionnaire used in this study does not capture work in a direct way [10]. Therefore, we expected lower correlationbetween the WA and QuickDASH compared to the correlation of WA and PSFS.
+ +
9 The correlation between the QuickDASH/PSFS change score and the HSCL-25 change score is low (< 0.30).This rationale is based on previous studies showing that QuickDASH and PSFS correlates low with mental healthcomponent scores [49–51]. The Norwegian version of HSCL-25 has shown strong correlation with mental healthscores [52].
– +
n (%) 7/9 (77.8) 8/9(88.9)
Abbreviations: – = unmet hypothesis; / = not applicable hypothesis; + =met hypothesis; ES = effect size; GROC = global rating of change scale; HSCL-25 = HopkinsSymptom Checklist; NRS = numeric pain rating scale; PSFS = Patient-Specific Functional scale; SRM, standardised response mean; SQK = Single substitute questionfor kinesiophobia; QuickDASH = Quick Disabilities of the Arm, Hand and Shoulder questionnaire; WA =Workability
Rysstad et al. BMC Musculoskeletal Disorders (2020) 21:328 Page 4 of 12
predictor [25]. The MICpred is calculated using the equa-tion [ln(pre-odds) – C]/B, where C is the intercept andB is the regression coefficient for the change in theQuickDASH/PSFS scores from the logistic regressionmodel [25]. If the proportion of improved participantson the GROC is considerably smaller or larger than0.50, it is suggested that an adjusted MIC needs to becalculated [23]. For the present study, the proportion ofimproved participants on the GROC was 0.48, therefore,an adjusted MIC was not calculated.Since the MIC has shown to be influenced by the
baseline score of the patients [24], we carried out a sub-group analysis to assess the difference in MIC valueswith high and low baseline QuickDASH/PSFS scores.The median QuickDASH/PSFS baseline score was usedto divide the population into the two subgroups. TheROC method (MICROC) was used when estimating theMIC for baseline scores.
ResultsA total of 241 patients with shoulder conditions were re-ferred to the hospital-based outpatient clinic and invitedto participate in the study. One hundred and thirty-fourpatients met the inclusion criteria, accepted the invita-tion and were recruited for the study. Of these patients,17 did not complete the follow-up assessment at 3months. In total, 117 patients (87.3% of the baseline popu-lation) were included in the analysis of the construct ap-proach of responsiveness. Of these, 11 patients wereexcluded due to the missing-item criterion, resulting in106 patients (79.1% of the baseline population) includedin the analysis of the criterion approach of responsivenessand MIC estimation. Baseline sociodemographic and clin-ical characteristics of the included patients are presentedin Table 2. Ceiling and floor effects were not present inneither the QuickDASH nor PSFS.
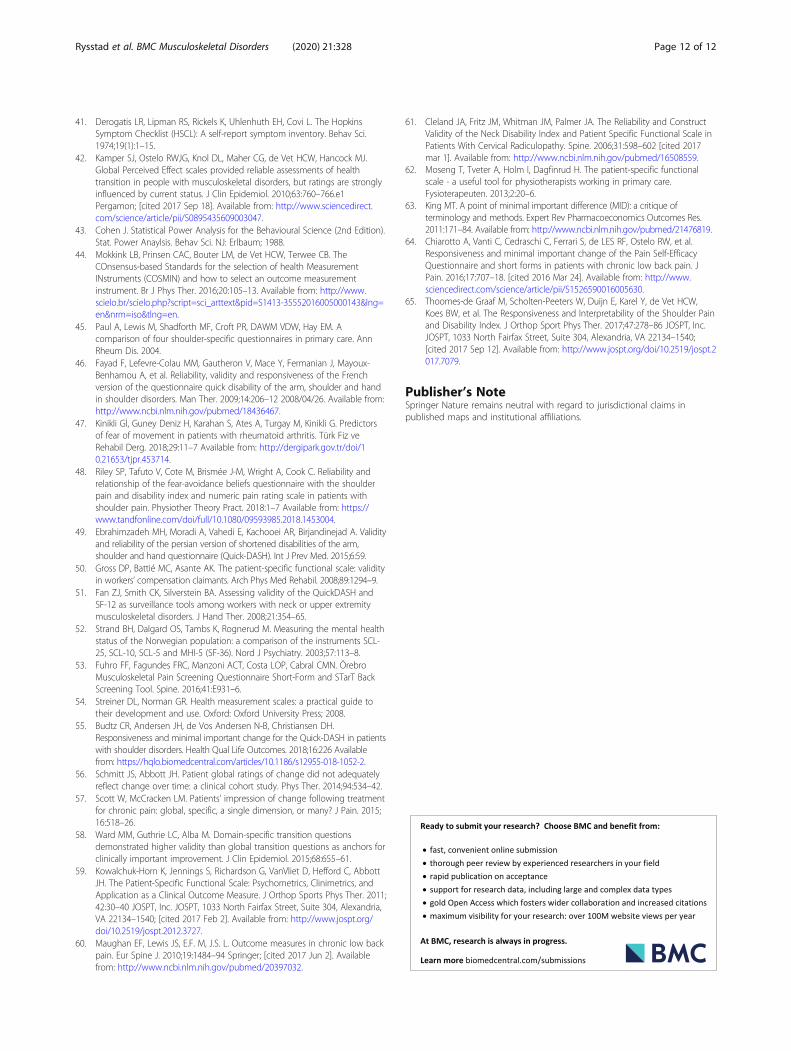
ResponsivenessThe box plots in Fig. 1 show the distribution of theQuickDASH and PSFS change scores for each categoryof the GROC at the 3-month follow-up. There is consid-erable overlap between the distribution of scores foreach category of the GROC for both questionnaires, ex-cept the ‘slightly worsened’-group (n = 3) of the PSFSchange scores.Table 3 presents scores, ESs and SRMs for Quick-
DASH and PSFS for the total sample, and subgroupsclassified according to each GROC category. In total,only 1 participant stated that he or she was much worse.None of the participants stated very much worse. Forboth the QuickDASH and PSFS, ESs and SRMs wereprogressively larger for each increment on the GROC,except for the 3 participants in the ‘slightly worsenedgroup’. ESs and SRMs were large (> 0.9) for participants
who were ‘very much improved’ or ‘much improved’ onthe GROC. For the participants who stated ‘slightly im-proved’ on the GROC, the ES and SRM were moderate(0.4 and 0.6) for the QuickDASH and moderate to large(0.9 and 0.7) for the PSFS.Criterion approach of responsiveness. Dichotomisation
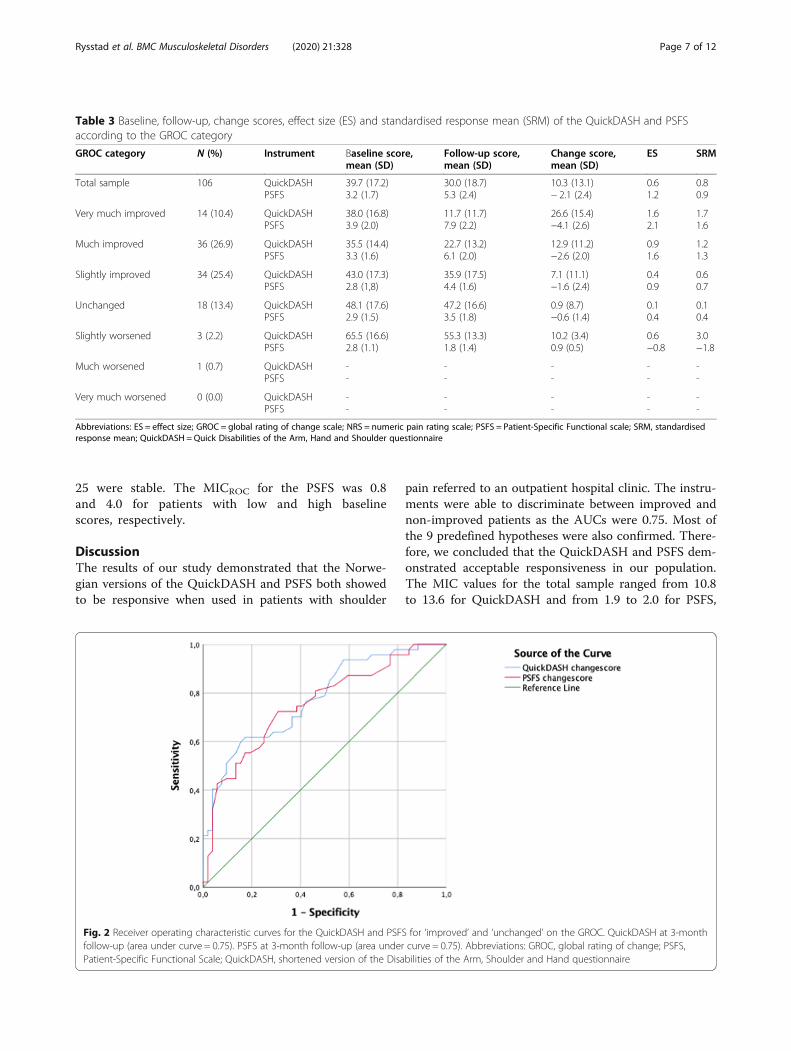
of the GROC showed that 50 patients (47.6%) improvedand 55 patients (52.4%) were stable; 1 patient (0.9%)were excluded in the ROC curves analysis, since he or shehad worsened clinical condition. The ROC curves (Fig. 2)were similar for both questionnaires, with an AUC for theQuickDASH of 0.75 (95% CI: 0.66, 0.84) and an AUC forthe PSFS of 0.75 (95% CI: 0.65, 0.85). The responsiveness
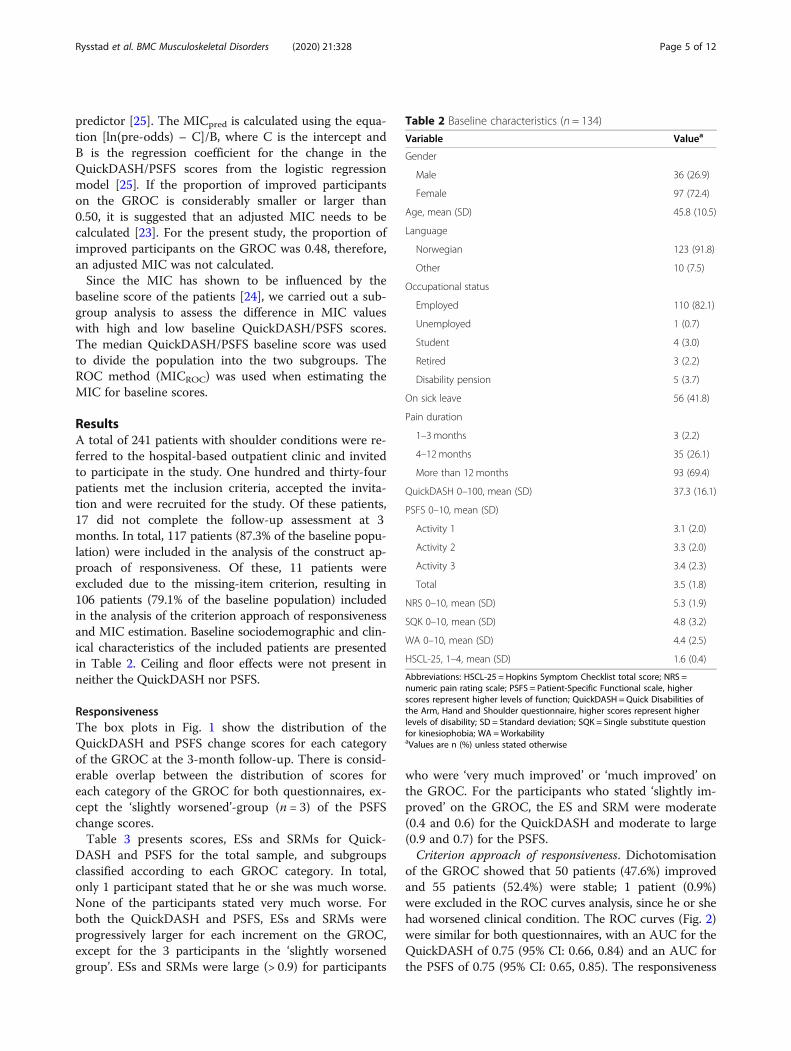
Table 2 Baseline characteristics (n = 134)
Variable Valuea
Gender
Male 36 (26.9)
Female 97 (72.4)
Age, mean (SD) 45.8 (10.5)
Language
Norwegian 123 (91.8)
Other 10 (7.5)
Occupational status
Employed 110 (82.1)
Unemployed 1 (0.7)
Student 4 (3.0)
Retired 3 (2.2)
Disability pension 5 (3.7)
On sick leave 56 (41.8)
Pain duration
1–3 months 3 (2.2)
4–12 months 35 (26.1)
More than 12 months 93 (69.4)
QuickDASH 0–100, mean (SD) 37.3 (16.1)
PSFS 0–10, mean (SD)
Activity 1 3.1 (2.0)
Activity 2 3.3 (2.0)
Activity 3 3.4 (2.3)
Total 3.5 (1.8)
NRS 0–10, mean (SD) 5.3 (1.9)
SQK 0–10, mean (SD) 4.8 (3.2)
WA 0–10, mean (SD) 4.4 (2.5)
HSCL-25, 1–4, mean (SD) 1.6 (0.4)
Abbreviations: HSCL-25 = Hopkins Symptom Checklist total score; NRS =numeric pain rating scale; PSFS = Patient-Specific Functional scale, higherscores represent higher levels of function; QuickDASH = Quick Disabilities ofthe Arm, Hand and Shoulder questionnaire, higher scores represent higherlevels of disability; SD = Standard deviation; SQK = Single substitute questionfor kinesiophobia; WA =WorkabilityaValues are n (%) unless stated otherwise
Rysstad et al. BMC Musculoskeletal Disorders (2020) 21:328 Page 5 of 12

for both questionnaires was therefore considered satisfac-tory based on the criterion approach.Construct approach of responsiveness. Responsiveness
according to testing 9 a-priori hypotheses (Table 1) weremet by both instruments; the QuickDASH met 7 hy-potheses (77.8%) and the PSFS met 8 hypotheses(88.9%). The correlations between the QuickDASH/PSFSand comparator instruments are presented in Table 4.
Minimal important changeThe MICROC for the QuickDASH was 13.6 with a sensi-tivity of 0.59 and specificity of 0.82, resulting in a changeof 36.4% of the baseline score. The MICpred for theQuickDASH was 10.8 (95% CI 4.84–17.10), resulting ina change of 29.0% of the baseline score. The MICROC forthe PSFS was 2.0, resulting in a change of 29.4% of the
baseline score. The sensitivity and specificity were 0.71and 0.67, respectively. The MICpred for the PSFS was 1.9(95% CI 0.71–3.09), resulting in a change of 28.2% of thebaseline score. The visual anchor-based MIC distribu-tion is illustrated in Fig. 3 for both instruments.When calculating the MICs adjusted for baseline
scores, the median QuickDASH score was 39. Of the 52patients with a low QuickDASH baseline score (< 39), 29were improved and 23 were stable. 54 patients had highQuickDASH baseline score (≥39), 21 were improved and32 were stable. The MICROC for the QuickDASH was3.4 and 14.3 for patients with low and high baselinescores, respectively. The median PSFS score was 3. Ofthe 45 patients with a low PSFS baseline score (< 3),17 were improved and 28 were stable. 56 patients hadhigh PSFS baseline score (≥3), 31 were improved and
Fig. 1 Box plots showing the distribution of the QuickDASH and PSFS change scores for the 7 GROC categories at 3-month follow-up. aQuickDASH change scores at follow-up, b PSFS change scores at follow-up. Abbreviations: GROC, global rating of change; MI, much improved;PSFS, Patient-Specific Functional Scale; QuickDASH, shortened version of the Disabilities of the Arm, Shoulder and Hand questionnaire; SI, slightlyimproved; SW, slightly worsened; U, Unchanged; VI, very improved; VMI, very much improved
Rysstad et al. BMC Musculoskeletal Disorders (2020) 21:328 Page 6 of 12
25 were stable. The MICROC for the PSFS was 0.8and 4.0 for patients with low and high baselinescores, respectively.
DiscussionThe results of our study demonstrated that the Norwe-gian versions of the QuickDASH and PSFS both showedto be responsive when used in patients with shoulder
pain referred to an outpatient hospital clinic. The instru-ments were able to discriminate between improved andnon-improved patients as the AUCs were 0.75. Most ofthe 9 predefined hypotheses were also confirmed. There-fore, we concluded that the QuickDASH and PSFS dem-onstrated acceptable responsiveness in our population.The MIC values for the total sample ranged from 10.8to 13.6 for QuickDASH and from 1.9 to 2.0 for PSFS,
Table 3 Baseline, follow-up, change scores, effect size (ES) and standardised response mean (SRM) of the QuickDASH and PSFSaccording to the GROC category
GROC category N (%) Instrument Baseline score,mean (SD)
Follow-up score,mean (SD)
Change score,mean (SD)
ES SRM
Total sample 106 QuickDASHPSFS
39.7 (17.2)3.2 (1.7)
30.0 (18.7)5.3 (2.4)
10.3 (13.1)− 2.1 (2.4)
0.61.2
0.80.9
Very much improved 14 (10.4) QuickDASHPSFS
38.0 (16.8)3.9 (2.0)
11.7 (11.7)7.9 (2.2)
26.6 (15.4)−4.1 (2.6)
1.62.1
1.71.6
Much improved 36 (26.9) QuickDASHPSFS
35.5 (14.4)3.3 (1.6)
22.7 (13.2)6.1 (2.0)
12.9 (11.2)−2.6 (2.0)
0.91.6
1.21.3
Slightly improved 34 (25.4) QuickDASHPSFS
43.0 (17.3)2.8 (1,8)
35.9 (17.5)4.4 (1.6)
7.1 (11.1)−1.6 (2.4)
0.40.9
0.60.7
Unchanged 18 (13.4) QuickDASHPSFS
48.1 (17.6)2.9 (1.5)
47.2 (16.6)3.5 (1.8)
0.9 (8.7)−0.6 (1.4)
0.10.4
0.10.4
Slightly worsened 3 (2.2) QuickDASHPSFS
65.5 (16.6)2.8 (1.1)
55.3 (13.3)1.8 (1.4)
10.2 (3.4)0.9 (0.5)
0.6−0.8
3.0−1.8
Much worsened 1 (0.7) QuickDASHPSFS
--
--
--
--
--
Very much worsened 0 (0.0) QuickDASHPSFS
--
--
--
--
--
Abbreviations: ES = effect size; GROC = global rating of change scale; NRS = numeric pain rating scale; PSFS = Patient-Specific Functional scale; SRM, standardisedresponse mean; QuickDASH = Quick Disabilities of the Arm, Hand and Shoulder questionnaire
Fig. 2 Receiver operating characteristic curves for the QuickDASH and PSFS for ‘improved’ and ‘unchanged’ on the GROC. QuickDASH at 3-monthfollow-up (area under curve = 0.75). PSFS at 3-month follow-up (area under curve = 0.75). Abbreviations: GROC, global rating of change; PSFS,Patient-Specific Functional Scale; QuickDASH, shortened version of the Disabilities of the Arm, Shoulder and Hand questionnaire
Rysstad et al. BMC Musculoskeletal Disorders (2020) 21:328 Page 7 of 12

depending on the method used. Moreover, this studyalso showed that the MIC values varied according to thebaseline scores, which is important to take into accountwhen interpreting MICs in individual patients. To ourknowledge, this is the first study to use two anchor-based methods, determined by ROC analysis and by pre-dictive modelling, to calculate the MICs for both PSFSand QuickDASH.The AUC values in our study for the QuickDASH and
PSFS were both 0.75 with overlapping confidence inter-vals, which indicates that these instruments are equallyresponsive. For the PSFS, the AUC in our study is some-what higher than what has been reported in two previ-ous studies on subjects with shoulder disordersundergoing physical therapy, which showed AUC valuesof 0.67 and 0.71 [5, 35]. For the QuickDASH, four previ-ous studies have reported AUC values, ranging from 0.78to 0.85, which is slightly higher than the result in ourstudy [11, 30, 35, 55]. The minor differences might be dueto differences in the shoulder samples and differentfollow-up periods (ranging from 4weeks to 6months). In
Table 4 Correlations among the PROMs’ change scores (n = 117)
QuickDASHa PSFSa
QuickDASH (0–100) – 0.45 (0.28, 0.59)
PSFS (0–10) 0.45 (0.28, 0.59) –
NRS (0–10) 0.62 (0.49, 0.72) 0.32 (0.14, 0.49)
SQK (0–10) 0.37 (0.20, 0.52) 0.38 (0.20, 0.53)
WA (0–10) 0.44 (0.27, 0.58) 0.46 (0.29, 0.60)
HSCL-25 (0–10) 0.37 (0.20, 0.52) 0.25 (0.06, 0.42)
GROC (1–7) −0.47 (− 0.61, − 0.31) −0.50 (− 0.64, − 0.34)
Abbreviations: GROC = global rating of change scale; HSCL-25 = HopkinsSymptom Checklist total score; NRS = numeric pain rating scale; PSFS = Patient-Specific Functional scale; SQK = Single substitute question for kinesiophobia;QuickDASH = Quick Disabilities of the Arm, Hand and Shoulderquestionnaire; WA =Workabilityn refers to the total sample sizes and may deviate in some of the correlationanalysis due to missing dataAll correlations were significant at P < 0.01aValues in parentheses are 95% confidence interval
Fig. 3 Visual anchor-based MIC distribution of 50 improved and 55 unchanged patients according to the anchor. a The vertical axis depicts theQuickDASH change score. The dotted line represents the MICpred value of 10.8. The light shaded patients are correctly classified, whereas the darkshaded patients are misclassified. 28.0 and 32.7% of the improved and unchanged patients were misclassified, respectively. b The vertical axisdepicts the PSFS change score. The dotted line represents the MICpred value of 1.9. The light shaded patients are correctly classified, whereas thedark shaded patients are misclassified. 38.0 and 29.1% of the improved and unchanged patients were misclassified, respectively. Abbreviations:PSFS, Patient-Specific Functional Scale; MICpred, Predictive modelling method of the minimal important change (MIC); QuickDASH, shortenedversion of the Disabilities of the Arm, Shoulder and Hand questionnaire.
Rysstad et al. BMC Musculoskeletal Disorders (2020) 21:328 Page 8 of 12

another study of responsiveness of the QuickDASH [31],only effect size and standardized response mean were re-ported, which the COSMIN group defines as inappropri-ate methods for evaluating responsiveness [31].A plausible explanation for the somewhat lower AUC
for the QuickDASH may be that the GROC was relatedto change on the most important PSFS item and not tothe overall change in shoulder complaints at follow-up.The use of a GROC as an external anchor has been criti-cised for its reliability and possible object to recall bias[19]. The GROC in this study was construct-specific:with a question formulated in such a way that it shouldcapture a change in activity limitation related to the mostimportant activity in the PSFS. It should therefore be re-lated to disability and the construct of both the Quick-DASH and PSFS. This is somewhat reflected in theobserved correlations between the anchor and the changescores of the QuickDASH and PSFS, which were moder-ate (0.47 and 0.50), as we expected (Hypothesis no. 1). Areason why the correlation between the PROMs and theGROC is not higher might be recall bias: patients have dif-ficulty recalling their change in function when the timeinterval is 3-months [56]. However, a construct-specificGROC used in this study has shown to be more validcompared to generic GROC [57, 58]. Regarding the ade-quateness of the GROC as an anchor, the observed corre-lations between the GROC and the QuickDASH and PSFSin this study are higher than the recommendation ofRevicki et al. (value > 0.30) [19] and proximate to the rec-ommendation of de Vet et al. (value > 0.50) [24]. Never-theless, we cannot be sure if the AUC would have beenhigher with the use of a different anchor.The MIC values for the QuickDASH in the present study
are comparable with previous studies in this population(range, 8.2–13.6) [30–32, 55], whereas the MICs for thePSFS were slightly larger in the present study compared toprevious findings in upper extremity patients (range, 1.1–1.3) [5, 36]. One explanation for this difference might be re-lated to whether they used an adequate anchor or not. Koe-horst et al. [5] reported a correlation between the GROCand the change scores of PSFS to 0.32, which might indi-cate that the anchor was not sufficient. Hefford et al. [36]did not report on the correlation, and therefore, it is diffi-cult to know if the GROC was an acceptable anchor. Im-portantly, when PSFS is used in a range of musculoskeletalconditions other than upper extremity disorders, the MIC(range, 1.3–3.0) is found to be comparable to our results[59–62].In the present study, we used two different anchor-
based methods for the MIC estimation (MICROC andMICpred). Since existing literature for the QuickDASHand PSFS mainly has reported MICROC, this method wasimplemented for comparison purposes. When evaluatingindividual patients’ improvement, we propose that the
MICpred values presented in this study are used because ofits greater precision compared to the MICROC [23]. How-ever, since MIC values are considered method- andcontext-specific, all available MIC estimates and rangesshould be considered when applied to a certain clinical orresearch context [19, 22, 63]. Additionally, although weused anchor-based methods as proposed by theCOSMIN-group, these approaches have been criticised forits risk of recall bias when estimating the MIC value [63].However, a recent study by Terluin et al. [23] highlightsthat when the improved and unchanged groups areequally sized the risk of bias will be far less than if thegroups were to be skewed. Since the proportion of im-proved were 0.5 in the present study, we therefore do notconsider recall bias a significant weakness in our study.To determine if a change score is clinically important,
the MIC values should be interpreted in relation to thesmallest detectable change (SDC) which is closely relatedto measurement error [20]. Ideally, the SDC should besmaller than the MIC to be 95% confident that thechange in an individual patient is statistically significantand is not due to measurement error. We found that theMICs for the QuickDASH (range, 10.8–13.6) did not ex-ceed the SDC of 16.5 reported by Budtz et al. [55] in acomparable sample in patients with shoulder pain.Therefore, the MICs for the QuickDASH in the presentstudy cannot be distinguished from measurement errorin individual patients. Regarding the PSFS, the SDC waspreviously estimated as 0.97 reported by Koehorst et al.[5] in shoulder patients with similar baseline characteris-tics as in the present study. Based on this SDC, there is95% certainty that a change of 1.9 was not due to meas-urement error in individual patients. However, boththese SDC values are from different populations andshould therefore be interpreted with caution since MICvalues vary across different contexts [19, 22].Consistent with previous literature on MIC estimation,
the MICs varied according to the baseline scores [19, 24,64, 65]. Our results showed that higher baseline scores re-sulted in higher MIC values. This means that patients withmoderate to severe disability need a larger improvementto define this change as important. Thus, we recommendthat different MIC values should be used for patients withlow or high baseline severity.
Strengths and limitationsThe main strength of this study is that we investigatedresponsiveness and MIC by using consensus-basedmethods according to the COSMIN recommendations.This current study contributes to the evidence regardingmeasurement properties of both the QuickDASH andPSFS among patients with shoulder pain. Anotherstrength is that we adjusted the MICs for baseline scoresand included a relatively new method for estimating the
Rysstad et al. BMC Musculoskeletal Disorders (2020) 21:328 Page 9 of 12

MIC, the predictive modelling of MIC, which has beenfound to be a more accurate calculation of the anchor-based MIC [23, 25]. Instead of reporting a single fixedvalue, these different MIC values can promote a moreaccurate interpretation of both the PROMs changescores.The main limitation of the present study is the rela-
tively small sample size in the subgroup analysis whenestimating the MIC according to baseline severity. More-over, although we found AUC values above the 0.70level of acceptable responsiveness, the lower borders ofthe confidence intervals were just below 0.70 for boththe QuickDASH (0.66) and PSFS (0.65). This should betaken into account when interpreting these estimates.Another limitation of this study is the lack of opportun-ity to estimate the SDCs of the PROMs, since only twotime-points were assessed. Also, the patients were pre-dominantly female, thus affecting the generalisability toother populations. Despite these limitations, our resultsgeneralise to patients with shoulder pain who are likelyto be encountered in a hospital-based outpatient clinic.However, further responsiveness studies in more generalcontexts are recommended.
ConclusionsBased on the COSMIN standards, the Norwegian ver-sions of the QuickDASH and PSFS are responsive andable to capture change in disability. Both instrumentsare similarly able to discriminate between patients thathave improved and patients that are unchanged. TheMIC values for both the questionnaires varied based onbaseline score and method used. We recommend takingthese MIC values into account when measuring im-provement or planning clinical studies on a similarsample.
AbbreviationsAUC: Area under the receiver operating characteristic curve; CI: Confidenceinterval; ES: Effect size; GROC: Global rating of change scale; HSCL-25: Hopkins Symptom Checklist; MIC: Minimal important change;MICROC: Receiver operating curve method of the minimal important change;MICpred: Predictive modelling method of the minimal important change;NRS: Numeric pain rating scale; PSFS: Patient-Specific Functional Scale;QuickDASH: Short form of the Disabilities of the Arm, Shoulder and Handquestionnaire; ROC: Receiver Operating Curve; SDC: Smallest detectablechange; SQK: Single substitute question for kinesiophobia; SRM: Standardisedresponse mean; WA: Workability
AcknowledgementsWe acknowledge the support and contribution from Marit Jæger, TorillBjugan Sandbakk, Audun Kopperstad, The Norwegian Fund for postgraduatetraining in physical therapy, and all the physiotherapists at theMultidisciplinary outpatient clinic, Department of physical medicine andrehabilitation, Ålesund hospital, Norway.We are grateful to the patients who participated in this study. We alsowould like to thank Dr. Berend Terluin for his advice and support with theestimation of the predictive modelling approach.
Authors’ contributionsTR carried out the design of the study, conducted data analysis, andprepared the manuscript. LPK gathered data. TR, MG, LPK and ATT revisedthe manuscript critically. ATT supervised the project. All authors read andapproved the final manuscript.
FundingGrant support was provided by The Norwegian Fund for postgraduatetraining in physical therapy.
Availability of data and materialsThe data that support the findings of this study are not publicly availabledue to personal data protection. An anonymous form of the data can bemade available on request from the corresponding author, TR.
Ethics approval and consent to participateThis study was approved by the Regional committees for medical and healthresearch ethics (REC South East) (2018/1191 C) and was carried out inaccordance with the Helsinki Declaration. Written informed consent wasobtained from all participants.
Consent for publicationNot applicable.
Competing interestsThe authors declare that they have no competing interests.
Author details1Faculty of Health Sciences, Department of Physiotherapy, Oslo MetropolitanUniversity, P.O. Box 4, St Olavs Plass, Oslo, Norway. 2Research andCommunication Unit, Oslo University Hospital, Oslo, Norway.3Multidisciplinary outpatient clinic, Department of physical medicine andrehabilitation, Ålesund hospital, Ålesund, Norway.
Received: 16 December 2019 Accepted: 14 April 2020
References1. Luime JJ, Koes BW, Hendriksen IJM, Burdorf A, Verhagen AP, Miedema HS,
et al. Prevalence and incidence of shoulder pain in the general population;a systematic review. Scand J Rheumatol. 2004;33:73–81.
2. Bartolozzi A, Andreychik D, Ahmad S. Determinants of outcome in thetreatment of rotator cuff disease. Clin Orthop Relat Res. 1994:90–7. Availablefrom: http://www.ncbi.nlm.nih.gov/pubmed/7955708.
3. Östör AJK, Richards CA, Prevost AT, Speed CA, Hazleman BL. Diagnosis andrelation to general health of shoulder disorders presenting to primary care.Rheumatology. 2005;44:800–5.
4. Roy JS, Macdermid JC, Woodhouse LJ. Measuring shoulder function: asystematic review of four questionnaires. Arthritis Rheum. 2009;61:623–322009/05/01.
5. Koehorst ML, van Trijffel E, Lindeboom R. Evaluative MeasurementProperties of the Patient-Specific Functional Scale for Primary ShoulderComplaints in Physical Therapy Practice. J Orthop Sport Phys Ther. 2014;44:595–603 [cited 2017 Jun 7]. Available from: http://www.jospt.org/doi/10.2519/jospt.2014.5133.
6. Smith-Forbes EV, Moore-Reed SD, Westgate PM, Ben KW, Uhl TL. Descriptiveanalysis of common functional limitations identified by patients withshoulder pain. J Sport Rehabil. 2015;24:179–88 [cited 2017 Feb 15]. Availablefrom: http://www.ncbi.nlm.nih.gov/pubmed/25611598.
7. Angst F, Goldhahn J, Drerup S, Flury M, Schwyzer H-K, Simmen BR. Howsharp is the short QuickDASH? A refined content and validity analysis of theshort form of the disabilities of the shoulder, arm and hand questionnairein the strata of symptoms and function and specific joint conditions. QualLife Res. 2009;18:1043–51 [cited 2014 Oct 29]. Available from: http://www.ncbi.nlm.nih.gov/pubmed/19707887.
8. Franchignoni F, Ferriero G, Giordano A, Sartorio F, Vercelli S, Brigatti E.Psychometric properties of QuickDASH - a classical test theory and Raschanalysis study. Man Ther. 2011;16:177–82.
9. Kennedy CA, Beaton DE, Smith P, Van Eerd D, Tang K, Inrig T, et al.Measurement properties of the QuickDASH (disabilities of the arm, shoulderand hand) outcome measure and cross-cultural adaptations of the
Rysstad et al. BMC Musculoskeletal Disorders (2020) 21:328 Page 10 of 12

QuickDASH: a systematic review. Qual Life Res. 2013;22:2509–47 Availablefrom: http://www.ncbi.nlm.nih.gov/pubmed/23479209.
10. Beaton DE, Wright JG, Katz JN. Development of the QuickDASH: comparisonof three item-reduction approaches. J Bone Joint Surg Am. 2005;87:1038–46.
11. Chester R, Jerosch-Herold C, Lewis J, Shepstone L. SPADI and QuickDASHare similarly responsive in patients undergoing physical therapy forshoulder pain. J Orthop Sport Phys Ther. 2017;47:1–37 Available from.https://doi.org/10.2519/jospt.2017.7195.
12. Jerosch-Herold C, Chester R, Shepstone L. Rasch model analysis gives newinsights into the structural validity of the quick-DASH in patients withmusculoskeletal shoulder pain. J Orthop Sport Phys Ther. 2017;47:1–20Available from. https://doi.org/10.2519/jospt.2017.7288.
13. Thoomes-de Graaf M, Scholten-Peeters GGM, Schellingerhout JM, BourneAM, Buchbinder R, Koehorst M, et al. Evaluation of measurement propertiesof self-administered PROMs aimed at patients with non-specific shoulderpain and “activity limitations”: a systematic review. Qual Life Res. 2016:2141–60. Available from: https://www.ncbi.nlm.nih.gov/pmc/articles/PMC4980404/pdf/11136_2016_Article_1277.pdf.
14. Bekkering GE, Hendriks HJM, Koes BW, Ostendorps RAB, Ostelo RWJG,Thomassen JMC, et al. Dutch physiotherapy guidelines for low back pain.Physiotherapy. 2003;89:82–96.
15. Childs JD, Cleland JA, Elliott JM, Teyhen DS, Wainner RS, Whitman JM, et al.Neck Pain: Clinical Practice Guidelines Linked to the InternationalClassification of Functioning, Disability, and Health From the OrthopaedicSection of the American Physical. J Orthop Sport Phys Ther. 2008;38(9):A1–A34.
16. Haldorsen B, Roe Y, Thornes E, Røijen KE, Juel NG. Subacromial painNorwegian clinical procedures - Physical therapy [Subakromiale smerterFagprosedyre - Fysioterapi]. Helsebiblioteket. 2016; [cited 2018 Dec 4].Available from: https://www.helsebiblioteket.no/fagprosedyrer/ferdige/fysioterapi-for-subakromiale-smerter.
17. Fairbairn K, May K, Yang Y, Balasundar S, Hefford C, Haxby Abbott J.Mapping Patient-Specific Functional Scale (PSFS) Items to the InternationalClassification of Functioning, Disability and Health (ICF). Phys Ther. 2012;92:7–310 [cited 2017 Feb 2]. Available from: https://academic.oup.com/ptj/article-lookup/doi/10.2522/ptj.20090382.
18. Mokkink LB, de Vet HCW, Prinsen CAC, Patrick DL, Alonso J, Bouter LM, et al.COSMIN Risk of Bias checklist for systematic reviews of Patient-ReportedOutcome Measures. Qual Life Res. 2018;27:1171–9 Available from: http://link.springer.com/10.1007/s11136-017-1765-4. Springer International Publishing.
19. Revicki D, Hays RD, Cella D, Sloan J. Recommended methods fordetermining responsiveness and minimally important differences forpatient-reported outcomes. J Clin Epidemiol. 2008;61:102–9 2008/01/08.
20. de Vet HCW, Knol DL, Terwee CB, Mokkink LB. Measurement in medicine.Pract. Guid. To biostat. Epidemiol. Cambridge: Cambridge University Press;2011.
21. Mokkink LB, Terwee CB, Patrick DL, Alonso J, Stratford PW, Knol DL, et al.The COSMIN study reached international consensus on taxonomy,terminology, and definitions of measurement properties for health-relatedpatient-reported outcomes. J Clin Epidemiol. 2010;63:737–45.
22. Terwee CB, Roorda LD, Dekker J, Bierma-Zeinstra SM, Peat G, Jordan KP, etal. Mind the MIC: large variation among populations and methods. J ClinEpidemiol. 2010;63:524–34.
23. Terluin B, Eekhout I, Terwee CB. The anchor-based minimal importantchange, based on receiver operating characteristic analysis or predictivemodeling, may need to be adjusted for the proportion of improvedpatients. J Clin Epidemiol. 2017;83:90–100 [cited 2017 Oct 2]. Available from:http://www.sciencedirect.com/science/article/pii/S0895435617300240.
24. De Vet HCW, Foumani M, Scholten MA, Jacobs WCH, Stiggelbout AM, KnolDL, et al. Minimally important change values of a measurement instrumentdepend more on baseline values than on the type of intervention. J ClinEpidemiol. 2015;68:518–24.
25. Terluin B, Eekhout I, Terwee CB, de HCW V. Minimal important change (MIC)based on a predictive modeling approach was more precise than MICbased on ROC analysis. J Clin Epidemiol. 2015;68:1388–96 [cited 2016 Apr 7].Available from: http://www.sciencedirect.com/science/article/pii/S0895435615001602.
26. Roe Y, Soberg HL, Bautz-Holter E, Ostensjo S. A systematic review ofmeasures of shoulder pain and functioning using the Internationalclassification of functioning, disability and health (ICF). BMC Musculoskelet
Disord. 2013;14:73 [cited 2015 Jan 30]. Available from: http://www.scopus.com/inward/record.url?eid=2-s2.0-84874366748&partnerID=tZOtx3y1.
27. Aasheim T, Finsen V. The DASH and the QuickDASH instruments. Normativevalues in the general population in Norway. J Hand Surg Eur. 2014;39:140–4Vol. 2013/03/23.
28. Angst F, Schwyzer H-K, Aeschlimann A, Simmen BR, Goldhahn J. Measuresof adult shoulder function: Disabilities of the Arm, Shoulder, and HandQuestionnaire (DASH) and its short version (QuickDASH), Shoulder Pain andDisability Index (SPADI), American Shoulder and Elbow Surgeons (ASES)Society standardized shoulder. Arthritis Care Res. 2011;63(Suppl 1):S174–88[cited 2015 Jan 12]. Available from: http://www.ncbi.nlm.nih.gov/pubmed/22588743.
29. Huang H, Grant JA, Miller BS, Mirza FM, Gagnier JJ. A Systematic Review ofthe Psychometric Properties of Patient-Reported Outcome Instruments forUse in Patients With Rotator Cuff Disease. Am J Sports Med. 2015;43:2572–82 [cited 2017 Oct 9]. Available from: http://www.ncbi.nlm.nih.gov/pubmed/25622986.
30. Mintken PE, Glynn P, Cleland JA. Psychometric properties of the shorteneddisabilities of the Arm, Shoulder, and Hand Questionnaire (QuickDASH) andNumeric Pain Rating Scale in patients with shoulder pain. J Shoulder ElbSurg. 2009;18:920–6 [cited 2016 Sep 21]. Available from: http://www.ncbi.nlm.nih.gov/pubmed/19297202.
31. Polson K, Reid D, McNair PJ, Larmer P, Reid Duncan D, McNair PJ, et al.Responsiveness, minimal importance difference and minimal detectablechange scores of the shortened disability arm shoulder hand (QuickDASH)questionnaire. Man Ther. 2010;15:404–7 2010/05/04. Available from: http://www.ncbi.nlm.nih.gov/pubmed/20434942.
32. van Kampen DA, WJJ W, van LWAH B, Castelein RM, VAB S, Terwee CB.Determination and comparison of the smallest detectable change (SDC)and the minimal important change (MIC) of four-shoulder patient-reportedoutcome measures (PROMs). J Orthop Surg Res. 2013;8:40 BioMed Central;[cited 2015 Feb 24]. Available from: http://www.josr-online.com/content/8/1/40.
33. Finsen V. Norwegian version of the DASH questionnaire for examination ofthe arm shoulders and hand. Tidsskr Nor Laegeforen. 2008;128:1070 2008/05/03. Available from: http://www.ncbi.nlm.nih.gov/pubmed/18451890.
34. Stratford P, Gill C, Westaway M, Binkley J. Assessing Disability and Changeon Individual Patients: A Report of a Patient Specific Measure. Physiother.1995;47:258–63 Canada [Internet]. University of Toronto Press [cited 2017Feb 17];. Available from: http://utpjournals.press/doi/10.3138/ptc.47.4.258.
35. de Puga VOO, Lopes AD, Shiwa SR, Alouche SR, LOP C. Clinimetric TestingSupports the Use of 5 Questionnaires Adapted Into Brazilian Portuguese forPatients With Shoulder Disorders. J Orthop Sport Phys Ther. 2013;43:404–13[cited 2017 Sep 6]. Available from: http://www.jospt.org/doi/10.2519/jospt.2013.4441.
36. Hefford C, Abbott JH, Arnold R, Baxter GD. The Patient-Specific FunctionalScale: Validity, Reliability, and Responsiveness in Patients With UpperExtremity Musculoskeletal Problems. J Orthop Sport Phys Ther. 2012;42:56–65 JOSPT, Inc. JOSPT, 1033 North Fairfax Street, Suite 304, Alexandria, VA22134-1540 [cited 2017 Feb 3]. Available from: http://www.jospt.org/doi/10.2519/jospt.2012.3953.
37. Abbott JH, Schmitt J. Minimum Important Differences for the Patient-Specific Functional Scale, 4 Region-Specific Outcome Measures, and theNumeric Pain Rating Scale. J Orthop Sport Phys Ther. 2014;44:560–4 JOSPT,Inc. JOSPT, 1033 North Fairfax Street, Suite 304, Alexandria, VA 22134–1540;[cited 2017 Jun 7]. Available from: http://www.jospt.org/doi/10.2519/jospt.2014.5248.
38. Ahlstrom L, Grimby-Ekman A, Hagberg M, Dellve L. The work ability indexand single-item question: associations with sick leave, symptoms, andhealth - a prospective study of women on long-term sick leave. Scand JWork Environ Health. 2010;36(5):404–12.
39. Verwoerd AJH, Luijsterburg PAJ, Timman R, Koes BW, Verhagen AP. A singlequestion was as predictive of outcome as the Tampa Scale forKinesiophobia in people with sciatica: An observational study. J Physiother.2012;58:249–54 [cited 2018 may 23]. Available from: http://www.ncbi.nlm.nih.gov/pubmed/23177227.
40. Verwoerd AJH, Luijsterburg PAJ, Koes BW, el Barzouhi A, Verhagen AP. DoesKinesiophobia Modify the Effects of Physical Therapy on Outcomes inPatients With Sciatica in Primary Care? Subgroup Analysis From aRandomized Controlled Trial. Phys Ther. 2015;95:1217–23 Available from:https://academic.oup.com/ptj/article-lookup/doi/10.2522/ptj.20140458.
Rysstad et al. BMC Musculoskeletal Disorders (2020) 21:328 Page 11 of 12
41. Derogatis LR, Lipman RS, Rickels K, Uhlenhuth EH, Covi L. The HopkinsSymptom Checklist (HSCL): A self-report symptom inventory. Behav Sci.1974;19(1):1–15.
42. Kamper SJ, Ostelo RWJG, Knol DL, Maher CG, de Vet HCW, Hancock MJ.Global Perceived Effect scales provided reliable assessments of healthtransition in people with musculoskeletal disorders, but ratings are stronglyinfluenced by current status. J Clin Epidemiol. 2010;63:760–766.e1Pergamon; [cited 2017 Sep 18]. Available from: http://www.sciencedirect.com/science/article/pii/S0895435609003047.
43. Cohen J. Statistical Power Analysis for the Behavioural Science (2nd Edition).Stat. Power Anaylsis. Behav Sci. NJ: Erlbaum; 1988.
44. Mokkink LB, Prinsen CAC, Bouter LM, de Vet HCW, Terwee CB. TheCOnsensus-based Standards for the selection of health MeasurementINstruments (COSMIN) and how to select an outcome measurementinstrument. Br J Phys Ther. 2016;20:105–13. Available from: http://www.scielo.br/scielo.php?script=sci_arttext&pid=S1413-35552016005000143&lng=en&nrm=iso&tlng=en.
45. Paul A, Lewis M, Shadforth MF, Croft PR, DAWM VDW, Hay EM. Acomparison of four shoulder-specific questionnaires in primary care. AnnRheum Dis. 2004.
46. Fayad F, Lefevre-Colau MM, Gautheron V, Mace Y, Fermanian J, Mayoux-Benhamou A, et al. Reliability, validity and responsiveness of the Frenchversion of the questionnaire quick disability of the arm, shoulder and handin shoulder disorders. Man Ther. 2009;14:206–12 2008/04/26. Available from:http://www.ncbi.nlm.nih.gov/pubmed/18436467.
47. Kinikli Gİ, Guney Deniz H, Karahan S, Ates A, Turgay M, Kinikli G. Predictorsof fear of movement in patients with rheumatoid arthritis. Türk Fiz veRehabil Derg. 2018;29:11–7 Available from: http://dergipark.gov.tr/doi/10.21653/tjpr.453714.
48. Riley SP, Tafuto V, Cote M, Brismée J-M, Wright A, Cook C. Reliability andrelationship of the fear-avoidance beliefs questionnaire with the shoulderpain and disability index and numeric pain rating scale in patients withshoulder pain. Physiother Theory Pract. 2018:1–7 Available from: https://www.tandfonline.com/doi/full/10.1080/09593985.2018.1453004.
49. Ebrahimzadeh MH, Moradi A, Vahedi E, Kachooei AR, Birjandinejad A. Validityand reliability of the persian version of shortened disabilities of the arm,shoulder and hand questionnaire (Quick-DASH). Int J Prev Med. 2015;6:59.
50. Gross DP, Battié MC, Asante AK. The patient-specific functional scale: validityin workers’ compensation claimants. Arch Phys Med Rehabil. 2008;89:1294–9.
51. Fan ZJ, Smith CK, Silverstein BA. Assessing validity of the QuickDASH andSF-12 as surveillance tools among workers with neck or upper extremitymusculoskeletal disorders. J Hand Ther. 2008;21:354–65.
52. Strand BH, Dalgard OS, Tambs K, Rognerud M. Measuring the mental healthstatus of the Norwegian population: a comparison of the instruments SCL-25, SCL-10, SCL-5 and MHI-5 (SF-36). Nord J Psychiatry. 2003;57:113–8.
53. Fuhro FF, Fagundes FRC, Manzoni ACT, Costa LOP, Cabral CMN. ÖrebroMusculoskeletal Pain Screening Questionnaire Short-Form and STarT BackScreening Tool. Spine. 2016;41:E931–6.
54. Streiner DL, Norman GR. Health measurement scales: a practical guide totheir development and use. Oxford: Oxford University Press; 2008.
55. Budtz CR, Andersen JH, de Vos Andersen N-B, Christiansen DH.Responsiveness and minimal important change for the Quick-DASH in patientswith shoulder disorders. Health Qual Life Outcomes. 2018;16:226 Availablefrom: https://hqlo.biomedcentral.com/articles/10.1186/s12955-018-1052-2.
56. Schmitt JS, Abbott JH. Patient global ratings of change did not adequatelyreflect change over time: a clinical cohort study. Phys Ther. 2014;94:534–42.
57. Scott W, McCracken LM. Patients’ impression of change following treatmentfor chronic pain: global, specific, a single dimension, or many? J Pain. 2015;16:518–26.
58. Ward MM, Guthrie LC, Alba M. Domain-specific transition questionsdemonstrated higher validity than global transition questions as anchors forclinically important improvement. J Clin Epidemiol. 2015;68:655–61.
59. Kowalchuk-Horn K, Jennings S, Richardson G, VanVliet D, Hefford C, AbbottJH. The Patient-Specific Functional Scale: Psychometrics, Clinimetrics, andApplication as a Clinical Outcome Measure. J Orthop Sports Phys Ther. 2011;42:30–40 JOSPT, Inc. JOSPT, 1033 North Fairfax Street, Suite 304, Alexandria,VA 22134–1540; [cited 2017 Feb 2]. Available from: http://www.jospt.org/doi/10.2519/jospt.2012.3727.
60. Maughan EF, Lewis JS, E.F. M, J.S. L. Outcome measures in chronic low backpain. Eur Spine J. 2010;19:1484–94 Springer; [cited 2017 Jun 2]. Availablefrom: http://www.ncbi.nlm.nih.gov/pubmed/20397032.
61. Cleland JA, Fritz JM, Whitman JM, Palmer JA. The Reliability and ConstructValidity of the Neck Disability Index and Patient Specific Functional Scale inPatients With Cervical Radiculopathy. Spine. 2006;31:598–602 [cited 2017mar 1]. Available from: http://www.ncbi.nlm.nih.gov/pubmed/16508559.
62. Moseng T, Tveter A, Holm I, Dagfinrud H. The patient-specific functionalscale - a useful tool for physiotherapists working in primary care.Fysioterapeuten. 2013;2:20–6.
63. King MT. A point of minimal important difference (MID): a critique ofterminology and methods. Expert Rev Pharmacoeconomics Outcomes Res.2011:171–84. Available from: http://www.ncbi.nlm.nih.gov/pubmed/21476819.
64. Chiarotto A, Vanti C, Cedraschi C, Ferrari S, de LES RF, Ostelo RW, et al.Responsiveness and minimal important change of the Pain Self-EfficacyQuestionnaire and short forms in patients with chronic low back pain. JPain. 2016;17:707–18. [cited 2016 Mar 24]. Available from: http://www.sciencedirect.com/science/article/pii/S1526590016005630.
65. Thoomes-de Graaf M, Scholten-Peeters W, Duijn E, Karel Y, de Vet HCW,Koes BW, et al. The Responsiveness and Interpretability of the Shoulder Painand Disability Index. J Orthop Sport Phys Ther. 2017;47:278–86 JOSPT, Inc.JOSPT, 1033 North Fairfax Street, Suite 304, Alexandria, VA 22134–1540;[cited 2017 Sep 12]. Available from: http://www.jospt.org/doi/10.2519/jospt.2017.7079.
Publisher’s NoteSpringer Nature remains neutral with regard to jurisdictional claims inpublished maps and institutional affiliations.
Rysstad et al. BMC Musculoskeletal Disorders (2020) 21:328 Page 12 of 12