· restricted report no. eap-21 this report was prepared for use within the bank and its...
TRANSCRIPT

RESTRICTED
Report No. EAP-21
This report was prepared for use within the Bank and its affiliated organizations.They do not accept responsibility for its accuracy or completeness. The report maynot be published nor may it be quoted as representing their views.
INTERNATIONAL BANK FOR RECONSTRUCTION AND DEVELOPMENT
INTERNATIONAL DEVELOPMENT ASSOCIATION
PHILIPPINES:
PROSPECTS AND PROBLEMS OF THE ECONOMY
March 31, 1971
East Asia and Pacific Department
Pub
lic D
iscl
osur
e A
utho
rized
Pub
lic D
iscl
osur
e A
utho
rized
Pub
lic D
iscl
osur
e A
utho
rized
Pub
lic D
iscl
osur
e A
utho
rized

CURRENCY EQUIVAIENI'S
Before Feb. 21, 1970
US$ 1.00 Pesos 3.90Pesos 1,000 US$ 256.LoPesos 1 million US$ 256,0O
After Feb. 21, 1970
US$ 1.00 Pesos 6 .435 (interbank)guiding rate sinceSept. 1970)
Pesos 1,000 US$ 155.40Pesos 1 million US$ 155,400.
FISCAL YEAR
In the Philippines the Fiscal Year covers the periodJuly 1 to June 30.

This report is based on the findings of
an Econamic Mission which visited the
Philippines from February 15 to March 5,1971. Its members were:
Parvez Hasan Chief of MissionM.ss H.J. Goris General EconomistGeorge C, Maniatis General EconomistHake M. Kamrany General Economist

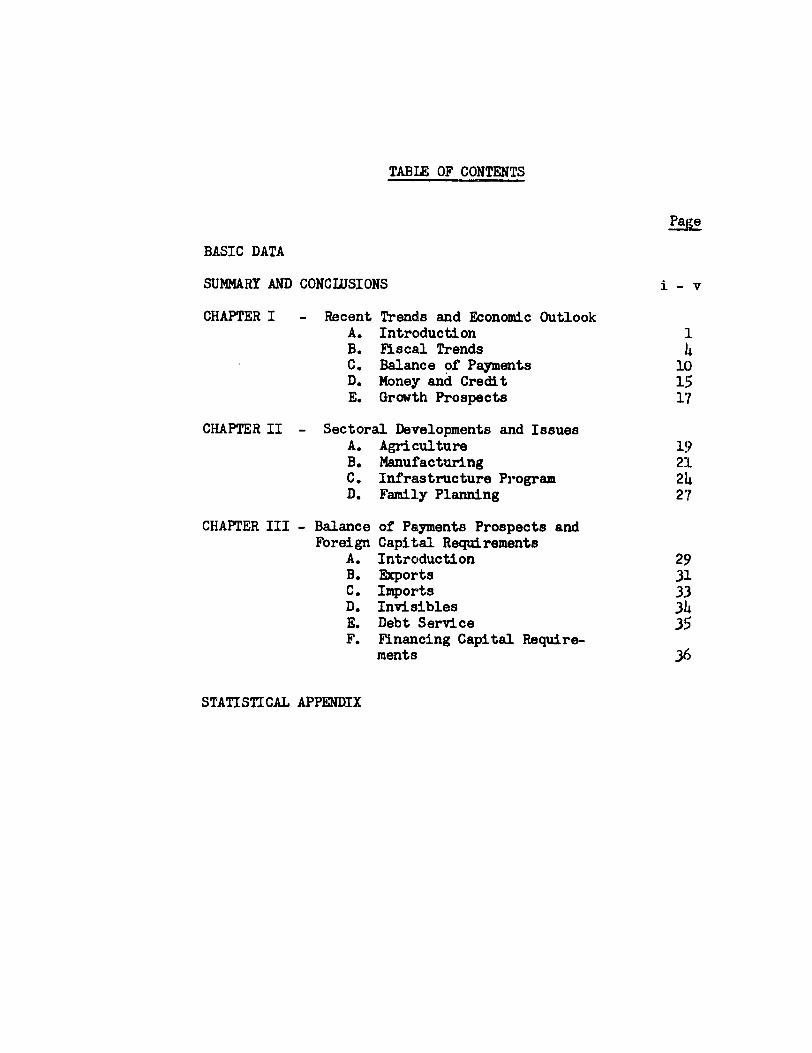
TABLE OF CONTENTS
Page
BASIC DATA
SUMMARY AND CONCIUSIONS i- v
CHAPTER I - Recent Trends and Economic OutlookA. Introduction 1B. Fiscal Trends ItC. Balance of Payments 10D. Money and Credit 15E. Growth Prospects 17
CHAPTER II - Sectoral Developments and IssuesA. Agriculture 19B. Manufacturing 21C. Infrastructure Program 24D. Family Planning 27
CHAPTER III - Balance of Payments Prospects andForeign Capital Requirements
A. Introduction 29B. Exports 31C. Imports 33D. Invisibles 34E. Debt Service 35F. Financing Capital Require-
ments 36
STATISTICAL APPENDIX

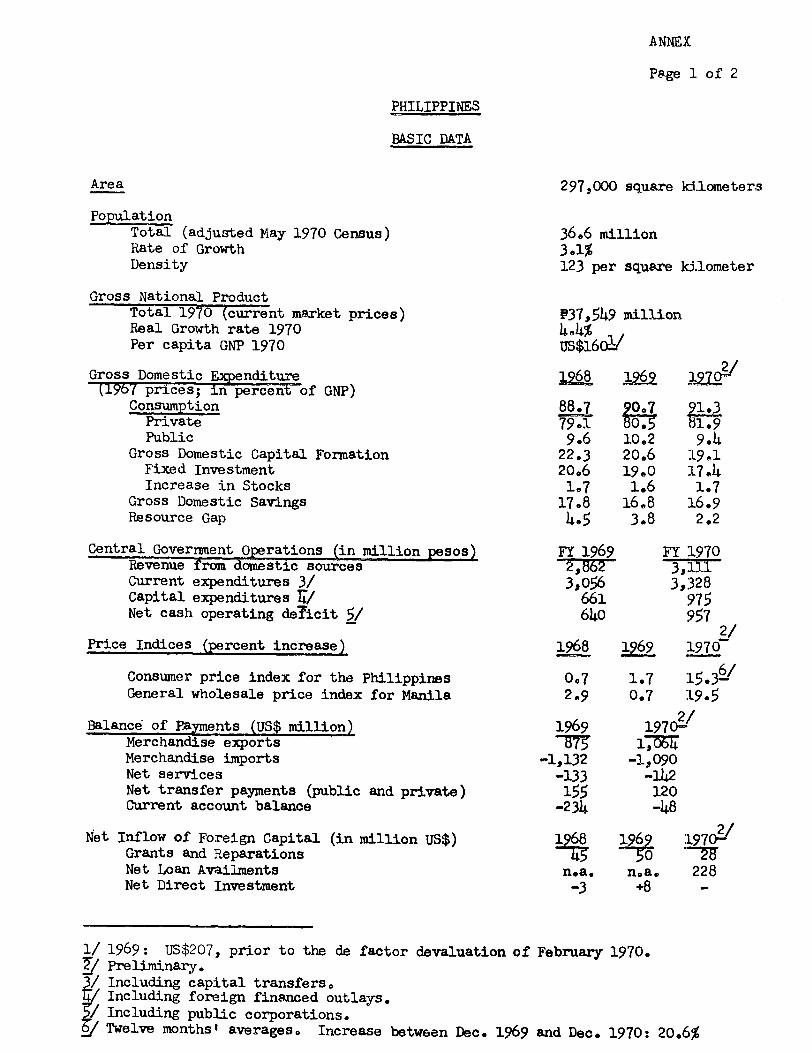
ANNEX
Page 1 of 2
PHILIPPINES
BASIC DATA
Area 297,000 square ki.lometers
PopulationTotal (adjusted May 1970 Census) 36.6 millionRate of Growth 3.1%Density 123 per square kilometer
Gross National ProductTotal 1970 (current market prices) P37,549 millionReal Growth rate 1970 4.4%Per capita GNP 1970 US$1601 /
Gross Domestic Expenditure 1268 1 6O 120(196 prices; in percent of GNP)
Consumption 807 1.3Private 79.1 0. 81.9Public 9.6 10.2 9.4
Gross Domestic Capital Formation 22.3 20,6 19.1Fixed Investment 20.6 19.0 17.4Increase in Stocks 1.7 1.6 1.7
Gross Domestic Savings 17.8 16.8 16.9Resource Gap 4.5 3.8 2.2
Central Goverment Operations (in million pesos) FY 1969 FY 1970Revenue from domestic sources 62 3,111Current expenditures 3/ 3,056 3,328Capital expenditures IT/ 661 975Net cash operating deficit 5/ 640 957
2/Price Indices (percent increase) 1968 1?69 197C7
Consumer price index for the Philippines 0.7 1.7 15.36/General wholesale price index for Manila 2.9 0.7 19.5
2/Balance of Payments (US$ million) 1969 19704
Merchandise exports 6F 1,6WMerchandise imports -1sl32 -1,090Net services -133 -142Net transfer payments (public and private) 155 120Current account balance -234 -48
2/Net Inflow of Foreign Capital (in million US$) 1968 196 19702Grants and Reparations M50 -WNet Loan Availments n.a. n.a. 228Net Direct Investment -3 +8 -
1/ 1969: US$207, prior to the de factor devaluation of February 1970.Preliminary.Including capital transfers,Including foreign financed outlays.Including public corporations.Twelve months' averages. Increase between Dec. 1969 and Dec. 1970: 20.6%

ANNEX
Page 2 of 2
Major Exports (percent) 1969 1970Coconut products 1-9Sugar products 18 18Forest products 33 25Mineral products 19 20Others 11 15
Foreign Exchange Reserves (US$ million) Dec. 1969 June 1970 Dec. 1970Internation Reserves 1/ 126 211 237
External Public and Private Debt (US* million) Dec. 196 Dec. 1270Short term 196 63Medium term 423 417Long term 724 1,093
Total (excluding MF and revolving 1,3W4 1,573trade credits)
Debt Service CY 1970 CY 19712/Amortiation 373 362Interest 95 141Total 1023
Debt service ratio 3/(Total debt, publTc and private) 33% 33%
Bank operations(Dec. 31, 190)Bank loans outstanding US$ 119 millionUndisbursed amount US$ 73 million
IMF PositionQuota uS$ 155 millionDrawing outstanding (Dec. 31, 1970) k/ US$ 107.50 millionPar Value - up to Feb. 21, 1970 P3.90 per US$Floating since Feb. 21, 1970
Net reserves of commercial banks plus gross reserves of Central Bank./ Projection.
3 Basis: exports of goods and services, plus public and private tranAfers.Additional Standby of $45 million was approved in Xarch 19716
March 31, 1971
SUMMARY AND CONCLUSIONS
i. The Philippine economy found itself confronted with a seriousfinancial problem at the end of 1969, arising out of excessive governmentspending, increasing balance of payments deficits and a rising burden ofshort-term foreign debt. The stabilization program adopted in February1970, consisting of a number of measures aimed at reducing excess liquidityin the economy, limiting the:growth of short-term external debt, the estab-lishment of a floating exchange rate and liberalization of most importrestrictions has contributed significantly to restoring a balance in fiscal,monetary and foreign exchange position, The adjustment process has, however,involved a steep rise in the price level and a cutback in investment, and ithas not been possible for the Philippine authorities to reduce the short-term debt service burden.
ii. The balance of payments position improved notably during 1970 asthe current account deficit was reduced drastically from $234 million in1969 to $48 million. This improvement has come about mainly by an increaseof $188 million or 22 percent in export earnings. The Government budgetdeficit has also been reduced drastically and on the revenue account asurplus of 0457 million is expected during FY 1970-71. The improvement inthe Government's fiscal position has been brought about entirely by a growthin tax revenues of 26 percent, which is attributable in part to new taxmeasures, especially the introduction of an export tax. Reflecting the nearelimination of credit creation in the public sector, the rate of monetaryexpansion slowed down very significantly during 1970; even though credit tothe private sector rose ty 16 percent and foreign assets exerted an expan-sionary influence, the rate of growth of money supply during 1970 was6.2 percent compared with 19.4 percent in 1969.
iii. The exchange rate adjustment early in 1970, the reduction of thebudget deficit, and the slowing down of monetary expansion had, however,inevitable effects on the level of investment and growth. Provisional esti-mates indicate that gross national product in real terms increased by 4.4percent in 1970 compared with 6.2 percent in 1969. The slowdown was primarilydue to a low rate of growth in agriculture and manufacturing, and to a lackof buoyancy in construction and investment. The general price level, whichhad remained remarkably stable for several years, showed an increase during1970 estimated at not less than 20 percent, reflecting the impact of a 50 per-cent rise in the cost of imports. Gross fixed domestic capital formationshowed a drop of 4 percent between 1969 and 1970 and the ratio of fixedinvestment to GNP dropped from 19 percent to 17.4 percent, and comparedunfavorably with the peak of 21.3 percent in 1967. Apparently, the drop inpublic investment during 1970 was much steeper and thus for the first timesince 1966 the trend towards an increasing share of public investment in totalinvestment was reversed. The setback to public investment, though under-standable in the light of.the need to balance stabilization needs with growthrequirements, does point to the continuing and difficult problem of mobilizingsufficient resources for the public sector development program. Private say-ings patterns are, however, satisfactory. Becau&eof tis and with some rise

- ii -
in public savings, the overall savings rate of the Philippine economy
actually improved during 1970 and at around 17 percent of GNP does not
compare unfavorably with most developing countries.
iv. Another important but less favorable feature of developments during1970 was a further increase in the foreign debt of the Philippines. Thetotal foreign debt outstanding (excluding drawings on the IMF and.short-termliabilities other than those of the Central Bank) increased by $228 millionbetween the endlof 1969 and the end of 1970. Despite a substantial increasein total debt, the short-term debt with a maturity of up to one year droppedsharply from $196.4 million from the end of 1969 to $62.8 million at the endof 1970, largely owing to the refunding of over $220 million oif Central Bankobligations by longer-term loans. Nevertheless, the structure of Philippinedebt continues to be a matter of serious concern. While the total volume ofexternal debt is not much higher than one year's gross foreign exchangeearnings, 23 percent of the debt is payable in 1971 and nearly two-thirds must,be paid within the next four years. The amortization payments of $362 millionalong with the estimated interest payments of $141 million will mean a totaldebt service of $503 million during 1971, which is larger than the debtservice of $468 million in 1970. The ratio of debt service to total foreignexchange earnings during 1971 will remain unchanged at almost 33 percent, the1970 level.
v. That the Philippines has a much more complex debt problem than wasoriginally believed is brought out by the balance of payments projections inthe report. Even disregarding principal payments on new debt which will beincurred during.the period 1971-74, the debt service during 1971-74 willaverage $410imillion annually. If it is assumed that new debt would have anaverage maturity of eight years, the debt service burden would rise from$503 million in 1971 to $564 million in 1974.and the ratio of debt serviceto gross foreign exchange earnings would drop only marginally from 33 percentto 30,percent over the period.
vi., Considering that the Philippines: is a developing country with arelatively low per capita income of $160, a reliance on net capital inflowsfrom abroad should be regarded as a normal feature of its economic develop-mentin the foreseeable future. It would be unrealistic and undesirable toexpect, therefore, a reduction in the debt service burden of the Philippinesto.come through.?a net repayment of debt from Philippine resources, that isthrough a surplus on goods and non-factor services account. As it is, thebalance of payments projections contained in the report provide for a netinflow of resources of only $50 million per year during 1971-74 or less than.one percent of GNP. This implies that investment levels will be determinedalmost entirely by the domestic savings effort. Even with the substantialdomestic saving ,effort, the ratio of fixed investment to GNP would riseslowly from the relatively low level of 17.5 percent touched in 1970. Afurther reduction in the level of net inflow cannot be undertaken withoutfurther reducing the level of investment and economic activity which wouldin turn seriously jeopardize the prospects of long-term growth of output and

- iii -
exports. Indeed, the main consideration in not suggesting a larger netinflow of capital into the Philippines has been the likely difficulty ofsecuring capital on terms which would not add materially to the already heavyburden of debt service.
vii. The improvement in the structure of the Philippine debt over aperiod of time must come, therefore, entirely from a substitution of out-standing debt by longer term capital on more favorable terms and with longergrace periods. Part of the difficulty in bringing about an improvement inthe debt structure of the Philippines arises from a heavy dependence onprivate trade credits. Over the next four years, however, the requirementsof foreign exchange loans for the public infrastructure program are projectedto increase markedly. But an increase in the absorptive capacity of thepublic sector and a sustained increase in the availability of local currencyfunds for development are necessary preconditions of a sharp rise in officialassistance, which hopefully can come on easier terms. In the near future,the Philippines will have to exercise extreme care in negotiating its new debtwith a view to minimizing the service of this additional debt in the next fewyears.
viii. The vital need in the Philippine context of raising the level oftax revenues has been discussed frequently in previous Bank reports. The total.revenues of national and local governments are currently around 14 percent ofGNP and are lower than in most developing countries. Notwithstanding the gainof 26 percent in tax revenues during 1970/71, the issue of mobilizing largertax revenues remains as alive as ever. Firstly, despite the jump in taxreceipts during the current year, the public investment effort was clearlyinadequate. Moreover, the export tax imposed last year to mop up part of thewindfall gains accruing to exporters from the devaluation was approved byCongress for four years only and at gradually decreasing rates. Thus theapparently large gain in revenue of 4WAO million from these sources is not
.permanent and would disappear entirely by FY 1975. Furthermore, and this hasparticularly great relevance for the longer run, the tax system appears to berather inelastic so that production and income increases do not often resultin proportionate increases in tax revenues. A comprehensive analysis of thecauses of the lag in revenues in recent years would help to pinpoint theweaknesses of the present system. A review of the various exemptions underincome tax and other legislation appears highly desirable.
ix. The mission was impressed with the determination of the Executiveto close tax loopholes and to improve collections generally. There remains,however, an immediate and pressing need for additicnal taxation during FY 1972.About )0100 million additional taxation would be necessary merely-to offsetthe automatic reduction in export duties under the Stabilization Tax Law,which will go into effect from July 1, 1971. The tax proposals totallingp269 million to Congress include amendment of the Stabilization Tax Law, aswell as taxes on luxury consumption, inheritance tax, tax on idle lands,revision or repeal of certain tax exemption laws, and imposition of fees andtaxes on certain forms of gambling after legalizing the activity. The tax

proposals are generally well conceived but their passage by Congresscertainly poses a problem in an election year. Nevertheless, there is areal urgency about mobilizing additional tax revenue because currently(FY 1971) public investment is lower in real terms than three years ago.
x. From the viewpoint of both equity and revenue, the maintenance ofexport taxes on most products at least at the 1970-71 level (a range of 8-10percent) deserves high priority. Considering the large windfall"gainsbecoming available to agricultural exporters through the floating exchangerate, the initial export levies did not impose a heavy burden. For most ofthe export products which were moving through official channels, the exportduties were aimed at best at mopping up about one-third of the increase inexport incomes. In fact, the depreciation of the peso through the floatingexchange rate went further than was originally envisaged and thus even asmaller portion of the total increase in export income has been capturedthrough export taxes.
xi. Despite the likely constraints arising from the insufficientavailability of foreign assistance on more liberal- terms and the inadequatemobilization of tax revenues, the growth prospects of the Philippines in theimmediate future appear good. Fortunately, the impact of a slow rise ininvestment on growth in the next few years would be cushioned by a set offavorable factors and thus it might be possible to keep the overall growthrate above 5 percent per annum during 1970-74 as against the Plan target of5.6 percent. Firstly, output will continue to benefit from the relativelyhigh rate of investment during FY 1965-69. Secondly, and closely related topast investment in key sectors such as mining, the outlook for exportsremains good. The export sector, which currently accounts for nearly 18 per-cent of GNP should grow by about 8 percent per annum after allowing for somereduction in export prices. Thirdly, the possibilities of spreading techno-logical change in agriculture are by no means exhausted. Despite the damagefrom typhoons during 1970, the current signs augur well for continued vigorousgrowth in agriculture provided a realistic policy framework is established,the right financial support and priorities are chosen and political goodwillis forthcoming from Congress. Finally, even though industrial growth continuesto suffer from excess capacity and overcrowding in many industries, theexchange rate adjustment has created a favorable climate for rationalizationefforts by opening up possibilities of exports. Meanwhile, because of thefinancial squeeze on industries, the leverage of the Development Bank of thePhilippines over the private sector has increased. The Board of-Investments,which controls and supervises all new investments, is cognizant of the short-comings of past policies and appears determined to reorient industrialpolicies, especially towards export promotion, and to this end a basic reformof the existing tariff system is planned.
xii. In sharp contrast to the slow average growth of less than 5 percentin merchandise exports during 1959-69, the export prospects for the nextseveral years appear good. The mission estimates indicate an annual growthrate of 10 percent between 1969 and 1974. The satisfactory export performance

- v -
during 1970 was attributable partly to a reduction in unrecorded exports andpartly to an improvement in export prices. However, the entire increase inearnings during the next four years is expected to come from an increase inthe volume of exports. Between 1969 and 1974, the volume of copper exportsis expected to nearly double, while sugar exports should increase by 45 per-cent, log exports by 28 percent, and nickel would be added to the export listin 1973. While prices of most export commodities are projected during 1971-74to remain at about the 1969 level, copper prices are assumed, on average, tobe 25 percent lower. But notwithstanding the downward revision of copperprice forecasts compared to last year, the latest export estimates are some-what higher than the last mission's projections and are more optimistic onthe whole than the Plan forecasts.
xiii. The mission projections assume a much higher growth rate for non-traditional exports, which comprise mainly minor agricultural products andmanufactured goods. These exports are expected to double between 1970 and1974. Their relative share in total exports would improve from 15 percent in1970 to 21 percent in 1974, reflecting mainly reduced dependence on coconutproducts and sugar.
xiv. The decline in imports during 1970 of 4 percent, even though fixedinvestment dropped, suggests that the expectation in the Plan (1971-74) tokeep import growth at 5 percent per annum is unrealistic. Indeed, aftermaking allowance for some increase in import prices, the last economicmission's projection of 8 percent growth in imports during 1970-74 alsoappears to be on the low side. Before allowing for price increases, the over-all increase in imports provided between 1970 and 1974 is about 30 percent,indicating a growth rate of 6.8 percent per annum, compared with probableGNP growth of 5.0-5.5 percent per annum for this period. These importprojections are in a sense a minimum because they will permit only an 11 per-cent growth of investment goods imports between 1969 and 1974.
xv. Even on the basis of this rather modest increase in imports and asubstantial growth in export earnings, the capital inflow requirements for1971-74 are now placed at $1,841 million or $460 million a year and aresubstantially higher than the earlier estimate of about $350 million a year.These gross inflow requirements, however, are understated to the extentthat allowance has not been made for amortization during 1971-74 of debtincurred after December 31, 1970. A rough estimate indicates that, assumingthat the average maturity of the new debt is eight years, the gross capitalrequirements would increase further by about $400 million. Most of theincrease will fall in 1973/74 and on adjusted basis, the gross capitalrequirement for 1974 would thus be substantially larger than at present.This again points attention to the fact that unless her debt burden can bealleviated by more liberal long-term assistance, the Philippines will befaced with an immense foreign exchange management problem.


CHAPTER I
Recent Trends and Economic Outlook
A'. Introduction
1. The economic performance of the Philippines during 1966-69 was inmany ways very satisfactory. The real growth rate of the economy duringthis period averaged 6.2 percent per annum, compared with less than 5 per-cent per annum during 1963-66 and the over-all price increase was limitedto 4 percent per annum. The investment level remained high; the ratio 1/of fixed investment to GNP averaging over 20 percent during 1966-69,compared with around 18.5 percent in the previous four years. What is evenmore important, previously neglected public sector investments in infra-structure rose rapidly, doubling between 1965-66 and 1968-69, and the ratioof public investment to total investment, though still very low, improved.However, savings performance, which had been such a strong feature of theover-all economic picture in,the first half of 1960's, deteriorated after1966; the national saving rate dropped-from the peak of 22 percent in 1965-66to 16 percent in 1968-69. A reflection of the savings-investments gap wasthe growing fiscal deficit which reached a record level in 1969 and thelarge increase in bank credit to the private sector. The balance of paymentsposition thus came under serious pressure during 1968 and 1969. Whileimports expanded by 35 percent between 1966 and 1968 and then levelled offduring 1969, exports increased by less than 1 percent per annum during1966-69. Consequently, the current account deficit (including transfers)reached huge proportions averaging 3.2 percent of GNP during 1968-69. Thisdeficit was largely financed with foreign credits of relatively shortmaturities.
2. The Philippine economy thus found itself confronted with a seriousfinancial problem at the end of 1969. As foreign exchange reserves declined,confidence in the peso weakened further, encouraging the diversion of ex-ports and invisible earnings into unofficial channels. In this situation,Philippine authorities decided at the beginning of 1970 basically to reorientthe economic policies to strengthen the balance of payments and to facil-itate an orderly settlement of the foreign debt. A standby agreement withthe IMF was concluded in February 1970 and a comprehensive stabilization 2/program was adopted. The program consisted of a number of measures aimedat reducing excess liquidity in the economy, limiting the growth of short-term external debt, the establishment of a floating exchange rate andliberalization of most import restrictions.
1/ All GNP, investment and saving data are in 1967 prices.
2/ For details of the stabilization program, see pages 18-23 of the lastBank report on "Current Economic Position and Prospects of thePhilippines", August 1970 (EAP-16a).
- 2-
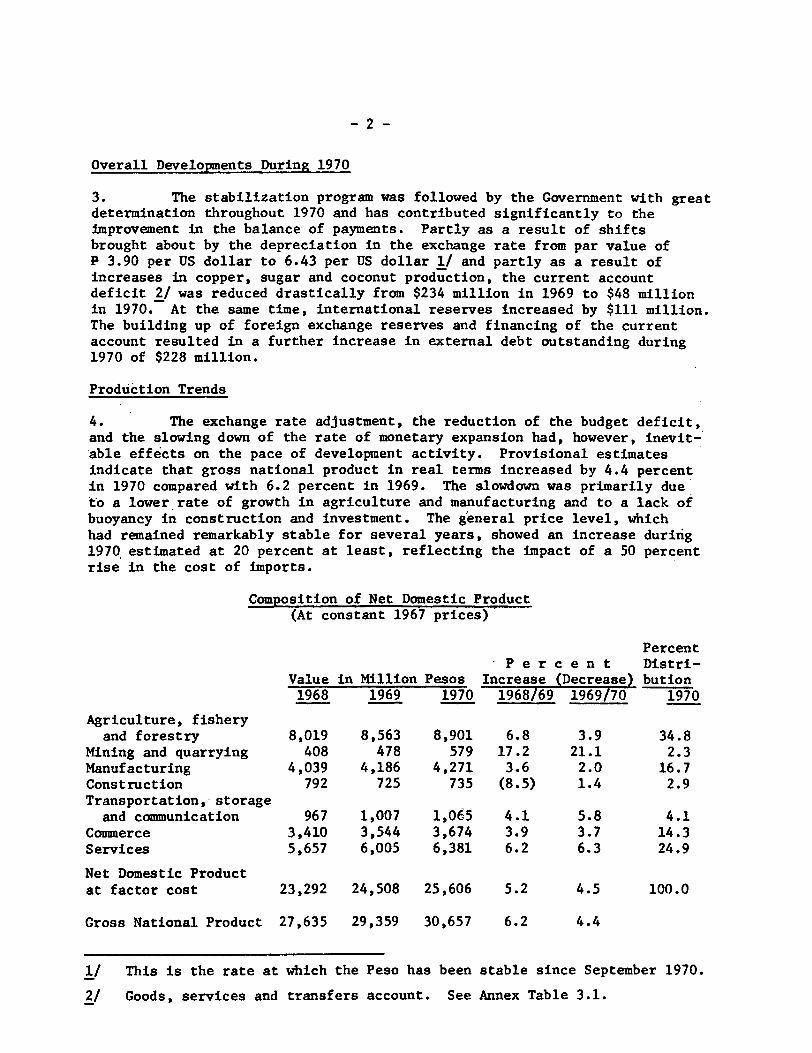
Overall Developments During 1970
3. The stabilization program was followed by the Government with greatdetermination throughout 1970 and has contributed significantly to theimprovement in the balance of payments. Partly as a result of shiftsbrought about by the depreciation in the exchange rate from par value ofP 3.90 per US dollar to 6.43 per US dollar 1/ and partly as a result ofincreases in copper, sugar and coconut production, the current accountdeficit 2/ was reduced drastically from $234 million in 1969 to $48 millionin 1970. At the same time, international reserves increased by $111 million.The building up of foreign exchange reserves and financing of the currentaccount resulted in a further increase in external debt outstanding during1970 of $228 million.
Production Trends
4. The exchange rate adjustment, the reduction of the budget deficit,and the slowing down of the rate of monetary expansion had, however, inevit-'able effects on the pace of development activity. Provisional estimatesindicate that gross national product in real terms increased by 4.4 percentin 1970 compared with 6.2 percent in 1969. The slowdown was primarily due*to a lower rate of growth in agriculture and manufacturing and to a lack ofbuoyancy in construction and investment. The general price level, whichhad remained remarkably stable for several years, showed an increase during1970 estimated at 20 percent at least, reflecting the impact of a 50 percentrise in the cost of imports.
Composition of Net Domestic Product(At constant 1967 prices)
PercentPercent Distri-
Value in Million Pesos Increase (Decrease) bution1968 1969 1970 1968/69 1969/70 1970
Agriculture, fisheryand forestry 8,019 8,563 8,901 6.8 3.9 34.8
Mining and quarrying 408 478 579 17.2 21.1 2.3Manufacturing 4,039 4,186 4,271 3.6 2.0 16.7Construction 792 725 735 (8.5) 1.4 2.9Transportation, storage
and communication 967 1,007 1,065 4.1 5.8 4.1Commerce 3,410 3,544 3,674 3.9 3.7 14.3Services 5,657 6,005 6,381 6.2 6.3 24.9
Net Domestic Productat factor cost 23,292 24,508 25,606 5.2 4.5 100.0
Gross National Product 27,635 29,359 30,657 6.2 4.4
1/ This is the rate at which the Peso has been stable since September 1970.
2/ Goods, services and transfers account. See Annex Table 3.1.

-3-
5. Value added in agriculture increased by 3.9 percent, compared withan increase of 6.8 percent in 1969. The main factors adversely affectingagricultural output were a series of typhoons, measures to limit log exportsfor conservation purposes, and weaker demand for forest products in localand foreign markets. Sugar and rice production increased substantially inthe crop year 1969-70. Favorable weather in sugar growing areas, increasedmilling capacity and a larger acreage under cultivation (13 percent) led toa nearly 20 percent growth in sugarcane production. Rice production con-tinued to benefit from wider use of high-yielding varieties, increasedfertilizer use and extension of irrigation facilities.
6. Available data indicate that value added in manufacturing industrieswould show only a small increase in 1970 compared with 1969. The slowdownin manufacturing activity could be attributed to a number of factors, in-cluding import restrictions during the latter part of 1969 and early 1970,the relatively tight credit conditions, the higher costs of imported rawand semi-processed materials, a shortage of liquidity in firms with a highforeign debt share in the capital structure, and to a slowdown in construc-tion which had.especially affected the cement industry. Production oflocally assembled automobiles and of certain textile products declined.The former were adversely affected by import restrictions and an excessivenumber of small-scale operations, and the latter continued to suffer fromsmuggling. The typhoons adv4rsely affected output in certain industriesin areas where electric power had been interrupted.
Gross Domestic Capital Formation(At constant 1967 prices)
PercentValue in IncreaseMillion Pesos (Decrease) Percent of GNP1968 1969 1970 1968/69 1969/70 1968 1969 1970
Construction 2,021 1,843 1,876 (8.8) 1.8 7.3 6.3 6.1
Durable Equipment 3,672 3,724 3,461 1.4 (7.1) 13.3 12.7 11.3
Increase in stocks 478 473 519 (1.0) 9.7 1.7 1.6 1.7
Gross DomesticCapitalFormation 6,171 6,040 5,856 (2.1) 3.0 22.3 20.6 19.1
Investment Level
7. As a result of stabilization policies and a sharply reduced netinflow of external resources, gross fixed domestic capital formation showeda drop of 4 percent between 1969 and 1970 and the ratio of fixed investmentto GNP dropped from 19 percent to 17.4 percent, and compared unfavorablywith the peak of 21.3 percent in 1967. Apparently, the drop in publicinvestment during 1970 was much steeper and thus for the first time since1966 the trend towards an increasing share of public investment in total

investment was reversed. The setback to public investment, though under-standable in the light,of the need to balance stabilization needs withgrowth requirements, does point to the continuing and difficult problemof mobilizing sufficient resources for the public sector development program.The overall saving rate of the Philippine economy actually improved during1970 and at around 17 percent of GNP does not compare unfavorably with mostdeveloping countries. What is needed is to bring about a better balancebetween public and private investment and to raise the investment level asa whole by increasing the net inflow of resources to the Philippines andby further increasing the level of savings. The practicability of enlargingthe current account deficit during the next few years will depend greatly,however, on the level of debt service payments as well as gross inflows.The key issues of mobilization of resources for the public sector and debtservice requirements are discussed in some detail in the subsequent sections.
B. Fiscal Trends
8. The fiscal position of the National Government has shown aremarkable improvement during the last year. The revenue account deficit,which had grown to P 218 million in FY 1969-70, is expected to be replacedby a surplus of P 457 million during FY 1970-71. The improvement has beenbrought about entirely by a growth in tax revenues of 26 percent which isattributable in part to new tax measures, especially the introduction ofthe export tax which was expected to yield an additional revenue of P 440million. The current expenditures are expected to show an increase ofonly 4.4 percent between FY 1970 and FY 1971 which is traceable mainly toa rise in debt service. The present restraint in current government spending,notwithstanding a general rise in prices and costs, is commendable. It isnoteworthy that in the three years preceding 1970-71, current spending hadrisen by an average rate of over 16 percent per annum and had been a majorfactor responsible for the serious imbalance in the budgetary position.

- 5 -
Government Current Account, 1965/66-1971/72(In million pesos)
1965/66 1966/67 1967/68 1968/69 1969/70 1 9 7 0 / 7 1 - 1 9 7 1 / 7 2Lb-/C
Tax Revenue 1,775 2,202 2,491 2,848 3,214 4,024 4 ,7 20--
Non-Tax Revenue 306 423 395 403 399 471 477
Total 2,081 2,625 2,886 3,251 3,613 4,495 5,197
Less Transfersto LocalGovernments 213 286 333 389 502 564 637
Net CentralGovernmentRevenue 1,868 2,339 2,553 2,862 3,111 3,931 4,560
Current Expendi-ture (includingcapitaltransfers) 2,003 2,210 2,475 3,056 3,328 3,474 3,811
RevenueSurplus/Deficit -135 +129 +79 -194 -218 +457 +749
/a Rev-ised-estimates.7T Budget estimates./c Including collection from additional tax measures of P 269 million
yet to be approved by Congress.
9. Despite the impressive gain in revenues and limited rise in current
spending, the capital outlays (spending on infrastructure and non-infra-
structure capital formation) had to be cut back during 1970-71 in order to
eliminate almost entirely the reliance on the banking system for financingthe budget deficits. The sharp curtailment in credit creation for the public
sector was no doubt essential in order to relieve the pressure on the
balance of payments, but the net effect of the stabilization measures onpublic investment cannot be viewed without concern. Capital expenditure 1/
of the National Government, which had risen steadily from P 347 million in
FY 1966 to P 975 million in FY 1970, is expected to decline to P 816 million
in FY 1971. Admittedly a part of the increased spending on infrastructure
program during FY 1970 occurred under various community projects (P 163 mil-
lion) which do not rate as high priority investment. But still, allowingfor the sharp increase in the prices of investment goods which has occurred
particularly during 1970, the current levels of government capital spending
1/ Including foreign loans.

- 6 -
compare very unfavorably with the level either in FY 1968 or FY 1969. Thelost ground in public investment would have to be recovered quickly during1971-72 if the Four-Year Plan is to have even a moderate change of success.
Trends in Government Spending
1965/66 1966/67 1967/68 1968/69 1969/70 1970/71 1971/72
Percentage growth of:Total expenditure 7.2 13.7 16.3 22.7 12.3 0.8 12.0Current expenditure /a 8.6 10.3 12.0 23.5 8.9 4.4 9.7Capital expenditure 7 -3.4 42.7 46.1 18.3 30.8 -16.0 25.1Revenue /c -0.6 26.1 9.9 12.6 11.1 24.4 15.6
Capital expenditureas % of totalexpenditure /b 10.1 12.7 15.9 15.4 17.9 14.9 16.9
/a Including capital transfers (- amortization payments).7b- Excluding capital transfers.
7c National government revenue plus transfers to local governments.
10. The Infrastructure Investment Program for FY 1971 has already been
scaled down from the Plan projections of P 976 million to P 775 million.
Moreover the price increases of capital goods have been substantially larger
than envisaged in the Plan and actual implementation during the year may fall
short of the present target of P 775 million. Thus the shortfall in infra-
structure in the first year of the Plan may be as large as one-third in real
terms.
11. The budget for FY 1972 as submitted to Congress proposes an infra-
structure investment of P 1,260 million (local currency spending of p 744
million and foreign loans or reparation of $86 million). While this level
represents a small decline of 7 percent over Plan projections, it constitutes
a most ambitious goal in the light of current !.mplementation of public develop-
ment outlays. As far as can be seen, the success of the Administration's
efforts to bring about a rapid recovery in the infrastructure investment
level would depend crucially on the additional taxation effort during FY 1972.
The President's budget message indicates a budget deficit which is to be met
from additional taxation proposals of P 269 million. In case and to the
extent that Congress does not approve the taxation proposals, the downward
adjustment would be perhaps made mainly in proposed public investment. The
current expenditures for FY 1972 which, excluding debt service, are planned
to be increased by 8.5 percent, may also bear some pruning. But considering
that salary increases of 5 percent are given automatically to public servants

- 7 -
every year and that the Administrative Reorganization 1/ proposals might notbe acted upon by Congress during the current session, prospects for majoreconomies in current spending appear limited.
12. The absolutely vital need in the Philippine context of raising thelevel of tax revenues has been discussed frequently in previous Bank reports.Notwithstanding the impressive gain of 26 percent in tax revenues during1970-71, the issue of mobilizing larger tax revenue remains as alive as ever.Firstly, as mentioned above, despite the jump in taxation receipts during thecurrent year, the public investment effort was clearly inadequate. Moreover,the export tax imposed last year to mop up part of the windfall gains accruingto the exporters from the devaluation was approved by Congress for four yearsonly and at gradually decreasing rates. Thus the apparently large gain inrevenue of P 440 million from this source is not permanent and would dis-appear entirely by FY 1975. Furthermore, and this has particularly greatrelevance for the longer run, the tax system appears to be rather inelasticso that production and income increases do not often result in proportionateincreases in tax revenues. The tax revenues of the National Government 2/showed an increase of 60.percent between 1967-68 and 1970-71 but about halfof this increase came from additional taxation measures. The normal growthin tax revenue over this period including effects of improvement in taxcollection, estimated at 9 percent per annum compared with an annual increaseof 13 percent in GNP in current prices. Thus the ratio of tax revenues toGNP would have dropped but for the additional tax effort. As it is, the taxratio improved from 9 percent in 1967-68 to an estimated 10 percent in 1970-71.
13. In judging the total revenue effort of the government, however, itis necessary to take account of non-tax revenue of the national government,revenues of local government, and mobilization of resources through theSocial Security System (SSS) and the Government Service Insurance System(GSIS). The calculation on this basis suggests that total revenues ofnational and local governments are currently around 14 percent of GNP andare lower than in most developing countries.
I/ A Government Reorganization Commission was constituted in 1968,composed of three members from the Administration and three memberseach of the Houses of Congress, with the specific task of preparingrecommendations for economies in government expenditures and policiesfor a more efficient pursuit of economic development. The findings ofthe Commission have been finalized and would be submitted to Congressin May 1971.
2/ Before transfers to local governments.

- 8- -
Revenue Effort, FY 1966-71(In million pesos)
1966, 1967 1968, 1969 19,Q 197/1
National governmentrevenue 1,868 2,339 2,553 2,862 3,111 ,931.
Transfers to localgovernments 213 286 333 389 5Qz 564
Local governmentsrevenue 360 382 340 385 431 483
Sub-total 2,441 3,007 3,226 3,636 4,Q44 4,978
SSS 107 119 132 146 147 17QGSIS 111 130 148 254 288 319
Sub-total 218 249 280 400 435 489
Total Revenue 2,659 3,256 3,506 4,036 4,479 5,467GNP (in current prices) 22,158 24,635 26,830 29,687 34,644 39766 /a
Revenue Effort
(% of GNP) 12.0 13.2 13.1 13.6 12.9 14.0
/a Estimate.
14. But in the final analysis, it is not so much the level of taxrevenues as the outlook for growth which is relevant for Judging theadequacy of a tax system. It is in this context that the Philippines'rather inelastic tax system and dependence on a temporary source of reyeque,vix. the export tax, cause concern. A meaningful tax reform must aim at notonly tapping new sources of revenue but also improving the responsiveness ofthe tax structure to income changes. A comprehensive analysis of the causesof the lag in revenues in recent years would help to pinpQipt the weaknessesof the present system. Generally speaking, the tax program approved in FY1969, while raising additional revenue eroded the tax basis further bygranting liberal tax exemptions 'under personal income tax, lso, theseexemptions were regressive as benefits went mainly to higher income groups,The Investment Incentives Act :passed in 1967 with its imporjtant tariffexemptions 'for capital goods imports has also caused a lp_s of rgep.,In'FY .1971 'Congress approved the Export Incentives Act provding tax ;rjdits,tax exemption fon imported capital -equipment,, and exemption from lexpgrt axfor exporters. 'This 'law would further affect revenue yield. Thw appropr:iate-ness 'of special export incentives at this stage is Ves a g Lg P AeTacto fdevaluat'lon 'of the peso by 40 percent since February 1:970 in itselfhas 'ensured sufficient initial incentives for potential exporters, A xypieof the Export 1ncentives Act so soon after its app.rova ma?j y, however, be:dff.`ifcult. But ,a review of the 'Investment incent-ives Act and sexemptionsavaiL4bl;e 'under in,come tax and -other 'legislation appears highly -des:irable,.

- 9 -
15. The mission was impressed with the determination on the part ofthe Executive to close tax loopholes and to improve collections generally.A Tax Census Law passed two years ago would be enforced from this year. Itrequires all citizens with property (above P 3,000) to file an assetsreturn. These returns would be processed by the Bureau of Internal Revenue(BIR) and used for building up a tax roll. Key personnel have been re-shuffled in BIR and the names of tax delinquents are being published. AStanding Committee, consisting of members from the Joing LegislativeExecutive Tax Commissionand BIR, has been created to simplify the tax codeand to make recommendations on closing the loopholes. The test of theefficacy of these administrative measures would be in achieving the projectedgrowth of 12 percent in normal tax revenues during FY 1972.
16. The immediate and pressing need in the taxation field remains,however, for additional taxation during FY 1972. About P 100millionadditional taxation would be necessary merely to offset the automaticreduction in export duties which will go into effect from July 1, 1971.The tax proposals totalling P 269 million to Congress do include amendmentof the Stabilization Tax Law, as well as taxes on luxury consumption, inheri-tance tax, tax on idle lands, revision or repeal of certain tax exemptionlaws, and imposition of fees and taxes on certain forms of gambling afterlegalizing the activity. The tax proposals are generally well conceived butare likely to meet with considerable resistance from Congress in an electionyear.
17. From the viewpoint of both equity and revenue, the maintenance ofexport taxes on most products at least at the 1970-71 level (a range of 8-10percent) deserves a high priority. Considering the large windfall gainsbecoming available to agricultural exporters through the floating exchangerate, the initial export levies certainly did not impose a heavy burden.For most of the export products which were moving through official channels,the export duties were aimed at best at mopping up about one-third of theincrease in export incomes. In fact, the depreciation of the peso throughthe floating exchange rate went further than was perhaps originally envisagedand thus even a smaller portion of the total increase in export income hasbeen captured through export taxes. The improvement in the incomes of theagricultural exporters has probably further increased income disparitiesin the Philippines as real wages have fallen due to a steep rise in theprice level. This in itself is a strong argument for maintaining the levelof export taxation. But even more important should be the long-term con-sideration of using export taxes as a more permanent device to tax agricul-tural incomes which are difficult to tax otherwise. Furthermore, exporttaxes may be an effective instrument of siphoning off large gains resultingfrom sudden increases in international prices of primary products likecopper, logs and copra. There are certain measures other than taxationwhich would also have an important bearing on the availability of publicsector resources for development in the near future. The payments forgratuities, etc. have been rising as Congress has enacted laws increasingpension and retirement benefits while premiums were kept constant. It isimportant that these actuarial deficiencies be remedied through legislation.It may also be stressed that in the past, substantial amounts of government

- 10 -
funds have been.channelled to the private sector, thus reducing the avail-
ability for public investment. It is encouraging to note that the Govern-
ment financial institutions, notably GSIS and SSS which were engaged in
commercial and industrial lending to the private sector in.the past, will
concentrate their new loans on housing as well as on self-liquidating infra-structure projects (NWSA, NPC, etc.). GSIS and SSS together will agke p 300million available for housing purposes in FY 1972 and will take up p. 130million in Government bonds. National Government support torDevelopmentBank of the Philippines for payments, abroad on loans guaranteed by DB? hastaken place in the form of depesits witb, DBP. Thus, DP is required tq repay,eventually tothe Government the amounts made available to it through ear-marking of 25 percent of export duties.
C. Balance of Payments.
Export
18. The major factor in the favorable shift in the balance of paymeptsduring 1970 was the improvement in the trade balance resulting mainly from
a large expansion in exports. Merchandise exports, which had virtually
stagnated between 1966 and 1969, showed an increase of $188 million or 22
percent to $1,043 million in 1970. The rise in total exports, notwithstanding
a decline in logs (the largest single export), was attributable entirely tothe impressive increases in coconut products, copper concentrate, sugar,
fruits and vegetables, and other exports. Though the exchange rate adjust-ment and the rise in export prices contributed significantly to the expapsignin exports, the most important factor was the rise in production of export
products notably sugar, copper and bananas.
Merchandise Exports
UnitPrice Index(1966 = 100)
1966 1967 1968 1969 1970 1970
Copra 157 129 123 87 97 110Coconut oil 75 59 77 51 101 119Other coconut products 35 28 36 25 37 101Sugar (centrifugal) 132 142 144. 149 178 113Abaca 22 17 13 16 17 113Logs 197 207 208 215 208 112Wood products 42 42 54 44 47 98Copper concentrates 75 75 89 133 190 128Tobacco 12 11 16 17 15 74Others 81 111 97 118 153
Total 828 821 857 855 1,043 -
Annual Increase -0.9 4.4 -0.2 22.0

- 11 -
19. Exports of coconut products increased by 41 percent to $235 millionduring 1970, reflecting mainly the doubling of coconut oil exports to $101million. Coconut oil prices showed an average increase over 1969 of 14 per-cent, while copra prices improved by 8 percent. It is noteworthy that exportsof copra plus the copra equivalent of oil showed an increase of 28 percentbetween 1969 and 1970. Only a part of this increase can be explained bythe modest rise in domestic production of copra. It would appear thatperhaps as much as 150,000-200,000 tons of copra exports (valued at $30--35 million) were reverted from unofficial channels to recorded earningsfollowing the devaluation. Earlier estimates of the value of unrecordedexports appear to have been exaggerated, however.
20. Earnings from copper increased by over 40 percent due mainly toincreased volume reflecting the full effect on output of increased invest-ments in mining during the last few years. Copper prices, though very highduring the early part of 1970, continued to fall throughout the year. Theaverage unit value of copper exports during 1970 showed only a slight improve-ment over 1969.
21. The expansion in sugar exports from 980,000 tons in 1969 to1,165,000 tons in 1970 was made possible by the commissioning of nine newsugar mills - first since World War II - in 1969 and 1970 and a parallelexpansion in sugar acreage and was strongly motivated by attempts at fullerutilization of quotas under U.S. Sugar Act of 1965, in view of its renewalthis year.
22. Other exports showed an increase of 30 percent during 1970.While minor manufactured goods rose following the exchange rate adjustment,the full impact of the exchange reform and Export Incentives Act on theseexports will probably be felt in 1971 and succeeding years.
23. The export performance of forest products was somewhat disappoint-ing. The output and export of logs were adversely affected by typhoons andsubsequent power failures, and slackness of international demand. Meanwhile,the plywood and wood product exports continued to be hampered by high costs.
Imports
24. According to preliminary estimates, imports recorded a decline ofnearly 4 percent during 1970. Though the breakdown of imports given belowis not precise, it does seem that the reduction in imports was confinedmainly to capital goods and consumer goods imports, and intermediate goodsimports did!not decline.
Imports(In US dollars, calendar years)
1966 1967 1968 1969 1970
Consumption 161 204 185 172 144Capital 297 407 444 444 401Intermediate 397 450 521 515 545
Total 855 1,061 1,150 1,131 1,090

- 12 -
25. On the whole, it seems that availability of raw materials wasnot a serious constraint on industrial growth during 1970 and that importliberalization in respect of most intermediate products had proceededsmoothly. Import restrictions on certain 1/ categories of goods, however,continued and it was significant that despite some quantitative restrictions,the decline in imports of 10 percent during 1969/70 projected by the Planhad not materialized. This further confirms the belief expressed in thelast Economic Report that the Plan projection visualizing only a 5 percentannual growth in imports between 1969/70 and 1973/74 was unrealistic.
Invisibles
26. The invisibles balance on account of services and transfer pay-ments deteriorated from a surplus of $22 million in 1969 to a deficit ofthe same order in 1970. The deterioration was attributable almost entirelyto higher interest payments on foreign debt which jumped by $57 million,from $38 million in 1969 to $95 million in 1970. The receipts on accountof Japanese reparations during 1970 were also $20 million smaller than inthe previous year. On the other hand, receipts from travel improved veryconsiderably due to the exchange rate adjustment, which attracted back intoofficial channels a large part of tourist expenditures. At the same time,travel expenditures abroad were cut back sharply as restrictions.tweretightened on travel.
Foreign Debts
27. Despite the current account deficit, international reserves 2/increased by $111 million during 1970 to $236.6 million. The increase inforeign exchange reserves and the financing of.the current account was madepossible mainly by an estimated net increase in total foreign debt (excludingdues to IMF and short-term liabilities except those of the Central Bank) of$228 million. The first allotment of SDRs, and net IMF assistance amountedto $18 million and $14 million respectively during 1970. The overall netincrease in foreign debt during 1970 obscures the very high debt repaymentsof $373 million effected during the year. As shown by the table below,availabilities of $601 million were necessary in order to bring about the netincrease of $228 million in debt. The short-term availments of the CentralBank were largely offset by short-term repayments (excluding debt restructuring);$80 million of short-term debt was contracted and repaid within the year.But the medium- and long-term gross private borrowing at $332 million farexceeded the corresponding repayments of $187 million. Nearly three-fourthsof the net increase in outstanding debt was thus attributable to the privatesector. The details of this debt are now known, but a large part of it isin the form of suppliers' credit.
1/ The opening of letters of credit for three categories of imports is notpermitted. These categories accounted for about 5 percent of totalimports in 1068. It is not readily possible to estimate the relativeshare of other imports which are subject to restrictions.
2/ As defined by the Philippine Authorities: gross reserves of the CentralBank plus net reserves of commercial banks. The IMF definition of netreserves normally includes the foreign exchange liabilities;of CentralBank of less than 12 months' original maturity.

- 13 -
Availabilities and Repayments of/aForeign Credits and Loans in 1970--
Availabilities Repayments Net Availabilities
Short Term 140 109 31Public 140 109 31
Of which: Central Bank 140 109 31Other - - -
Medium Term 209 179 30Public 52 56 _4
Of which: Central Bank 40 13 27Other 12 43 -31
Private 157 123 34
Long Term 252 85 167Public 78 21 60
Of which: Central Bank - - -Other 78 21 60
Private 175 64 108
TOTAL 601 373 228
/a These exclude debt rescheduling in 1970: short term -- $143 millionUS bank credits (into long-term.debt) and $22 million European bankscredits (into medium-term debt); and medium term -- $58 million USbank credits (into long-term debt). The foreign debt excludes amountsdue to the IMF and short-term liabilities other than that of theCentral Bank.
28. The total debt outstanding increased from $1,344 million at theend of 1969 to $1,573 million at the end of 1970. Despite a substantialincrease in total debt, the short-term debt with a maturity of up to oneyear dropped sharply from $196.4 million from the end of 1969 to $62.8million at the end of 1970. This reduction in short-term liabilities wasmade possible by the refunding of over $220 million of Central Bankobligations into longer-term loans. Nevertheless, the structure ofPhilippines' debt continues to be a matter of serious concern. While thetotal volume of external debt is not much higher than one year's grossforeign exchange earnings, 23 percent of the debt is payable in 1971 andnearly two-thirds must be paid within the next four years. The amortizationpayments of $362 million along with the estimated interest payments of $141million would mean a total debt service of $503 million during 1971, whichwould be larger than the debt service of $468 million in 1970. The ratioof debt service to total foreign exchange earnings during 1971 will remainunchanged at 32.8 percent, the 1970 level.
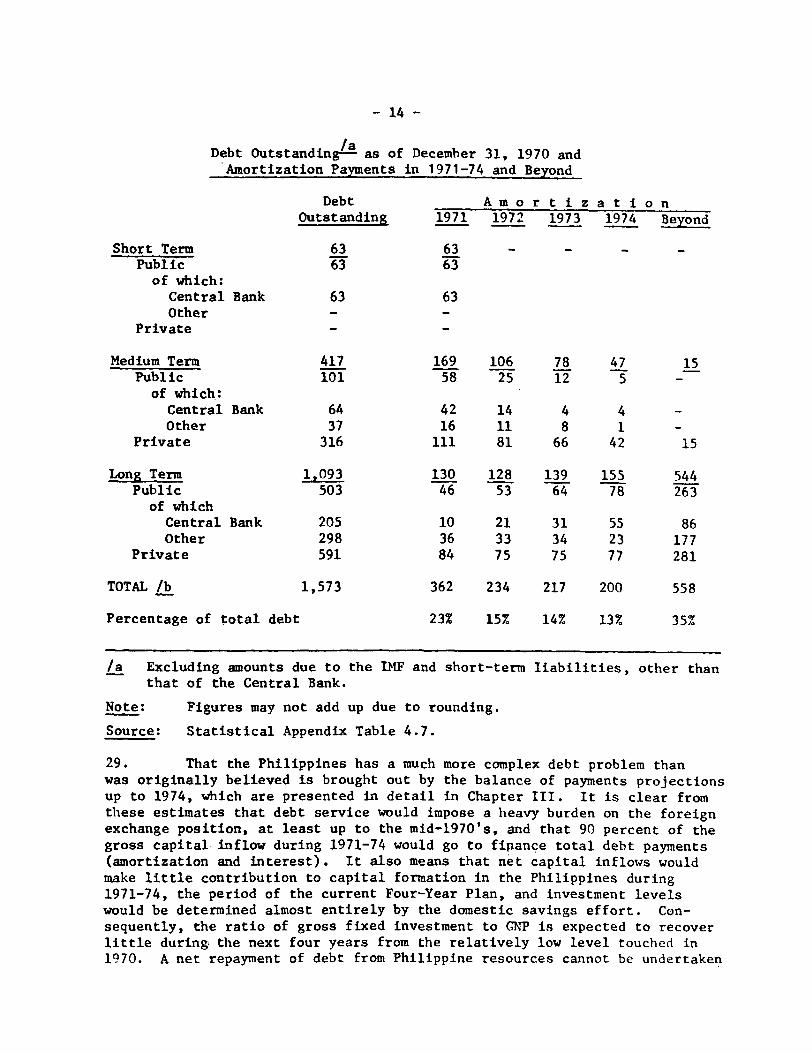
- 14 -
laDebt Outstanding- as of December 31, 1970 and
Amortization Payments in 1971-74 and Beyond
Debt Amorti zationOutstanding 1971 1972 1973 1974 Beyond
Short Term 63 63 - - - -Public 63 63of which:
Central Bank 63 63Other - -
Private - -
Medium Term 417 169 106 78 47 15Public 101 58 25 12 5 -
of which:Central Bank 64 42 14 4 4 -Other 37 16 11 8 1 -
Private 316 111 81 66 42 15
Long Term 1,093 130 128 139 155 544Public 503 46 53 64 78 263
of whichCentral Bank 205 10 21 31 55 86Other 298 36 33 34 23 177
Private 591 84 75 75 77 281
TOTAL l 1,573 362 234 217 200 558
Percentage of total debt 23% 15% 14% 13% 35%
/a Excluding amounts due to the MF and short-term liabilities, other thanthat of the Central Bank.
Note: Figures may not add up due to rounding.
Source: Statistical Appendix Table 4.7.
29. That the Philippines has a much more complex debt problem thanwas originally believed is brought out by the balance of payments projectionsup to 1974, which are presented in detail in Chapter III. It is clear fromthese estimates that debt service would impose a heavy burden on the foreignexchange position, at least up to the mid-1970's, and that 90 percent of thegross capital inflow during 1971-74 would go to fipance total debt payments(amortization and interest). It also means that net capital inflows wouldmake little contribution to capital formation in the Philippines during1971-74, the period of the current Four-Year Plan, and investment levelswould be determined almost entirely by the domestic savings effort. Con-sequently, the ratio of gross fixed investment to GNP is expected to recoverlittle during the next four years from the relatively low level touched in1970. A net repayment of debt from Philippine resources cannot be undertaken

- 15 -
without further reducing the level of investment and economic activity, whichwould in turn seriously jeopardize the prospects of long-term growth of out-put and exports. To stress the point that the large demand on resources toservice external debt may hamper the pace of development activity in thenear future, is merely to emphasize that gross capital requirements projectedby the Mission are in a sense a minimum.
30. The terms on which external capital becomes available to thePhilippines during the next four years will also be crucial. Unless thePhilippines obtains a larger inflow of longer-term capital on more favorableterms and with adequate grace periods, she will not be able to substitutelong term for medium and short term debt, and the debt service ratio willremain very high. With an average maturity of new debt of eight years butwith no grace periods, the debt service will stay close to 30 percent evenby 1974. Such a position, though not inconsistent with the creditworthinessof the Philippines, would pose an immense foreign exchange management prob-lem. It might also force the Philippine planners and financial leadershipto take a very short-term view of both balance of payments and growth. Thisunderlines the need for long term more liberal assistance to the publicsector, particularly in the form of commodity loans or quickly disbursingproject aid.
D. Money and Credit
31. As a result of stringent fiscal and monetary policies, themonetary authorities managed to contain the rate of growth of money supplyin 1970 to 6.2 percent, compared with the unprecedented increase of 19.4percent in 1969. Particularly sharp was the curtailment of advances tothe public sector, which rose by a net P 46 million, or 1 percent, in greatcontrast to P 1,244 million, or 40 percent, in the preceding year. Creditto the private sector
Factors Affecting Changes in Money Supply(In million pesos)
1967 1968 1969 1970
Credit to Private Sector +904 +718 +310 +1,173
Credit to Public Sector, Net +793 +283 +1,244 + 46
Private Time and Savings Deposits -752 -690 -123 - 811
Foreign Sector -390 - 98 -497 + 321
Miscellaneous Accounts of Privateand Government Banks -145 - 13 -162 - 436
Net Change in Money Supply +410 +200 +772 + 293
In Percent 12.2 5.0 19.4 6.2
Source: Statistical Appendix, Table 6.1

- 16 -
and the transactions of the foreign sector were the main sourceh of monetaryexpansion. On the other hand, the substantial increase in time!and savingsdeposits by P'811 million, or by 18.5 percent, and in the non-d;epositliabilities of the banking ,system 1/by another P 436 million., exerted a sig-nificant ,contractive .effect, and reduced the net increase in money supplyto P 293 million.
32. Although credit to the private ,sector rose by 16 percent, theincrease in the manufacturing sector was only 3.4 percent .and was not suffi-cient to satisfy the increased needs of business firms for working capitalarising from the upward adjustment of the prices of all inputs,, includinglabor., and the higher peso requirements to service foreign obligations inforeign currencies and to meet increased margin deposits on opening importletters of cr'edit. Though exact figures are not available, most of theincrease in credit was probably directed towards financing increased pesorequirement in foreign trade sector.
33. To mobilize a greater volume of savings through the banking system,a bill has been introduced to raise maximum rates of interest.. 'The presentinterest rate structure certainly .does not reflect the relative':'scarcity ofcapital; .the real yield was actually negative during 1970. Commercial bankswere able to attract floating savings through non-deposit instruments ofindebtedness at interest rates much higher than the official deposit rates,and to relend at a premium through the method of compensating balances.Also, the sale of foreign exchange to the Central Bank by the commercialbanks under swap arrangements to improve their liquidity was an -importantcontributory factor to the sexpansion .of private credit.
34. The-Philippines entered into a new Standby arrangement with theIMF for another year and in the amount of .$45 million.. The main objectivesof the arrangement for 1971 are to continue the policy of monetary andfiscal restraint, to curb the rate of price increases and to maintain-theimprovement in the balance of payments.. In the domain of fiscal policy,cash expenditures will continue to be limited to the available resources.In the monetary sphere, the net domestic assets of the Central Bank will notbe allowed to increase by more than P 175 million through August'1971. Thismargin is subject to adjustment by,the peso equivalent of the changes inthe net foreign assets of the commercial banks. To increase the 'liquidityof the commercial banks, it is intended to reduce the reserve requirementby 2 percentage points, although by no more than 1 percent prior toAugust. The measures outlined are expected ro permit bank ,credit to expand
by 10-12 percent, which is viewed as consistent with a 5.5 percent growthof GNP and a modezt increase in prices.
1/ They include margin deposits against letters of credit, trust certi-ficates, trading accounts of the Central Bank and the Government banks,inter-bank transactions, and other accounts.

- 17 -
Prices and Wages
35. In the year ending December 1970, consumer and wholesale pricesrose by 21 percent. The food shortage following the damage caused by thetyphoons in the latter part of 1970 reinforced the upward price movement.A minimum wage law was enacted raising the minimum for non-agriculturalworkers from P 6 to P 8 per day, and for farm workers from P 3.50 to P 4.75.However, only a fraction of the labor force is covered by the law while inmany instances the law, cannot be enforced. As a result, real wages ofskilled and unskilled workers declined by about 9 and 6 percent, respectively,during the first 9 months of 1970.
E. Growth Prospects
36. The discussion in the preceding sections of the debt problem andshortage of resources for public sector development suggests that the majorconstraints on Philippine growth in the near future are likely to be finan-cial. The major limitations on development activity would arise from in-sufficient availability of foreign assistance on more liberal terms andinadequate mobilization of tax revenues, though lags in project preparationmight also serve to restrict,the absorptive capacity of long term assistancein the public sector.
37. Assuming that the gross capital inflow requirements of $560million per annum during 1971-74 can be met by assistance at suitable termswhich gives reasonable relief from short-term debt burden, the deficit ongoods and non-factor services account would remain during 1974 at less thanone percent of GNP, about the same level as in 1970. Assuming a marginalsaving rate of 20 percent during 1970-74, substantially higher than thepresent average of 17 percent, the investment ratio would improve onlyslightly over the period. For the period 1971-74 as a whole, fixed invest-ment as a ratio of GNP may average around 17.5 percent compared with thePlan projection of 19.5 percent.
38. This rather disappointing prospect for investment causes concernfor the long term growth of the Philippines, particularly so because theaverage growth rate of 5.5 percent per annum during 1963-70 cannot beconsidered high in the light of the country's resources and economic poten-tial. The Philippines has large resources in the form of agricultural land,mineral deposits, and above all, a level of literacy and general educationalmost unique in South East Asia, which partly accounts for, and certainlymade possible, a dynamic native enterpreneurial class. Awareness of businessopportunities and willingness to take risk for profit is widespread amongthe population, and material advancement ranks high among personal and socialvalues.
39. Fortunately the impact of slow rise in investment on growth inthe immediate future would be cushioned by a set of favorable factors andthus it might be possible to keep the overall growth rate above 5 percent

- 18 -
per annum during 1970-74 as against the Plan target of 5.6 percent. Firstly,the output trends will continue to benefit from the relatively high rate ofinvestment during FY 1965-69. Secondly, closely related'to past investmentin key sectors such as mining, the outlook for exports remains good.The export sector, which currently accounts for nearly 18 percent of GNP,should grow by about 8 percent per annum after allowing for some reductionin export prices. Thirdly, the possibilities of spreading technologicalchange in agriculture are by no means exhausted. Despite the damage fromtyphoons during 1970, the agricultural growth has averaged over 6.1 percentper annum during 1967-70, and current signs augur well for continuedvigorous growth in agriculture provided a realistic policy framework isestablished, the right financial support and priorities are chosen and poli-tical goodwill is forthcoming from Congress. Finally, even though industrialgrowth continues to suffer from excess capacity and overcrowding in manyindustries, the exchange rate adjustment has created a favorable climate forrationalization efforts by opening up possibilities of exports. Meanwhile,because of the financial squeeze on industries, the leverage of the Devel-opment Bank of the Philippines over the private sector has increased. TheBoard of Investments, which controls and supervises all new investments,is cognizant of the shortcomings of past policies and appears determinedto reorient industrial policies specially towards export promotion and tothis end a basic reform of the existing tariff system is planned. The majorproblems in agriculture, industry and other key sectors are discussed insomewhat greater detail in the next chapter. The National Economic Councilis now engaged in preparing a 20-year Perspective Plan for the Philippines.This exercise would be useful in highlighting the long term possibilities
of.growth. It .is clear, however, that if the Philippines is to achieve a
sustained growth rate of around 6 percent per annum, it cannot go on very
long with a low investment level, which is all that it is possible to
afford with resources currently available or in prospect in the near future.
Before long, -the fixed investment rate will have to be raised to 20 percent
or more as a prerequisite to a more rapid growth pattern and a larger
measure of social development, which should be possible in the second half
of the seventies. This will require a major resource effort both domestic
and foreign. The growth outlook beyond 1974 would also depend much on how
satisfactorily the approach towards the elimination in 1974 of special U.S.
privileges in the Philippines will be handled;by both parties.
- 19 -
CHAPTER II
Sectoral Developments and Issues
A. Agriculture
40. During the last few years, the agricultural sector has grown,
on average, more rapidly than the GNP. The Four-Year Development Plan
(FY 1971-74) expects this trend to continue; with an average annual agricul-ture growth rate of 6.1 percent, the share of agriculture in Net Domestic
Product would increase further to 35.1 percent by FY 1974. The present
emphasis on agricultural development is well placed since yields per hectare
are still quite low and the possibilities of spreading technological change
are by no means exhausted. It would seem, however, that in order to faci-
litate high agricultural growth rates, there is a need at this juncture to
change the emphasis of agricultural policy away from rice to other crops and
livestock enterprises. The most remarkable feature of Philippine agriculture
at this stage is the fact that the country has achieved self-sufficiency inrice ahead of the Plan despite adverse weather conditions in 1969 and
1970 1/. The very rapid expansion in high-yielding varieties of rice, the
greater use of fertilizer and irrigation water accounts for the sharp in-crease in paddy 2/ production from 4.0 million tons in 1967 to 5.3 million
tons in 1970, despite adverse weather conditions. The breakthrough in rice
has given a new impetus to the development and expansion of the agricultural
sector. The farmers have gained confidence in the efforts of the government
and have enjoyed the profits of expanded production. However, it is at
this crucial juncture that appropriate measures are needed to avoid market
disequilibrium, to maintain stable prices for rice, and shift to resources
as necessary from rice to other crops through price incentives and thus
provide new opportunities for the farmers.
41. Prima facie, it appears doubtful that further expansion of rice
production for exports would be in the best economic interest of the country.
Over-all yields per hectare are still quite low by international standardsand the quality of rice does not seem to be suitable for export. The further
increases in rice production might, thus, have to be limited to the rate of
population growth since the income elasticity of demand for rice in the
Philippines is reportedly very low. This would mean a growth rate of rice
production of 3.5-4.0 percent per annum compared with 6.5 percent growth
in the Plan.
1/ Typhoons in 1970 were the worst on record. They reduced the value of
agricultural output a hundred million pesos and the two crops hardest
hit were palay and coconuts, though the immediate production of coconut
rose due to falling of unripe nuts.
2/ Palay.

- 20 -
42. A new and young group of technocrats now heading the agriculturalsecretariat is fully aware of the need to bring about a shift in Agriculturalstrategy. The specific objectives of the agricultural program are beingreviewed and the targets and implementation plans for 197174 are likelyto undergo considerable change. While maintaining self-sufficiency in fice,priorities ate to be given to (1) expansion of livestock and poultry asimport substitution, (2) crop diversification to feedgrains, suh as yellowcorn, sotghum and soya beans, to support the production of livestock andpoultry, and (3) the development of fisheries both for meeting dodlesticdemabd and exports.
43. fho h&w prioriti6s appear to be reasonable. But the tepercussionsof a thange in Agricultural policy have not been fully worked out not aretheir implications fully understood at present. For etample the irrigatiftpolicy stillbeOs to be too tibsely tied to an expansioh i rice production.The Governielt is, heWever, cohdidering the use of some of the itrigationwater from the Upper -fpang Project for crops other thAn rice. If, Asefs probable, inrased emphasis will be give6 to sorghum and btht feedgrains in th future, thd need fot ittigAti6n for these rops it 1es@ ald amoti aggressive water development poliy to reduce the t6st of sugst Pto=duction mAy well be more televat over the nekt five years thaftih the paddyareas. At :ptebent only 5-7 percent of area undetr sugar is iftigated aid asubstantial Iiidrease it yields could be realized by further itfigati6. Thtneed for inct0asing productivity and 16V#ting dostn of sugatchr Alto aribifroi the unctainties 4bout the V8 sugar quota for the hilippii Ad itis impdrative that the sugak industry reduces its vulnerability.
44. The p,ossiblity of agridultUrai retional speciAliatih it 4ioworth exaininttg. Yor Inta&t, it hat bten 6taed that h th weni paftof the PhilipPIhes is less suscdpt-ible to typhbn as 6p-i-rd tb the tentraland Northern sketions. Thttffot, epasion of coconut pihtAtf6nM in theSouth would Veduce the risk of typban damage considerably. biftili p6ai-bilities of dgional specialization &rk worth ifooking idt6 fot 'th'd dbiAlpmeat of liittAck and feedgrains, based upon tegional compaattI# advatagsThis assumes, however, that tht6iih legislative changes or dhafes in theinterpretatod of law, it would'b6dot possible to estAblish the 1siting ofslaughterhou§es Jn a b6fe tatibha 'basis.
4. A great deal more atteltii is required in the fil- 16f exportcrops. Cotbdt produti and tfotot ptoducts, which togethef Atduit -to?heatly half of tbtal expobts, have siffteted ftm hiedglet and a laek ofclear directib in Government 'pbltis. There is no natidnal 'Pr6gram forexpansion abld Ykhibilitation bf tobOut production. The yields have beendeclining be ckuse of insufficient fertilizer use and inadequate rejuvenat1ngof old plantations (except in the South in the early sixties). Furtherm6te,the existing 'tdit is mainly short term, while coconut growerd heed mediumand long-tetm Itedit. Since the Philippines enjoys about 48 percentof the wotld's toconut market and 1i1te domestic prices of cocfut oil maycome under pt&sure due to interMtional competition from palm oIl and su'cce§-
sive increasa in rates of the U.S. bhport duty on supply f6m 'the Philip-pihes, greabtr efforts inciuding CIhd& for research are requif@4 ,t6 imp6%k

- 21 -
productivity. Also urger.t in the rationalization of the forestry and woodindustries beginning with a redefinition of the whole forestry managementpolicies of the Government in the context of a land-natural resource conser-vation and development strategy and the need to find a balance exporting logsand processed wood products. The latter should include a re-examination ofthe Government's pricing and tax policies for the use of natural resourcesin the light of the need to induce greater utilization of major and minorforest products, minimization of forest wastes and greater processing offorest materials prior to export sale.
46. The two closely related problem areas, which continue to hinderprogress in agriculture especially towards more even income distribution,are agricultural credit and land reform. The Philippines land reform whichwas initiated under the Agricultural Land Reform Code of 1963 has made verylittle headway. The intent was to replace sharecropping with a leaseholdingsystem in the first stage and to fix lease rent at 25 percent of the averagenormal harvest during the prpceding three crop years, after subtractingcosts. The second stage was to convert leaseholders into landowners bypaying the owners of the land full compensation through the Land Bank. Afterseveral years, only 30 percent of the area involved has been transferred toleaseholders as against the target of 75 percent; actual acquisition of landand transfer of ownership rights to tenants has been negligible. Even thesharecropping tenants who became leaseholders have been forced to relyheavily on the landlords for their credit needs because of inadequate alter-native facilities. Thus the effective rents may not have changed at all.Meanwhile the spread of improved technology specially in rice has greatlyincreased absolute rents and, therefore, enhanced the value of land whichthe tenants would ultimately have to pay. Indeed the interest of landlordsin increasing the productivity and thus the value of land has been reportedlyan important factor in the rapid spread of the green revolution in thePhilippines. But as a consequence, income or at least wealth disparities inagriculture have certainly increased. A large number of cases of evictionof tenants have also been reported as landlords have been able to make useof the self-cultivation clauses of the Land Reform Code. There is generalagreement that there is need to increase allocations for the land reformprogram and to simplify procedures in meaningful progress is to be made. Abill proposing amendments to the Land Reform Act is now before Congress and islikely to be passed. This provides for the elimination of the provision forevictions for self-cultivation and also proposes to reduce the ceiling oflandholdings, to be tackled on priority basis, from 75 acres to 25 acres.Also, it proposes to extend the first stage of leaseholding to the wholecountry. The financial requirements of land reform, as presently visualized,however, remain very large and, therefore, real progress is likely to beslow.
B. Manufacturing
47. A major weakness of the Philippine economy during the sixtieshas been the slow growth of the manufacturing sector; the share of manu-facturing in the NDP fell from 18.9 percent in 1960 to 16.7 percent in 1970.

- 22 -
The limited expansion of industry during the last several years is attributedto the excessive reliance on import substitution during the 1950's Histo-rically, the maintenance of an overvalued exchange rate in combinatioh witha control program which permitted cheap imports of cApitAl gbods, restrictedthe imports of finished goods and therefore ensured a shAlttred domesticmarket and high profits for Philippine manufactures. This resulted inspectacular gains in industrial output for some time, but th6 p6§§ibilite@for easy import substitution were soon exhausted. The tariff system whithreplaced direct controls in early 1960's established low rates fo machinery,moderate rates for intermediate goods and raw materials and high rates forfinished consumer goods, and thus again encouraged ftishing stage activitieswhich were heavily dependent on imported supplies. Backwad ihtegratioi addexport-oriented undertakings remained less profitable because 6f the dis-incentives the protective system set against them. Given the liiited siidof the domestic market, many industries had to operate Ata sub;6pitfad Rcalefollowing the Government's attempt to ensure competitioh &ffrfhavingestablished high tariffs, by granting incentives to sevei ptddudefiCheap capital and easy Availment of foreign exchange further promotedexcess capacity. Protection also enabled inefficient tndertakIdiia o Uft=economic size to survive. In short, the end result of the pf6tbativ6 p6lieie§of the past, reinforced by unrealistically low intetest rates, hsa boan thadevelopment of excess capacity, inefficient productiod and a dioV-doUf inindustrial growth.
48. Cognizant of the shortcomings of past polidi&sj thd 9iift@itappears determined to reorient its industrial policy. the exehdhge fateadjustment has indeed created a favorable climate fo the etksieturtig 6findustry by improving the prospects of manufactured goods 6kp6rta.
49. The Board of Investments (bOi) is f0e6ndible f6f 0-iififig thaiavailable financial resources and foreign exchange are allocated fi accord-ance with set development priorities. The Foith Investment Mdfitied ian(IPP) for the Fiscal Years 1912-75 gives distinct priority to ifidUsti#with export orientation, producing capitai godda and resu1ting iii backwardlinkages and further procesding of Orimary productsi
50. Major projects include a eopper smeltef, a niekei profectj adaluminum smelter and a blast futhacet. A study is under way by the 90i tddetermine the profitability of the copper smelteri while hgotiations aregoing on to ensure the equity participation of all steel prdducdts in theconstruction of the blast furnace and to tesoive the qtidaioi df itdlocation. The idea of promoting a petro-chemical complek i@ A UO undef P6i-sideration. However, the heavy depeidence df such an industry o impottdinputs, the fast growing capacitieg in the region- and, in Adv9Hed contridegthe rapid technological changes, and the heavy capital require4imits arefactors that appear to militate against the adoption 6f thid pfdJett atpresent. In the light of the preponderant told of Government 06ficy indetermining the pattern of investkrtf the Government shoild give somethought to the, relative priorities of a copper smelter, an ald"dan& smelter,and a blast furiace because 6vailability of foreign excafnge ffight be aconstraint on undertaking all thoed thee ptojecte at the gatia ffif Id dfcase, bunching of heavy inddtti&l efdid be *Wided & f&& @possible.

- 23 -
51. Other measures whic h have been instituted or are under considerationinclude tariff reform and special export incentives. A bill will be intro-duced shortly in Congress to reform the existing tariff system. A uniformacross the board rate of 15 percent is proposed for revenue purposes, toppedby three protective rates rising at 15 percent ad valorem steps. Therestructuring of the tariff system, if adopted, is expected to improve customsefficiency, minimize "technical smuggling", and give more limited protectionthus forcing less efficient firms to rationalize production, amalgamate, orgo under.
52. To stimulate exports, the Government introduced a package ofincentives in the form of tax credits and exemptions late in 1970, whichwere further linked to the existing investment incentives. The aim was toprovide a stimulus of a more lasting character to sustain the initialmomentum deriving from the recent devaluation, to bring about a change inattitudes, and to ensure local producers a cost structure comparable tothat of the competing countries in the region. The incentives are alsoextended to traders. To implement the law, the BOI prepared an ExportPriorities Plan, which includes the industries with export potential andqualifying for registration. The incentives appear quite generous, parti-cularly the income tax credits.
53. A bill before Congress seeks to establish guidelines for Governmentpolicies to alleviate some of the problems of small-scale enterprises andto ensure their development. The creation of an administrative agency - the"Small Enterprises Board" I/ - is proposed with two operating arms: the"Small Enterprises Development Center", by reconstituting the Institute forSmall-Scale Industries of the University of the Philippines, and the "SmallEnterprises Development Fund". The object would be to provide the overallplanning, administrative supervision, direct financing, and technical assist-ance in the form of preparation of feasibility studies and project evaluation,management and technical training, research, production and marketing. Theinitial capitalization of the Fund will be P 50 million and will be contri-buted equally by the Central Bank, DBP, PNB, GSIS and SSS in the form oflong-term, interest-bearing loans. The Board would be empowered to borrowfrom foreign sources to increase its lending operations and to purchasecapital equipment abroad. Such loans would be guaranteed by the PhilippineGovernment.
54. Although the Government stresses the need for direct privateinvestment and its desire to attract it, legislative action is being soughtby members of the House for the filipinization of a wide range of economicactivities, which would clearly tend to alienate non-ethnic elements andforeign-owned enterprises from the economic life of the country. Bills arenow before Congress to filipinize the forestry, lumber, copra, fishing,
1/ This is to replace upon enactment the National Council for Small andMedium Industries instituted in June 1970 as an ad interim body.

- 24 -
newspaper., teélecommunications, furniture, bakery, private :educatlional institu-tions, motion pictures, embroidery, cottage, pawnshops,, 'bròkerage land'ware-housing industries. ,he impact of such policies of ,econoniirc ,nattionalsm, Ifadopted,, may :adversely affect the -investment climate in 'the'tRh.imldppines,already commanding a less ,attractive position ýthan othier «count-r±es tin !theregion, and nàay,,even.speed up the ongoing process -df disinvestm#»nt.
55. The coveraT11 expansion ,of the manufacturing secgor ýdur;ing "l971-7 ts,estimated -at 5-6 percent :per ·annum. The expansi.on durIng 1971 ;wonid 7larggydepend on the .resumpt.ion of Npùbtl(ic Works and ,constructIon ,actvity-, rand conzthe ;poss&b1&ty zof ýeas-,ing tqp ýcned-ikt.. -Shoild %these <ex ct-atons xæaterIltze,,sproduction .would be sit-lmullated I-n tthe ,cement,, ýoo:d ^products, iguass .and:steel industr&ies.. The -seIectlve cr.edit 4expans-on by the GC-etral Bank Ifor,small-scale 4n^dustries, ýfood ýprocessng cndust-rMes iand -.ndus:tes ,cat-erngthe low-cost thousing tould ýatlso Ihelp.. Exporte of iew nu'factuned goods,sudh :as -cemaent )leading to a -fwler ,utPfmzatlon of icapa:itty irouLd oir de-additiona,l 4mpetus ito -ndustr&a,1 Igrowth,. It twas ýencourikgng Ithat .dustrEa4,investment, wh-ch had Mhown a <deciine of .9 'percent In l9,69., Ancreased Anireal tterms by ,2 ¿pncent during -1970.
C. Infrasttructure ?Program
56. In tcontras.t tto naosýt deveqp&ng kcountmes,, de irole ef T Whe spub 1c,sector in ýthe IPhtllpp'ne ,economy 1s at present temaIlA. fAfithogh &nder ttheIfirst Marcos /Adm.nistration -i,p:bc 4nvesýtment was kmtre ýthan Job)ed,.jprivate ±investment st.1>01 accounts Tfor mearly 9D percent (df miotal Xnvszment.4he REour-Year fDeveNLqpment ýPilan, Ihoever,, ca'lls £.ør ta mgi-ff1-cant lncreasein the leve-l oT piVLkc 4nvestment zand iproects ian Ancrnease In -T" thare linýthe 4total from .IM.7 percent :4in FiY Ml9ý69 mto k18,.8 jpercent 'in W Æ9744. *Thereis mo doub:t that :-idfrast-ructure Invesktments n the Mhlpp&nes C-oritýinuesto be :extreme!%y Tnadequat,e and kact ias za 'sterious constra-int mon irapl,, zagrl-kcuilturai :and : adustr-al edeveIqpment,. Roeover,, ,goyernment keaptME,l oUtl3aysIor ýsoc-ial ser,vces, :notåb,y ,urb.an deveiopment and heakth,, thae (been very,smati-. Both Mor ,soela'l and <economa-,c deeqpment., ,the (Government ýimustt tpMayan Increasnglky 4mportant molle in itke RhDlpp,-nes,. ]As dJlstcussiei ýeusweheeý,kthe -rate 'of Ancxease iof ýpub:Ic ngesitment twould ýprôb:åby å aso ditermne ýt'hebbiity 'of the )Phi1ippines -to absotb ithe ,much neede~d econcesslonary :assist-
ance from bàbnoad,.
57. ,Moire than !85 ,percent (of piblL&c mnves*ment As ^in ithe Æform ýofzspending :on %dfrasttructure. 2he -i,'frastructue .p.rpgram 4ncuded iln (thesour-Year PLan (FY 197!l-74N) pro,ided for an inmestment .of P (6,..2 Mb,,'Ilton inkcurrent price's and represented an Éncnease in real kterms of (over )150 ,percentabove ithe .'eveL ,of .the sprevious 1,our ýyears (FY T996f-7,).. -En itih'e »ktght 'of ,the~financial s:tr~ixggency and ýthe 14key p.ertformance <during The :férst year '(FY11971') , the ýprp,gram 'has aready hbeen >rev&-sed doawards.. Me lpwram mnowadopted is -Ebo~t ýL8 ;prcent ýsmalier (tban the ocgèna1, bat is1ace price-inc-reas.es have (exceeded ,earlier empectatlons tihe meat 'nedugt&on .s Yarger.slIt zis snot.ewor:tby,, Ihowemer,, tt,haýt <desýpIt-e isùbsktantiaL radiustment tw4o ards,,

- 25 -
the present program is at least 50 percent larger in real terms than theactual implementation during the last Plan. Furthermore, if the programcan be implemented, it would mean doubling the ratio of public investmentto GNP to over 4 percent by 1974.
Annual Phasing of Infrastructure Program
Original Program Revised ProgramFY 1971-74 FY 1971-75
la laFiscal Year Domestic Foreign Total-- Domestic Foreign Total--
(Million (Million (Million (Million (MillionPesos) US$) Pesos) Pesos) US$) Pesos)
1971 600 71 1,026 535 40 775
1972 780 94 1,344 744 86 1,260
1973 900 151 1,806 831 117 1,533
1974 1,080 152 1,992 957 145 1,827
Total 3,360 470 6,180 3,067 388 5,395
/a Conversion rate used: US$1 - P6.
58. An examination of the phasing of the program suggests, however,that the effort to raise the spending from P 775 million in FY 1971 toP 1.827 million in FY 1974 would encounter the familiar bottlenecks 1/ ofinadequately prepared projects for foreign financing and insufficient localcurrency availability. The absorption of foreign loans in the infrastructureprogram is projected to increase from $40 million in FY 1971 to $117 millionin FY 1974. While this might not be impossible, the present indications interms of project preparation certainly do not give cause for optimism. Forinstance, the absorption of foreign loans is expected to increase to $52million in FY 1972 but more than half of the disbursements are assumed tobe under projects which have yet to be negotiated. The amount of committedbut not yet disbursed long-term official loans at $118 million at the end of1971 was rather small and of that, two-thirds relate to IBRD loans. Specialefforts, possibly the establishment of a highly staffed Central ProjectsBureau, are needed if the Philippines is to overcome the lack of a sufficientnumber of aid-worthy projects.
1/ Both these constraints often overlap and it is difficult to predictwhich one may be overriding at a particular moment.

- 26 -
59. The need for mobilizing larger resources in the public sector forsupporting the infrastructure program has already been discussed in somedetail. Mention should also be made of the need for strengthening projectmanagement by attracting highly qualified and competent professionals tothe public sector.
60. The sectoral composition of the revised program is given in thefollowing table:
Sectoral Composition of Revised Infrastructure ProgramFY 1971-74
Domestic Foreign o t a 1(Million (Million (MillionPesos) us.- Pesos) Percent
Highways 1,350 61 1,716 31.8Airports 136 44 399 7.4Portworks 123 22 254 4.7Railroad 20 24 164 .3.0Telecommunications 79 44 342 6.3Irrigation 393 54 714 13.2Waterworks 245 .36 461 :8.5Power 315 70 .737 13.7Rural electrification 76 10 136 2.5School buildings 83 19 194 3.6Flood control 60 2 71 1.3Shore protection 13 - 13 0.2Buildings/fHospitals 51 - 51 0.9Miscellaneous public works i80 - 80 1.5Preliminary engineering 43 3 :62 1.1
Total 3,067 388 5,394 100.0
61. Transportation accounts for 46 percent of the total investientproposed in the Government's Infrastructure Program. The bulk of investmentin the transport sector (70 percent) would be for highways with aviation(15 percent), ports (10 percent), and railroads (5 percent) accounting forthe balance. This is generally in line with the recommendations of theUNDP-financed Transport Survey - for which the 1BRD served as EiecutingAgency. The equipment required for the reconstruction of two high priorityroads in Luzon will be financed from the proceeds of a loan contracted withthe Ex-IM Bank of Japan; construction financing of two high priority roadsin Mindanao has been obtained from the ADB and the IBRD. Both institutionsplan further investments in highway projects. The importance of portdevelopment is also stressed in the Transport Survey but the Government'sinvestment decisions in this respect should take into account the relativedevelopment priorities of the ports identified by the Transport Survey asneeding reconstruction including, in particular. their relevance to highwayprojects planned and underway.

- 27 -
62. The power sector, including rural electrification, ranks secondin relation to total infiastructure investment accounting for 16 percent ofthe program. While this is consistent with the expanding power requirementsof the Philippines, there is a real need for a well--developed generationand transmission program in which investments by bilateral and multilateralagencies should be carefully coordinated. In view of its inadequatedomestic resources, the Government should also ensure that the state-ownedNational Power Corpor4tion (NPC) - the major supplier of power - should meeta reasonable proportion of the domestic financing requirements of theprogram from its earnings. Among the specific issues to which the Governmentshould give serious consideration are: adequate tariff increases whichwould enable NPC to finance part of its capital requirements; the need forjoint planning between NPC and the privately owned utility in the Manilaarea as to the most economic development of generation and transmissionfacilities; and the selection of investments in rural electrification inaccordance with economic criteria and the phasing of such investments tocoincide, where applicable, with planned new transmission.
D. Family Planning
63. The 1970 Census results imply an average annual growth rate inpopulation in the Philippines of 3.1 percent during the sixties. This rateof growth is lower than the previous estimate of 3.5 percent, but in viewof the probable acceleration during the decade, present growth rate muststill be very high. So far, no family planning program has receivedfinancial support from the national budget, though a bill has been introducedin Congress proposing a P 15 million appropriation for operating funds of thePopulation Commission. The Population Commission is a new agency directlyunder the President, in which the Departments of Health, Education, andWelfare, as well as other public and private organizations are represented.USAID has been the only large foreign donor so far. The total amountobligated in FY 1970 was'$5 million; of $2.8 million dollar funded pesocosts 48 percent was for service and administration, 22 percent for train-ing and education, 27 percent for information and communication, and about4 percent for research and evaluation. The USAID program is essentiallya flexible program and has been gathering momentum.
64. The overall progress in providing family planning services in 1970was encouraging. Mainly thanks to the expansion clinics (about 600 clinicsin January 1971 as against 270 in Januaryl970), the monthly number of newacceptors (all methods combined) rose from less than 10,000 in January 1970to nearly 25,000 in November 1970.
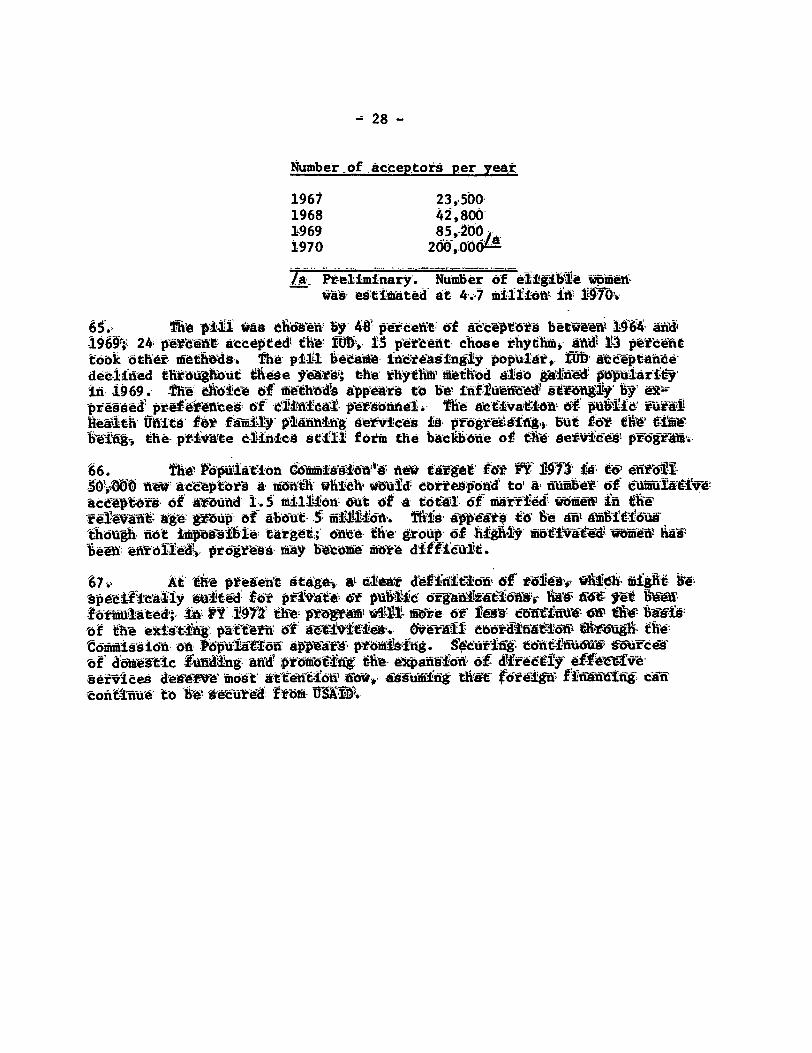
-, 28 -
Number of ác.eptots per yeat
1961 23,,5001968 41,8061969 85,-2001970 200,0Öó
a. PreMminary. Ntaber of e11ig~1 bIë öÉan-a4 eåt-fted at 4. Mi1tion io Ä
65., II " &as ehöe* by 48 pérceft 6f äeteéptdës bëtwéeW 1464 ff196; 24 gérent acceptdL the' t" , MW p-eta éiUt chose thythM Wfik 1a 3 PeTceëfttoök öthé- dthödS. The piIl te.a"e. iWctéaåi!ngly populär, fub, äteeptahcé,dealfña'xid thr-dghö't tå-eäe YM'räo the, thytfäläetköd ä,!,'E gåwirrd- #6opuify0if -1969. e CM-Må öf fthiWWs 6ppars tö M, fäft.& ätIOY' y e-préiéäé prefÉf7te- of 6-t i pd1ö ätidait ? ativation 6fT evtiäL lbriHefItii neits fUr kåb»- 014äg i-eävLc , f pfögeIfi but M6Y fäff C-ilm
biWtg-, the- pC£iä'te lbtMcs st-fII föri the bacöike ot -% åeftf'Cé pfiögffe
66. the fdoplåtiof C'ä'äfft w åtv- tárget ff 191 & 6 efft lfý5&0,ipW -fiW a€ept-tr a- töfftft WhIeW ~6d Cbféé.jdffi tod & tKUMU2` öt CdIMUfÏtfW
ateptorsr o£ avündd 1.$ milion 6at f a totäär df närffëf ~ffi kl tkwMWäfteW måb: gry-wý of''~vt. 5- MIPIIMVät Iftl- fpy€wfo c6 ht ms Emw£~f'
IfhÖUOg -föt iapasf&ä tkrgét; Mtk tfie grop öf fflfW 4~ti wüIfew häi-beff aröHiedyö pré my båä IMYbet~ tioeiå diff.
67, At 'é['é p-etat t&gé, at dfek dtffi6w 6f töléä" Qmak. äf,ght kÉåpétif.ieiy W-ftöd t PMfff mt 6f puietnoi rgaf«fftk~j MW, Köt- 7öét UMr&fi'It,éa"i. ä@ pt -4Mn thW e- M mglrå ffö-t öv fow- döo'åwc-iu om ~-€ Mfäw
bt the é*Iit-ft, å-ttft 61t dtiV-itfén». &éWI, eteittlög gÉbi'r Ofé:töfimät-šidå da, tov.!äti."if o~tä,f Ptötfigiä. gidffig gd6fú w f óideäftf ammyä't:lc Y-årkläg- äffd pr6ft:ftj ffit- é4~'£0ä'r df cffteetf éff4t e-#b%éiies daénWge most' ät'ätftoi W62* umifTg tht fiöig ffi täw'toåtu'ú tö Ut *ecr ft - ffŠk Z-i

- 29 -
CHAPTER III
Balance of Payments Prospectsand Foreign Capital Requirements
A. Introduction
68. The last Bank Mission Report had prepared detailed balance ofpayments projections for the years 1970 to 1974 and estimated gross capitalinflow requirements on the basis of these projections. These estimateswere, however, highly tentative because the impact of the exchange rate ad-justment on current account balance of payments could not be predicted withany great certainty. An attempt has, therefore, been made to review andrevise the payments forecasts for the years 1971 to 1974 in the light ofactual developments in 1970. The revised forecasts also take account of themore complete and up-to-date information on outstanding external debts inestimating debt service payments. Nevertheless, substantial informationgaps still exist in respect of certain key areas such as coconut productionand exports and while unrecorded exports and other foreign exchange transac-tions have apparently been substantially reduced following the adoption ofa more realistic exchange rate, they have perhaps not been eliminated.Thus the estimates should be regarded essentially as indicative of the broadtrends in the balance of payments. Furthermore, these forecasts are rathercrucially dependent on the assumption that the official exchange rate wouldnot greatly differ from the free market rate in the foreseeable future andthat the relative attractiveness of official channels for exports and in-visible transactions would not suffer.
69. The detailed forecasts of exports, imports, invisible transac-tions and debt service are discussed in the subsequent sections. A summaryof the estimates, is, however, given in the following table:
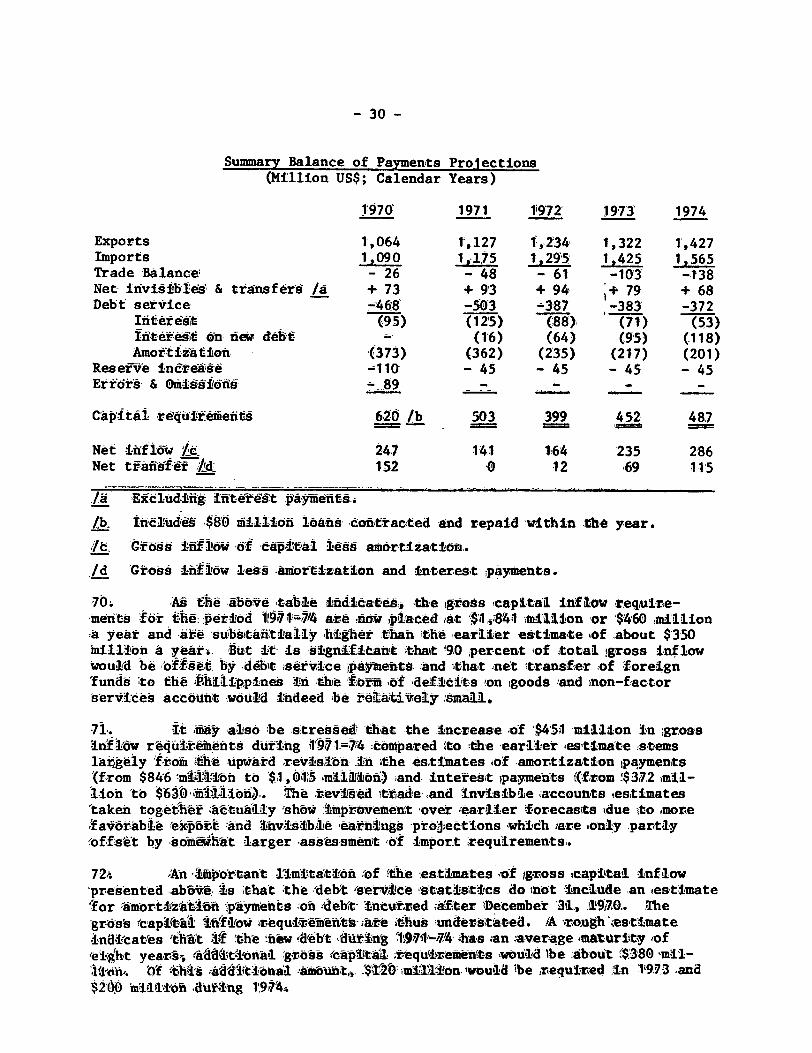
- 30 -
Summary Balance of Payments Projections(Million US$; Calendar Years)
197 1971 f972 1973 1974
Exports 1,064 1,127 1,234 1,322 1,427Imports 1,090 1,175 1,295 1,425 1,565Trade Balanceý - 26 - 48 - 61 -103 -138Net invi,±bles & transférä /å + 73 + 93 + 94 + 79 + 68Debt sétvice -468 -503 -387 -383 -372
Iñtéât st (95) (125) (88) (71) (53)fåtét'eåt än fek débt (16) (64) (95) (118)Amortizetion (373) (362) (235) (217) (201)
ResefVe inätease -110 - 45 - 45 - 45 - 45Eriöt & O.iifönÉ8é9 - -
Capitái ite4ififéäieité 620 /b 503 399 452 487
Net i iw åtc 247 141 164 235 286Net tftfåffårId 152 -12 69 115
lä Efclùditf i:ttîéét Påytåéfitå
lb-. te Šé $80 mimi loans åoätracted and repaid within the year.
Jt, toåss iIöw 6f tåp-ttä- lésas amörtizatin,.
jd Gtoss Läklöw less -ainttization and interest payments.
7. Ää -hê åböve table din at'eä, the gros !capital inflow require-mnits för tåhå :etfod té4 åöv pliaced åt -$21II'4 million or $460 millionA year and Åte subshtaitti;ay ;higher than the eariler estimate of ,about $350iill±on a yeAr Rut -it is signif.itant :thaft '90 percent 'of total jgross inflowVould be äofŠät by débt 4sévåce »åyåents. and that net transfer -of foreign'funds to thé åhaiippines ln thie ft"- of def,ci'ts ion goods and on-factorser-i;ceå accöut öild fndeed -be Péatirely .små-.
71. 1t.ïäg also be streäe -thåt the increase of '$451 miion In ;grossinkhw r.u täéiniëtå duttig 197 1.i-74 :cotpared to the earlier les,timate stemslargely tmoin 4hi upwad rev-ia:n .int the estimates Aof amorttization ipayments'(from $846 tmiiälbii to '$1,5 miiitS) and interest )paymetits 9from 1$3272 kmil-lo tö $60hiel i).. !h rtäevd ittade and invisible accounts 4estimates'taken togethkäf åat-ually shi- imptovement 'over (earier forecasits idue -to moref aotable exle~t ;and nv;is4blé 'eåthings -projettions vhidh are only partly'offiset by -bomåeKh'at larger -assessment of impor:t irequirements.
724 ;n fortant Emitaiò 'of tie ýestimates of g.ross %capital inflowpresented ,ab»k 4s that the debt seritce åtatsitItcs do Cot include an estimate'or emorè¥zät.itein 'pkymeats 'o irebit- intútred af-ter December 31,, 2970,. Thegros~ 'scapiThai îñftftow rqufrênen'tsa ithus unders;tated. /A -wonghestimateInUrcatfes 'tWt if 'the :i'ew :rdtb't diSt:n'g 1974-44 ihas ;an average maturitsy ofreli.ht year4, rådåttönal grö' s Amp¶taa. sequtiire~nWt-s would Ibe about '$380 mil-ÄkL<c,. 'of t hl trional äåïnÖunt,a .'$W mion- vould Ibe required 1n 19,3 andŠ20 Winaitoh sutåcng t9'4.

- 31 -
B. Exports
73. In rather sharp contrast to the slow average growth of less than5 percent in merchandise exports during 1959-69, the exports prospects forthe next several years appear good. The Mission estimates indicate an an-nual growth rate of 10 percent between 1969 and 1974.
Growth of Exports Earnings(In million US dollars)
Average AnnualGrowth Rates
Percent1969 1970 1971 1972 1973 1974 1969-74
Coconut products 163 230 201 217 229 241 8Sugar 158 184 211 221 232 232 8Logs 215 208 228 252 264 276 5Wood products 44 47 56 62 70 78 12Copper concentrates 133 190 178 186 180 187 7Other minerals 27 34 34 37 49 91 27Miscellaneous 115 148 197 237 276 300 21
Total 855 1,043 1,105 1,212 1,300 1,405 10
74. As mentioned earlier, the very satisfactory export performanceduring 1970 was attributable partly to a reduction in unrecorded exportsand partly to improvement in export prices. However, the entire increasein earnings during the next four years is expected to come from the increasein the volume of exports. Between 1969 and 1974, the volume of copper ex-ports is expected to nearly double, while sugar exports would increase by45 percent, log exports advance by 28 percent, and nickel would be added tothe export list in 1973. While prices of most export commodities are pro-jected during 1971-74 to remain at about the 1969 level, copper prices areassumed, on average, to be 25 percent lower. But notwithstanding the down-ward revision of copper price forecasts compared to last year, the latestexport estimates are somewhat higher than the last Mission's projectionsand are more optimistic on the whole than the Plan forecasts.
75. The Mission projections assume a much higher growth rate for thenon-traditional exports, which comprise mainly minor agricultural productsand manufactured goods. These exports are expected to double between 1970and 1974. Their relative share in total exports would improve from 15percent in 1970 to 21 percent in 1974, reflecting mainly reduced dependenceon coconut products and sugar.
76. Coconut products, which at present account for 22 percent of totalexports, are expected to grow rather slowly during 1970-74 showing an aver-age annual growth of 1 percent per annum. This is mainly because it isfelt that production and exports during 1970 were unusually high as typhoonscaused the unripe nuts, which would have normally been harvested during

- 32 -
1971, to fall. The exports of coconut products are expected to; decline byover 12 percent during 1971 and rise 6. percent per annum thereafter. Butas mentionedearlier, the unreliability. of production and export data in.respect of coconuts leaves a rather large margin of errorin. any estimates.The share of' coconut oil exports' in the group,- which showedz a remarkableincrease during 1970., is expected to increase further and by 1i974 nearlyhalf of the coconut product earnings would come from thisi source, comparedto barely 30i percent in 1969. It may be, mentioned that the Philippine ex-'ports of coconut oil to the U..S. will. face rising import duty up to, T974.when the preferential margin will be completely eliminated.
77. Sugar exports, which after having., beei stagnant im the past sixyears increasedt by 18 percent during 1970, are expected to. improve furtherby 45 percent during, 1970-74, reflecting. mainly the. expansion im sugarmills capacity which has already taken place,,, and no; further increase Inthe number of sugar mills is being, planned. The production of` sugmcanewouldi increase, however,, due to increased irrigation, and fertilizer useand improved varieties.. The projjections assume that the revisiot in U(..Sugar Act of V965 due this year- would not greatly affect the leve, ofF totalsugar quotas for the Philippines.
78'. From T960f to 1969, export of ogs, grew at 11 percent per year.,Between 1969 andi 1'9,7'4,, it is estimated to grow at an. annual average of 5percent per year. In spite of the Governmentsi policy to promotei exportsof processed woods, export of forest products ist dominated by, logs andwill continue through 1974, although some marginal improvement In the, exportof plywood isi expected. Ialegal cutting,, smugg-ling, and under-reporting,however, continue to. make accurate estimates of forest products experts verydifficult.
79., Exports of mineral products; are estimatedl to grow little between1970 and 1973 because the.copper price has tended to stabilize at low.level and wouldi offset the further large gain in productfon expected durngthe current year and next year. It is only with the starting of commexcIalproduction. of the nickel plant probably in late 1973 that a mader increasein this group can be expected.
80. All other exports together are expected to show an, average annualgrowth of 2 percent (from T969-74), rising to $300 million in 194., A moreoptimistic forecast of other exports is based partly on the 30 percent:growth during 1970', when. the full effect of the exchange' rate adjusitmentand the Export Incentives Act on manufactured goods exports was 'yet to. belfelt. Simultaneously, a sharp growth in exports of' bananast and pineapplesis expected. There. are export possibilities in a variety of canned fruits:and vegetables and meat. preparations. However, exportation is hamperedby inadequate' and irregular supply of raw materials.
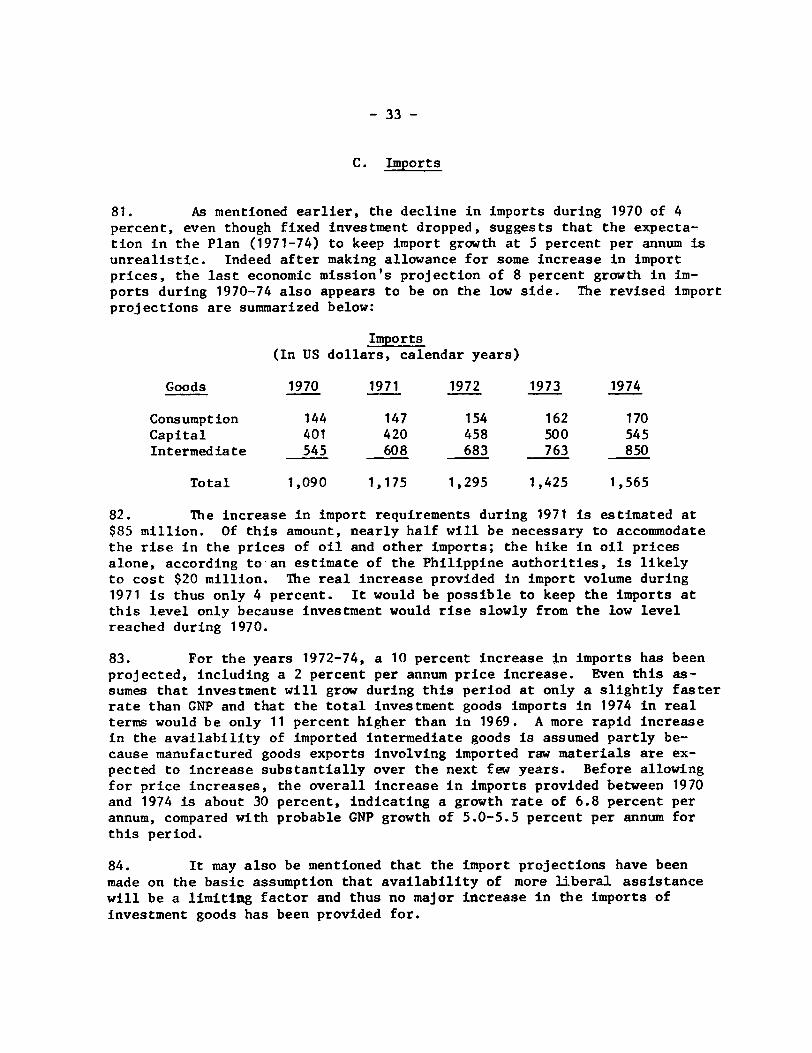
- 33 -
C. Imports
81. As mentioned earlier, the decline in imports during 1970 of 4percent, even though fixed investment dropped, suggests that the expecta-tion in the Plan (1971-74) to keep import growth at 5 percent per annum isunrealistic. Indeed after making allowance for some increase in importprices, the last economic mission's projection of 8 percent growth in im-ports during 1970-74 also appears to be on the low side. The revised importprojections are summarized below:
Imports(In US dollars, calendar years)
Goods 1970 1971 1972 1973 1974
Consumption 144 147 154 162 170Capital 401 420 458 500 545Intermediate 545 608 683 763 850
Total 1,090 1,175 1,295 1,425 1,565
82. The increase in import requirements during 1971 is estimated at$85 million. Of this amount, nearly half will be necessary to accommodatethe rise in the prices of oil and other imports; the hike in oil pricesalone, according to an estimate of the Philippine authorities, is likelyto cost $20 million. The real increase provided in import volume during1971 is thus only 4 percent. It would be possible to keep the imports atthis level only because investment would rise slowly from the low levelreached during 1970.
83. For the years 1972-74, a 10 percent increase in imports has beenprojected, including a 2 percent per annum price increase. Even this as-sumes that investment will grow during this period at only a slightly fasterrate than GNP and that the total investment goods imports in 1974 in realterms would be only 11 percent higher than in 1969. A more rapid increasein the availability of imported intermediate goods is assumed partly be-cause manufactured goods exports involving imported raw materials are ex-pected to increase substantially over the next few years. Before allowingfor price increases, the overall increase in imports provided between 1970and 1974 is about 30 percent, indicating a growth rate of 6.8 percent perannum, compared with probable GNP growth of 5.0-5.5 percent per annum forthis period.
84. It may also be mentioned that the import projections have beenmade on the basic assumption that availability of more liberal assistancewill be a limiting factor and thus no major increase in the imports ofinvestment goods has been provided for.
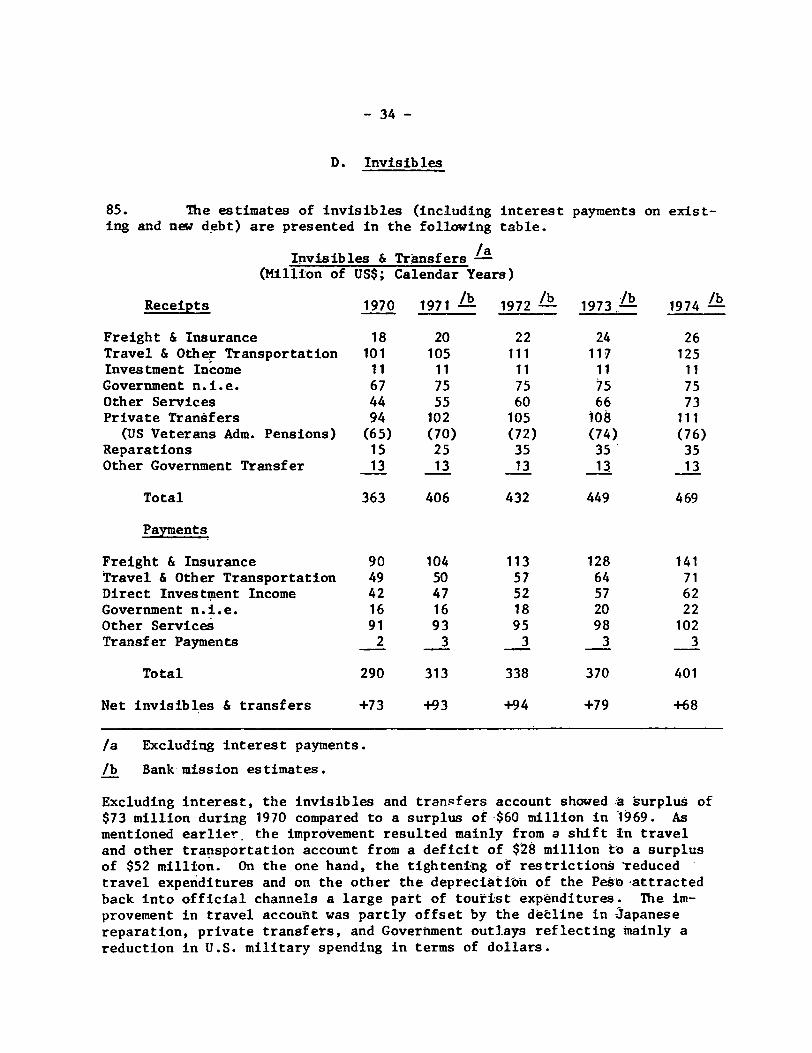
- 34 -
D. Invisibles
85. The estimates of invisibles (including interest payments on exist-ing and new debt) are presented in the following table.
Invisibles & Transfers /a(Million of US$; Calendar Years)
Receipts 1970 1971 --- 1972 Lb 1973--- 1974 -
Freight & Insurance 18 20 22 24 26Travel & Other Transportation 101 105 111 117 125Investment Income 11 11 11 11 11Government n.i.e. 67 75 75 75 75Other Services 44 55 60 66 73Private Transfers 94 102 105 108 111
(US Veterans Adm. Pensions) (65) (70) (72) (74) (76)Reparations 15 25 35 35 35Other Government Transfer 13 13 13 13 13
Total 363 406 432 449 469
Payments
Freight & Insurance 90 104 113 128 141Travel & Other Transportation 49 50 57 64 71Direct Investment Income 42 47 52 57 62Government n.i.e. 16 16 18 20 22Other Services 91 93 95 98 102Transfer Payments 2 3 3 3 3
Total 290 313 338 370 401
Net invisibles & transfers +73 +93 +94 +79 +68
/a Excluding interest payments.
/b Bank mission estimates.
Excluding interest, the invisibles and transfers account showed ra surplus of$73 million during 1970 compared to a surplus of $60 million in 1969. Asmentioned earlier. the improvement resulted mainly from a shift in traveland other transportation account from a deficit of $28 million to a surplusof $52 million. On the one hand, the tightening of restrictions 'reducedtravel expenditures and on the other the depreciation of the Peso -attractedback into official channels a large part of tourist expenditures. The im-provement in travel account was partly offset by the decline in Japanesereparation, private transfers, and Government outlays reflecting mainly areduction in U.S. military spending in terms of dollars.

- 35 -
86. The projections indicate that the net invisibles balance wouldimprove further to $94 million by 1972 and then decline in the next two yearsto stand at $68 million in 1974. The improvement would come mainly fromlarger reparations, while the reduction in surplus in the final years of thePlan reflects the assumption that travel expenditure would have to be in-creased at least to the 1968 level.
87. It may be mentioned that the above projections are considerablymore optimistic than contained in the last mission report. On a cumulativebasis, net invisibles (exclusive of interest payments) are expected, accord-ing to latest projections, to contribute $334 million to the balance ofpayments, nearly $200 million more than in the previous estimate. The shiftis based mainly on net income from the travel account.
E. Debt Service
88. The estimates of debt service presented in the Summary Table(para 69) indicate that debt service payments will come down from $503 mil-lion in 1971 to $371 million in 1974. However, as pointed out earlier,these estimates do not make allowances for any amortization payments on newdebt which may become due during the next four years. Assuming that theaverage maturity of the new debt is eight years, the substantial additionaldebt service burden is indicated for 1973-74. According to a rough estimates,this will raise the total amount of debt service for 1974 to $564 million,indicating a debt ratio of 30 percent to gross foreign exchange earnings.Thus it is clear that unless the Philippines is able to obtain long-termmore liberal assistance, particularly in the form of long grace periods,the ratio of debt service will remain high for several years.
89. The need for effective management of the external debt has recent-ly received legislative recognition with the incorporation in Republic ActNo. 6142 of a debt limitation clause. This stipulates that in contractingexternal debt the Government should ensure that the resulting debt serviceon both public and private debt should not exceed 20 percent of the averageof the foreign exchange receipts for the three years preceding the year inwhich the debt is incurred. The foreign exchange receipts are defined,however, to include gross capital inflows and therefore the ceiling of 20percent corresponds to a much higher ceiling (about 29 percent) 1/ in termsof our calculations. Moreover, the legal requirements are in terms of fiscalyears and, therefore, not directly comparable with calendar year data.
1/ Based on the relationship of exports of goods and services to grosscapital inflow during 1972-74.

- 36 -
90. The debt service requirements for 1971 on existing debt-are, how-ever, so high that in order for the Philippines to accommodate fhe requiredcapital inflow of $503 million, the terms would have to be such that thereis little or no addition to debt burden during FY 1972. This V61d implygrace periods of at least one year even on private debt and possibly a cap-italization of interest. In addition, it may be desirable to k&duce theburden by not building up international reserves during 1971. 16 terms ofthe legislation, more room for new debt service is available fi. FY 1973 and,therefore, financing the gap in 1972 and beyond should present 1es diffi-culty. The Mission's view is that while in the next one or tWo years, thedebt limitation ciause in Republic Act 6142 may limit the ft-iility ofGovernment policies in financing the gap, consistent with an adbquate develop-ment effort, for the longer run the overall debt ceiling provid8d in the lawwould prove to be fairly liberal and might help in preventing & tecutenceof a debt crisis.
F. Financing Capital Requitements
91. Ad discussed in the previous sectioh, the financhig bt the gapwould, relatively speaking, present the most chalinge 1h 1971. This is notbecause of the size of the gap ($503 million) As such. in 10 I'Atbss avail-ment already ecdd $520 millii6h 6ven etluding debt bott?attd and paidwithin the yekr. Rather, the need for reducing debt of short d 'tiedlium-term matuity,geherally and the *Yifstence of the debt limitatir6h tbue spe-cifically, require that the terifi of assistafce be su-h that th- problemis just not carried fo?ward to the hext yeC 16r twon.
92. The donciusion wai teached earlier (Chaptet , Sett-b C) that ifthe Philippines is to make a majb dent in its -debt ptbbieh -hi the nearfuture, it n&dA quick disbursing more liberal assistance, "s-tially -inthe form of lbhg grace periods. Obviously, this type of assits,@he cancome mainly ifrm official sources. The ReVisled drntfductfre ftgtam im-plies a drastic increase in absbrptioh of long-tetm 'iCternal tpltal 1?from $40 million in FY 1970 to $145 million in PY 974. U_'fbtuWAtely, theambuht of c6mmitted but not yet disbursed, long-term pblic asfiatakee at$118 million at the end of 1970 was hot too large. Long-term lbts frombilateral tobifces for financing tomodity imports into Philippia rdtfting1971 and 1972 would help greatly to Alleviate the balance of pVYMWntbptessures.
93. In 19711, the Philippines is entitled to draw $35 milish out o'fthe $45 millioh atcokded by MF under the new Standby Agreement-, Vhich wasconcluded in March 1971. After makihg repurchases of '$14 millibrr, net
1/ These figures include Japanese reparation of '$15 million -Ahtd$28 mil-lion respectively, which are excluded from gross capitAl iltew havingbeen treated as part of transfet payments.

- 37 -
availability from IMF would be $21 million. A further allocation of $16.6million of Special Drawing Rights has already been availed of. These trans-actions would also help to bridge the gap in foreign exchange requirements.
94. In the long run, however, a sharp increase in official assistanceto the Philippines, hopefully on easier terms, must be pre-conditioned byincreased absorptive capacity of the public sector and a sustained increasein availability of local currency funds for development. The success inimproving project preparation and increasing government revenue would notonly help raise the level of public investment but might also make a signif-icant contribution to resolving the balance of payments problem in the nextfew years.


STATISTICAL APPENDIX
Title Table No.
Population and Employment
Population Projections, 1965-1985 1.1Labor Force, Employment, Underemployment and
Unemploymen), May 1956-1969 1.2Employment by Industry during 1967 and 1974 1.3Sectoral Growth, Investment and Employment Targets 1.4The Structure of Unemployment, May 1969 1.5
National Accounts
National Income and GNP, CY1967-CY1971 (At current prices) 2.1GNP by Expenditure Shares, C1967-CY1971 (At constant
prices) 2.2Total Investments FY 1960-FY 1970 2.3
Balance of Payments
Balance of Payments of the Philippines, 1960-1970 3.1Gold and Foreign Exchange Reserves and Foreign Exchange
Liabilities of the Central Bank and Commercial Banks,1960-1970 3.2
Value of Exports, 1960-1970 3.3Export Projections, 1971-1974 3.4Volume and Unit Values of Principal Exports, 1960-1970 3.5Imports by Commodity Group, 1963-1970 3.6Imports Classified by Use of Goods, 1960-1970 3.7Origin and Distribution of Foreign Trade 3.8Indices of Quantity, Prices, and Terms of Trade, 1960-1970 3.9Average Level of Philippine Tariff, 1961-1970 3.10
External Debt
External Public Debt 4.1Service Payments on External Public Debt 4.2Foreign Debts of the Philippines, Br Maturities, 1963-1970 4.3Foreign Debts of the Philippines, 1963-1970 4.4Amortization of Foreign Debts Oatatanding December 31, 1970 4.5Changes in Central Bank Foreign Credit Liabilities during
1970 for Periods Indicated 4.6Philippine External Debt - Maturity and Amortization As
of December 31, 1970 4.7Philippine External Debt - Repayments During 1970 4.8

STATISTICAL APPENDIX ,(Continued)
Itle Table No.
Public Pinance
Conåolidated Fiscal Operations 5.1National Government Revénue 5.2|Nationa1 Government Expenditure 5.3Annuait 'Expenditures on Infrastruoturve Jy ¥ap -Sectora
Rpjed Infrastructurne JPrgram, FY 19,71-tpy A.95.hysical Accomplishmente of Infraiortrpirse 9Engesients 5.6Reenue and Expendiýtures of lpc ukth l,t&es 07y mqnckqg 54Suitstanding Internal Public 0eb 5.8iHolders of G.mrmenit Securitit 95.'9|Sourities Issued by National äoyerimet and G;ernment
Corporations f5Ao-Eolders of Different Types of Governm t ;gpoytritie 5,.1I
one andcredit.
3actors MIßepting Koney Suppn -9i9@%qpu._e of Savinga .and Time :D.peft, A9454192170fNet Momestic Credits of the 'Comecja~, k
1965-1970 -6.Lans ,and Investments -ustkdfing of nancha
Insati-tu,tions,,, k-967-197706,Composition -of :Credit Gatstannä 9 ihe ?Prtyate ecto,
1961-1970 A65Loans and Inveatment- of the iGpyiqrgmen 42¥rzip. nuance
System and Spcial Secpruly ý ptpIke, 99796ýStructre of Interest Rates ,on gayviångs caxd fmp posits
,,f Banks and (Other ;Financi. gsilikQ , 9 0 .
,Actual Broductipn gor 1968, 1949 1a - #9j/»,, ~ I Pyacal. Ta-getp of the ,Agricultural P 7 419t49i ¿7l
,Aigrage :Growth -Rates of %M.ajqr i :oLgrij. IP duc0s 2yLoans Grantegd and · N-tstndimg 4o ,Agriculture y F9nanckg1
Institutions., 1965 -197 17?3
ia e rng and niiiming
-Net _aVM:ue tAdded in SManufacturig bby T-pe ,pf i o c6,.962-1970
;VaIu Added Jn _cning pand pPerce$gs gMpit4on,1964-1970 A82

STATISTICAL APPENDIX (Continued)
Title Table No.
ManOfacturing and Mining (contd.)
Mining Production, 1966-1970 8.3Indices of the Physical Volume of Manufacturing
Production, 1962-1970 8.4Capacity Utilization in Selected Manufacturing
Industries, 1966 to 1970 8.5Indices of Employment in Manufacturing and Mining,
1962-1970 8.6Actual and Projected Value Added in Manufacturing,
1968 and 1974 8.7Estimated Import Dependency of Manufacturing Supplies,
1963-1968 8.8Investment Requirements of Projects Approved by the
Board of Investments from July 1, 1968 to December 31,1969 8.9
Fourth Investment Priorities Plan of the Board ofInvestments - Investment Requirements, Value of Output,and Employment 8.10
Financing of Manufacturing Industry (Source of financeand working capital) 8.11
Paid-in Capital of Newly Registered Business OrganizationsClassified by Nationality and Kind of Business,1966-1970 8.12
Comparison of Estimated Prices of Selected IndustrialProducts in the Philippines and the United States, 1970 8.13
Average Effective Rates of Protection by Sector andManufacturing Branches, 1965 8.14
Average Effective Rates of Protection for Selected ProjectsProposed by Board of Investments 8.15
Prices and Wages
Price Indices, 1962-1970 9.1Wholesale Price Indices, 1957-1970 9.2Wage Indices, 1961-1970 9.3Index of Average Monthly Earnings of Salaried Employees
and Wage Earners in Selected Non-Agricultural Industriesin the Philippines, by Industry Division, 1956-1970 9.4
Education
Department of Education Expenditures 10.1School Enrollment at All Levels of Education 10.2

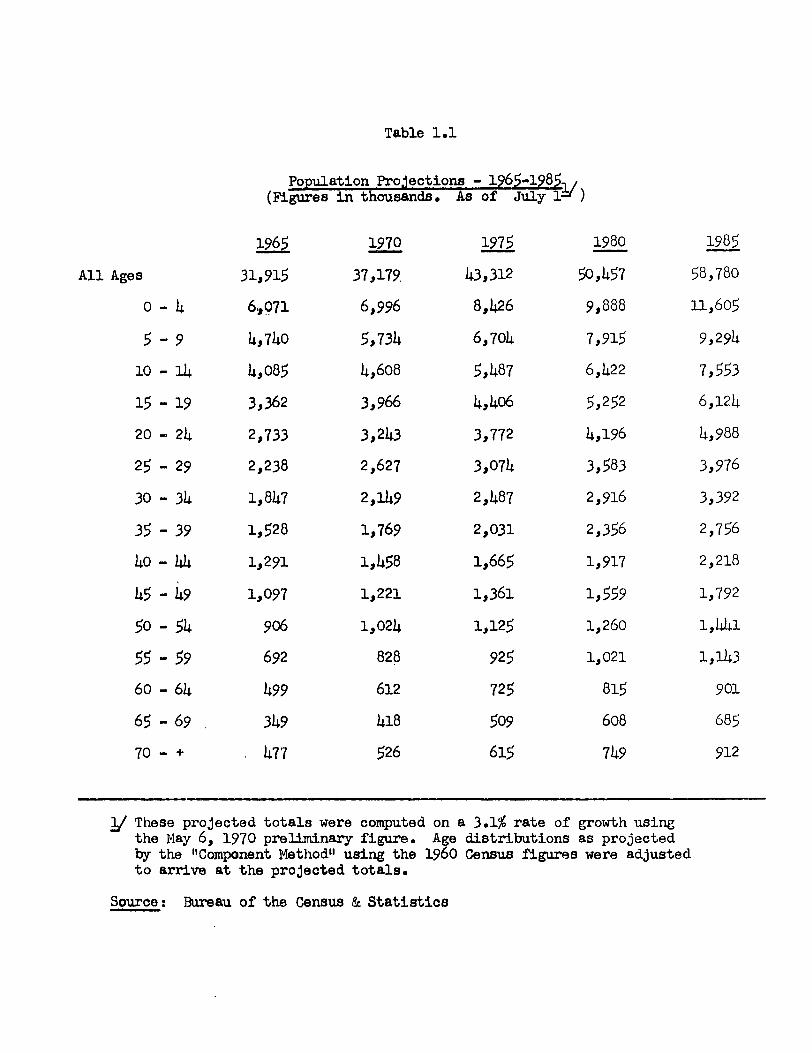
Table 1.1
Population Projections - 1965-1985(Figures in thousands. As of July 1=)
1965 1970 1975 1980 1985
All Ages 31,915 37,179 43,312 50,657 58,780
0 - 4 6.,071 6,996 8,426 9,888 11,605
5 - 9 4,740 5,734 6,7o0 7,915 9,294
10 - 14 4,O85 4,6o8 5,487 6,422 7,553
15 - 19 3,362 3,966 4,406 5,252 6,124
20 - 24 2,733 3,243 3,772 4,196 4,988
25 - 29 2,238 2,627 3,074 3,583 3,976
30 - 34 1,847 2,149 2,487 2,916 3,392
35 - 39 1,528 1,769 2,031 2,356 2,756
40 - k 1,291 1,458 1,665 1,917 2,218
45 - 49 1,097 1,221 1,361 1,559 1,792
50 - 5k 906 1,024 1,125 1,260 1,41
55 - 59 692 828 925 1,021 1,143
60 - 64 499 612 725 815 901
65 - 69 349 418 509 608 685
70 - + 477 526 615 749 912
%/ These projected totals were computed on a 3.1% rate of growth usingthe May 6, 1970 preliminary figure. Age distributions as projectedby the "Component Method" using the 1960 Census figures were adjustedto arrive at the projected totals.
Source: Bureau of the Census & Statistics

Table 1.2
Labor Force Eloynt,. Underempalopnt and UnemployntMay 1956-1969
(In thousands
Underemployed UnenployedPercent Percent
Labor / of Lkor of Laboryear Frce ployed Total Forc Total Force
1956 9,#497 8,.314 n.a.1 . ,182 12.5
1957 8,922 8,149 n.a. n. 773, 8.7
1958 9,659 8,782 709 7.3 878 9.1
1959 9,575 8,836 602 6,3 739 7.7
196Q - - -
1961 1,277 9,395 629 6. 883 8.6
1962 (Apr1) 10,692 9,680 658 6.2 1,012 9.5
1963 11,187 10,315 869 7.8 871 7.8
1944 11,296 10,572 6h7 5k7 724 6.4
1965 11,491 10,.543, 815 T4 947 8.2
1966 11,886, 11,032 673 5.7 8% 7.2
1967t 13.4274. 12,189 905 6.8 1,089ý 8.2
1968 13,534 12,481 1,087 81 >053, 7.8
1969 12,06 1,235 657 5.5 .812 6.7
Fully and partial,y,
2/ Wantng additional work and worked less thani 30, hours, per week.
n,., a.: Not available.
j;rce: BUreau. of Census and Statisties0 .

Table 1.3
fploant by Industry during 1967 ani 1974
Change over the 7 year PercentPlanned rate for mid- period (including 4 years Increase
ployment in October 1967 year 17 of the Development Plan) In EachIn thousands 5 ototal Of total T I thousands Number Sector
1. Agriculture, forestzy,hunting, fishing, etc. 6,330 58.3 55.0 7,838 -3.3 +1,508 23.8
2. MiniLg and quarrying 45 0.4 0.5 72 +0.1 + 27 60.0
3. Construction 276 2.5 3.0 428 +0.5 + 152 55.1
4. Manuf acl z 1,223 11.3 12.5 1,781 +1.2 + 558 45.6
5. Bectricity, gas, waterand samLtazy services 3D 0.3 0.5 71 +0.2 + 41 136.7
6. Comerce 1,078 9.9 10.4 1,482 +0.5 + 40G 37.5
7. Transport, storageand conmicatiom 375 3.4 3.8 542 +0.4 + 167 44.5
6. Government, comunity, businessand recreational services 769 7.1 7.5 1,069 +0.4 + 300 39.0
9. Damestic and personal servicesand industry not rqported 741 6.8 6.8 969 - + 228 30.8
T 0 TAL 10,867 100.0 100.0 14,250 381
SOURCE: Four-Year Development Plan, 1970-74, Table VI-1-2.

ТаЬ� в � c �i
.3ëcioral Г� wirth . Iпvёstmënt ai � �� -"'1� °" � nt. � " . `" ё ta9ma� ita iт� Ifi111on рввов at 3 7 pa�ic ёs
яnкiиаl -Яв'rëënt Pгivat ё PtiiilicIпс� ёавё. �i п Ii дiёвfii ьёдiL Iii6 ёataa пt .3ëctor" а1__ Рётоепt аяеs_.cf,
.(� ox� ,� h �N. 1v � � . Атрия̀t � ёг сёцt A� ou л�t� rc ёat То'ta1 .Ia ёëstm ёnt .Лiëi г.2nv � вtлвat Aiev 1а �� i.t� ]: � i-e'ctFi' гв S:5 �u1t 22;961 -� .00:0 11;1�6l � 100:0 27;4Э5 100:0 100:0Agr � cй� tii тzë б: 25 3.2 2; 096 9.-1 - - 2; 09fi 7:6 42:6�натл� � t � � б: г5 ь: э ) ) ) ) 17.5a; � .t �) з5. з) - _ ) в; � i �i) 29:ь�n� вg ie:5 8:5 ) ) ) ) о.8ott � � i� i � :tsАа� � � � вв nra: п:а. i2;7 бi �55:b - - 12;fFд1 lуб:5)
) 39.1)Pi � 116 Сbаыti цс= �
� о�а 3J го.; 8:i - = 4;4 ь1i � Ёо: о 4,46i, 15. э
�
_. _ _ ,� _, . � _ . ..1/ I пcladiгg i гаt ёг "rёsoй� ' с� .s дёда].opmQnt; t гat5"врап� t а't3:on � р `a яei � q 'të3ëoo � dë$ii яns"; восi;, а1 1л� гastitiëf йгё а 'п"дpгёlit � лaiy engin вёг̀1ig :
2/ 61� . Eonst гoation:
SOURЁEi Faпii�=� ëa`r Dёvë'l орт впt Р1 ап; 1970=74:

T~ 1.5
The ~tu^ ar Un~lEmnt. Nay 1969(in thommds)
Tat al6-7%812
Ihwal U~5-7% 9.2%
2
%ENIG3.5% 140.1% 8.6%
20b 2-0
igfD91
Old Yolmg 01d 1b69 åd Young åd läulng-7-.,7% 14.7% 1.5% 7.0% 6.8% 14,3% 4,8% 1993%,
:123 156 1h9 829 B99
4.9% 7.3% 1.3% 3.0% 3 t 33W 3.5% 5.4%
47 6 85 8 17 F8 60 26 61 18 24 -.98 89 281ý k9 53M m -4 uff V77
Total y~ .. ~ rienced loyed - 324
Motest Young - 10-211 vearsOld - all 0t6r8
Source: Ta~tions of the May 1969.9 BCS Labor Force Survey*


Table 2.1
National Income and Gross National Product, CI 1967 to CY 1971(At current prices)
Value in MLllion Pesos Percent Distribution
1967 1968 1969 1970 1971 1967 1968 1969. 1970 1971
Expenditure on Gross National Product 26024 28837 31737 37549 41981 100.0 100.0 100.0 100.0 100.0
Personal Consmption Expenditures 20318 22019 24202 29207 31303 78.1 76.4 76.2 77.8 74.6General Government Consumption Rkpenctures 2378 2690 3075 3333 4005 9.1 9.3 9.7 8.9 9.5Gross Domestic Capital Formation 5975 6306 6307 8174 8954 23.0 21.9 19.9 21.8 21.3Erports of Goods and Services a003 4484 4372 7259 8221 18.1 15.5 13.8 19.3 19.6Less: Imparts of Goods and Services 5273 5656 5608 8092 9074 (20.3) (19.6) (17.7) (21.6) (21.6)Expenditures on Gross Domestic Product 28101 29843 323B 39881 43409 108.0 lo3.5 101.9 106.2 103.4Net factor income from abroad (298) (384) (304) (457) (175) (1.2) (1.3) (0.9) (1.2) (1.1)Statistical discrepanmy (1770) (622) (307) (1875) (953) (6.8) (2.2) (1.0) (5.0) (2.3)Per Capita GNP (in pesos) 788 838 894 1025 1113Annual Chhnge in GNP (percent) 9.3 10.8 10.0 18.3 11.8
Net Domestic Product at Factor Cost 22006 24433 26714 31219 34606 100.0 100.0 100.0 100.0 100.0
Agriculture, fishery and forestry 7447 8654 9730 11002 12512 33.8 35.4 36.4 35.2 36.2IfinIg and quarr7ing 346 419 533 900 1146 1.6 1.7 2.0 2.9 3.3knaufacturing 3832 4251 4648 5001 5408 17.4 17.4 17.4 16.0 15.6
Construction 832 811 755 901 982 3.8 3.3 2.8 2.9 2.8Transportatlon, storage ani communication 925 995 1071 1265 1371 4,2 4.1 4.0 4.1 4.ocammerce 3281 3467 3615 4560 4940 14.9 14.2 13.6 14.6 14.3
Services 5343 5836 6362 7590 8249 24.3 23.9 23.8 24.3 23.8Per Capita NDP (in pesos) 667 710 752 853 918Annual Change in NDP (percent) 11.6 11.0 9.3 16.8 10.8Net National Product or National Incom 21708 24049 26410 30762 34133 98.6 98.4 98.9 98.5 98.6Indirect Taxes net of subsidies 2016 2148 2332 3017 3322
MDTE: This series revises previous estimates.
1. Figures for 1967-69 are based on The Statistical Reporter, April-June 1970.2. Figures for 1970 are based on the advance estimates of 16 December 1970.3. Figures far 1971 are projections.
OSCAS /1C.03/02/71

Table 2.2
Gross National Product by &xpenditure Sharest CY 1967 to CY 1971(At constant 1967 prices)
Value in Million Pesos Percent Distribution
1967 1968 1969 1970 1971 1967 1( 1969 1970 19
Expenditure on Gross NationalProduct 26024 27635 29359 30657 32541 100.0 100.0 100.0 100.0 100.0
Personal Consumption Expenditures 20318 21851 23630 25122 26092 78.1 79.1 80.5 81.9 80.2General Government Consumption Expenditares 2378 2664 3002 2876 3126 9.1 9.6 10.2 9.4 9.6r-ross Domestic Capital Formation 5975 6171 6040 5856 6177 23.0 22.3 20.6 19.1 19.0&xports of Goods and Services 4703 3989 4052 5300 5661 18.1 14.4 13.8 17.3 17.4Less: Imports of Goods and Services 5273 5620 5461 6356 6967 (20.3) (20.3) (18.6) (gQA7! (21.4)Expenditures on Gross Domestic Prodwct 28101 29055 31263 32798 34089 108.0 105.1 106.5 107.0 104.7Net Factor income from abroad (298) (38L) (296) (359) (364) (1.2) (1.4) (1.0) (1.2) (1.1)Statistical discrepancy (1779) (1039) (1608) (1782) (U184) (6.8) (3.7) (5.5) (5.8) (3.6)Per Capita GNP (in pesos) 788 803 827 838 863.Annual Change in GNP (percent) 9.3 6.2 6.2 4.4 6.1
Net Domestic Product at Factor Cost 22006 23292 24508 25606 26971 100.0 100.0 100.0 100.0 100.0
Agriculture, fishery and forestry 7447 8019 8563 8901 9453 33.8 34.4 34.9 34.8 35.1Mining and quarrying 346 498 478 579 696 1.6 1.8 1.9 2.3 2.6Manfacturi rg 3832 4039 4186 4271 4485 17.4 17.3 17.1 16.7 16.6Construction 832 792 725 735 772 3.8 3.4 3.0 2.9 2.9Transportation, starage and communication 925 967 1007 1065 1108 4.2 4.2 4.1 4.1 4.1Commerce 3281 3410 3544 3674 3810 14.9 14.6 16.5, 14.3 14.1Services 5343 5657 6005 6381 6647 24.3 24.3 24.5 24.9 24.6Net National Prod rt t National Incoe 21708 22911 24212 25247 26607 98.6 98.4 98.8 98.6 98.7Indirect taxes net of subsidies 2016 214D 2290 2318 2418Capital consumption allowance 2300 2584 2857 3092 3516Per Capita NDP (in pesos) 667 677 690 700 715Annual Change in NDP (percent) 11.6 5.8 5.2 4.5 5.3
NOTE: This series revises previous estimates.
1.. Figures for 1967-69 are based on The Statistical Reporter, April-June 1970.2., Figures for 1970 are based on the advance estimates of 16 December 1970.3. Figures for 1971 are projections.
Sourc OSCAS, NEC.

Table 2.3
Total Investments, F1196:11970(In million Pesos, at current pices)
1960 1961 1962 1963 1964 1965 1966 1967 1968 1969 1970
Total Investments 1,754 2,214 2,885 3,424 4,o96 4,542 4,845 5,503 6,141 6,307 7,241
Public Investments 161/ 250 178 255 192 207 182 420 581 596 552
Economic ServicesAgriculture and Natural
Resources 49 21 13 37 15 13 29 25 36 57Transport & Communication 90 112 86 147 119 159 86 234 324 307Commerce and Industry 1 3 5 2 3 2 2 60 60 37Other economic development 24 23 3 6 5 8 9 5 7 6
Others - 9k 71 63 50 25 56 96 154 189
Private Investments 1 5 3,169 3,904 4,335 4,663 &,8 5,560 5,711
1/ Ercludes items included under other services (General Administration, Social Services) but includes capital transfers
and direct lending. Public investments exclude local government investment.
Note: FY60-66 data exclude foreign-financed capital expenditures.
Source: Presidential Economic Staff.

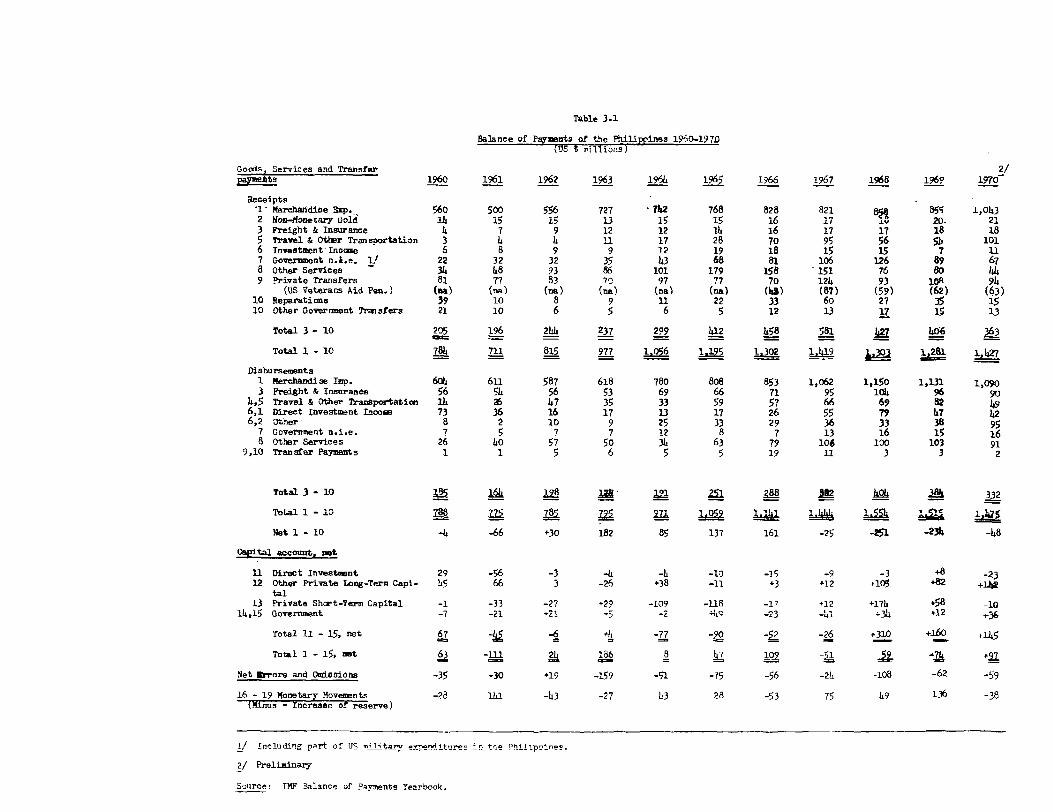
Table 3.1
Balance of Payments of the Philippines 1960-1970(US S millions)
Goods, Services and Transfer 2/tas 1960 1961 1962 1963 1964 1965 1966 1967 1968 1969 1970
Receipts1- Merchandise Erp., 560 500 556 727 742 768 828 821 855 1,032 Non-Monetary Gold 1h 15 15 13 15 15 16 17 IV 20. 213 Freight & Insurance 4 7 9 12 12 1 16 17 17 18 185 Travel & Otber Transportation 3 4 4 11 17 28 70 95 56 5b 1016 Investment'Income 6 8 9 9 12 19 18 15 15 7 117 Government n.A.e. 1/ 22 32 32 35 43 68 81 106 126 89 678 Other Services 34 68 93 86 101 179 158 151 76 80 449 Private Transfers 81 77 83 70 97 77 70 124 93 108 94
(US Veterans kid Pen.) (ma) (na) (rn) (na) (na) (na) (bs) (87) (59) (62) (63)10 Reparations 39 10 8 9 11 22 33 60 27 35 1510 Other Government Transfers 21 10 6 5 6 5 12 13 17 15 13
Total 3 - 10 205 196 246 237 299 412 458 581 6363
Total 1 - 10784 711 815 977 L!Z56 119 132 i2q9 8 1J
Disbursements1 Merchandise Ian. 604 611 587 618 750 808 853 1,062 1,150 1,131 1,0903 Freight & Inurance 56 51 56 53 69 66 71 95 104 96 90
4,5 Travel & Other Transportation T4 26 47 35 33 59 57 66 69 82 46,1 Direct Investment Incom 73 36 16 17 13 17 26 55 79 7 426,2 Other 8 2 10 9 25 33 29 36 33 38 95
7 Government n.i.e. 7 5 7 7 12 8 7 13 16 15 168 Other Services 26 10 57 50 34 63 79 106 100 103 91
9,10 Transfer Payments 1 1 5 6 5 5 19 11 3 3 2
Total 3 -10 _8_ i&M M2§ JA . in1 z 288 M12 404 1& 332
Total 1 -10 2. _ 21r, LU- I_Zz ~1 11 1.444 ia_ws1.7
Net 1 - -6 -66 +30 182 85 137 161 -25 -2-1 -234 -48
Capital account, not
U Direct Investment 29 -56 -3 -4 -4 -10 -1' -9 -3 +8 -2312 Other Private Long-Term Capi- $u5 66 3 -26 +38 -11 +3 +12 +105 +82 +h2
tal13 Private Shart-Term Capital -1 -33 -27 +29 -109 -118 -17 +12 +176 +58 -10
1k,15 Government -7 -21 *21 5 -2 44" -23 -4i +3 +12 -3
Total 11 - 15, net 67 -+k7- -2 -26 +31D + +145
Total 1- 15, not - 186 8 7 9 - +9
Net brrors and Omissions -35 -30 +19 -159 -51 -75 -56 -21 -08 -62
16 - 19 Monetary Movements -28 141 -43 -27 43 28 -53 75 49 136 -38(rinus - Incrose of reserve)
1/ Including pArt of US militav ex'anditure in tie Philipin.e-
2/ Preliminary
Source: IMF Balance of Payments Yearbook.

Table 3.2
Gold' and Foreign Exchange Rtaerves and 7oreign EkchangeLiabilities of the Central Bank and Conmercial Banks, 1960-70
(In Million U.S. Dollars)
Gross Reserves Foreign Exchange Inter-Liablities national etEnd of Period Cent Comm=1. Total Central O . Rarvea/ Reserves
1960' 120.0 76.0 196.0 5.0 4.0 192.0 187.01961 54.0 63`0 117.0 61.0 4.0 113.0 52.01962' 75.0 76.0 151.0 43.0 11.0 140.0 97.01963 109.0 88.0 197.0 10.7 50.0 147.0 136.3196w, 123.3 7L.3- 197.6 29.4 159.1 36.5 9.11965 1 193.0 91.7 284.7, 110.7' 18&.6 96.1 -1J.61966 193.6 120.7 314.3 128.1' 135.5 178.8 50.71967 179.8 146.1. 325.9 234.6 104.4. 222.5 -13.11-968 161.4 152;2 313.6 120.1 118.5 195.1 75.0
1969
jaArXY 144.1 139.2 283.3 125.6 101.2 182.1' 56.5Febrp y 147.3 145.3 292.6 135.1 106.9 165.6 50.5March 174.9 144.9 319.8 172.6 101,.6 218.2 45.6April 153.4 142.2 295.6 166.8 95.9 199.7 32.9May: 132.2 129.8 262.0 164.2 86.9 175.P 10.9June 138.0 144.2 282.2 173.8 105.1 176.3 2.5July 134.1 144.9 279.0 172.8 122;3 156.7 -16.1August 126.5 135.5 262.0 182.8 116.8 145.2 -37-6September 129.2 131.9 261.1 190.8 1n5.6 145.6- -45.2October 130.0 143.7 27347 195'.2 125.9 147.8 -47.4November 125.3: 143.9' 269.2 205.3' 139.0 130.3 -75.0December 120.6 135-5 256.1 196.4 130.2 125.9- -70.5
19.70
January 125.2 131.9 257fr.1 189.0 119.2 137.9 -51.1February 158.8 129.3 288.1 246.3 111.9 176.2 - 70 .1VMaroh 192.0 125.8 317.8 261.9 120.8 197.0 -64.9,April 195.7 117.2 312,.9 281.2 119.4 1935 -8T.7May 202.6 139.5 342.1 279.7 104.0 238.1 -41.6June 196.5 118.8' 315.3 275.-9 104.7 210.6. -65.4July 197.6- 120.3 31-7..9 271.7 116.1! 201.9 -69;9August- 207.9 121.8- 329..T 26,3.6 17-.3s 212.4 -51.2september 199.3 129.4 328..7 253.5 123.0 205.6 -47.9October, 204.8' 128.9 333.7 256.7 117.3 216.2 -40.5November 213.1- 137.2 350.3' 253,6 118.6 231'.6 -22.1December 251.0 12-7.8 378.8 258.3 142.1 236.6 -21.7
1 Inoludes, IM gold tranche position and excludes foreign balances- of the Money OrderFund and the- Fiscal Agency Fund.
2/ Consista- of short-term loans -from U. S. commercial banks, Exim Bank and the FederalRbserve-Bank-of New York.
3- f defined by the Philippite authorities, i.e., grose reserves ol the Central Bankplus-net reserves of commeroial-banke.
/ Revi'sed. as of November 22, 1966 to- include deferred pa'yments liabilities previouslyunreported by commercial bahks,. These revisions supersede those previously madenn end' of 1964.datae
S' EkcLuse- oil loan of. $40 million of MArch 1970; includes ohanges in Central Bank'slong-term liabilities,. for stand-by,puros..
6" Cbmput-edas'defined- in the 1-970 IM' atand--byragreement.
S6urce: Central Bank of the Philippihes.

Table 3.3
Vau fExports, 90-7(F.O.Sn MIIIIo-n of..$
Couppdty im Il_ 1& 2å1 im2 112 jäk Itz im imM.
Coco procta1 168 216Copra , m m ¥W- 9 m 9k »Cocont oil 16 16 31 47 60 68 75 59 77 51 101
Dessicated coco~t 19 14 15 18 20 20 18 17 25 16 20
Copra meal or a~ 5 4 9 1l u 12 17 u 1l 9 17
sugar18 S~ 14 22 160 1Ul 141 in~ 3251 J15818
Kolasseg .5 4 5 8 12 10 6 7 7 7 8
Others 5 5 5 5 u 5 3 2 -- 2 -
Abaca an manufacture + 12 16-e
Abaca rpe 1 3 3 3 6 3 2 3 2 2 2 2
Forest prodwta 10 128 2b9 262 211
Logs 14 t _
L0ber 7 7 5 7 8 8 7 6 9 11 13
Plyrood 6 8 21 16 23 18 18 18 21 19 20
Others 4 5 5 10 12 114 18 18 24 14 14
Minral producta 60 I 66 61 107 d 114 160 2
Copper concentrates n 27 gi r 9 a 4 90Iron ore 9 8 9 n 11 7 6 4 2 2 3
Ctr~ite ore 17 17 9 9 10 11 8 4 3 5 9
Izon conoenrate n.a. n.a. 1 1 2 2 5 7 10 9 10
Otbers 5 4 4 4 4 10 13 14 10 fl 12
Fråts and tab + 1/ 10 k 11 20Pi p e aned) -y 7 9 9 10 -9
Pi ~ e Ca(jioe) i 2 2 3 3 3 1 1 1 1 1
hr 2 2 1 1 2 3 2 3 2 2 12
Tobacco r 9 la 163 1?- 16 12 1 16 17. Is
Rot 7 8 fl 12 16 15 n 11 15 16 14
Cigare and athers - 1 1 i 1 1 1 - 1 1 1
Alother ~orte 22 16 22 6i 82
Total F8por221 - -
Peroentage change over pr~-ios year -10.7 11.2 30.8 2.1 3.5 7.8 -0.9 3.2 -0.2 22
l/ Exports of cocont prodicts are known to be untretated in the period prior to 1963 and arter 1966.
2/ Includes mata and other minor abaca prodacte.
3/ Excluding coconut prodacta.
Differ from exports in the balance of paymnts principally by the amount of non-moetary gold exported.
af Preliminary.
Source: IBRD Mission Estimate, February, 1971.

Table 3.4
Export Projections, 1271-7(In million U. S. dollars)
Actual Projected**(Calendar Year) 1 1972 1973 974
Coconut Products 22 201 217 229 241
Coconut Oil 101 101 106 '113 119Volume (1000 tons) 353 352 375 401 425Price (US $/ton) 286 287 283 282 280
Copra 92 72 i5 78 82Volume (1000 tons) 500 394 412 '433 458Price (US $/ton) 185 184 182 180 179
Dessicated coconut 20 20 21 22 23Copra meal and cake 17 14 15 16 17
Sa 186 211 221 232 23?
Centrifugal sugar 178 199 209 220 220Volume (1000.tons) 1,165' 1,294 1,359 1,427 1,427Price (US $/ton) 153 154 15- 154 154
Molasses and others 8 12 12 12 12
Forest Products 25 28, U1 334
Log 208 228 252 264 276Volume (million,,board feet,) 3,381 3,707 4.,200 2,k00 ,600Price (US $/1000. bf) 62 62, 60 60 60
Luniber 13) 11 11 11 11Plywood 20. 27 30 35 40Others 14, 18 21. 24 27
Lnerals 224 212 2?3 227 278
Copper (metal equivalent) 190 178 186 188 187Volume (thousand metric tons) 179 229 245 2750Price (US. $/ton) 1,060 780 760 760 748
Nickel (metal equivalent) - - -10 50Volume (thousand metric tons) - - - 7 27Price (US.$/ton) - - 2,860 2,860
Others 34 34 37 349 1
All other products 17 3 2718 300
TLIAL EXPORT 1,043 19,105 1,212 1,300 1,4o5
Preliminary.Estimate, IBRDMission February,;, 1971.IBRD Mission, 197f1.

Table 3.5
Volume and Unit Values of Principal Exportst 1960-1970aAverage1955-57 120 1961 1962 196L 1965 1966 1967 1968 1969 1970 /
Volume (thousand metric tons)
Copra 1/ 905 804 627 778 1,033 -910 883 940 775 640 509 500Coconut Oil 94 60 74 148 195 229 236 314 230 256 202 353Dessicated Coconut 51 59 59 63 70 69 68 67 61 62 54 67Copra meal or cake. 98 81 89 1164 168 193 182 239 185 189 177 231Sugar, centrifugal 843 1,090 1,071 961 1,027 1,094 1,017 980 974 964 980 1,165Abaca, unmanufactured 117 101 8k 92 113 104 89 79 67 57 62 55Logs 2/ 758 1,455 1,543 1,760 2,309 2,319 2,963 3,624 3,503 3,517 3,586 3,381Lumbxe7 2/ 60 60 80 54 62 50 53. 48 62 78 93Copper concentrates 78 223 209 207 327 277 279 329 368 412 470 632Iron ore 1,351 1,008 960 1,009 1,333 1,345 838 674 438 234 199 363Chromite ore 705 746 613 364 480 558 592 558 228 174 279 w42Pineapple, canned 26 45 .43 40 32 34 144 4 57 55 109 100Pineapple, juice 3/ 31 12 24 22 28 28 17 14 15 10 12 14Tobacco, raw 10 8 18 23 24 23 18 23 20 43 22 39
Value (US$ per metric ton)
Copra 142 173 141 145 163 172 192 167 167 192 172 185Coconut oil 221 267 216 214 239 261 289 239 252 302 250 286Dessicated coconut 269 322 246 240 262 281 302 269 280 397 298 284Copra meal or cake 49 62 48 63 70 57 65 71 59 59 51 61Sugar, centrifugal 115 122 126 127 142 135 130 135 145 119 152 153Abaca, unmanfaated 291 416 345 267 280 291 271 241 218 197 232 273Logs / 50 58 55 61 70 58 52 55 59 59 60 62Lumber 117 117 87 116 123 133 143 142 133 139 141 140Copper concentrates 154 133 129 140 125 123 168 228 203 216 283 293Iron ore 8 9 9 9 8 8 8 9 8 8 9 8Chromite ore 19 23 28 20 19 19 19 14 19 19 18 20Pineapple, canned 146 156 233 288 219 225 197 200 179 170 156 210Pineapple, juice J/ 99 110 83 97 100 100 160 71 100 100 99 71Tobacco, raw 47 500 444 493 500 428 482 479 455 355 40o 359
1/ Excludes substantial amounts of unrecorded exports prior to 1962. 4/ Per thousand board feet.2 In million board feet. / Per thousand liters./ In rilion liters. aj Preliminary
Source: Statistical Bulletin, Central Bank of the Philippines.

Table 3.6
Imports by Commodity Group, 1963-T0(Value in million US$
Gommodity 1963 1964 1965 1966 1967 1968 1969 1970
Consumer Goods 132.7 159.2 192.6 160.7 204.5 185.2 .172.2 143.6
Live animals chiefly for food 0.2 0.4 0.7 0.1 0.1 0.1 - -Meat and meat preparations 4.0 6.0 5.5 8.6 5.7 9.6 8.9 5.1Dairy products, eggs and honey 18.7 23.9 26.0 28.6 29.4 34.9 37.4 32.14
Fish and fish preparations 12.2 12.7 13.9 15.7 19.5 22.7 18.3 16.6Cereals and cereal preparations 58.9 66.4 94.8 52.8 84.7 40.7 38.1 32.5Fruits and Vegetables 5.5 6.7 7.6 9.9 9.2 10.9 7.6 414Sugar and sugar preparations 0.3 0.3 0.3 9.2 0.2 0.2 0.1 0,3Coffee, Tea, Cocoa, Spices & Manufactures
Thereof 2.3 3.4 3.6 3.3 4.0 4.5 3.3 2.5Feeding stuffs for animals 2.3 2.6 2.6 3.1 5.2 7.2 7.2 8.1
Miscellaneous food preparations 0.2 0.2 0.3 0.5 2.0 1.9 3.4 1.8
Beverages 0.8 0.9 1.4 1.1 1.5 1.6 1. 0.8
Tobacco 1.3 0.7 1.0 2.8 4.5 7.1 9.8 7.8Prefabricated bldg., sanitary plumbing,
heating and lighting fixtures andfittings 2.1 2.0 1. 1.5 2.3 2.1 1.7 1.4
Furniture and fixtures 0.2 0.3 0.1 0.2 0.3 1.1 0.3 0.3Travel goods, Handbags, similar articles - - - - - - - -Clothing 2.1 3.9 2.6 2.5 1.0 0.9 0.3 0.2Footwear 0.1 0.1 0.1 0.1 - - 0.1 -Prof. Scientific and controlling
instruments 6.0 7.4 7.7 7.6 9.4 11.9 12.0 13.2Misc. Manufactured articles 8.3 9.9 8.7 10.9 13.2 15.7 16.1 12.0Returned goods and sp. transactions 7.2 11.4 14.3 11.2 12.3 12.1 5.9 4.5
Capital Goods 209.0 274.3 275.8 297.4 406.8 443.8 444.4 401.0
Machinery and parts, other than electric 113.6 140.0 141.3 151.3 229.0 238.5 258.5 235.2Electric mach. apparatus and appliances 28.7 42.2 47.5 36.0 47.1 60.6 60.2 59.2Transport equipment 66.7 92.0 86.9 109.9 130.3 143.9 124.9 106.1Live animals, not for food 0.2 0.1 0.1 0.2 0.4 0.8 0.8 0.5
Intermediates 276.1 346.8 339.9 394.8 450.5 520.7 5114.7 545.6
Hides, skins and fur skins, undressed 0.1 0.5 0.4 0.6 0.7 0.7 0.6 0.6Oil seeds, oil nuts and oil kernels 0.4 0.6 0.9 0.6 0.2 1.8 - -Crude rubber incl. synthetic and reclaimed 5.1 6.3 4.6 5.7 4.5 4.0 3.7 347Wood, Lumber and Cork 0.4 0.7 0.7 0.6 0.5 0.4 0.2 0.2Pulp and waste paper 3.8 3.0 2.0 3.1 14.14 4.6 4. 7.5Textile fibers, not mftd. into thread or yarn 25.6 23.2 21.7 34.9 29.1 49.5 41.8 10.2Crude fertilizer, minerals except coal and
precious stones 2.0 2.8 3.6 3.2 4.6 5.3 5.1 5.5Metallic ferrous ores and metal scrap 0.1 0.2 0.5 0.4 0.1 0.3 1.7 0.1Animal and vegetable crude materials, inedible 0.6 4.0 0.9 1.6 1.1 1.1 1.3 1.9Mineral fuels, lubricants & related materials 61.8 77.0 76.6 84.1 93.7 105.8 106.7 118.9Chemical elements and compounds 15.1 19.3 20.1 22.3 26.2 33.9 34.5 36.7Mineral tar and crude chemicals from coal,petroleum and natural gas 0.2 0.2 0.2 0.1 0.2 0.1 0.1 0.1
Dyeing, tanning and' coloring materials 6.0 6.3 6.6 8.1 7.6 8.5 7.1 8.8Medicinal and pharmaceutical products 8.0 7.9 6.6 7.6 12.2 15.1 15.5 16.5Essential oils, perfume materials, toilet,
polishing and cleaning preparations 2.7 2.8 3.4 4.3 3.7 4.6 6.0 4.9Fertilizers, manufactured 4.0 11.6 11.9 4.9 10.5 8.6 8.7 9.0Explosives and misc. chemical products 18.9 22.2 24.4 30.7 36.1 38.4 41.7 49.8Animal and vegetable oils (not essential) 3.5 4.8 4.1 4.1 1.2 4.6 5.1 5.5Leather manufactures nec. and dressed furs 0.5 0.7 0.7 0.5 0.5 0.5 0.1 0.3Rubber manufactures 3.5 4.8 5.5 6.4 6.8 7.1 6.6 5.4Wood and cork manufactures 0.3 0.5 0.5 0.5 0.6 0. 0.5 0Paper and paper board manufactures 16.0 23.2 21.9 24.4 27.0 27.3 28.7 29.3Textile yarns, fabrics and made-up articles 20.8 19.0 16.8 30.6 31.8 13.6 33.6 23.9Non-.metallic mineral manufactures 7.5 11.0 9.4 10.9 12.4 11.9 10.6 10.1Gold, silver, platinum gems and jewelry - - - - - 0.1 - -Base metals 53.4 74.2 78.0 84.0 105.9 109.7 116.3 1144.4Manufactures of metals 15.8 20.0 17.9 20.3 25.9 32.5 33.8 21.8
Note: There is a certain extent of overlapping of the three categories of comodities (consumer, capital goods andintermediates). Because of lack of time, no attempt was made to segregate each commodity group (e.g., dairyproducts, transport equipment, etc.) into the three categories.
Source: Foreign Sector, Department of Economic Research, Central Bank of the Philippines.

Tab 3.7
Imarte Classified by Use of Gwods 1961k29kF.0.B. in Aillon US dollars)
Camodity 1960. _ 16 12 199 Y70
Prodacer Goods
Maehiney, eqzint 152 12 94 101 133 151 160 216 234 243 2(1Unprocesed rav =teriala 60 73 101 105 120 110 130 139 163 156 159Semi-rocessed raw mterials 252 287 265 289 367 353 399 502 574 574 595Splieg 56 43 44 29 40 44 56 51 51 49 58
TOTAL 520 515 504 524 660 658 745 908 1,022 1,022 1,016
Conser Gooda
Derables 5 5 5 5 9 8 15 13 12 10 6Nan-durables 79 91 78 89 111 142 93 141 116 99 68
TOTLL 84 86 83 94 120 150 108 154 128 109 74
GRAND TOTAL 604 621 587 618 780 808 853 1,062 1,150 1,131 1,090
Source: Statisftical Bullatin, Central Bank of the Philippineg.

Table 3.8
Origin and Distribution of Foreign Trade
Valu in Millions of U.S. Dollars P e r c e n t a g e sUnited United w
Total staten ja Bur Otkr Total staten S Emrp Other
Exporte
1955-1957 (average) 428 236 73 80 39 100 56 17 18 91960 560 284 132 100 h4 1o0 51 23 18 81961 500 269 125 12 34 100 54 25 i 71962 556 281 137 90 48 100 51 25 16 81963 727 331 198 152 46 100 46 27 21 61964 742 354 188 145 55 100 48 25 20 71965 168 349 218 146 55 100 45 28 19 81966 828 346 264 147 89 100 42 32 18 81967 821 353 279 97 92 100 43 34 12 n1968 858 391 284 87 96 100 46 33 10 n11969 855 360 329 68 97 100 42 39 8 n1 85m 370 335 56 93 100 43 39 7 n
1955-1957 (average) 556 331 56 65 104 100 60 10 n 191960 6a4 255 159 75 115 100 42 26 13 191961 621 289 108 92 122 100 47 18 15 201962 587 253 106 103 125 100 43 18 18 211963 618 254 105 103 156 100 41 17 17 251964 780 312 159 124 185 100 40 20 16 241965 808 274 195 12 215 100 34 24 15 271966 853 285 244 135 189 100 33 29 16 221967 1,062 363 307 160 232 100 31 29 15 221968 1,150 372 327 200 251 100 32 28 17 231969 1,131 320 337 219 255 100 28 30 19 23197å. 918 269- 323 150' 176 -100 29 35 ~16 2Ö
Sources Statistical Bulietin, Central Bank of the Philippinesaf January-October.

Table 3.9
Indices of Qwntity. Prices and Terms of Trades 1960-70(1955 100)
TermsIndex Price Index of
period zre S
1960 965123.2- LU*5 114.1 102.3
1961 99.0 119.2 113.2 105.0 92.6
1962 93.7 130.6 115.4 106.2 92.0
1963 92.1 162.3 123.0 111.8 91.0
1964 113.9 166.3 124.1 110.9 89A6
1965 117.1 170.7 126.2 112.8 89.4
1966 124.6 187.7 128.2 11M.1 89.0
1967 19.5 174.6 129.3 115.9 89.6
1968 162.0 177.2 130.4 121.7 93.3
1969 155.0 171.4 133.6 123.8 92.5
1970W 131.8 187.0 163.2 133.9 82.5
Source: Gentral Bank of the Philippines.
a/ Jamary-September.
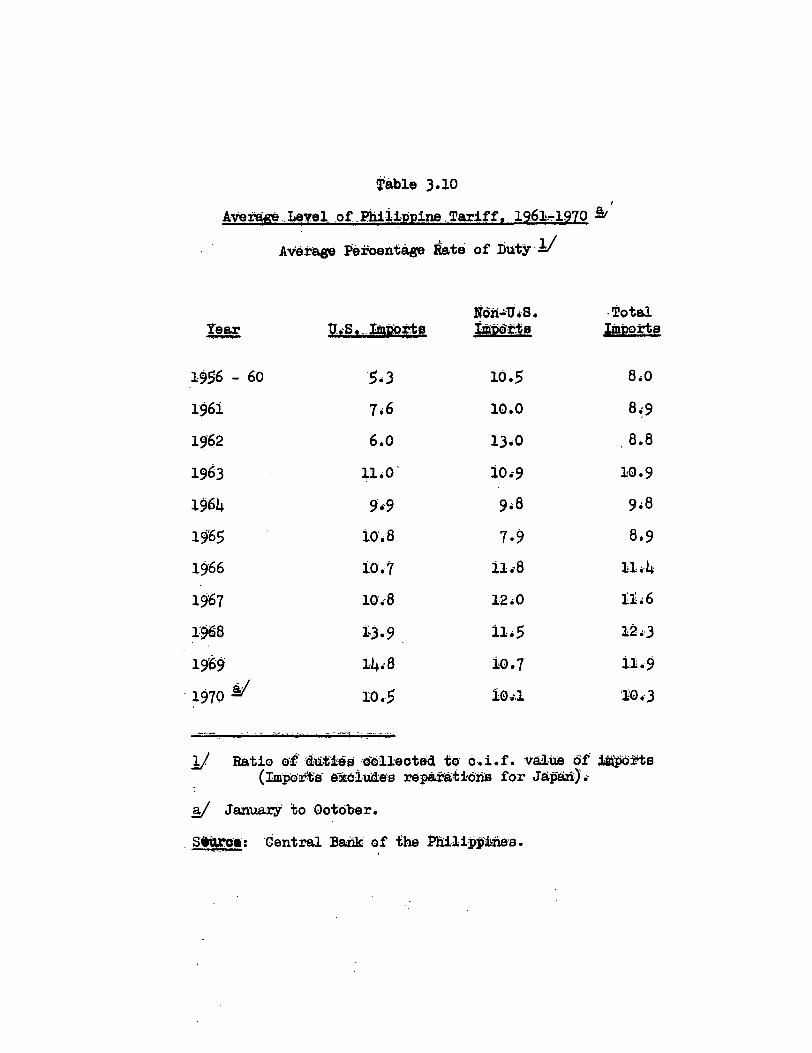
Table 3.10
Avea--Level of Phillipne Tariff, 1961-1970
Average letoentage Rate of Duty-1
Non-8. -'T'otalYear
1556 - 60 .3 16.5 8.0
1961 7i6 10.0 89
1962 6.0 13.0 8.8
1963 1.0 109 10.9
1964 9,9 9.8 gå8
1965 10.8 7.9 869
1966 10.7 11,8 1L4
1967 10,8 12.0 11.6
1968 1.9 11,5 12-3
1969 14.8 10.7 11.9
1970 10.5 104 10.3
1 Ratio of dutiée <611eoted to a.i.f. valie 6f i-fta(Iniporta exlditue's repaiatid" for Jafat)'e
a/ January to Oot6ber.
Si4toa: bentral Bank of the Philipiñes.

Table 4.1
External Public Debt Outstanding as of December 31, 19701
Debt Repayable in Foreign Currency
(In thousands of U.S. dollars)
Debt OutstandingDecember 31, 1970
Disbursed Includingonly undisbursed
TOTAL EXTERNAL PUBLIC DEBT 2/ 6,21,506 754,589
Privately held debt S13,479 320,906
Publicly issued bonds 10,813 10,813Suppliers 52,274 52,917Australia 869 869Belgium 833 833Canada 2,498 2,498France 1,362 1,362Germany (Fed. Rep. of) 676 676Japan 16,722 16,865United States 29,315 29,815
Financial institutions 250,392 257,176Germany (Fed. Rep. of) 5,481 6,421Italy 1,600 1,600Netherlands 2,919 8,107Sweden 546 546Switzerland 9,283 9,283United Kingdom 13,000 13,000United States 3/ 217,563 218,219
Loans from international organizations 122,859 197,921
ADB 2,500 4,992IBRD 120,359 192,929
Loans from governments 185,168 235,761
Canada 7,135 7,135Germany (Fed. Rep. of) 10,929 10,929Japan 1 16,765 28,008United States 150,338 189,690
1/ Debt with an original or extended maturity of over one year.2/ Does not include private debts guaranteed by the Development Bank of the
Philippines and the Philippine National Bank amounting to approximately$600 million.
3/ An amount of $200.66 million represents reorganized debt of previouslyshort-term maturity.
Source: External Debt Section, IBRD. March 22, 1971
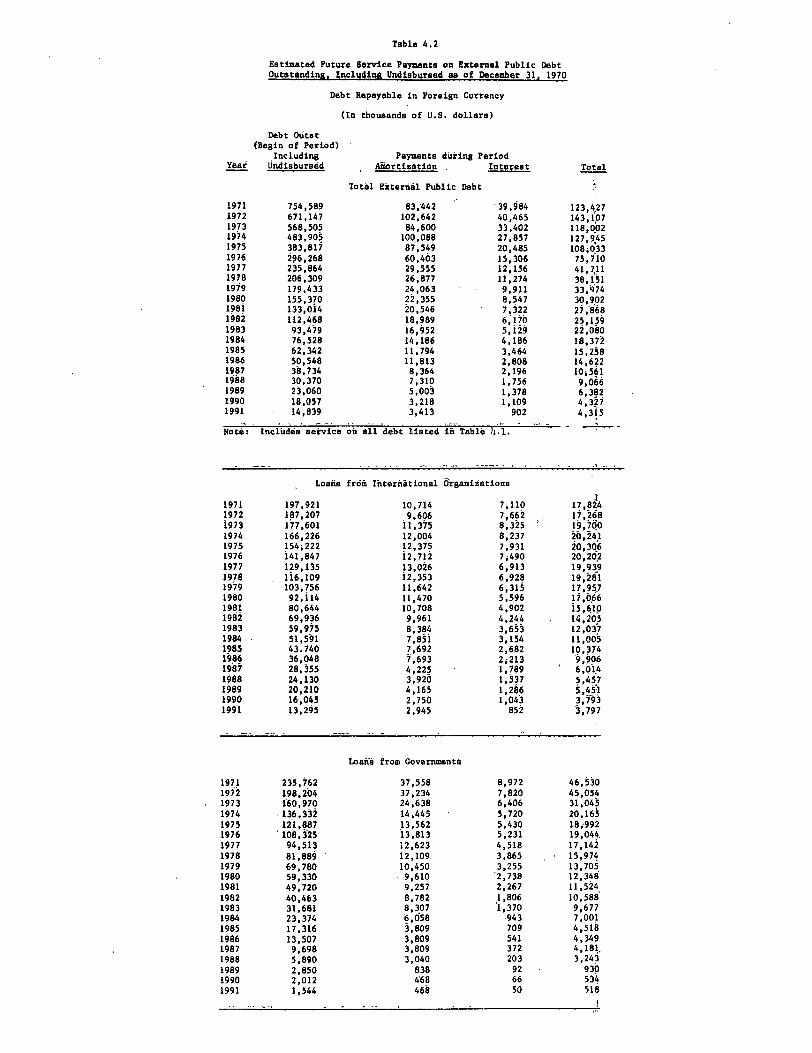
ТвЫ в 4.2
Eetlmeted Fи t игв 8esvlce Раут еп [ в оп Еа Сегпвl РиЫ 1 с DвЬ [ ,Outetaadln я, I псl идl ая Uпдl вЪигаед ав of Decamber 31, 1970
Dвbt Iiepeqa Ы e 1 п Forelg п Сиггепсу
(In thoueande of U.9. dollare)
Deb[ Oйtet(Beg1n of Perlod) '
Including Рвут еа [ е d �mтing Регl одУевг (1пдl вЬитвдд , Amortl тatlon . int вraat Tote1
То С81 Еа t вгвдl РиЫ 1 с DebC
1971 754,589 83,'442 Э9,984 123,4271972 671,147 102,642 40,465 143,1,07197 Э 568,305 84,600 ЭЭ,402 118, ОП21974 48 Э,905 100,088 27,857 127,9 �451975 Э83,817 8),549 20,485 108;0331976 296,268 60,4U3 15, Э06 75,7101977 2Э5,864 29,555 12,156 41,7,111978 206,309 26,877 11,274 Э8,1511979 179,4 Э3 24,06 Э 4,911 ЭЗ, Ч741980 155, Э70 22,355 8,547 30,902
� 1981 1ЭЭ,014 20,546 ' 7,322 �27,86 В1982 112,46 В 18,989 6,170 25,1591983 9Э,479 16,952 5,129 22,0801984 76,528 14,186 4,186 18,3721985 62,342 11,794 3,464 15;2381986 50,548 11,813 2,80 В 14,622
. 19В7 Э9,7 Э4 8, Эб4 2,196 L0;5611998 Э0, Э70 7, Э10 1,756 9,0661989 23,060 5,00 Э 1,378 Ь, ЭВ21990 18,057 Э,218 1,109 4, Э271991 � 14,8 Э9 3,41 Э 902 4,315
Not в : Incl йdëe ввтvl св оп а11 debt 1l веед 1а ТаЫ в .1. ' �
, Loane from I пternatloaal Organliatlone ,
21971 197,921 10,714 7;110 17,8241972 187,207 9,606 7,662 17,2681979 177,601 11, Э75 8,325 ' 19,7001974 166,226 12,004 8,237 20,2411975 154;222 12,375 7,931 20,3061976 141,847 12,712 7;490 20,2U21977 129,1 Э5 13,026 6;91 Э 19,9391978 116,109 12,353 6,928 19,2811979 103,756 11,642 6,315 17,9571980 92,114 11,470 5,596 17,0661981 80,644 10,708 4,902 15,6101982 69,936 9,961 4,244 14,2051983 59,975 8,384 Э,653 12,0 Э71984 � 51,591 7,851 Э,154 11,0051985 43.740 7,692 2,682 10, Э741986 36,048 7,69 Э 2;219 9,9061997 28,355 4,225 � 1,789 ' 6,0141988 2б,130 3,920 1,5 Э7 5,4571989 20,210 4,165 1,286 5,45r11990 16,045 2,750 1,04 Э Э.79 Э1991 13,295 2,945 852 Э,797
Loa пs from Gov вrnmente
1971 235,762 Э7,558 8,972 46,5 Э01972 196,204 37,2 Э4 7.820 45.054
. 1973 160,970 24,638 6,406 Э1,0451974 .136,332 14,445 5,720 20,1651975 121,887 13,562 5,430 18;9921976 108,925 �1Э,813 5,231 19,044.1977 94,519 12,623 4,518 17,1421978 81,889 ' 12,109 3,865 , � 15,9741979 69,780 10,450 3,255 13,7051980 59,330 � 9,610 �2,7 Э8 12,3481981 49,720 9,257 2,267 11,5241982 40,463 В,762 1,806 10,5881983 31,681 8, Э07 �1,370 9,6771986 23,374 6,058 � 94 Э 7,0011985 17,316 Э, В09 709 4.5181986 13,507 3,809 541 4, Э491987 9,698 3,809 Э72 4,181,1988 5,890 3,040 203 Э,2431989 2,850 838 92 � 9301990 2,012 468 бб 5Эб1991 1,544 468 50 519
с
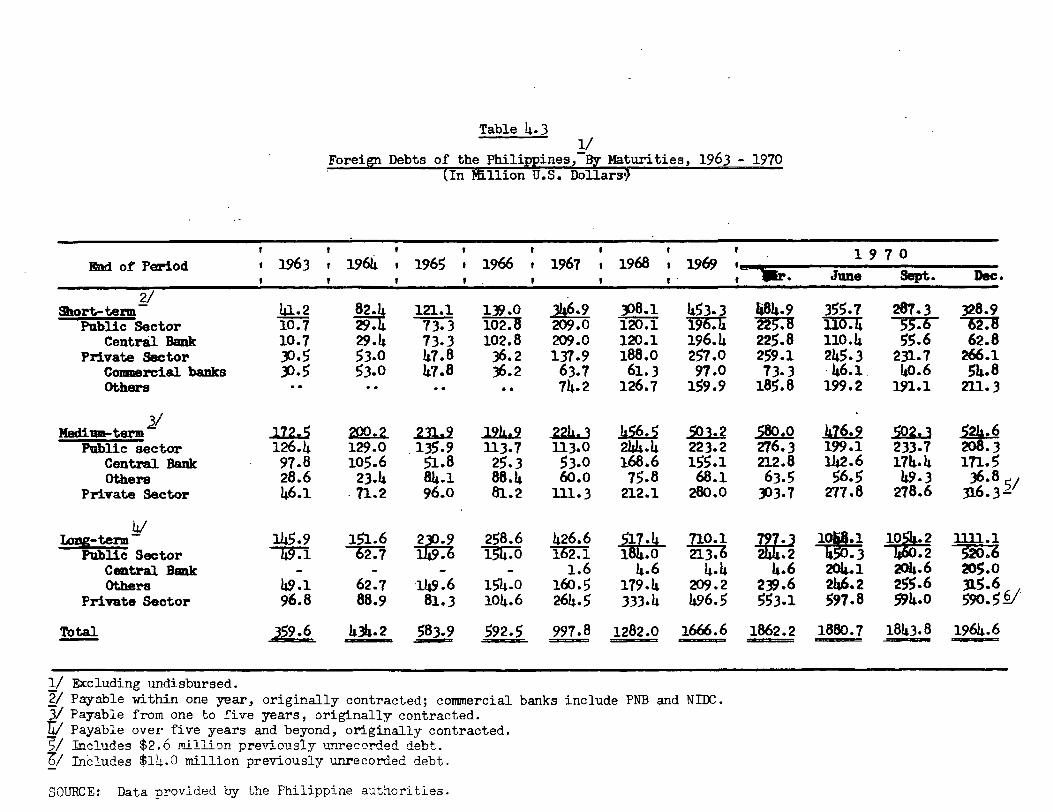
Table 4.3V
'Foreign Debts of the Philippines, BY Maturities, 1963 1970(In Willion U.S. Dollars-
Had of Period 1963 1964 1965 1966 1967 1968 1969 1 9 7 0J-- Sept. Dec.
Short-term- 41.2 82.4 in.1 139.o 346.9 3o8.1 453-3 484-9 355-7 287.3 328.9Public Sector 10.7 29. 73.3 -102-.5 -0 .O -rF5-.7 -3-r. 4 -grF 2.
Central Bank 10.7 29.4 73.3 102.8 209.0 120.1 196.4 225.8 110.4 55.6 62.8Private Sector 3D.5 53.0 47.8 36.2 137.9 188.0 257.0 259.1 245-3 231.7 266a
Commercial banks 3o.5 53.0 47.8 36.2 63.7 61-3 97.0 73-3 46.1, 40.6 54.8Others 74.2 126.7 159.9 185.8 199.2 191.1 211.3
Nedi=m-tem 172, 2DO.2 231, 124J 22h, 456. 503-2 580-0 476.9Public sector 126.4 129.0 135.9 10-W 524.6
113.7 113-0 244.4 223.2 276-3 199.1 233.7 208.3Central Bank 97.8 105.6 51.8 25-3 53.0 l68.6 155.1 212.8 W.6 174-4 in. 5Others 28.6 23.4 84.1 88.4 6o.o 75.8 68.1 63.5 56.5 49-3 -36 8
Private Sector 46.1 n.2 96.0 81.2 111-3 212.1 280.0 3D3.7 277.8 278.6 316:3 5/
4/jeng-term 145.9 151.6 230.9 258.6 426.6 97.4 710.1 797.3 IM. 1054.2 1111.1
Public Sector 49. -V2 7 -13IT--0 162--l 184-0- 2333 2M. 2 450.3 4W.2 W -Central. Bank - - 1.6 4.6 4.4 4.6 2o4-l 204.6 2o5.oOthers 49.1 62.7 -149.6 154.0 160.5 179-4 209.2 239.6 246.2 255.6 315 6
Private Sector 96.8 88.9 81.3 104.6 264.5 333-4 496.5 553-1 597.8 V4.0 590: 5
Total 359.6 434-2 583.9 592.5 997.8 1282.0 1666.6 1862.2 1880.7 1843.8 1964.6
l/ Excluding undisbursed.Payable within one year, originally contracted; commercial banks include PNB and NIDC.Payable from one to five years, originally contracted.Payable over five years and beyond, originally contracted.Tnr-1 iirl a Q t'? -6 mi I I J 0T) 'p?-PNrj rm Q1 -vrI-n'c--!U-des il4-.O"mi11ion-pr*-----"
eviously lanrecorded debt.
SOURCE: Data provided by the Philippine authorities.
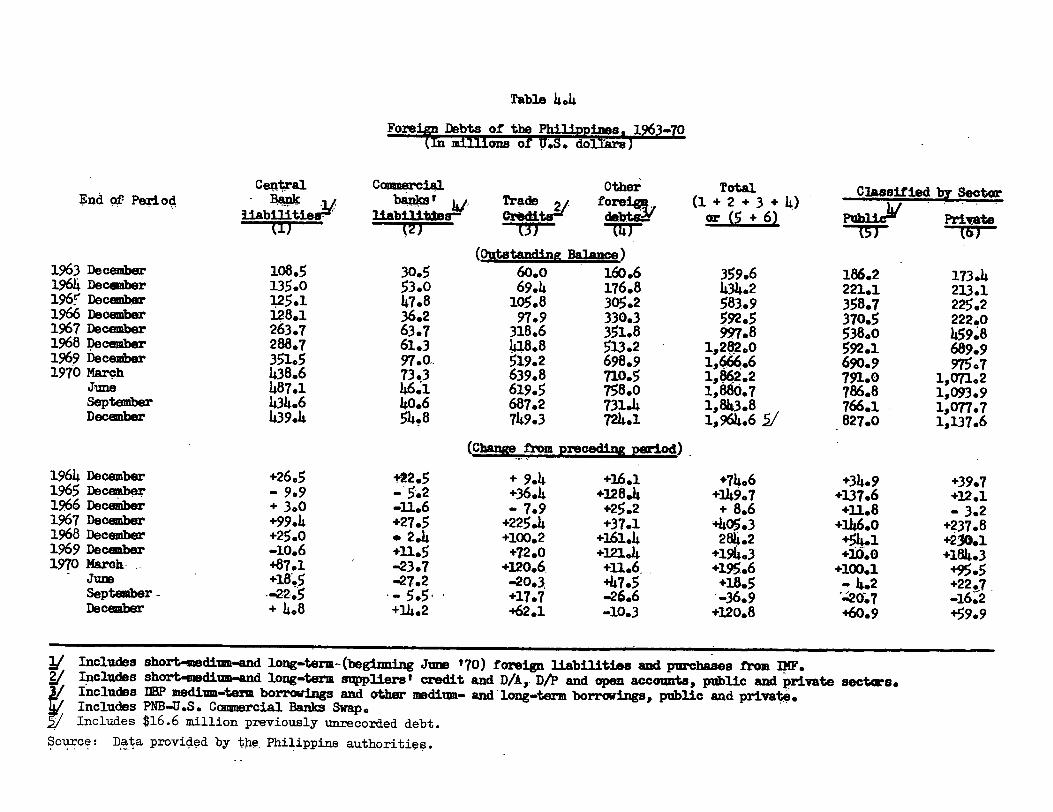
Table 4.4
Foreign Debts of the.piipines, 1963-70(In Millions of U.S. dol]Ars)
Central Commercial Other Total Classif ied by SectorEnd of Period Bank banks' Trade forei, (1 + 2 + 3 + 4)liabilities liabilitles- redits debts& r (5 + 6) Private
(Outatanding Balance)1963 December 108.5 30.5 60.0 160.6 359.6 186.2 173.41964 Decenber 135.0 53.0 69.4 176.8 434.2 221.1 213,1196e December 125.1 47.8 105.8 305.2 583.9 358.7 225.21966 December 128.1 36.2 97.9 330.3 592.5 370.5 222.01967 December 263.7 63.7 318.6 351.8 997.8 538.0 459.81968 December 288.7 61.3 418.8 513.2 1,282.0 592.1 689.91969 December 351.5 97.0. 519.2 698.9 1,666.6 690.9 975.71970 March 438.6 73.3 639.8 710.5 1,862.2 791.0 1,071.2June 487.1 166.1 619.5 758.0 1,880.7 786.8 1,093.9September 434.6 40.6 687.2 731. 4843.8 766.1 1s077.7December 439.4 54.8 749.3 72.1 1,964.6 7. 1,07.
(Change from preceding period)
1964 December +26.5 +22.5 + 9.4 +16.1 +74.6 +34.9 +39.71965 December - 909 -5.2 +36.4 +128.A +149.7 +137.6 +12.11966 December + 3.0 -11.6 - 7.9 +25.2 + 8.6 +1.8 - 3.21967 December +99.4 +27.5 +225.4 +37.1 +405.3 +146.o +237.81968 December +25.0 * 2.4 +100.2 +161.4 284.2 +54.1 +20.11969 December -10.6 +11.5 +72.0 +121.4 +194.3 +16.0 +184.31970 March 487.1 -23.7 +120.6, +U.6, +195.6 +100.1 +95.5June +18.5 -27.2 -20.3 +47.5 +18.5 - 4.2 +22.7September- .-22.5 - 5.5, +17.7 -26.6 *-36.9 .40r.7 -16.2December + 4.8 +14.2 +62.1 -10.3 +120.8 +60.9 +59.9
Includes shortweediun-and long-tera-(beginning June '70) foreign liabilities and purchases from INF.Includes short-medium-and long-term suppliers' credit and D/A, D/I and open accounts, public and private sectas.Includes DBP medium-term borrowings and other medium- and long-term borrovings, public and private.Includes PNB-U.S. Commercial Banks Swap.Includes $16.6 million previously unrecorded debt.
Source: Data provided by the Philippine authorities.

Table 4.5
Amortization of Foreign Debts Outstandiig, December 31, 1970(In Million U.S. Dollars)
BeyondI t e m 1971 1972 17 1978 1980
Short-Term 328.87Public Sector 62.83
Central Bank 62.83
Private Sector 266.0Commercial Banks 5678Trade Credits 193.46Others 17.80
Medium-Term 188.92 152.13 42.82Public Sector 8 0. 27.04 2 .
Central Bank -62.05 59.19 19.05 3.71 27.50Trade Credits 9.55 6.83 6.41 .24 -Others 6.23 4.86 1.58 1.04 .05
Private Sector 11109 81.25 66.21 4 15.27Trade Credits 49.28 38.91 25.80 14.37 1.95Others 61.81 42.34 40.41 28.12 13.32
Long-Term 130.22 127.87 138.56 153.30 108.4 68.08 11790Public Sector 4 53-10 14.18 13.15 92.25Central Bank 10.49 20.51 30.97 55.57 56.86 30.01 .62 - - - -Trade Credits 10.85 6.98 5.62 4.53 1.92 1.73 1.24 .20 .20 .20 2.00Others 25.08 25.61 26.96 17.09 17.65 17.53 17.25 15.74 13.98 12.95 90.25
Private Sector 83280 74-77 75.01 76.11 65.11 li 47 3. 27.97 17.32 25.65Trade Credits 48.82 53.25 54.37 51.80 45.66 40.77 32.02 20.82 14.23 5.31 -Others 34.98 21.52 20.64 24.31 19.45 18.36 16.95 15-83 13-74 12.01 25.65
Total Debts Payable 648.01 280.00 231.81 8 I84.36 108.40 68.08 5 4 30-47
SOURCE: Central Bank of the Philippines.

- Ъ е .б
, Che лgee 1а Ceatral'Hank Forelgn Credlt �L1a Ы 11t1ee Durl лg 197 о� Fb r1 в ад1 t д- - '
М1111 оа II.B. Dоll втв �
Oйt вtdg'ав- оУ� Ja диааг ... . Н'ë � rua,ry Млгоh nr11 Маи Juns
2 L е ш 12 -' б Ао� с. D1вn. � 'дq.- Аос� А� . D1ep. Ао� . D1� . Aog. D1en. А� , � D1en.г
- гоТАь � '. -- У .7 о - � .85 8.2z 2. зб .оо го. � е, -е.оо 9.70 . К� .го, ® � � ® � s в � в ® Ч а ет � � � а �т е
А . Gorelgri сотФвтс l д].' � Hso1[ в' 26� 8�"'�̀ 9� 9' � r � � � � � 0 00 � � б_ оо г� 9. `8 о� � .18� � . го1
1. 9hort-Term 196 � 37 - - � : � ' - _. В5 - 2 � Ь о � 00 9.14 � " .S:1� 8 . � 0 3.86
u.s. 162.9 д -- 3.6 � - .о3 - .86 4о.оо 9.14 - ( В.оо а/ .5о 3.аь(1 �48
ь,'uropean 33� 47� - 3� 68 - . ег - 1.5о - - - - - -
Ja� �adëee' = - - - - - - - - - - - -'� . Ми81 ит - Ре� 7г:б2 - - � .� - 1 6 8 Оо - У� .н. � -9-gg - _ � .ЭS - - � оо - - 11. � .ооJ__ _ .___34
L� игч�роаn 2.'16' _ �з$ .- - - - - - - - - .3 �i
з. г,o ��a-Tezv � -- -- -- - - - - - - - - -o �.s. - - - - - - - - - - - - -
ы. Inti � i моnвtiагу F1�пд" .82' 0 - - - - 18.00 - - - - - - -
СГ. i В R ll . L: � 7� - . � � - - .гг - - - - .22' - -
D'. r н В N У - , � ... � � �о .00 � - � � � , � . -- - - - - -
Ontstdg. -ве of t._. Se ет.. Octo er ovemb г Decembe пь.� � � - ��� -� � � � � � : � --- � . � � .
тотАL '`� . ь Ь� гг io: ' о.оо в�� i.г� � 1о. 67� .гг .1 о 2гг. zг . 11� . ь �
А. b'отеi цп Соштегаl аl Вепkв 32 � `' б.� о' io.2 �о: о 8.21 i. � 1о ь.г2 .1о ггг. гг . 11.у6 � l.80
1. Sliort=Tezm 62.8'3 6_Оо 10.2 30 � 50 _8.21 1.00 1о. 76. г2 6.8 В - 2г5 � q; 11.96 4� 45
и.:,. 1.5 о 2.оо 1о.25 �5о 8.21 - 1C.g4 66.22 а� - 2оо.6ы ', - 4.453 �01
Jlьli гt, р©ап 1L.33 - - - - - - .82 - 22.28 6.96 .,Japan вee $ о .00 4.00 - 30.00 - 1.00 - 10.00' - - - у .оо -
2. PludtdID-Pe1m б� .оо ! = -- - - - - 66.2 г 2z.28 - - .35в
u.s. 4о.оо - - - - - - - бб.2гf - J - - -н.ч�го� ап 24.оо -- - - - - - - - гг.ге - - �35
� . i.ong- Тект 2 оо.66 _ � - - _ _ _ - 200.66 - _ -
гг.s. гоо.бб - - - - - - - - 2оо. ЬЕ� � - -
i5. In1;'1 Monыtary F' ипд ' 10 . ! - � .r0 - - � � � - - - - 2. о
�:. гв нп ! r�'
� 2а - - - � � - - - - - .гг3f: F н В N У - - - - 4 о.0 о - - - - - - -
� невсh едиll пg.
� и�ц оё : Cëntral Bank of the Ph111pp1nee.

Ы е
Рh111 рр1пв � cternal Debt -XвLurlLy епд Amortl ъatlon Еоlидц lе
, t� M1111an
dmount 1971 1972 1$74 1975 Веуопд' I L е т Оиt вt впдl пд 1вt 9ет. 2p �L 3ет . х.сsвт. 2д4 9вт . 1et Евт . . 1вt Ввт. 2 �д 9ет � 1et Sem. 2пд Sem. 1975
ТаЛАL 1 6 2Э7 �7 7уб� 1 2 � � 111 � � 102� 7 1� 1" � 80.9 419."!
А . ShorL-T вan � ,j� 8: Q 75.1 5.5 __ _ __ _ _ _ __ _ _
PuЫ 1o 98.1 5ы�4 _f� .1 _ _ - - _ - -- _ -
Central Ввпk 62. ы 5ы.4 4� 4 - - - - - - - - -Ргц1. Bas. вапк (вивр) э5�3 J - - - - - - - - - - -
� Prlvwte 230 � 8 16� 7 1.1 - - - - - - __ _ _
Supf11 вгв ' Credlt(В/ А . D/Р дг (i � A) 1 э4 � ы J - - - - - - - - - - -Other Биррll егв' Cп dtL 5б.7 - - - - - - - - - - -caen i, овпв 17.8 16.7 1.1 - - - - - - - - -Соттегаl аl Baake ( биар ) 19 � 5 в� - - - - - - - - - - �
В . Мвдl ит -Тект 524.6 101 � 2 87 � 7 71 � 7 � � ц l� . б_ J13, � , � yl ` 22.6 27.1 15.! _
РиЫ 1а го . Э4. Э 4 Э.5 �0.5 40.4 16.1 11. о 2.6 � 2. Э i ы_i 9.5 =
Fою 1 � Сотт '1 HвnksCentLS1 Ввпk 64 �0 20. э 22.2 2.2 11.5 2.2 1.9 1. ы 1.9 - - -Dev. ВвгJс of the Ph11. 12.0 .4 5.1 0.6 3S 0 � 7 О . ы .7 . г - - -
гпь� 1 мопвt вrу twm го7.5 ы.5 11. о 24�о ц .5 1о. о 5.0 - - 1ы.о 9�5 -sиррц вгв' Crodlt 23. о 4. е 4. ы э�k 3�4 3� 2 э� 2 о.1 о.1 - - -5inger 3виing Maoh. -llBP 1. э 0.3 0.3 0.3 0.4 - - - - - - -Marubenl-I1da -
Dept. оТ Соттвю е .5 - 0.1 - 0.1 - 0.1 - 0.1 о .1 -
Prlvate Э16.3 66.9 LL.2 L1.2 о.1 ЭЭ� 7 � гг.z 20.3 9. о ь.г =_ЕкрогЕ Doduotlon 2ы.ь 3.о 3.г э�7 3�е э� 7 3� ы 3.7 э. е - - -sиррll огв' сгвдlt 13 о.3 гб.4 z2.9 2о�ы 1е.1 14. ь 11.2 7.е ь.ь � .ь о.� -савЬ Lовпв 157 �4 э7 � 5 1 ы.2 16.7 18.2 15� 4 17.5 1о.7 9 �9 1 �4 5 �Ч -
с. Lопа- тотт 11. 11.1 61 � I+ 68 � 7 4.5 � 3.s3 Le3 6ы.3 73.2 ыо.1 � ь.� 1 Ь� �? и1. е
РиЫ 1о 20.6 15.9 зо.5 25. � 27.8 70.5 ЭЭ. О 29.6 47 �Ь Э' �.7 � 1� ё.U.S. Agonay for Iat'1
Development эз�4 1.1 1.z о.4 о.5 0� 4 0.5 о. б о.7 о.В о.е гь.4Int'1 Вап1с for ВооопвLгио-
tlon & Dev. 115 �7 J Э� 5 3.6 4.4 4.4 5� 1 5�о 4.2 4� 2 4 �э 4. э '12.'!Export-Import Ввпk ot Wвeh. 1ы .6 1.2 1.2 1.4 1.5 1.4 1.5 1.4 1.S 1.2 1.2 5.1Export-Import Hвt �k of J врап 16.8 - - - - - - 0.7 U.7 0.7 14 � !O.S.-Ph11. Ввпkв 11.7 0.7 0. ы 0.6 0.6 0.6 0.6 0.6 0.6 0.6 0.6 5 �4U.S. Соттодl Су Lовп -
Ph11. Covt. 54.2 5.4 5.5 5.6 5.6 5.6 5.6 о.9 о.9 0.9 о.9 17 � 3Чавt Сеппаг�у - DBP 14. г о.4 о.5 о.3 о.4 о.5 о.7 о. б о. б о.б о.ь е.уSuppliero' Credlt э5�5 3 �4 � 7.5 2 �4 4 �6 1.7 3.9 1.1 3.4 �Ь 1. э '� �Ьп�tP - s дВ 18.5 - - - - - - - - - - -лВв-ВРwс а гдсг 1.4 о.г о.2 о.г о.г о. г о.2 о. г - - - -свпtгаl Ввпк(аоReet �цctured) гоо.� - 1о.о 1о.о 1о.о 15�о г5�о 2о.о э5. о 3о.о 2ь.э 29� 4
Prlvate 590.5 � ; � Э8 �2 Э9.2 Э5.5 Э9. ы Э5.; 4 Э. Ь э2.5 ЭЕ��7 2ы.5 21 .'
U.3. Ago» оу for Int'1 Dov. 5 �4 - - - - - - - - - - -Int'1 Flnanoe Corp.- Рlвгвl ао 7.4 о.3 о.3 о.3 о.3 0.3 0 � Э о� 3 о� э 0 �3 о�э 4 �1,Export-Tmport Ввпk о ! Wввh. 78.6 8.1 8.1 4 �о 4 �1 2. ы г.9 г.8 2.9 г.е z.y 3 г. гsиррц о,го ' credlt эб7.о 25�2 23.ь гы.9 24. э з0� э 24.1 эо.2 z1. ь г7.г гы.5 « з��своЬ впд оспог r4впо 13z. г 11. у ь.z Ь.о ь.е ь.4 е.о 1о. э г. �г ь.L ь.в 55.ь
LNTE1t � 1' f'AYABLE ОН DEB7`
_ ll_eoomber э1, 1970 69. ы Gd.6 56.2 56.'! 4ы.б 47.0 Э7 �9 Э9 � / ЭЭ .G 29.9lD (� �Ф '� 2Л са т .
зьогt- тект J '16.3 � 1г'.9 1г.4 i2.4 1z.4 12.4 12.4 1z.4 12.4 1z.4мвдl цт-те� 15.9 13.7 9.5 1о.7 5.9 5. г г.е г.5 1. е 1. а
wng-me тm Э7. б 42.0 э4.3 э3. б 3о.3 29.4 22.7 24. ы 19.4 16.5
� Nevolving oredlte.� f по lиг]1ng 54 �4 т 1111 оп Central Bank l оапв from IBED relent to nual Ъвп kв .� 1ao1uding lntera вt оп revalving aredlt в f гnm 1971-1975 �
� O4RCEt CenLral Bank of the Ph111pp1 гtee.

Table -4.8
Phil-iiPPILue Exterwa -DebtRepayments During 1970
millio.0
1 9 7 0 First Semester Second SemesterI t e m Total Princip'aI Interest Sub-T'tal Principal Interest _ub-Total Principal Interest
T4-+7) (54 8)_ (6 + 9) 5 + - C8-+ 9(1) (2) a/ (3) (5) (6) (7) (8) (9)
TOTAL 0 2
1. C e-i- tral Bank 150.2 121.4 28.8 46.6 37.2 9-4 103-6 84.2 19.4
Short-Term 130.4 lo8.7 21.7 27-3 24.9 2-4 103-1 83-8 19-3
Medium-Term 19.8 12.7 7.1 19-3 12 7.0 0-5 0.4 0.1-3
2. Others 386.8 321.0 65.8 141-7 112.9 28.8 245.1 208.1 37.0
Short-Term 78.8 66.2 12.6 21.2 17.2 4.0 57.6 49.0 8.6
Medium-Term 191.0 1§7.8 23.2 71.4 60.6 10.8 119.6 107.2 12.4
Long-Term 117.0 87.Q 30.0 49.1 35.1 14.0 67.9 51.9 16.o
a Exclusive of commercial banks' swap arrangement and DA, D/P and OA; includes PNB short-term credit repayments.b / Including'IBRD loan relent-to rural banks.
SOURCE: Central Bank of the Philippines.
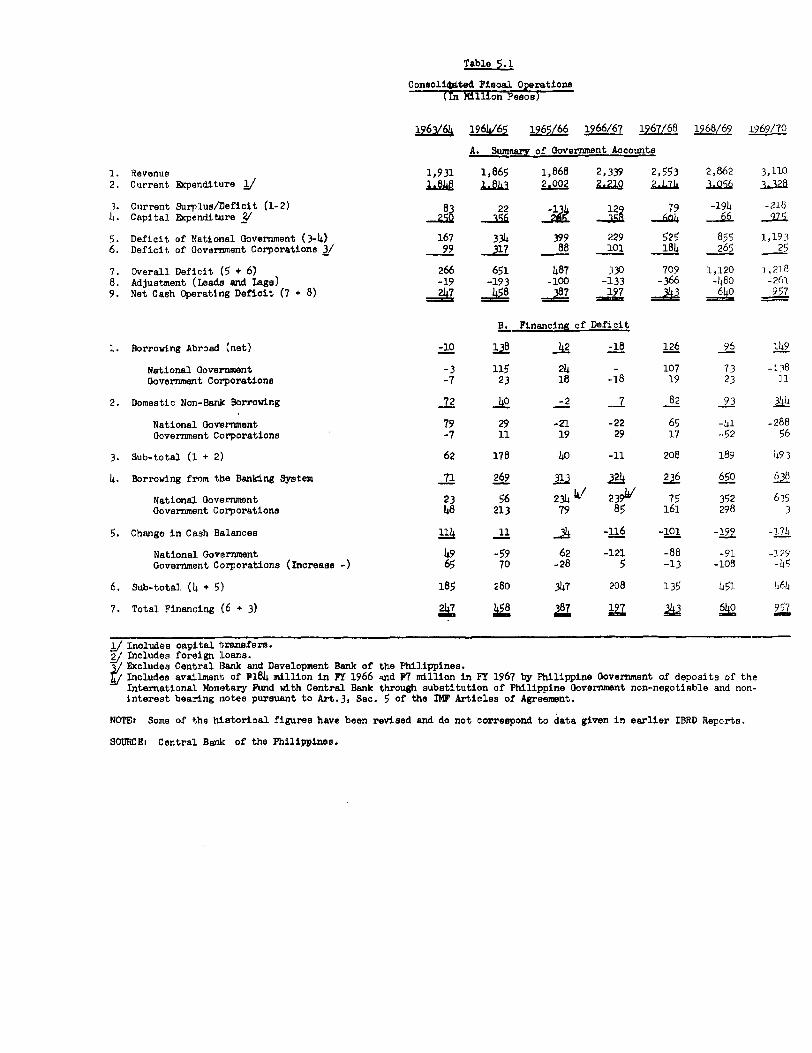
Table 5.1
Consolit4ted Fiscal OperationsIn Mllion Pesos)
1963/64 1964/65 1965/66 1966/67 1967/68 1968/69 1969/70
A. Summar of Government Accounts
1. Revenue 1,931 1,865 1,868 2,339 2,553 2,862 3,1102. Current Expenditure I L= JL 2.002 9A912 Z" JLQ5k a-UL
3. Current Surplus/Deficit (1-2) 83 22 -13 12 79 -194 -218h. Capital Expenditure /1 -60 .Aq 992 -2 _ _6 J75
9. Deficit of National Government (3-4) 167 334 399 229 525 855 1,1936. Deficit of Government Corporations 3/ 99 317 88 101 184 265 25
7. Overall Deficit (5 + 6) 266 651 487 330 709 1,120 1,2188. Adjustment (leads and Lags) -19 -193 -100 -133 -366 -480 -2619. Net Cash Operating Deficit (7 + 8) 2A7 == _J17 m -- -64o 957
B. Financing of Deficit
1. Borrowing Abroad (net) -10 138 2 -li 126 96 149
National Government -3 115 24 - 107 73 -138Government Corporations -7 23 18 -18 19 23 11
2. Domestic Non-Bank Borrowing 72 -2 7 82 93 _&1
National Government 79 29 -21 -22 65 -L1 -288Government Corporations -7 11 19 29 17 -52 56
3. Sub-total (1 + 2) 62 178 40 -11 208 189 493
4. Borrowing from the Banking System 71 269 313 324 23 650 638
National Government 23 56 234 I 239V 75 352 635Government Corporations 48 213 79 85 161 298 3
5. Change in Cash Balances 114 11 J -116 -101 -199 -174
National Government 49 -59 62 -121 -88 -91 -329Government Corporations (Increase -) 65 70 -28 5 -13 -108 -h5
6. Sub-total (4 + 5) 185 280 347 208 135 451 1460
7. Total Financing (6 + 3) 387 19786140 957
Includes capital transfers.Includes foreign loans.Excludes Central Bank and Development Bank of the Philippines.Includes availment of P184 million in FY 1966 and P7 million in FY 1967 by Philippine Government of deposits of theInternational Mnetary Fund with Central Bank through substitution of Philippine Government non-negotiable and non-interest bearing notes pursuant to Art.3, Sec. 5 of the IMF Articles of Agreement.
NOTE: Some of the historical figures have been revised and do not correspond to data given in earlier IBRD Reports.
SOURCE: Central Bank of the Philippines.
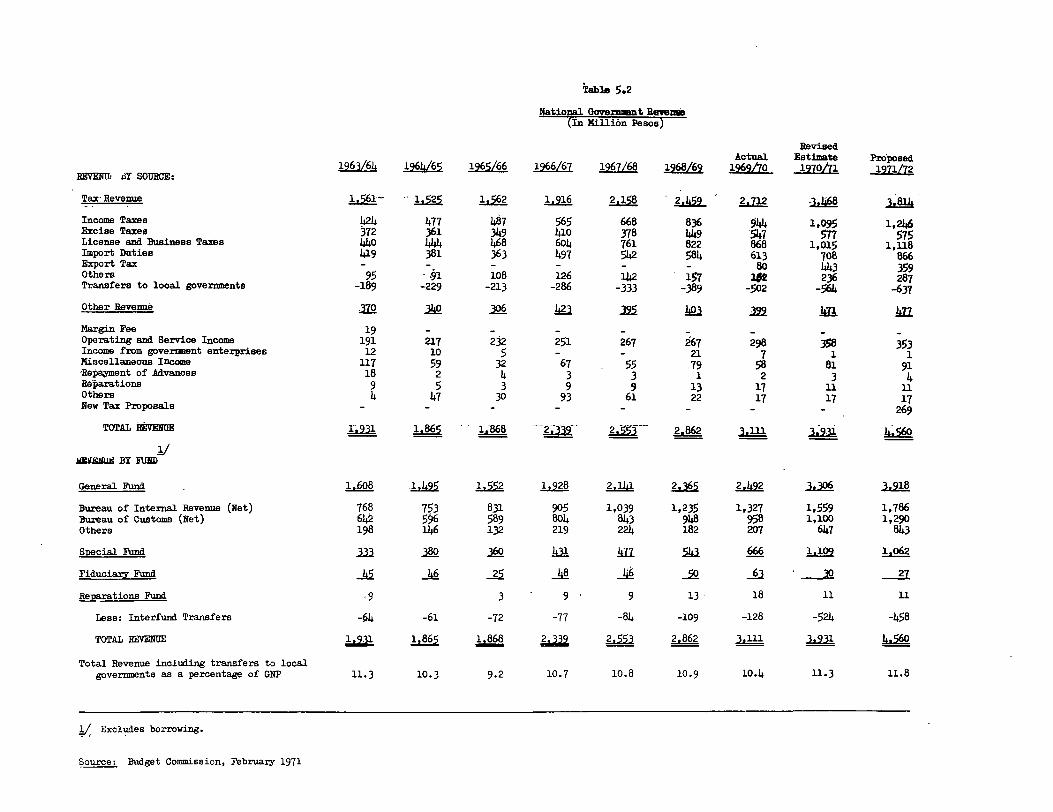
Table 5.2
National Governt Rereu(In illion Pesos)
RevisedActual Estimate Proposed
RVENM .LY SOURCE: 1964/65 1965/66 1966/67 1967/68 1968/69 1969/0 1970/1 1971o
Tax Revenue 1,561- 1.52 1.562 1.916 2.158 2 272l46
Income Taxes 424 477 467 565 668 836 944 1,095 1,246Excise Taxes 372 361 349 410 378 449 547 577 575License and Business Taxes 440 444 468 604 761 822 868 1,015 1,118Import Duties 419 381 363 497 542 584 613 708 866Export Tax - - - - - - 80 443 359Others 95 - 1 108 126 142 157 236 287Transfers to local governments -189 -229 -213 -286 -333 -389 -502 -564 -637
Other Revenue _U0 .306
Margin Fee 19 - - - - - . -Operating and Service Income 191 217 232 251 267 267 298 358 353Income from government enterprises 12 10 5 - - 21 7 1 1Miscellaneous Income 117 59 32 67 55 79 58 81 91Repayment of Advances 18 2 4 3 3 1 2 3 4Rebarations 9 5 3 9 9 13 17 11 11Others 4 47 30 93 61 22 17 17 17New Tax Proposals - - - - - - - - 269
TOTAL REM 1T1865 _._86 2.L862 3.1119,
AW&aUg~ BY FUND)
General Fund 1.608 i 1 .552 1,928 2 2.492 3,06 3918
Bureau of Internal Revenue (let) 168 753 831 905 1,039 1,235 1,327 1,559 1,786Bureau of Customs (Net) 614 596 589 804 843 948 958 1,100 1,290Others 198 146 132 219 224 182 207 647 843
Special Fund M 180 36 Q ll 666 1.,109 1.062
Fiduciary Fund _4 25 _60
_Raations Fund 3 9 9 13 18 11 11
Less: Interfund Transfers -64 -61 -72 -77 -84 -109 -128 -524 -458
TOTAL EVENUE 16 1&868 2.862 3,931
Total Revenue including transfers to localgovernments as a percentage of GNP 11.3 10.3 9.2 10.7 10.8 10.9 10.4 11.3 11.8
Excludes borrowing.
Source: Budget Commission, February 1971
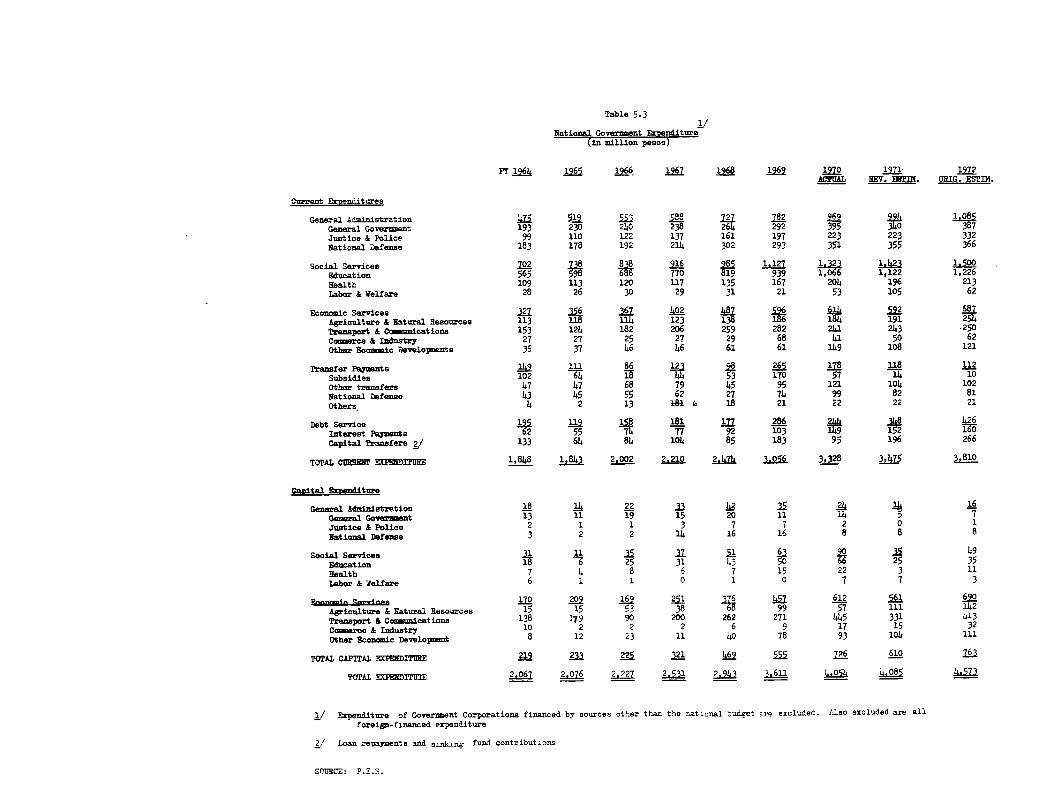
Table 5.3
National Goverment Expenditure(in million pesos)
Fr 196 165962 197o 1971 1972ALML HEV. EBOM. ORIG. ESTIM.
Current Expenditures
General Administration 182 a60 1 08coneral Governmen 193 230 240 2 264 292 390 387Justice & Police 99 110 122 137 161 197 223 223 332National Defense 183 178 192 214 302 293 351 355 366
Social Services 922 73 16 8 1 .127 _1_ IL4Edcto-6 9 8 770 19 939 1, 6 1,122 1,226
Health 109 113 120 117 135 167 204 196 213Labor & Welfare 28 26 30 29 31 21 53 105 62
Economic services 121 3. 61 1o2 487 Ai L20Agriculture & Natural Resources 113 118 114 123 191 254Transport & Cnenications 153 124 182 206 259 282 241 243 .250Comerce & Industry 27 27 25 27 29 68 41 50 62other Boonantc Develoments 35 37 46 46 61 61 149 108 121
Transfer Payments 1.2 111 86 1u265 178 118 112Subsidies 102 64 44 53 170 57 1 10other transfers 47 47 68 79 45 95 121 104 102National 4efene 43 45 55 62 27 74 99 82 81Others 4 2 13 181k 18 21 22 22 21
Debt Service18 f26Intereat Payments 62 55 2'f 17 92 101Capital Transfers 133 64 84 104 85 183 95 196 266
TOTAL CUREZU NIUE 1,848 1,843 2.002 2.210 2.47 & 3,328 3,810
Capital Erpenditure
GeaMnl AAmnistration 18 2 6General Government 13 11 19 15 20 11 14 7Justice & Police 2 1 1 3 7 7 2 0 1National Defense 3 2 2 10 16 16 8 8 8
Social Servicese 11 IL U§14Education 1 25 3 35 53
Health 7 4 8 6 7 15 22 3 11
Labor & welfare 6 1 1 0 1 0 7 7 3
MO M 1762 251 612 561anmm .,w.15o 9 .53 58 9L9 5il ill 142Agriculture & Natural Resources 15 15 53 38 66 99 57 111 12
Transport & C unications 138 279 90 200 262 271 445 331 413Camroe & Industry 10 2 2 2 6 9 17 15 32Other Economic Development 8 12 23 11 40 78 93 105 111
oeexrR PEDTRE22 23 11 460 68931016
TOTAL CAPITAL ETm nm Af L2 25 121Pa16 610
TOTAL PENDITURE 2A067 2.076 2.227 2,IL1 29I 3.611 4.054
1/ Expenditure of Goverment Corporations financed by sources other than the national budget ire excluded. Also excluded are all
foreign-financed expenditure
2/ Loan revayments and s,nkinr fund contributions
SOURCE: P.E.S.

Table 5.4
Annual ExpendHnres an Infrastrucire by Major Sector.(in silian Pesos)
TargetExecution of Four-Year Infrastcture Investment Program 1966/67
Total Dam&Ue Total Foreign Total toJuly 1 - June 30 1962/63 1963/64 1964/65 1965/66 1966/67 1967/68 1968/69 1969/70 Exp Eenditre Expenditure 1969/70 % Realization
Highways 50 91 139 89 179 260 230 218 765 122 887 960 92
Airparts 13 10 10 5 10 11 33 48 84 20 1o4 135 77
Bko-vorks 35 6h 32 39 29 35 20 21 84 22 106 119 89Railways n.a. n.a. n.a. n.a. n.a. n.a. n.a. n.a. n.a. n.a. n.a. n.a. n.a.
Telecommunications 8 9 7 4 16 18 _22 46 35 66 101 123 82
Power- 36 44 54 6h 60 60 36 52 163 6 209 285 73Irrigation 6 5 3 11 22 32 43 h6 100 h2 142 286 2/ 5
Water Supply 11 8 7 34 61 63 79 43 178 68 246 299 / 82
Flood Control 19 7 3 5 1 3 11 5 20 - 20 60 33
Building Constmction 14 25 17 17 32 1/ 88 1/ 104 1/ 47 189 71 260 267 2/ 97
Community Projects n.a. n.a. n.a. n.a. 10 1/ 8 1/ 15 V 163 208 - 208 196 g 106
Preliminary Engineering n.a. n.a. n.a. n.a. 1 3 2 2 8 - 8 14 57
Total Expenditure 189 263 272 267 421 581 596 691 - - 2,290 2,745 83
of which Domestic Funds n.a. n.a. n.a. n.a. 360 469 480 523 1,833 - 1,833 2,099 87
Foreign Sources n.a. n.a. n.a. n.a. 61 112 116 168 - 458 4 646 71
/ Building Construction includes P 11 million to be classified under Community Projects.
/ LTsub-targets were reduced to accommodate a P56 million excess in ComauniW Projects. The total target was not chaged.
Source: Infrastrmcture Operations Center.
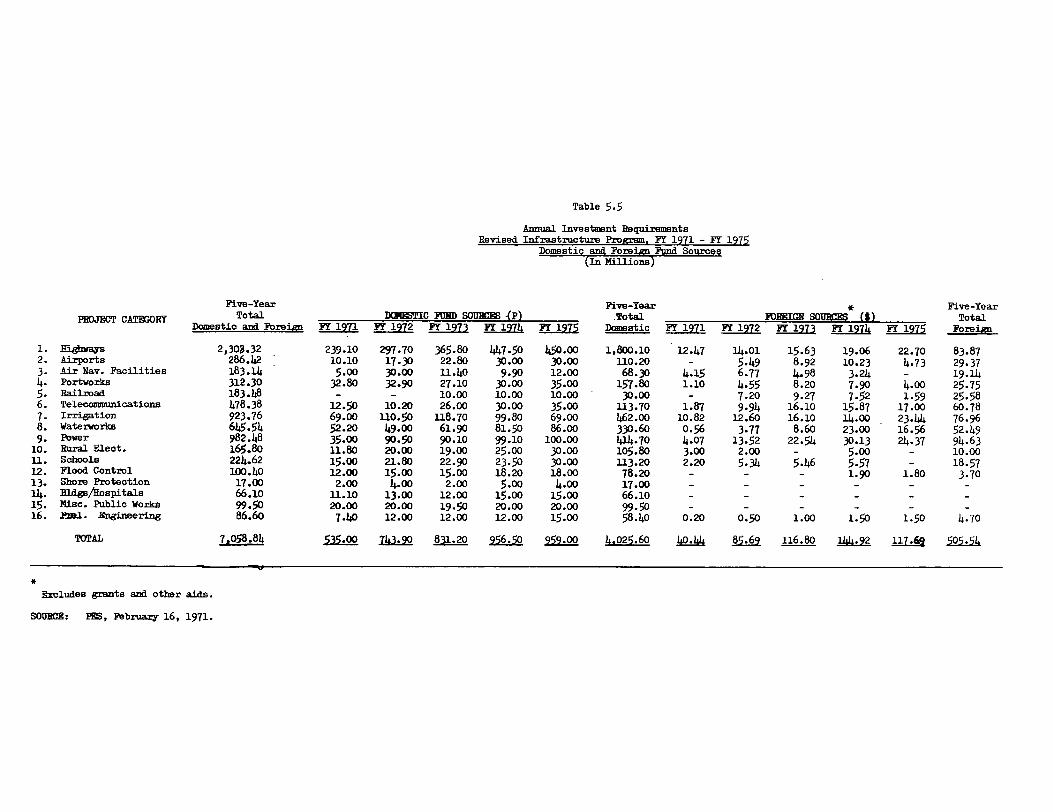
Table 5.5
Annual Investment RequirementsRevised Infrastructure Program, FY 1971 - FY 1975
Domestic and Foreign Fund Sources(In Millions)
Five-Year Five-Year * Five-YearPRDJECT CATEGORY Total DMETIC Fu SOUMM -(P) .Total 1FREIGN SOURCES (5) Total
Domestic and Foreign F 1971 ! 1972 !297 F! 1974 FY 1975 Damestic FY 1971 F! 1972 F!r 1973 F! 1974 FT Foreign
1. EMhways 2,303.32 239.10 297.70 365.80 447.50 450.00 1,800.10 12.47 14.01 15.63 19.06 22.70 83.872. Airports 286.42 10.10 17.30 22.80 30.00 30.00 110.20 - 5.49 8.92 10.23 4.73 29.373. Air Nay. Facilities 183.14 5.00 30.00 11.40 9.90 12.00 68.30 4.15 6.77 4.98 3.24 - 19.144. Portworks 312.30 32.80 32.90 27.10 30.00 35.00 157.80 1.10 4.55 8.20 7.90 4.00 25.755. Railroad 183.48 - - 10.00 10.00 10.00 30.00 - 7.20 9.27 7.52 1.59 25.586. Telecommunications 478.38 12.50 10.20 26.00 30.00 35.00 113.70 1.87 9.94 16.10 15.87 17.00 60.787. Irrigation 923.76 69.00 110.0 118.70 99.80 69.00 462.00 10.82 12.60 16.10 14.00 23.44 76.968. Watervorke 645.54 52.20 49.00 61.90 81.50 86.00 330.60 0.56 3.77 8.60 23.00 16.56 52.499. Power 982.48 35.00 90.50 90.10 99.10 100.00 414.70 4.07 13.52 22.54 30.13 24.37 94.6310. Rural Elect. 165.80 11.80 20.00 19.00 25.00 30.00 105.80 3.00 2.00 - 5.00 - 10.00
11. Schools 224.62 15.00 21.80 22.90 23.50 30.00 113.20 2.20 5.34 5.46 5.57 - 18.5712. Flood Control 100.40 12.00 15.00 15.00 18.20 18.00 78.20 - - - 1.90 1.80 3.7013. Shore Protection 17.00 2.00 4.00 2.00 5.00 4.00 17.00 - - - - - -14. Rldge/Hospitals 66.10 11.10 13.00 12.00 15.00 15.00 66.10 - - - - - -
15. Misc. Public Works 99.50 20.00 20.00 19.50 20.00 20.00 99.50 - - - - - -16. rml. Engineering 86.60 7.40 12.00 12.00 12.00 15.00 58.40 0.20 0.50 1.00 1.50 1.50 4.70
TOTAL 7058.8 535.00 T 831.20 9 9 4,025.6o 40.44 85.69 116.80 1 117A9 5
Excludes grants and other aids.
SOURCE: PES, February 16, 1971.

-Table -5.6
:PhysicalAccomplishments of IAfrastructure Investants
.' 4 -Tear -Target 1%.Accom-u y.1-- June :30 Units 1962/63 1963/66 1966/65 1965/66 1966/67 11967/68 1968/69 -1969/76 Total;/ -1966/67-1969/70 plm
1. .Highways
Ooncrete -Kas. 60 '76 79 138 ,l62 1625 566 438 :1,791 2,350 76.sphalt Kas. .630 612 66L 553 .240 963 760 '813 2,7.7 2139Gravel/Feeder EKms. 2,100 2,539 :2,021 ,115 1557 976 '855 3,826 5,812/ 3;900 119.PermanentgBriges L.M. <2,637 i2,609 1,835 ;2,7367 ,oo7 6,31 26,131 30,000 '80
2. Irrigation -Hectares .26.492 :19,113 I= 3 51,514 95.386 -8574 i .3a Q 5
Rehabilitation Hectares n.a. 'n.a. nJa. .n.a. 11,000 16,500 2,000 500 .28,000 3>,000 93Nat. Gravity Hectares 'n.a. n.a. n.a. n.,a. 11,620 29,130 -25,800 2-1,150 -87,700 -307,050 -29'ommunal Hectares n.a. n.a. n.a. n.a. 7,671 7,606 9,191 16;751 38,819 19,000 206Pump Units Hectares n.a. n.a. n.a. n.a. 21,623 .44,350 48,756 8;962 123,669 102,000 121
3. Airports
Airports No. 3 11 9 5 2 6 2 -6 12 68 25Air Navigation Facil. No. -8 - 3 4 3 .2 2 9 16 '181 9
L. River Control
-Sarth Dikes Kas. -n.a. n.a. ,n.a. .n.a. 2 12 .9 4 -26 '237 11Revetments L.'M. n.a. n.a. n.a. n.a. 1,626 268' 2,262 -566 6,680 6,100 77-Drainage 'Mains L. M. n.a.. n.a. n.a. n.a. 208 465 - - 673 600 168Dredging Cu.m. n.a. n.a. n.a. n.a. 12 1,965 819 971 3,767 2,006 188
5. Waterworks
Manila,& Stburbs -% n.a. n.a. n.a. n.a. 39 13 26 '5 81 89 91Provircial No. 10 5 5 69 26 115 29 75 -245 808 30Artesian Wells No. 616 665 228 '293 206 269 168 36 o679 6,800 Th
6. Buildngs
Schools Rooms 1,00 3,003 1,60w 1,500 1,361 18;583 20,556 37,963 78,663 88,445National Buildings Sq. M. n.a. "n.a. n.a. n.a. 13,625 z6,965 32,343 31,981 86,896 216,700Hospitals Sq. M. n.a. n.a. n.a. -n.a. 2,620 2,230 16,600 18,516 39,766 151,200 26
7. Portworks
Foreign Berths :No. 2 1 3 1 9 .8 1 - .18 38 48Domestic Berths No. -6 -L 18 15 3D -12 -18 18 .78 -66 118Recalimed-Port Area Hectares -n.a. n.-a. n.a. n.a. 0.6 .0:2 7 63.7 51.'3 108 68Warehouses Sq. eters n.a. n.a. .h.a.-- n.a. 5,708 . -16,626 8,650 2,990 31,976 38,960 .. 82causeway -Bulkheads L. M. nea. n.a. n.a. n.a. 1,672 2,950 6,526 7,3. 16,192 13,175 123Dredging Million -u.M. 3 5 . 3 *13 17 11 7 -55.5 88Seaialls L. M. n.'a. n.a. n.a. n.=a. 679 629 2,136 ,44t 7,658 6,120 186
8. Power
Power Generation M.W. n.a. n.a. n.a. n.a. 12 250 - - 262 '387 68Power Distribution Kms. 163 68 187 317 283 353 365 193 983 2,100 67
1/ Telecommunications.
Sc,ruce: Infrastructure Operations Center.

Table 5.7
Revenue and Evenditures of Local Authoritieg By Function(In Million Pesos)
1963/64 1964/65 1965/66 1966/67 1267/68 1968/69
Revenues - Total Local Government 02 81 634 674 741 849
Internal Revenue Allotment 189 229 213 2491/ 333 389Real Property Tax 82 89 98 111 120 112Municipal Licenses 64 71 76 82 98 105Fees and Charges 65 81 91 98 105 113National Aid 35 47 61 43 68 75All Others 67 64 95 91 17 55
Expenditures - Total Local Government 50638 586 756 817
General Administration 224 250 086 308 340 262Economic Development 90 102 118 118 142 153Social I:mproveftent 86 75 85 102 112 109Debt Service 6 7 11 9 11 14All Others 104 1 137 49 151 279
Provincial U6 161 186 1 0 21
General Administration 54, 58 63 61 69 50Economic Development 42 48 54 55 65 80Social Improvement 23 25 30 29 33 35Debt Service 1 1 2 3 4 4All Others 26 29 37 27 29 72
9m 214 ?.9 W 251 3 332
General Administration 93 104 123 145 155 129Economic Development 23 30 36 38 36Social Improvement 54 41 44 61 64 58Debt Service 3 4 7 4 5 7All Others 41 35 49 5 74 102
Municipal 150 171 l 9 160 22 24
General Administration 77 88 100 102 116 83Economic Development 25 29 34 27 39 37Social Improvement 9 9 12 12 15 16Debt Service 2 2 2 2 2 3All Others 37 43 51 17 48 105
Surplus (+) / Deficit (-) -. 8 +M0 +88 +32
1/ Budget Document, FY 1971 shows 1286 million.
Source: Report of the Auditor General on Local Government, FY 1968.
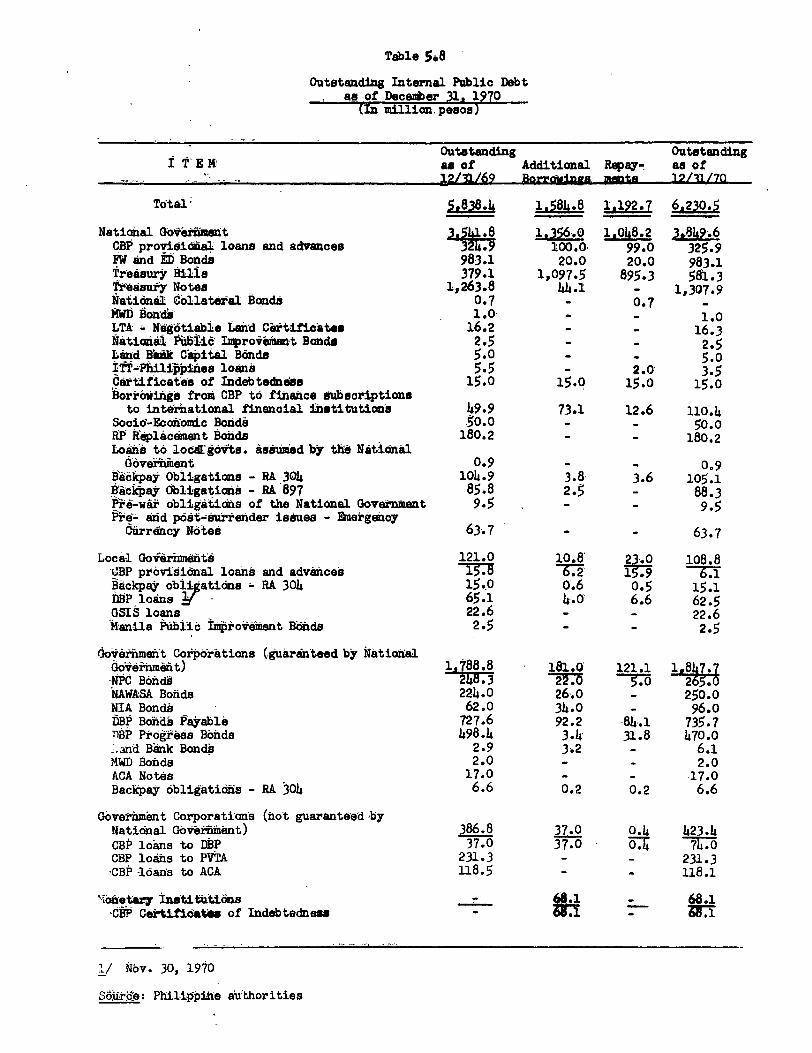
Table 58
Outatanding Internal Public Debtas of December 31. 1970
(In million,pebos)
Outetanding Outetanding1 E M as of Additional Repay- as of
12/11/69 Borrömings men 12/11/70
Total 1.584.8 1.192.7 6,230.5
National Goveñíment .8 1.356.0 1.048.2 3»849.6CBP provisiofal loans and advances 3 100.0. 99.0 325.9FW and ä Bonde 983.1 20.0' 20.0 983.1Treasury Bilia 379.1 1,097.5 895.3 581.3Treasu y Notes 1,263.8 44.1 - 1,307.9Natiònål Collateral Bonde 0.7 - 0.7 -mlI) Bondi 1.0 - - 1.0LTA - Négötiable Land Cäi•tificatsa 16.2 - - 16.3Måtioal It1,i6 Improein~t Bonda 2.5 - - 2.5Land B~äk Capital Bönds 5.0 - - 5.0IftåPhiliWpines loana 5.5 - 2.0 3.5COrtificates of Indebtedn's 15.0 15.0 15.0 15.0Bori.oings from CBP tö fihnnco dubsciptions
to interational financial institutions 49.9 73.1 12.6 110.4Socid-Ecañomic Bondé 50.0 - - 50.0P keplåcement Bonds 180.2 - - 180.2
Loan to lokdrgVts. àsiumed by thå Nationalåöverient 0.9 - - 0.9
ä,åékpay Obligatione - RA 304 104.9 3.8' 3.6 105.1Bäckta Obligatiåna - RA 897 85.8 2.5 - 88.3Pý'-wàr obligätiina of the National Government 9.5 - - 9.5
e4és and póat-surrender isMues - &mergecyUûrréncy Nåteå 63.7 - - 63.7
Local Goir~miütå 121.0 10.8' ..0 108.8gBP pròvisiònal loané and advances M. 1 n.9 ~~6.1Éåckpay obiatidns -- RA 304 15.0 0.6 0.5 15.1DIP loan 65.1 4.0 6.6 62.5MSS loans 22.6 - - 22.6
kanila Pûbicå Imroeiaent Bndo 2.5 - - 2.5
doténment Corprations (guaranteed by Nationaldoierhmèt) .8 181.0 121.1 1,847.-NC Bond» 2 48.3 2.Öb 265.0NAWASA Bonde 224.0 26.0 - 250.0NIA Bond - 62.0 34.0 - 96.0DBP Bondå Payable 727.6 92.2 -84.1 735.7TåP Poiig^eas Bonds 498.4 3.4 31.8 470.0'.and B'änk Bondå 2.9 3.2 - 6.1MWD Bonds 2.0 - - 2.0ACA Notés 17.0 - - 17.0Backpay öbligatidfa - RA 304 6.6 0.2 0.2 6.6
Government Corporatian's (not guaranteed byNatidnal Gövöfitnent) -386.8 37-0 0.4 423.4CBP loans to DBP 37.0 37.0 · 0.7 77.CBP loåäs to PYTA 231.3 - - 231.3,CBP -löans to ACA 118.5 - - 118.1
Monetary Institutiän- 68.1,CBP Cettif±atés of Indebtednesm - . ~ -
1/ Nåv. 30, 1970
Sdìrcle: Philippife aVthorities

Table 5.9
Holders of Government Securities(In million pesos)
E nd of. Period
Item June 1962 June 1963 June 196J 1 June 1965 June JnJune 19 9 June 1970 Dec. 1970
Banking System 1,464.4 1,415.5 1,405.1 1,426.3 1,532.7 2,114.1 21h98.9 2v894.2 3,652.8 3,526.3
Central Bank 1,194.2 965.7 1,010.9 1,009.6 1,034.4 1,371.5 1,612.2 1,828.3 2,362.8 2,384.9
Commercial Banks 270.2 149.8 394.2 416.7 198.3 742.6 886.7 1,065.9 1,290.0 1,141.4
Government FinancialInstitutions 163.0 186.0 252.0 282.6 305.5 227.9 231.2 282.8 29 .
GSIS, SSS 128.4 14h.4 213.8 239.5 261.1 193.1 205.6 229.6 280.1 232.0
Others 34.6 41.6 38.2 43.1 14.4 34.8 28.6 53.2 15.1 14.7
Government TrustFunds 228.6 266.0 312.0 389.1 3582 416.6 `481*3 193.0 6117.5
Private Sector 27-3 k. 2. 298 13.2 112.5 207.1 233.8 310.5 jq 2 7711.8 2/
Total 1,883.3 1,907.7 2,008.? 2,141.2 2,308.9 2,965.7 3,448.2 3,980.5 5,101.7 5,233.0
1/ Includes bond issues of the Development Bank of the Philippines (DBP) and Land Bank of the Philippines.
2/ Preliminary. Commercial banks' holdings in Treasury bills unavailable.
Sources: Securities Market Department, Central Bank of the Philippines; Development Bank of the Philippines; and Land Bank
of the Philippines.

-Securities ed lu y Kagtional iGovernment .and Governannt Corporations
jary lo Deceier 1965 to 1970- in·.. I.. o ppo
µpe of Security 1965 1966 1967 1968 11,9§69 1970
5 9 4 28.4 1 OM..0 1.99.2 1720.6
National Government 172.3 69L.3-3 1.64.3 1,5.2
PW.and ED Bonde 29.1.93 ~20#0
So,io-Econonc Bonds 6.5 - - - -
Treamury Notes 289.3 569.2 165.0 .,8 730.9 94.1
Negoabl1e land CertificQate8 - - ,0.3 3.3 0.1
C,ertif-icates of Indebtedness 115.0 -- - - 15.02Bis - 82.5 1o.0 690.7 809,8 1,377.0
P tBonds,RP 2teni Loan Bonds 9-
anR ital onds - - 0 --
Govrnment Corporatians 39.9 2 2.388.9 146.
ýNIA Bons 39 0 3 10, 11.3 .0
MPC Bonop 2L0 - .14 15.2 22.0SA nns L 33,3 53.0 25.9
OAP Bonda 1.2 29..0 -90.9 90.0 61.2
åBP Pr,gr, Bonds 93.9 43..f8 83.2 217.5 -
Land Bak 2 B,onis - 0.3 k0.7 1.9 3.2
Monetary Intitutins -- _ 68.1
CBP Certl'categ,of Indqb,tdnaa - as -
1/ $l~ = .5Sources: ä ce tP MgrIkot Prmn, Central Bank of he ri:pm; p Devgopment Bank of the
-Philippines; and Land Bank pk the Ph-lippines.

Table 5..11
Holders of Different Types of Government SecuritiesAs of December 31. 1970
(in million pesos)
Out- Commer- Localstanding CBP cial Trust Semi-Gort. Private Foreign12/31/70 Banks Funds htities Sector Holders
Total 5,3. g38A.9 L.hlU.Y685.2 246.7 73. 41. h2
National Government 3.200.8 1,5096 272.8 120.5 0.3 .2
PW and ED Bonds 1,001.1 220.9 512.7 141.1 91.6 3h.8 -Socio-Economic Bonds 50.0 4.1 30.9 5.3 - 9.7 -Treasury Notes 1,307.9 1,10h.0 162.8 12.0 23.9 5.2 -Negotiable Land Certificates 16.3 - - 14.4 - 1.9 -Certificate of Indebtedness 15.0 15.0 - - -
Treasury Bills 581.3 2.7 n.a.2/ 79.9 - 498.7 -RP Replacement Bonds 180.2 160.1 - 20.1 - - -RP Ebternal Bonds 44.0 2.8 - - - - 41.2Land Bank Capital Bonds 5.0 - - - 5.0 - -
Government Corporations 1,960.1 873? 312.1 412.1 125.4 176.8
NIA 95.9 3.2 36.6 56.0 - 0.1 -NPC 265.3 67.9 21.4 166.1 6.8 3.1 -MWD and KAWASA 252.0 78.0 42.0 119.0 13.0 - -ACA 135.1 118.1 - 17.0 - - -DBP 1,205.7 606.5 272.1 5h.0 104.9 168.2 -Land Bank 6.1 - - - 0.7 5.4 -
IPM Bonds .0 1.6 1.2 0. 0.8 0.1
Monetary Institutions 68.1 - .7 - -6_.7 6-
CBP Cert. of Indebtedness 68.1 - 61.7 - - 6.4
1/ Inclusive of security issues by the Central Bank of the Philippines.2/ Inclusive of the DBP Progress Bonds.I/ Preliminary. Commercial banks' holdings in Treasury Bills unavailable.
Sources: Securities Market Department, Central Bank of the Philippines; DevelopmentBank of the Philippines; and Land Bank of the Philippines


Table 6.1
Factors Affectin Man S l 191-10(i illion Peace)
196 1962 11 1 19e 1966 1QA7 1QAR 1969 1970
Public SectorO.ank edil to the NationalGovernmentGross Credit
Central Bank 767 826 811 882 831 956 1,252 a 1,256 1,773 1,976Commercial Banks 6_0 1 6L 1.032 900
12 1,27 1S 1r7 r ,13 ,1 2,876Cash Balances and Deposits 521 627 - -Z -67 -827 - 79 - 9
TOTAL 642 525 640 715 548 826 1,065 1,235 2,040 1,920
2. Bank Credit to Local Governmentand Semi-Government Ehtities
Gross CreditCentral Bank 658 702 750 70 754 871 1,05h 1,045 1,149 1,18hCommercial Banks5 125 _ 1 2 652 594 iI.2 1.098 1.458 1.578
TOTAL 783 796 937 1,037 1,046 1,465 2,066 2,143 2,607 2,762
Time and Savings Deposits 352 -90 2 - 2 - 281NetCrdi - 11Ii 347~ f 116 ~20 1,763 I18?7 2, 315 2,1
3. Net Credit to the Public Sector 1,136 969 1,187 1,1426 1,716 2,035 2,828 3,111 4,355 4,401
Private Sector4. Gross Bank Credit
Loans, Discounts, Overdrafts 6Customers Liability Acceptances 2,502 3,003 3,937 h,518 4,729 5,360 6,26h 6 , 9 8 3 7, 2 50 / 8 , 3 0 bCorporate 8ecurities 2 -4 * 3 2 5 - 4 7 140
TOTAL . 2,504 3,007 3,91h 14,521 4,731 5,365 6,269 6,987 7,297 8,470
Time and Savings Deposits -1.1 - -!A60 - -125 i2
5. Net Credit to Private Sector 1,396 1,640 2,174 2,499 2,521 2,541 2,694 2,722 2,909 3,271
6. Net Domestic Credit (3 + 5) 2,532 2,609 3,361 3,925 14,237 h,h98 5,437 5,833 7,264 7,672
Net Miscellaneous Account of Banks7. Not Miscellaneous Account of
Cmtral Bmk and PNB 314 220 207 182 629 41 594&/ 501 555 790
8. Net Miscellaneous Accounts ofPrivate Commercial Banks 188 172 3 5 6 7 861 96 1.170
TOTAL 502 392 552 7144 1,078 1,204 1,349 1,362 1,524 1,960
Erternal Sector9. Foreign Assets
(a) Central Bank 159 184 328 4314 735 6148 701 629 470 1,181(b) Commercial Banks (net) 133 234 94 - 109 42 268 314 258 174 414(c) Foreign fkohange Differentials - - - - - - 148
TOTAL 292 418 422 325 777 916 1,016 887 64 1,37310.0freoto
a_ ntral Bank Foreign Liabilities8165 212 88 166 342 401 903 1,108 1,371 1,778(b) Revaluation of Foreign Assets(-Loss) - 62 8 189 45 5 516 _*. 268 259 260
TOTAL 103 130 277 622 869 917 1,06 1,376 1,630 2,03811.Net Eternal Sector (9-10) 189 288 145 - 297 - 92 - 1 - 391 - 489 - 986 - 665
Money Supply (6+11-7-8) 2,219 2,505 2,954 2,881 3,067 3,371 3,783 3,982 14,754 5,047Percentage rate of change 17 13 18 - 3 7 10 12 5 19 6
NOTE: Individual figures may not exactly add up to the totals because of rounding.
Central Bank loans plus securities held by Central Bank.
~/Securities held by commercial banks and loans by comrcial banks.oIncludes cash in Treasury values deposits with commercial banks and with the Central Bank and Trust Funds with
the Central Bank.Same as in footnote 1.Same as in footnote 2.
Y/includes unused overdrafts.SDenoted as International Reserves in the corresponding tables in the Annual Reports of the Central Bank of the
Philippines.~/Spjci.ql loans and advances abroad.
a 1 The folloing figures in this table differ from the corresponding figures given by the Central Bank of thePhilippines: the gross Central Bank credit is higher in this table by ?134 million; the miscellaneous account ofthe Central Bank is low- by P100 million and the Revaluation account is higher by p234 million. These adjust-
ments have been made by us because the decrease of ?2314 million in the Revaluation account is merely a bookkeeping
adjustment and should not be treated as if it were related to transactions in the external sector.
b/ Including Central Bank emergency loans to savings banks.
Sor i Central Bank of the Philippines.
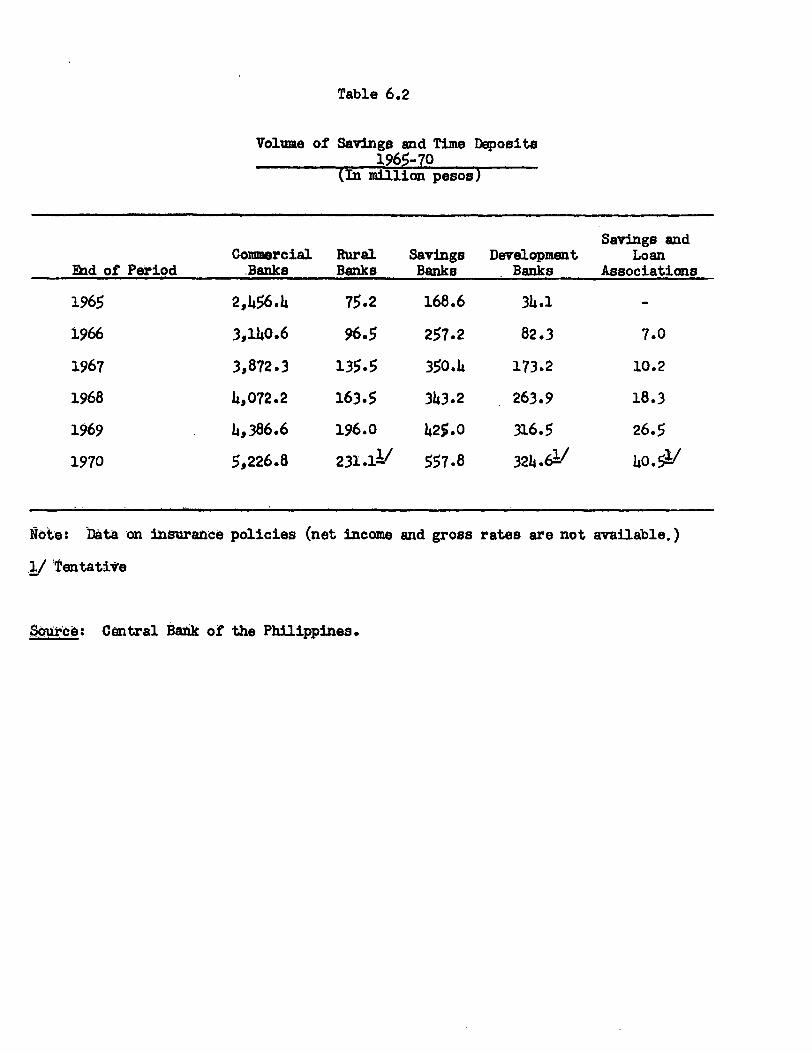
Table 6.2
Volume of Savings and Time Deposits1965-70
(In million pesos)
Savings andComercial Rural Savings Development Loan
End of Period Banks Banks Banks Banks Associations
1965 2,456.4 75.2 168.6 34.1 -
1966 3,140.6 96.5 257.2 82.3 7.0
1967 3,872.3 135.5 350.4 173.2 10.2
1968 4,072.2 163.5 343.2 263.9 18.3
1969 4o,386.6 196.0 425.0 316.5 26.5
1970 5,226.8 231.11/ 557.8 324.61/ 40.51
Note: Data on insurance policies (net income and gross rates are not available.)
1/ Tentative
ao reb: Central Bank of the Philippines.

Table 6.3
Net Domestic Credits of the Commercial Banking System. 1965-1970(In millian pesos)
PNB- .Other Banks 1/Other Other Grand
End of Period Central Public Private Central Public Private TotalGovt. Inat. Sector Total Govt. Inst. Sector Total (4+8)
(1) (2) (3) (4) (5) (6) (7) (F):1965 -374.1 201.6 756.7 584.2 157.3 -60.0 1,125.6 1,222.9 1,807.1
1966 -270.4 102.8 800.5 632.9 324.4 6.1 862.7 1,193.2 1,826.1
1967 -316.5 418.6 1,016.5 1,148.6 317.1 - 5.0 799.4 1,111.5 2,260.1
168 -300.4 48.9 992.2 T160F.7 TW4.6 747.3 ro,161.6- I,685.5 2,8462
1969 - March -250.1 617.9 872.9 1,240.5 491.6 70.4 1,136.6 1,698.6 2,939.1
June -344.8 612.9 850.2 1,118.3 487.1 76.2 1,247.0 1,810.3 2,928.6
SepteMbrV -285.7 636.3 888.9 1,239.5 528.4 92.0 1,171.1 1,791.5 3,031.0
December -312.3 754.3 957.4 1,399.4 708.5 131.9 707.5 1,547.9 2,947.3
1970 - March -504.1 783.5 967.6 1,247.0 779.5 141.7 735.6 1,656.8 2,903.8
June -577.5 712.3 941.4 1,076.2 633.0 192.2 993.7 1,818.9 2,895.1
September -613.0 698.8 842.5 928.3 660.0 162.0 1,249.0 2,071.0 2,999.3
December -532.4 791.1 953.2 1,217.9 701.9 232.7 1,239.8 2,174.4 3,392.3
1/ Includes rural banks accepting demand positions.
Source: Central Bank of the Philippines.

Table ,6.4
I1ans and Investaientaof Fiancial:Institutions, 1967.970on peso
Change Chan e Ch~nan 1 5'7 0 1 9 7 0 ChangeInstitutions 16, 1967-66 1 -9. 1969 19 8 F e b D D e c * 1979
To BanteSo ... ............ 5, .2 6,29.9 566.7 9. 2 288'0 679 7, 8,23.6 322.8To Puiac ctar ........... . .2 ,9 7 9.9 33. 22 3 2 . 27 9.To Pbivate~Sector ..................-
Couaercial Banke .................... 2 1 .0 92. - 82 9670.8 .63.9To Public Sector .................. 13.7 21.11 7 .To Private Sector ... ... 62.4 6,290.9 5.7 6,970.8 679.9 7,099.9 8,293.6 1,322.8
Avel nt Bank. . . .............. 1 %28U 2. .6 .74To Public Secr .................- 3 5 2-To Private sector 1,562 3i9.2 1,969.9 347.1 2,297.4 387.5 2,337.8 2,788.3 490.9
Rmaal B~ 339.,8 f l 2 a 34d ý8 .o~ ý:Yý 26 ::4'2i _:j 56.2To Public Sece. .................. 6.3 -0.1 17.6 . 1 72 -21. 17.1 9.1 1.9
ToSS Privac......................... 333.0 72.0 390.0 57.0 46.5 26.5 416.5 470.8 54.3Sa~ Ba ..... .................. 96.& 10. 1 227.6 34
To .............................. 124.8 -4.o 135 175 137.8 &.3 12 1 1.7To Irit. S .................. 223.6 51.0 277.1 53.5 27.7 20.6 272.1 293.1 15.4
All. nsi ? ....................... 2 1 6 2 1.-9 l 3 3 .14 4 . 5 0,4 16.893.3 __2.6
To publio setituion . ............. 3.3 68.3 3,.784- 436.3 5,022.3 1,2375 5,145-.0 5,047.5 25.2To private serate3.6 1,00.6 8,867.9 1,000.6 9,962.and t,68.- 9 D,926.4 11,845.8 1,883.4
GS................. 1,379.3 198.1 1,1477.6 98.3 1,749.2 271.6 1,766.1 1 858-6!/ '109.4
SSS596.6 60.9 780.8 184.2 824,9 44.1 8a4..6 110W0.We 255.196.7 8.5 106.7 r0r u 106.6 -0.1 106.4 118.8 12.2
NIDC 1..0.00 -J4 .o 137.5 17.5 137.8 0.3 128.9 109.1 -28.7
PrivatI,u±atinclu s b esl g hh a 40.1 231.1 51.3 251.9 20.8 215.9 233.1 -18.8
All1 Nin-ania Inatitutioms........ 1354.32lm 1,W 02..9 2,929 2
x cith the e eptitn ol reditn granted by th C ntral Bank to the A Tc= Creit Anstratun, fLguræ In this table a=ludendingto each athor by the financial institatians. e d a setor is defn,d to c ist a the catp Govermnt, laai gonnsh and
wer rmt-od enterprites aad corparatirna.E xcluds Central Bank sc and advane to cercial bank rural banks and sa~in. banks; DB? bmmiqp and Z5 hal~ af DBP bonds.Includes ail pri"at development banks azkd tbe DBP (incl"sive af trust Punde).Holdng of sec' iu,t s~d to be all govgt isAIfs .dl a ~ a Istnig 1~n 1~ aemmd to be grue~ to private entities.
As ofI - -3.1 19g
b Include all sain bk _p t.e Pot SaiExclide e secnrity holin ~K 4hic »koslailt aU data.omle aala l e P
As of April 1970.
Se Cento n private ilititnes "B r. v Un the ew canoept, private iua ccu~ ann pa~opsW8r" eroluded while Pr,ivae.eeo"tCop'ta ttsPhlpte,Enæ eeoætad
Saigsad LonAssociations ~ær added to H~tif. Building and Ian Association.e/ AoJ 3l969~
b/ Exclig ruål ba~k.c/ As af Cctober 31, 1970.
- As of April 1970.
5~re: Central Bank of tbe Phil.ippinwa.

Table 6.5
Composition of Credit Outstanding to the Private Sector-', 1961 - 1970(in million pesos)
I tPms 1961 1962 1963 1964 1965 1966 1967 19686/ 1969 1970 a/
Agriculture, Forestry and Fisheries 837.7 951.0 1,172.5 1,382.3 1,585.0 1,696.2 1,947.8 2,322.8 2,525.0 2,560.7Percentage rate of change 13.5 23.3 17.9 114.7 7.0 114.8 19.3 8.7 1.h4
Industry 2/ 1,255.5 1,504.6 1,759.8 2,014.2 2,099.5 2,331.1 2,593.h 2,854.14 3,083.5 3,233.6Percentage rate of change 19.8 17.0 14.5 h.2 11.0 11.3 10.1 8.0 4.9
Commerce 635.5 826.6 1,248.5 1,528.3 1,858.2 1,805.3 2,319.6 2,091.2 2.329.5 2,501.7Percentage rate of change 30.1 51.0 22.4 21.6 97.2 28.5 -9.8 11.4 7.14
Foreign Trade Y" 368.6 485.3 735.3 929.2 1,139.8 1,056.5 1,273.6 h83.3-7/ h38.2 650.2Percentage rate of change 31.7 51.5 26.4 22.7 -7.3 20.5 -62.2 -9.3 48.1
Export 133.4 192.9 278.2 327.5 336.1 341.1 347.8 218.7 185.4 278.7Percentage rate of change 44.6 44.2 17.7 2.6 1.5 2.0 -37.1 -13.h b7.1
Import Z35.2 292.4 457.1 601.7 803.7 715.4 925.8 264.6 2h8.8 371.5Percentage rate of change 24.3 56.3 31.6 33.6 -11.0 29.4 -71.4 -6.0 49.3
8/Domestic Trade 201.8 269.2 388.9 456.5 526.3 562.0 773.6 1,389.1,57M.9 1,533.1Percentage rate of change 33.4 44.5 17.h 15.3 6.8 37.7 79.6 13. -2.7
Others W 65.1 72.1 124.3 142.6 192.1 186.8 272.4 218.7 316.1 318.4Percentage rate of change 10.8 72.4 14.7 34.7 -2.8 45.8 -19.7 44.7 0.6
Public Utilities 61.4 74.7 97.2 115.4 128.2 171.7 214.6 244.5 217.9 230.8Percentage rate of change 21.7 30.1 18.7 11.1 33.9 25.0 13.9 -10.9 5.9
Services 43.4 57.4 74.0 81.4 82.7 99.0 143.7 180.6 181.3 251.3Percentage rate of change 32.3 28.9 10.0 1.6 19.7 45.2 25.7 0.4 38.6
Real Estate 1463.6 513.4 579.3 747.2 977.0 1,186.7 1,466.3 1,758.0 2,094.1 2,137.7Percentage rate of change 10.7 12.8 29,0 30.7 21.5 23.6 19.9 19.1 2.1
Consumption 222.3 241.8 281.0 351.6 407.3 519.0 673.9 746.3 879.1 903.6Percentage rate of change 8.8 16.2 25.1 15.8 27.4 29.8 10.7 17.8 2.8
Others / 15.8 27.9 37.9 57.5 6.8 23.2 22.2 29.4 30.0 121.2Percentage rate of change 76.6 35.8 51.5 -88.2 241.2 -4.3 32.4 2.0 301.0
TOTAL 4A197.4 5,250.2 60277.8 *1. 7,832.2 9a381. 10.2r?.2 11.340.k I.Percentage rate of change T'7 15T '--T7 1 --- w:9 -W7 9.0 77 -.9
1/ The financial institutions included in this table are the same as in the preceding table. The values of the totalcredit outstanding to the private sector given in this table will differ from the values of total loans and invest-ments outstanding to the private aector in the preceding table for the following reasonsi (i) credit to each otherby the financial institutions is included in this table; (ii) the data in this table do not include those invest-.ments by financial institutions for which no breakdown by industry is available. Also, a revision in the composi-tion of the financial institutions which granted these loans was made. The revision pertained onjr to the change. inconcept in the composition of the non-bank financial institutions. Additional revision was also made to include"other" loans and to exclude inter-bank transactions of development banks. These include also credits outstandingof private development banks which were classified in the various industry items starting 1965.2 Includes manufacturing, mining and construction.Including credits to some semi-government institutions which could not be segregated.V Loans to banks and other financial institutions. Also commercial loans by non-bank financial institutions.Loans by non-bank financial institutions which do not fall under the above classification.Starting January 1, 1968, data for commercial banks are based on DER Form No. 1 (Revised January 1, 1968) which ex-cludes credits to public sector under the industry classification.Z/ Starting 1968, data excludes loans, advances, discounts and overdrafts.d/ Includes advances to exports and imports trade which cannot be separated due to revision of form.j/ As of June 30, 1970.
Source: Presidential Economic Staff

Table 6 .6
Loans and Investments f the Government Service Insurance §Stem and Social Security System, 1965-1970(In million pesos)
Loans Investments
Items Grand Real 1/Lt/Total Total Estate Consumption Total Government Private
1965 1.1,80.6 936.9 688 248.6 5. 4.0 128.7Government Service Ins. System 1,060.0 744.9 . 229.5 315. 293.8 21.3Social Security System 420.6 192.0 172.9 19.1 228.6 121.2 107.4
1966 1 1,133.8 821. 2. 1. 367.9 193.tovernment Service Ins. System 1, j. 879.0 603.0 276.0 2 3r. 275.4 8.iSocial Security System 532.7 254.8 218.5 36.3 277.9 92.5 185.4
1967 1,969.4 1,0.1 1.006.5 33.6 529.3 329.9 199.4Government Service Ins. System 1,371.7 1,0808 702.5 378. 290.9 277.0 13.9Social Security System 597.7 359.3 304.o 55.3 238.4 52.9 185.5
1968 2,239.2 1.599.9 1152.2 47.7 639.3 376.8 262.Government Service Ins. System 1,V70.5 1,153.3 7714.5 378. 317.2 301.6 15.6Social Security System 768.7 446.6 377.7 68.9 322.1 75.2 246.9
1969 2,662.1 1. 75.7 1358.5 7.2 786.4 69.9 316.Government Service In. System 1,742.4 1,373.2 946.0 .: 3W2 353.7 .Social Security System 919.7 502.5 411.9 90.6 417.2 116.2 301.0
1970 October 2 938.6 2.141.3 1.465.4 6.9 797.3 8.3 313.0Government Service Ins. System 18586 1'77.7 1,09.3 . .9 .0 .Social Security System 1,080.0 663.6 45.1 207.5 4 616.4 118.3 298.1
Note: Data for private Insurance companies are not available1/ Mostly housing loans granted to members; hence all these loans fall under private credits.2) Mostly salary and policy loans to respective members.4/ Includes the -110 million 2-year Promissory Notes at 10% interest issued by the Development Bank of the Philippines
for matured time deposits and accrued interest with the Social Security System.
Source: Central Bank of the Philippines.
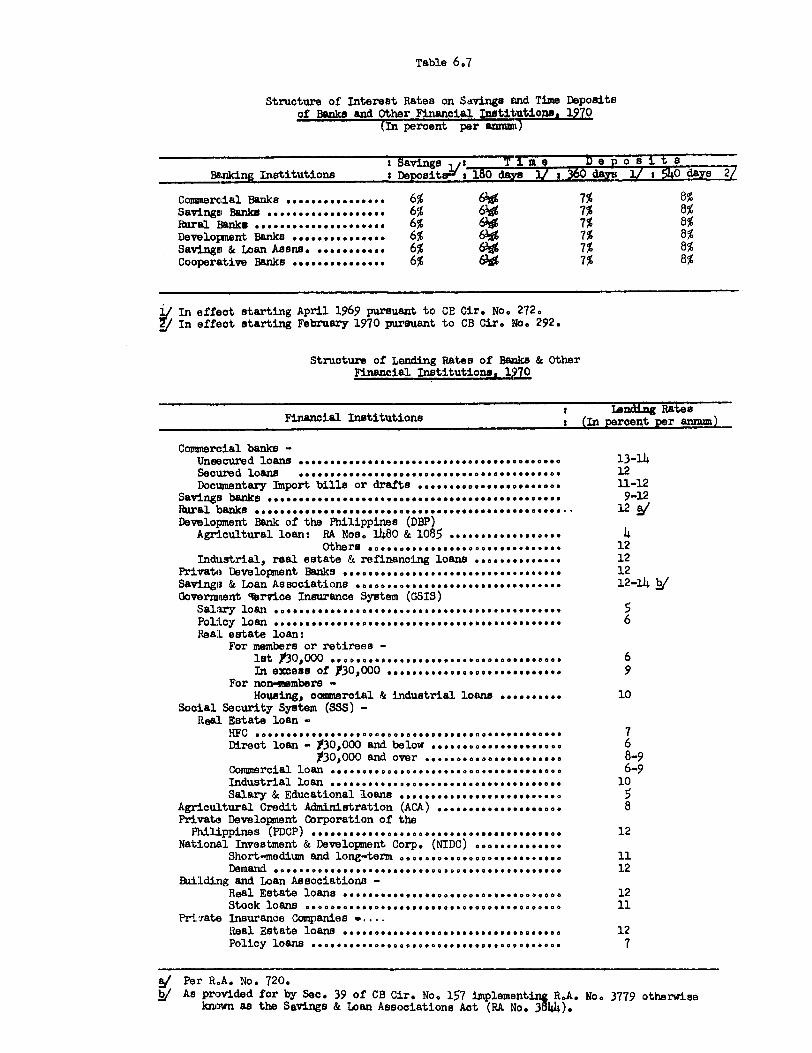
Table 6.7
Structure of Interest Rates on Savings and Time Depositsof Banks and Other Financial Institutions, 1970
(In percent per anrmm)
: Savings ,s Time DepositSBanking Institutions : Deositsw: 180 days 3/_360 days / 3 540 days 2/
Commercial Banks ................ 6% 61) 7% 8%Savings Banks ............. .0.. 6% 6 6 7% 8%Rural Banks .............. . 6% 6 0 7% 8%Development Banks ............... 6% 6 6 7% 8%Savings & Loan Asens. ........... 6% 6 % 7% 8%Cooperative Banks .............. 6% 61A 7% 8%
In effect starting April 1969 pursuant to CE Cir. No. 272.In effect starting February 1970 pursuant to CB Ciro No. 292.
Structure of Lending Rates of Banks & OtherFinancial Institutions, 1270
i olanding RatesFinancial Institutions (In percent per annum)
Commercial banks -Unsecured loans .............................***********, 13-1Secured loans ,, ..........,,..................... 12Documentary Import bills or drafts ......... ************.. 11-12
Savings banks ..................... .. ************ 9-12Rtural banks .......... ,...,,......... 12 gDevelopment Bank of the Philippines (DBP)
Agricultural loant RA Nos. 1480 & 1085 .................. 4Others ..........o........ 12
Industrial, real estate & refinancing loans .............. 12Private Development Banks ................................. 12Savings & Loan Associations ...., **..................... 12-14b/Government fervice Insurance System (GSIS)
Salary loan 5..*** *****************.Policy loan ** ****** *** ************************ 6Real estate loan:
For members or retirees -1st 130s000 .............................******* 6In excess of Y30,000 ........................... 9
For non-embere -Housing, cosmercial & industrial loans .......... 10
Social Security System (SSS) -Real Estate loan -
HFC .................. *******7Direct loan - Y30,000 and below ................ . 6
130,000 and over ................... 8-9Commercial loan *******************************.. 6-9Industrial loan ..................................... 10Salary & Educational loans ........................ 5
Agricultural Credit Administration (ACA) .................... 8Private Development Corporation of the
Philippines (PDCP) ........... o.....e,................. 12National Investment & Development Corp. (NIDC) o........o...
Short-medium and long-term .......................... 11Demand ... *********............12
Building and Loan Associations -Real Estate loans *................................ 12Stock loans ............................ 11
Prtrate Insurance CompaniesReal Estate loans o o...,* ......................... 12Policy loans ..................... 7
!/ Per R.A. No. 720.As provided for by Sec. 39 of CB Cir. No. 157 implementing R.A. No. 3779 otherwise
known as the Savings & Loan Associations Act (RA No. 3644).


Table 7.1
Actual Production for 1968, 1969 and 1970 andPhysical Targets of the Agricultural Program FY 1971-1974
(In 000 MT)
Commodity 1968 1969 1970 1971 17 19
Food Crops 9,235 9,303 10,667 10,950 11,620 12,342 13,127Palay 4,561 4,445 5,203 5,510 5,868 6,249 6,655Corn 1,619 1,733 2,008 2,039 2,202 2,378 2,568Fruits & nuts 1,372 1373 1,569 1,531 1,618 1,715 1,818Rootorops 1,305 1,338 1,313 1,392 1,413 1,434 1,456Vegetables 251 283 294 328 348 369 391Coffee 43 44 49 52 55 59 63Sorghum - - - 4 9 15 30Soybean - - - 2 5 16 34Others 84 87 84 97 102 107 112
Commerci4 Crops 3,946 3,917 3,843 4,406 4,583 4,718 4,910Copr 1,542 1,515 1,446 1,286 1,379 1,483 1,590Desiccated Coconut 56 49 102 100 104 108 112Sugar (Centrifugal -& Musoovado) 1,658 1,662 2,300 2,398 2,520 2,570 2,610
Molasses 503 504 - 151 550 566 583 600Abaca 103 106 124 141 143 145 147Tobaooo-Virginia 17 20 22 24 24 25 25Tobacco-Native 48 37 39 54 56 58 60Rubber 14 18 19 17 18 19 20Others 5 6 7 6 6 6 6
Total Crops 13,181 13,220 14,510 15,356 16,203 17,060 18,037
Forestry (logse)A 4,535 4,976 4,649 4,847 4,944 5,043 5,144
Fishery 1,300 1,034 1,141 1,511 1,599 1,691 1,789Commercial 559 468 539 645 682 722 764Fishpond 137 88 89 183 223 268 301Municipal & Sustenance 611 478 513 684 693 701 725
Livestock on Farm & Non-FarsPopulation (no. in 000)Cattle 1,990 1,971 2,032 2,210 2,290 2,380 2,470Carabao 4,580 4,806 4,875 4,920 5,100 5,280 5,470Poultry (Chicken) 93,310 85,038 77,519 102,500 108,500 113,600 120,760Hogs 8,820 8,826 8,974 12,440 13,960 15,600 17,470
Slaughtered (no. in 000)Cattle 235 262 271 300 318Carabao 481 535 554 631 675Poultry (Chicken) 73,640 82,900 89,200 93,500 101,167Hogs 7,440 9,380 10,130 10,940 11,817
Dressed Weight (in NT)Cattle 34,720 38,610 40,000 -44,320 46,980Carabao 85,050 94,560 97,980 111,500 119,190Poultry (Chicken) 88,370 99,530 107,040 112,150 121,350Hogs 335,530 422,670 456,480 493,000 532,440
Fresh Milk 9.41/ 145.4 225.1 311.5
Poultry Eggs 95. 112.6 123.9 128.1 137.4
1/ Bank mission estimate.
2/ In million board feet.
j/ Program of Production of Animal Protein prepared by the Bureau of Animal Industry, April 1970.
SOURCES: Bureau of Agrioultural EconomicsFour Year Agricultural Development ProgramPhilippine Fishery Commission

Table 7.2
Avrage Gr h Rae of Nor idoultural Prodats
( Percentage)
Four-Year
Actual Growth Rates Projections Development____ __I_____ ____ ___ Plan
FodCos0.6 66.2'M.," addy) -!1Corn 4.2 7.2 7.0 8.8 8.0Fruits and Mite. 10.0 4.2 0.3 5.8 6.0Rootorops -1.5 -5.3 2.5 1.2 1.5Vegetables 4.5 2.8 8.7 6.1 6.0Coffee 4.5 -0.1 7.3 6.4 6.6Sorgham - - - - 72.2Soybeans - - - - 127.5
Swort. Crop& 3.9 1.6 5o 51 3.7epra rIT 17. SO T T1TDesiccated Coconut -0.7 -3.6 -11.7 4.2 3.9Sugar (centriagal and
IbecovadO 3.0 0.8 0.4 7.6 3.8Molassees 5.1 6.7 0.4 2.7 3.0Abaca -1.6 -8.3 1.5 1.6 1.14Tobacco - Virginia -6.7 0.4 14.4 0.8- 1.4Tobacco - Native 6.0 18.5 -2t.3 14.3 3.6
Fihery (Total) 10.9 12.0 1005 7.6 8.0
Forestry-Lgo 7.7 22.0 4.2 (5.0 2.0Lamber -0.3 -6.6 - n.d &- n.d.Plywood 15.1 5.2 - f/ nd. n.d.Veneer 26.0 17.1 - n.d. n.d.
IUestook PopulationCale 3.8 3.5Carabao 3.9 3.6Poultry 11.0 9.0Hogs 10.5 8.5Other- 1.0 1.0
a/ Bureau of Agricultural Eoonada.S' Presidential. onomic Staff.; The-Revised Agricultural Development Program F! 1969-73, Presidential &onomic Staff,
Agricultura;lPiogram Office, Jan. 1969.4/ Four-Year Development Plan for the period FY 1971-74. Prepared by IntAftgency ,Comdtthe,
March 1970.e/ Timber cut to decelerate by 5.0 percent yearly from a high attained in 1968 and domestic
processing of- logs to accelerate from 40 percent in 1969 to 80 percent in 1973.f/ Forestry Statistics show an increase of lumber production from 432,921,000 bd. ft. in 1967/68' to- 620,975,000 bd,. ft. in 1968/69, decline of plywood from 695,034 to 523,8'66 sq. ft. and, of vender
a decline froll,205,910 sq. ft. to 627,271 sq. ft. in the same period.
n.d. * no data.

Table 7.3
Loans Granted and Outstanding to Agriculture by Financial Institutions, 1965-70(In million Pesos)
Gr a-n ted O u.t tan dingDevelop- Other Develop- Other
End of Rurall/ ment Cowmergl Rura ment 2/ CommerqlPeriad Total AGLF ACA Banks- Banks Banks- Total AGIF ACA Banks- Banks Banks-
1965 1,429.5 - 10.2 215.5 62.2 619.2 522.h 1,575.1 - 86.6 -167.4 293.3 569.4 458.4
1966 1,615.6 - 16.3 247.4 91.0 665.4 595.5 1,681.h - 88.2 198.5 316.6 630.1 648.0
1967 2,065.1 16.6 31.6 318.3 147.6 815.7 735.3 1,932.6 n.a. 96.7 259.4 374.5 751.8 450.2
1968 2,216.8 15.3 29.6 362.8 158.9 858.2 792.0 2,317.5 15.2 106.7 302.8 430.2 857.7 6ok.9
1969 2,261.1 8.3 23.6 408.5 115.0 903.1 802.6 2,501.8 16.7 106.6 325.6 474.9 923.1 654.9
1970 1,653.3 5.92/ 41.4 370.32/ 59.5-Y 579.2/ 596.89/ 2,588.2 17.5/118.8 380.8 / 481,.04/ 897.87/ 689.3f/
1/ Mcluding loans granted and outstanding under AGLF.2/ Data from 1965 to 1967 include credits to semi-government institutions. Starting January 1, 1968 data are based on
DER Form No. 1 (Revised January 1, 1968) and exclude credits to public sector.
a/ Tentative (January - September 1970).b/ As of September 1970, tentative.c/ January to October 1970.d/ October 31, 1970.e/ January to September 1970.T/ January to June 30, 1970.
Source: Presidential Economic Staff,


Table 8.1
Met Value Added in Manufacturing by Type of Products 1965 to 1970(In million pesos at current prices and 1955 constant prices)
SIC 1965 1966 1967 1968 1/ 1969V 197 0Major Type of Product Current Constant Current Constant Current Constant Current Constant Current Constant Current ConstantGroup Prices Prices Prices Prices Prices Prices Prices Prices Prices Prices Prices Prices
TDTAL OET VALUE ADDED 3.213 2,209.3 3,4~72 2,318.2 3,832 21.461 4~.251 2,595 4,64.8 2,690 4~.78 4 2,74~3
Consumer Goods 1,853 1,312.1 1.942 1,311.7 2.296 1.475 2.589 1.580 2,857 1.653 2.831 1,623
20 Food, except beverages 875 582.2 897 541.0 1,123 721 1,262 770 383 8oo 1,356 77821 Beverages 264 214.6 301 242.7 261 168 274 167 305 177 353 20222 Tobacco 150 122.0 159 128.2 172 111 204 124 227 131 224 12823 Textiles 152 105.9 156 106.6 186 119 224 137 251 145 237 13624 Footwear, other wearing
apparel and made-uptextile goods 226 157.6 245 167.5 318 204 385 235 415 240 385 221
26 Furniture and fixtures 45 31.4 55 37.6 54 35 55 34 62 36 67 3828 Printing, publishing
and allied products 131 91.4 119 81.3 170 109 172 105 20% 118 195 11229 Leather, leather pro-
ducts and fur productsexcept footwear andother wearing apparel 10 7.0 10 6.8 12 8 13 8 10 6 14 8
Intermediate Goods 1.118 768.9 1.258 863-9 1,212 778 1,330 812 1,423 824 1.575 903
25 Wood, cane and corkproducts 149 103.9 160 109. 4 175 112 182 111 197 114 214 123
27 Paper and paper products 66 46.0 77 52.6 56 36 75 46 88 51 90 5230 Robber products 94 65.5 114 79.5 112 72 112 68 126 73 138 7931 Chemicals and chemical
products 292 20.0 349 247.2 305 196 370 226 379 220 420 2133 Non-metallic mineral
products, exceptproducts of petro-leum and coal 142 73.6 148 81.5 149 96 162 99 188 19 196 112
35 Metal products exceptmachinery and -ans-part equipmentV 209 145.7 211 164.7 234 150 249 152 251 145 295 169
39 MiscWllaneous mamac-tured productsX 166 129.2 169 129.0 181 116 180 110 196 112 222 127
Mechanical Goods 242 128.3 272 142.6 324 208 332 203 36 213 378 217
36 Machinery, except elec-trical machinery 36 19.1 14 23.1 27 17 23 1L 42 24 4 25
37 Electrical machinery,apparatus, appliancesand supplies 117 62.0 125 65.5 155 100 154 9h 165 96 176 101
38 Transport equipment 89 47.2 103 54.0 12 91 155 95 161 93 158 91
1/ Revised estimates as of April 15, 1970.E/ Preliminary estimatis as of A,ril !5, 1970.3/ Advance estimates as of December 16, 1970 based on trends established by available figures tp to the end of third quarter 1970.E/ Includes basic metal products (SIC 34).T/ Includes products of petroleum and coal (SIC 32).
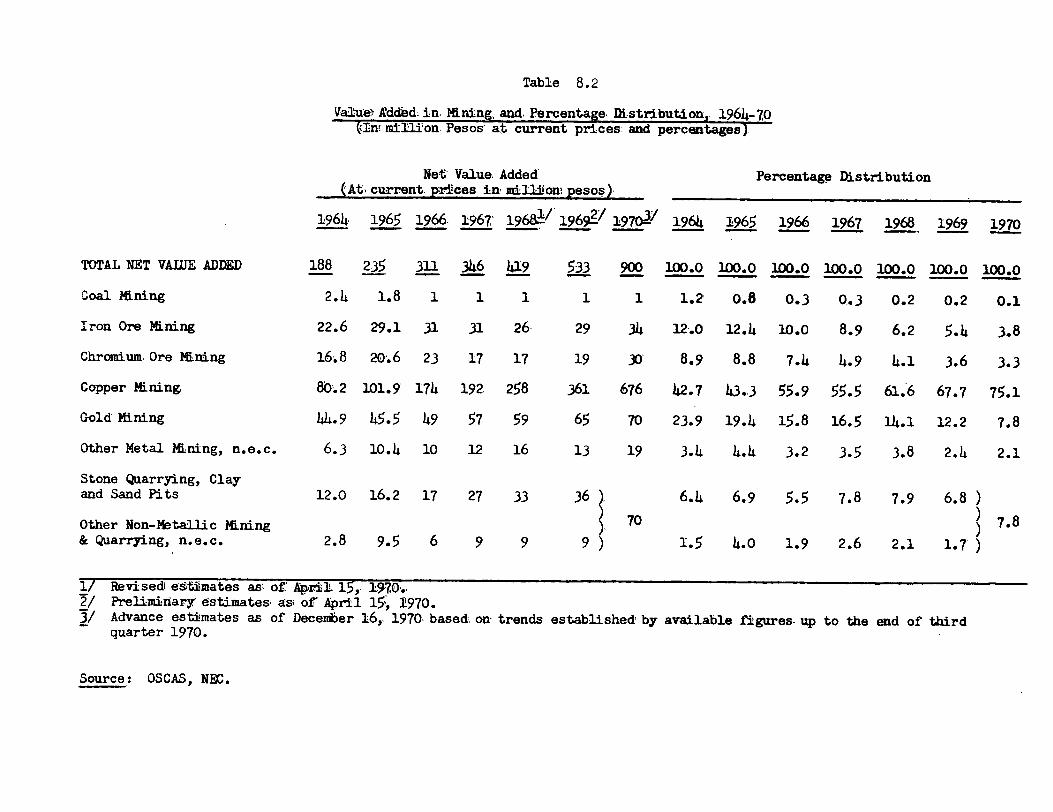
Table 8.2
Value Agdded in. Mining, and. Percentage. Distribution, 1964-70QIn- million Pesos, at current prices and percentages)
Net Value.Added Percentage Distribution(At current. prices in,milliinmpesos).
1964 1965 1966 1967' 19 6 81 19 69? 19703 1964 1965 1966 1967 1968 1969 1970
TOTAL NET VAUE ADDED 188 235 311 346 419 533 900 100.0 100.0 100.0 100.0 100.0 100.0 100.0
Coal Mining 2.4 1.8 1 1 1 1 1 1.2 0.8 0.3 0.3 0.2 0.2 0.1Iron Ore Mining 22.6 29.1 31 31 26 29 34 12.0 12.4 10.0 8.9 6.2 5.4 3.8Chromium. Ore K-ning 16.8 20.6 23 17 17 19 30 8.9 8.8 7.4 4.9 4.1 3.6 3.3Copper Mining. 80.2 101.9 174 192 258 361 676 42.7 43.3 55.9 55.5 61.6 67.7 75.1
Gold Mining 44.9 45.5 49 57 59 65 70 23.9 19.4 15.8 16.5 14.1 12.2 7.8
Other Metal Mining, n.e.c. 6.3 10.4 10 12 16 13 19 3.4 4.4 3.2 3.5 3.8 2.4 2.1
Stone Quarrying, Clayand Sand Pits 12.0 16.2 17 27 33 36 6.4 6.9 5.5 7.8 7.9 6.8 )Other Non-Metallic Mining 70 7.8& Quarrying, n.e.c. 2.8 9.5 6 9 9 9 ) 1.5 4.0 1.9 2.6 2.1 1.7 )
1/ Revised estimates as of April 15, 1970,2/ Preliminary estimates asi of' April 15, 1970.3/ Advance estimates as of December 16, 1970. based on trends established by available figures, up to the end of thirdquarter 1970.
Source: OSCAS, NEC.

Table 8.3
Mining Production, 1966-70(Value in thousarxi pesos at current prices)
1/Unit of 1966 1967 1968 1969 1970/Item Measure Quantity Value Quantity Value QuaValue Quantity Value Quantity Value
Total 43 5148 301 9,0 ,5 2,0 7,4 9144 366 l' 491,56Gold Fine ounce 653,546 6:257 490,557 9O i5h1 527,355 1i292 571,5 1 240 582,177 123,-14USilver I n 1,162,889 5,771 1,368,976 7,533 1,574,782 13,256 1,561,312 10,502 1,648,444 15,011
Base Metals:
Iron ore Metric ton 1,475,187 56,258 1,477,751 56,209 1,353,218 47,18 1,561,466 53,684 1,837,126 80,679Chromite ore l n 560,120 462,-6h5 419,823 31,467 439,177 31,876 469,431 34,186 567,432 62,347Copper (metal) 73,758 316,996 85,846 349,533 110,275 469,639 131,426 657,504 162,696 1,165,443Manganese ore f t 56,093 3,987 80,189 5,652 66,043 4,644 20,002 1,499 6,671 859Lead (metal) n n 92 121 89 108 84 105 67 79 14 24Zinc (metal) it it 1,648 2,087 1,485 1,792 2,242 1,894 3,286 4,080 3,308 4,652Quicksilver (metal) Flask 2,443 3,958 2,611 4,803 3,544 7,178 3,478 6,586 4,289 9,909
Non-metallics:
Coal Metric ton 89,610 1,757 69,753 1,616 32,150 898 53,341 1,157 48,007 1,140Sand and gravel Cubic meter 1,267,694 6,527 2,683,917 12,920 3,323,870 18,234 4,307,832 22,571 n.a. n.a.Salt Cavan 3,653,700 16,021 2,311,760 12,531 4,338,300 17,453 4,623,740 28,684 4,438,800 27,946Silica Metric ton 234,872 2,925 311,440 3,478 429,226 4,190 637,816 5,595 n.a. n.a.
1/ Preliminary estimates
Source: Bureau of Mines

Table 8.4
Indices of the Physical Volume of Manufacturing Production, 1962-70(1955 = 100)
January - June Percentitem 1962 1963 1964 1965 1966 1967 1968 1969 1969 :970 Change
Manufactures 169.7 180.5 195.5 200.9 218.6 226.6 247.7 256.3 256.8 254.0 -1.1
Non-durable manufactures 165.6 174.9 186.8 193.3 211.6 217.7 237.9 246.0 245.5 247.6 0.9- Manufactured food products, except beverages 172.14 177.4 184.9 201.1 209.7 224.3 227.1 236.5 240.0 232.2 -3.2Slaughtering, preparation and preservation of meat 284.8 519.0 573.9 727.3 71h.2 91.8 1,234.8 1,048.3 1,032.3 1,031.8 -0.1Dairy products 168.3 184.3 210.6 175.7 174.5 178.2 213.2 257.5 268.9 295.3 9.8Processed fruits and vegetables 184.8 169.9 172.7 252.1 227.6 237.1 242.6 262.7 241.0 251.2 4.6Processed fish products 192.2 197.6 196.1 193.5 257.4 281.9 269.6 241.3 223.8 202.4 -9.6Bakery products 141.3 166.6 161.8 154.5 151.9 165.9 172.3 197.7 197.7 145.7 -26.3Cocoa chocolate, coffee, sugar and confectionery 118.4 131.6 151.0 179.3 188.9 201.1 192.3 203.3 230.5 231.6 0.5Miscellaneous food preparations 195.2 188.5 191.0 194.9 212.2 220.4 217.8 225.2 224.3 214.0 -4.6
- Beverages 177.4 205.0 217.9 226.6 249.14 251.2 323.3 340.2 339.9 362.0 6.5Distilled spirits 174.3 221.1 267.9 315.0 398.3 421.4 490.7 5314.6 523.8 626.o 19.5Wine 125.4 133.8 153.6 104.3 104.0 101.5 131.7 149.9 154.2 183.2 18.8Beer 246.8 323.9 346.1 380.2 384.6 385.6 525.4 528.4 531.1 483.5 -9.0Soft drinks 133.7 124.7 123.4 110.2 133.4 131.3 160.5 181.1 180.6 232.6 28.8
- Tobacco ppducts 123.5 120.9 146.2 159.6 187.1 181.1 210.3 193.3 207.4 194.1 -6.4- Textiles / 296.2 321.7 338.0 328.9 343.4 3144.0 332.4 332.6 323.9 323.2 -0.2- Footwear, wearing apparel and other made-up textile goods 50.14 51.0 49.5 51.0 51.1 51.2 50.9 49.3 40.9 51.8 26.6
Footwear, except rubber 58.1 76.4 64.9 65.1 68.14 73.9 72.0 75.2 47.8 85.0 77.8Wearing apparel 32.7 37.3 314.8 40.2 40.1 37.8 38.0 314.3 33.0 34.9 5.8Other made-up textile goods 443.5 159.3 285.5 197.9 167.5 180.7 182.5 187.14 184.1 166.8 -9.4- Paper products 211.0 250.7 2514.1 254.4 263.7 269.2 227.3 226.4 228.6 210.9 -7.7Pulp paper and paper board 209.9 301.8 239.2 270.0 253.2 272.1 247.8 244.2 260.1 196.4 -24.5Manufactured articles of paper and paper board 211.4 232.5 259.5 248.8 267.5 268.2 220.1 220.1 217.4 216.1 -0.6Printing, publishing and allied industries 103.6 83.4 77.7 75.9 80.6 78.8 72.3 78.5 72.0 94.7 31.5Leather products except footwear 154.5 159.0 158.9 147.2 131.5 127.9 122.9 1145.1 106.6 156.6 46.9Rubber pro cts 9 222.3 229.5 254.6 268.1 265.2 323.6 392.0 407.5 441.2 373.2 -15.14Chemicalsop 155.4 167.9 173.8 187.9 196.1 199.4 197.0 207.9 198.14 213.0 7.3Manufacture of miscellaneous products of petroleum and coal 175.8 173.0 181.8 161.0 208.14 231.5 282.7 328.14 3114.7 327.0 3.9Miscellaneous non-durable manufactures 133.4 75.6 1014.1 84.0 102.2 103.6 117.4 114.8 136.3 82.9 -39.?
Durable manufactures 189.3 207.5 237.3 237.14 251.9 269.1 294.7 305.1 310.8 284.3 -8.5- Wood and cork manufactures, except furniture and fixtures 121.7 167.9 142.1 151.2 188.3 ?14.1 277.1 234.1 273.8 224.7 -17.9Furniture and fixtures 120.3 131.7 170.8 1514.1 1114.1 1145.6 1214.3 100.8 122.3 64.6 -47.2
- Non-metallic mineral products 204.8 210.0 238.8 269.2 287.9 297.3 326.4 329.9 329.2 3140.3 3.4Clay and cement products 267.2 284.9 297.9 340.4 1414.8 1427.0 469.9 496.2 1475.0 531.2 11.8Concrete products 340.7 385.5 429.5 436.9 789.6 725.9 740.9 718.1 733.8 750.3 2.2Glasswares and glass containers 195.2 180.4 194.9 253.6 231.14 252.0 326.0 298.8 278.8 3140.9 22.3Plate and sheet glass products 28.1 27.5 27.0 19.0 23.8 19.7 144.9 58.6 35.9 15.3 -57.14Cement 205.2 214.8 249.8 271.8 281.9 289.8 299.9 314.1 318.0 313.9 -1.3Asbestos products 107.9 120.2 166.7 161.5 131.5 194.1 20)4.9 295 .3 h05.2 ?.i: -1i2Limestone products 92.3 122.2 101.4 263.2 572.3 635.3 1,224.8 704.7 751.2 842.2 12.1
- Metal products, except machinery 272.5 269.7 304.2 330.2 347.2 347.5 335.9 371.5 354.7 314.3 -11.4- Manufacture of machinery, except electrical machinery 122.5 121.8 178.0 97.3 151.1 181.9 175.2 103.2 98.7 100.7 2.0- Electrical machinery, apparatus appliances and supplies 273.4 316.9 356.7 323.6 340.14 1412.5 437.5 501.1 507.14 522.5 3.0- Manufacture of transport equipment 97.3 142.7 196.1 145.0 154.8 173.4 234.1 229.2 251.7 188.0 -25.3- Miscellaneous durable manufactures 119.5 92.3 57.1 50.9 42.6 59.1 54.3 83.0 78.5 83.9 6.9
1/ Includes floor covering.2/ Includes rubber shoes.I/ Includes fertilizers.
Source: Cooperating government agencies and private firms.

Table 8.5
Capacity Utilization in Selected Manufacturing Industries1966 to 1970
1966 1967 1968 1969 1970
FERTILIZERS(Metric tons)
Production Capacity 727,000 816,600 816,600 816,600 816,600Actual Production 140,769 286,7751 225,72h3/ 266,025 203,5 394
CEMENTTMIlion bags of 50 kilos each)
Production Capacity 60.72 73.92 91.92 126.72 110.5Actual Production 39.36 49.75 61.63 101.16 57.77/
IRCN & STEEL(Metric tons)
Production Capacity 759,200 847,200 1,302,760 1,339,000 n.a.Actual Production 329,668 356,863 366,416 672,479 n.a.
GLASS & GLASS CCNTAINERS(MeT c tons)--
Production Capacity - - - 199,509 n.a.Actual Production 122,366 129,000 137,500 146,000 n.a.
SUGARTIT short tons)
Production Capacity - - - 1.760 3.029Actual Production 1.538 1.724 1.750 1.900 2.124
PAINT(Thousand Gallons)
Production Capacity - - . - -Actual Production 6,674.638 8,464.724 8,251.850 6,362.000 3,793.0-
BASIC CHEMICALS(Metric tons)
Production Capacity 1,028,900 1,028,900 1,028,900 n.a. n.aActual ProductionL 447,387 545,998 192,074 186,670 204,059
TEXTILESTThousand yards)
Production Capacity 400,900 n.a. n.a. 482,680 n.a. 5Actual Production/ 159,704 185,146 216,415 226,529 192,006-
1/ Excluding ESFACf/ Excluding General3/ Includes only caustic soda and sulfuric acid 1968-19705/ January-Feptember only9/ January-November only6/ Includes only rayon and cotton fabrics7/ Million bags of 94 lbs. each
SOuces Presidential Economic Staff.

Table 8.6
Indices of aployment in Manufacturing and Mining 1962-1970
MANU FA C TUR ING 1/1962 1963 1964 1965 1966 1967 1968 1969 1970
Food 104.4 110.2 115.8 124.1 121.9 120.8 125.6 125.6 128.6Beverages 114.8 114.8 118.9 121.8 128.5 136.6 138.8 143.4 149.2Tobacco Manufactures 126.3 124.8 135.5 140.9 141.8 158.5 168.1 186.4 181.2Textiles 198.7 211.3 211.0 213.5 211.4 214.9 222.5 235.4 236.4Footwear & Wearing 97.0 102.5 104.4 98.9 94.3 95.1 104.7 111.8 119.3Wood and Cork 96.0 97.4 100.4 103.2 105.4 107.1 106.6 103.5 94.1Furniture & Fixtures 90.4 96.1 96.3 94.1 99.4 100.3 96.5 98.4 100.2Paper & Paper Products 103.4 103.3 98.6 95.5 92.2 93.5 94.9 99.0 100.5Printing and Publishing 131.8 128.0 129.2 126.7 121.3 121.7 121.7 118.4 117.5Leather & Products 14-1.7 132.0 131.4 135.0 127.1 129.8 129.7 147.8 154.1Rubber Products 137.3 131.2 125.6 130.6 134.3 135.6 121.5 111.4 114.6Chemical & Products 119.8 122.6 119.6 122.6 125.4 126.0 122.1 123.1 118.0Non-Metallic Mineral Products 111.0 106.7 104.8 104.5 97.2 102.7 102.0 103.0 104.3Metal Products 215.6 215.0 184.4 185.9 179.1 152.5 156.1 153.0 154.4Machinery 95.6 98.8 102.4 103.0 92.1 107.9 127.6 108.8 112.6Electrical Machinery 382.4 354.0 250.0 192.1 177.9 159.2 101.4 80.9 87..8Transportation Equipment 86.6 86.9 89.4 88.2 84.5 85.3 97.7 94.8 94.2Others 137.7 127.3 125.1 127.1 120.6 111.1 117.,6 127.6 130.7
118.8 121.3 123.3 127.0 125.6 127.2 130.6 132.5 132.7
MINING
Coal 58.8 59.9 58.4 42.3 38.5 44.? 47.0 42.1 43.3Chromite 145.8 150.5 144.3 133.4 155.2 169.5 206.5 180.0 219..4Gold 75.6 75.2 77.4 83.3 83.3 83.1 82.5 80.7 78.1Iron Ore 68.2 79.9 75.4 87.5 84.8 82.2 7.2.5 72.2 70.2Copper 106.0 109.2 113.4 116.1 120.2 129.0 144.9 148.4 163.1Manganese 61.9 18.2 22.7 13.8 6.3 2.9 ?.9 2.9 2.9Crude Petrol & Natural Gas .71.4 91.7 94.3 25.0 17.1 17.1 17.1 17.1 17.1Non-Metallic 56.7 31.3 30.2 47.2 60.0 61.2 62.7 63.6 59.2
76.5 77.4 77.6 83.6 84.7 85.3 85.4 83.5 83.8
1/ Jnuary to.September average
;urce: Central Bank of the Philippines.

Table 8.7
Actual and Projected Value Added in Manufacturin%, 1968 and 1974(In million pesos aT 1968 prices)
ProJected Projectedrate Projected value
Value Estimated of annual value addedadded elas- growth 2/ added 1974 at
Category 1968 ticity 1/ percent 1974 1967 prices
Total Manufacturiny 4,147 5.13 5,6o 59443
Consumer Goods 2309 5.19 3,136 39048
Food, except beverages 1,072 0.89 5.28 1,460 1,419Beverages 377 1.1.5 5.80 529 514Tobacco 200 1.17 5.84 281 273Textiles 180 0.70 4.90 240 233Footwear, other wearingapparel and made-uptextile goods 268 0.43 4.36 346 336
Furniture and fixtures 60 0.41 4.32 77 75Printing, publishing& allied products 142 0.88 5.26 193 188
leather, leather prod.and fur products,except footwear &other wearing apparel 10 0.00 0 10 10
Intermediate oods 1524 5.06 21043 1,985
Wood, cane and cork,& products 208 1.36 6.22 298 290
Paper and paper prod. 95 1.06, 5.62 131 127Rubber products 135 0.84 5.18 183 178Chemicals & chem. Prod. 419 0.91 5.32 572 556Non-nmtallic mineralprod. except productsof petroleum & coal 188 1.23 5.96 214 208
Metal prod., except machi-nery & transport equip. 265 0.45 4.40 343 333Miscellaneous manu. prods. 214 1.21 5.92 302 293
Capital Goods 314 5.05 422 410
Machinery, except electri-cal machinery 54 1.14 5.78 76 74Electrical machinery,apparatus, appliances andsupplies 132 0.25 4.00 167 162
Transport equipent 128 1.10 5.70 179. 171{ Proportionate change in value added divided by propertionate change in gross
national product during 1966-68.2/ Calculated by the formulas d-p+ir , where d - projected annual growth rate;
p - expc3ted rate of population growth (3.5 percent); i - expected annual rateof increase in per capita gross national product (2 percent); f - elasticity inrelation to gross national product.
Sources Calculations based on available data.

Table 8.8
Estimated IMport.Dependency of Manufacturing Suppliesq 1963 - 1968( I*orts as percent of total supplies )
19631 614 19 1966 1967 1
.Total Manufacturing 4. 4 51.9
Consumer Goods 25.9 27.4 29.6 28.4 31.4 28.9
Food 30.2 34.4 0.9 34.8 39.1 32.6Beverages 1.5 1.7 2.2 1.3 i.8 1.6Tobacco 4.3 2.2 2.6 6.5 9.4 i2.3Textiles 52.9 51.4 49.8 62.1 58.5 66.9Footwear, lothbr wearing
apparel and madi-ptextile gbods 4.2 6.9 4.6 3.9 1.5 1.5
Furniture and fi2tures 17.3 17.3 11.8 11.3 -14.5 17.8Printing.,publishing andallied products 0 0 0 0 0 0
Leather,,leather productsand fur products 20.0 35.7 28.6 28.6 31.3 33.3
Intermediate (Goodi 50.0 55.0 53.6 52.5 514.6 54.3
Wood,cane and cork 2.0 3.2 3.2 2.4 i.7 1.4Papet and paper pioducts 56.2 61.8 58.2 58.4 59.4 56.6Rubber products 27.9 32.1 29.3 29.2 26.2 24.2Chemicals and cheidcalproducts 68.8 70.9 68.0 65.7 67.2 68.0
Non-metallic iineral;products 21.5 25.6 20.7 22.5 22.9 19.7e&tal products, exceptmdachinMi;y and transpoftV'fipmefftn 6i.o 66.0 64.0 62.9 66.2 67.4
kiel,1nbon-s manufactuked:ye'o7ucts 28.2 37.2 42.0 40.7 0.4 42.0
oG!t OR.Go8ds 714.0 80.1 81.6 81.0 4.3 81.6
khfehinery except electricaliachinery 92.1 93.7 93.9 93.1 95;0 94.5
-EIctrical machinery,apparatu,s:pliances and suplies 48.7 58.3 61.3 52.8 57.5 64.1
TFansport equipinht 66.7 76.5 79.2 80.6 8i19 81.4
NAo': Total su.ply rer6sebts domestic value added plus imports of corresponding category.
1/ Includes products of pdtoleum and coal.
Soikr&6: Calculated ffom information submitted by the National EconobMic Council, andCentral Bank of the Philippines.

ТаЫ е 8 � 9
Invest п�ent Re9ulreme л ts of Proiecta Approved Ьу 1he Воагд of Investmentsfrom Ju1y 1, 19Ь8 to Dec. Э1, 1969
Imported Fд ulpment Im.estment'Pota1 Tota1 Imported ав ретс епt of То Ьа1 р ег- lerson
inve вtmaл t �gilnmertt �qulpment Tota1 Invaat. Totn1 Еаи 1д . � i1_oyment � el г� loYSгSI..
Tota1 ManuTactur] п 2 1 2. 1,77 ь.Эы 1 Ь . б � .� }1 Q� } 2 721 "'�
Сопеитв г ооод в 22 и.ЬЧ 1� ! 3 12 .1 о '� 1.2 1о ы2 г� .1
г� Llvestoc к о.7о U.)7 о.37 52. Ч �oU.o 3ы 1ы.1 гвапапав 4 �зз 1.7ь о.9ь 2г.г 54�5 езz s: гя] се 10. ЧЧ 10. В6 10.86 98.8 100.0 j11 ?5 � :Магl пе producLs 1Э0 �44 10Э� 5Э Ь8. Ь4 52 � Ь ЬЬ� Э 4,2 Э6 Эи� ыСаега va etaroh 1.71 0.81 0.6 Э ЭЬ� 8 77 � 8 б84 I � '%Processed coconut 14.13 8.81 5 � 17 ЭЬ� Ь 58 �7 г,275 6 � гсоглвсагсn Эь.4о Э1.94 ц .чб би.з Ье.е ь1и ыы.ыProcesaed food 12.05 9.38 Ч.15 75 � 9 97 � 5 410 2� � 1�
71 г C1oLhing & Foot нearFoot нear 9. Ч4 6.86 6.36 64 � 0 92 � 7 1,U86 у.:'
Intermedlste Goode 1 В. 78.74 1'> U. 1 22.2 81 � � Т 1 76 L27.'t
25 Wood, Cane & Cark, excepLfurnlture
яатlе (1nte� raLed) 18. чз 17.ыы 17.88 ч4�5 1ои.о ги5 чг.+Fпrest products (plywod, veneer, etc � ) 134 � 91 ].1 ы.86 102.U8 76.7 85 � Ч �� .556 27 � 7
27 Yapor апд Рарвт ProducteРи1р апд Рарег 308. и7 256.71 256.71 8Э. Э 10 и. и 1,21(! ?5 Э. г1
Э1 Chemlcala
Industrlal сhетl саl в 7Ч� 72 74 � Э7 70.1 о ы7.9 93 � 3 ыЭ7 95. гF1ne chemical в 1U.14 8. В0 8.8U 86.8 100.U 5 2,028. иActlvated сагЬол 1. ЭЬ 1.17 1.17 86.0 100.0 29 4Ч.�iCoconut oi1 22 � U9 19.11 17.24 78.0 90.2 г03 .�оы. бAnt]ьlotlcs Ь. Эо 5.оо 5.оо 79�4 1ао.о гг2 ze.1,Synthetlc bags 22.89 19 � 58 19.44 84 � 9 99 � Э ], и1о гг.7
32 Petroleum Productsl.ubricating о11 99� Ь2 99 � Ь2 99 � Ь2 10o.U 1o0.U 1ыи S53 � L
33 Non-meta111c Мl пнгаl вСеr атl св 12.40 11.62 11.19 90.4 9 Ь� 3 486 2.6C1aes ргодисt; з 41.54 28.95 28.22 67 � 9 97 � 5 764 5L �LD] м егнаге � SS �55 � 37 Ь7 � Э Ь7 � Э 32 17.2
34 Meta1 ManufacWresAluminum, атеlL вд 77. Ы 58.89 44 � 85 57 � 8 76.5 Э7г 207 � 5Рг]mary aLee1 486. Оо 414.9 о 41L.90 85.4 1оо.о 615 ;г�о.гСп1д- гоll ад etrlpe елд co11s 322. о8 241.29 241.29 74 � 9 1оо. о 917 з51.2иlckot ]85.86 17U.67 141.12 75 � 9 82.7 1,45 Ь i.г2.7
Э5 MeLu1 Рr пдгю t е oxcept тn аМl пл гуMor.a1 prnduot@ k елкl поог�г�� 4ы. ь7 4z.4ь 1,z.z5 86. ы 99.s l, ы�� 9ч. �,l г1 n ппгидr е
Capltal боодв 4J.50 1� 11. 1 26.U 'J� .2 2,4G8 1� Ь
ЭЬ Mach]nery k Cap.ltal Equlpment 8.56 7.11 7.07 В2. Ь 9Ч.4 546 1 Э._Э
Э'Г Electrlcal EqulpmentCommunlcatlona equlpmant � 4U .40 .4 о 100.U 100.0 Ь79 .бкlеоti гl саl equlpme пt 8. о4 4.1z з�е4 47 �8 9Э.2 !4з 5ь.г
Э8 Tranaport Byulpment 2Ь� SU - - - - 1,000 26. �
9аи гсе г Elaborated Лкr� т data submltted by the Воагд о1 I лveatments.


Table 8.10
Fourth Investment Priorities Plan of the Board of Investments-Investment Requirements, Value of Output, and Employment
(In million pesos)
MANU FACTURING
InvestmentInvestment Requirements Per Person
Capital Value of Ehploy- EmployedTotal Equipment Others Output ment 1/ (thou. pesos)
TOTAL MANUFACTURING 4,560.71 3,390.07 1,170.64 2,561.15 19 288 236.5
CONSUMER GOODS 69.75 36.92 32.83 52.70 1,115 62.6
Food 69.75 36.92 32.83 52.70 1,115 62.6
Fruit & vegetables 7.65 6.09 1.36 3.00 46 161.9Tomato paste .67 .46 .21 .21 10 67.0Processed fish 1.45 .75 .70 4.42 50 29.0Dairy products 1.61 .96 .65 2.41 20 80.5Agar-agar 4.30 2.89 1.41 2.76 19 226.3Dextrose 3.16 1.77 1.39 .99 10 316.0Cattle 3.05 .19 2.85 .53 8 381.2Fish (deep sea) 3.26 2.83 .43 1.78 76 42.9Fish (inland) 1.67 .99 .68 1.30 33 50.6Hogs 2.16 .12 2.04 2.30 11 196.Poultry: Meat .13 .02 .11 .34 7 18.6
Eggs .19 .02 .17 .51 9 21.1Chicks .63 .13 .50 .79 13 48.5
Shrimps: Deep sea 3.99 3.14 .85 2.46 109 36.6Inland 1.67 .99 .68 1.33 33 5.1
Processed grain 4.90 3.90 1.00 8.42 66 74.2Rice 13.90 7.48 6.42 11.05 186 74.7Corn 2.90 .46 2.45 1.10 109 26.6Soybeans 4.03 1.14 2.89 2.32 112 36.0Peanuts 4.60 1.45 3.15 3.29 112 41.1Sorghum 4.03 1.14 2.89 1.39 112 36.0
INTERMEDIATE GOODS 4,352.26 3,266.06 1,086.20 2,292.01 11,700 372.0
Wood, cane and corkfurniture 132.05 106.72 25.33 125.91 2,208 59.8
Ramie 30.00 27.00 3.00 31.00 1,316 22.8Wood chips 1.71 .88 .83 1.08 47 36.4Plywood 15.46 11.57 3.89 25.14 299 51.7Veneer 7.37 5.73 1.64 11,93 133 55.4Tree farming 3.91 3.08 .83 1.76 94 41.6Coated board 63.75 50.73 13.02 43.20 125 510.0Particle board 4.61 3.70 .91 4.69 40 115.2Lumber products 5.24 4.03 1.21 7.11 154 34.0

Table 8.10 Page 2
(contI d) MANU FAC TURING
InvestmentInvestment Requirements Per Person
Capital Value of Employ1 / EmployedTotal Equipnt Others Output ment -(thou. pesos)
Paper and paperproducts 466.48 353.80 112.68 171.06 1,334 349.7
Pulp and paper 156.00 112.00 44.00 60.00 570 273.7Long-fiber pulp 254.00 198.00 56.00 84.15' 640 396.9Fiber board 56.48 43.80 12.68 26.91 124 455.5
Chemicals 1,704.86 1,326.58 378.28 1,153.35 3,642 468.1
Palm oil 6.17 2.70 3.47 6.99 82 75.2Lumbang oil 6.31 4.20 2.11 10.52 76 83.0Activated carbon 5.48 3.66 1.82 3.17 70 78.3Coconut oil 12.81 7.89 4.92 45.34 24 533.8Rice bran oil 7.74 5.39 2.35 2.h9 33 234.5Polystyrene resins 28.27 21.04 7.23 33.04 160 176.7Polyvinyl alcohol
resins 11.00 7.50 3.50 18.oo 70 157.1Polyvinyl chloride
resins 14.97 9.65 5.32 28.18 101 148.2Nylon fibers 43.56 34.29 9.27 28.36 165 264.0Rayon fibers 345.57 283.55 62.02 123.68 1,072 322.4Benzene hexachloride
(6%) 9.00 7.40 1.60 7.92 88 102.3Chemical gypsum .46 .29 .17 1.50 29 15.9Tetracyclines 8.50 3.60 4.90 8.40 82 103.6Streptomycins 8.07 3.17 4.90 8.40 82 98.4Penicillins 8.07 3.17 4.90 8.40 82 98.4Petrochemical complex 1,177.00 922.27 254.73 787.24 1,240 949.2fiberglass-reinforcedplastic pipes andfittings 2.32 .25 2.07 4.72 34 68.2
Industrial salt 4.50 3.00 1.50 6.00 76 59.2Edible salt 5.06 3.56 1.50 21.00 76 66.6
Non-metallic mineralproducts, except productsof petroleum and coal 15.70 10.39 5.31 13.86 176 89.2
Asbestos .75 .55 .20 2.16 65 11.5Refractories 14.95 9.84 5.11 11.70 111 134.7
Metal manufacture 1,901.72 1,370.36 531.36 683.06 3,916 485.6
Primary steel 783.00 384.00 399.00 363.19 2,000 391.5Ferro-alloy 8.50 8.20 .30 6.90 119 71.4Copper metal 126.80 123.36 3.44 30.00 488 389.7Nickel, metal & alloy 977.40 852.00 125.40 274.48 1,200 814.5Special & alloy steel 1.87 .82 1.05 3.00 63 29.7API pipes 4.15 1.98 2.17 5.49 46 90.2

Table 8.10 Page 3(cont'd)
InvestmentInvestment Requirements Per Person
Capital Value of Employ-, EployedTotal Equipment Others Output ment (thou. pesos
Metal products, exceptmachinery & transportequipment 30.45 18.21 12.24 39.77 174 17..0
Dinnerware 3.20 2.80 .40 4.50 67 47.8High-carbon steel wire 6.82 3.37 3.45 13.52 41 166.3Copper tubes 16.28 10.06 6.22 21.75 66 246.7
Metallurgical coke 101.00 80.00 21.00 105.00 250 404.0
CAPITAL GOODS 138.70 87.09 51.61 216.44 6,473 21.
Machinery, exceptelectrical 49.43 31.10 18.33 62.38 1,484 33.3
Pliers and wrenches 3.05 2.09 .96 4.90 60 50.8Shapers 3.78 2.48 1.30 4.33 63 60.oLathes 5.00 3.06 1.94 6.00 130 38.5Drill presses 1.87 .96 .91 1.80 51 36.7Fishing winches 1.57 .49 1.08 4.50 50 31.4Band saws 2.13 1.31 .82 3.24 95 22.4Carbide-tipped tools 1.18 .66 .52 1.95 36 32.8Platform scales .95 .44 .51 .82 18 52.8Pumps .87 .44 .43 .99 37 23.5Palay threshers .75 .20 .55 1.00 54 13.9Steam boilers 2.34 .92 1.42 4.20 51 47.8Diesel engine 1.63 .99 .64 3.80 183 19.6High HP diesel engine 8.29 6.36 1.93 4.45 147 56.4Shaft bearing products 1.61 .75 .86 1.08 31 51L.9Disc plows, -disc harrows& rotb tillers .80 .49 .31 1.51 34 23.5
Grain dryers 1.53 .36 1.17 3.50 58 26.4Small gasoline engines 9.86 7.35 2.51 12.27 286 34.5Files 2.22 1.75 .47 2.0 100 22.2
Electrical machinery,apparatus, appliancesand supplies 34.19 24.71-. 9.48 46.31 907 37.7
Electric drill 2.07 1.04 1.03 3.00 50 41.4Electric grinders 2.22 1.04 1.18 3.93 32 69.4Porcelain insulators 6.96 6.61 .35 3.30 75 92.8Electric motors 7.70 5.10 2.60 3.00 250 30.8Kilowatt hour meters .50 .29 .21 1.46 25 20.0Power transformers 2.39 2.04 .35 1.53 75 15.6Stalpeth 6.50 4.12 2.38 17.24 119 54.6Flashlights 3.59 3.00 .59 6.60 97 37.0Circuit breaker 1.09 .69 .40 2.33 134 8.1Magnetic starters 1.17 .78 .39 3.92 50 23.4

Table 8.10 Page 4(cont'd)
InvestmentInvestment Requirements Per Person
Capital Value of Employ EmployedTotal Equipment Others Output ment (thou. pesos)
.MANU FACTURI NG
Transport equipment 55.08 31.28 23.80 107.75 4,082 13.5
Barges & tugboats)Fishing boats )- 5.30 3.00 2.30 7.50 250 21.2
Inter-island ships 14.00 6.90 7.10 22.25 1,550 9.0Ocean-going ships 24.00 18.00 6.00 40.00 2,150 11.2Motorcycles 11.78 3.38 8.40 38.00 132 178.4
MINI NG
TOTAL MINING 143.53 122.47 21.06 80.39 2,838 .50.6
Coal 4.83 4.32 .50 5.75 405, 11.9Natural gas 8.00 6.00 2.00 2.60 200 40.0Sulphur 82.20 76.20 6.00 27.00 500 165.6Rock asphalt .77 .52 .25 .60 60 12.8Perlite 2.15 1.17 .98 4.20 71 30.3Clay .22 .92 .30 3'.00 35 34.8Iron ore 6.00 1.81 4.19 10.00 500 12.0Chromite ore 12.44 11.44 1.00 5.76 341 35.8Copper ore 24.49 19.02 5.47 17.16 620 39.5Mercury 1.44 1.07 .37 4.32 100 14.4
TOTAL MANUFACTURINGAND MINING 4l704.24 3512.54 1,191.70 2, 126 212.6
Employment figures,include professional and supervisory emp16y es, skilled,semi-skilled, and unskilled workers.
Source:. Elaborated from data in the Third Investment Priorities P!anf ofthe Board of Investments.
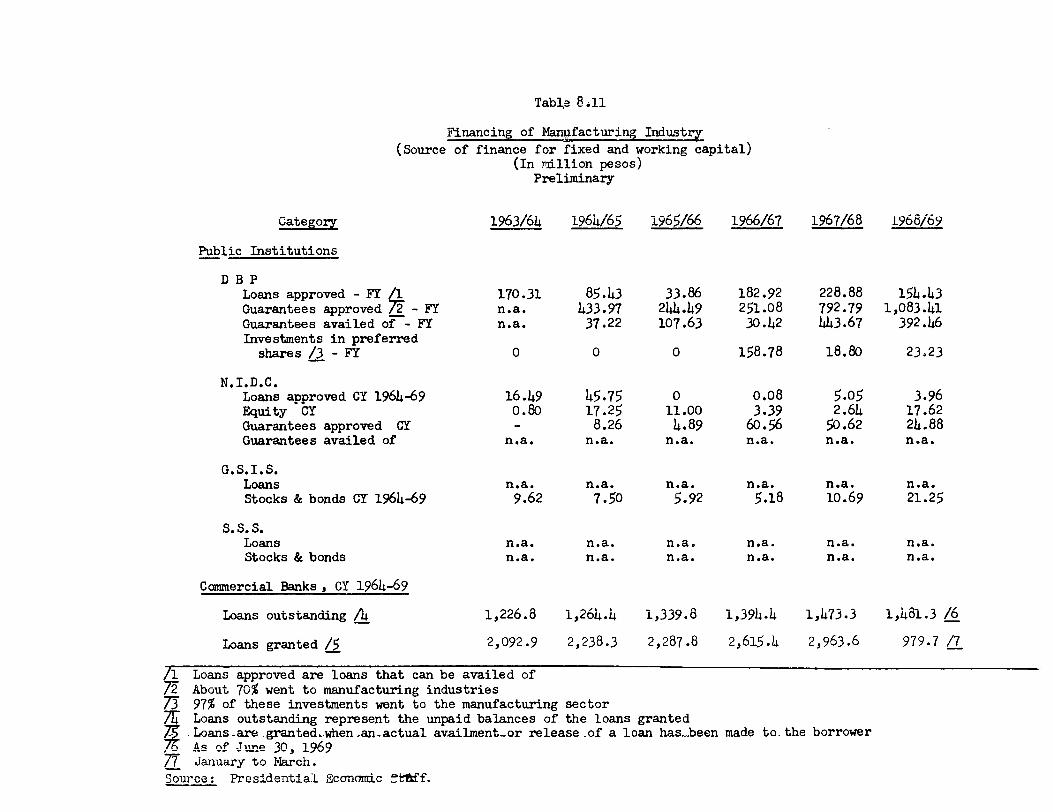
Table 8.11
Financing of Manufacturing Industry(Source of finance for fixed and working capital)
(In rllion pesos)Preliminary
category 1963/64 1964/65 1965/66 1966/67 1967/68 1968/69
Public Institutions
DBPLoans approved - FY /1 170.31 85.43 33.86 182.92 228.88 154.43Guarantees approved 72 - FY n.a. 433.97 244.49 251.08 792.79 1,083.41Guarantees availed of - FY n.a. 37.22 107.63 30.42 443.67 392.46Investments in preferred
shares 3- FY 0 0 0 158.78 18.80 23.23
N.I.D.C.Loans approved CY 1964-69 16.49 45.75 0 0.08 5.05 3.96Equity CY 0.80 17.25 11.00 3.39 2.64 17.62Guarantees approved CY - 8.26 4.89 60.56 50.62 24.88Guarantees availed of n.a. n.a. n.a. n.a. n.a. n.a.
G.S.I.S.Loans n.a. n.a. n.a. n.a. n.a. n.a.Stocks & bonds CY 1964-69 9.62 7.5o 5.92 5.18 10.69 21.25
S.S.S.Loans n.a. n.a. n.a. n.a. n.a. n.a.Stocks & bonds n.a. n.a. n.a. n.a. n.a. n.a.
Commercial Banks , CY 1964-69
Loans outstanding /4 1,226.8 1,26.4 1,339.8 1,394.4 1,473.3 1,481.3 /6
Loans granted /5 2,092.9 2,238.3 2,287.8 2,615.4 2,963.6 979.7 /7
/1 Loans approved are loans that can be availed of7 About 70% went to manufacturing industries7 97% of these investments went to the manufacturing sector
Loans outstanding represent the unpaid balances of the loans grantedSLoans-are-granted.when-an-actual availment-or release .of a loan has-been made to.the borrowerAs of Jine 0 , 196
/7 January to March.Source: Presidential Economic ftlff.

Table 8.12
Paid in Capital of Newly Re ard Lnsa Oraiz
(Thousand Pesos)
Total Fill2inos Chinese Americans Other
1966 387,967 354,292 27.99 -4L66 L.61
Agriculture 6,668 6,483 11 150 2L
Forestry, fishing and livestock 12,878 12,585 287 3 3Metal mining 70 70 - - -
Non-metallic mining & quarrying 2,161 2,130 - 31 -
Manufacturing 95,9h4 85,325 9,319 815 485Construction 21,119 21,059 60 - -Electricity, gas arxt water service 690 558 132 - -Wholesale and retail trade 118,748 100,832 16,276 1,752 889
Banks & other financial institutions 18,807 18,272 279 200 56Insurarce ,004 3,94h 40 - 20
Real estate 42,845 41,893 449 k7 57Transoortation, storage & communication 21,473 21,320 8 115 30
Community and busiass services 22,h37 21,139 847 409 42
Recreatidn and personal services 20,122 18,682 1,287 lh 9
1967 41,182 381,802 n8a96 2,599 5,B19
Agriculture 17,198 16,924 235 35 L
Forestry, fishing and livestock lh,8hh 14,503 150 191 -
Metal mining 215 165 20 30 -
Nort-metallic mining and quarrying 5,16 b,799 16 331 -Manufacturing 85,620 70,603 10,00 597 4,416Construction 14,610 1h,184 263 107 56Electricity, gas and water services 626 626 - - -Wholesale and retail trade 130,182 113,242 15,455 576 909Banks & other finarrial institutions 32,560 32,233 215 110 2
Insurance 675 618 57 -Real estate 48,849 48,250 300 13 286Transportation, storage & communication 27,164 27,1)41 18 5 -Community and busEness servicee 27,910 26,01 1,173 604 92Recreation and personal services 13,583 12,473 1,056 - 54
1968 470A15 26,691 69211 1 8,192
Agriculture 9,11l 9,006 - 122 13
Forestry, fishing and livestock 24,267 23,537 267 43 L20Metal mining 50 50 - -Non-metallic mining and quarrying 8,360 7,793 286 281 -Manufacturing 82,279 70,121 10,617 912 629Constrpetion 28,108 26,331 617 899 261Electricity, gas and water services 672 624 8 40 -Wholesale and retail trade 159,413 136,868 lj,999 1,560 1,985Banks & other firancial institutions 26,926 26,664 262 - -Insurance 2,840 2,820 5 1 1LReal estate 57,503 55,283 434 1,786 -Transportation, storage & communication 20,916 20,545 150 26 195Community and busiress services 37,666 35,816 89k 28k 672Recreation and personal services 12,674 11,233 1,272 167 2
1969 1,024 391,272 1.115 41539 L098Agriculture 12,02;' 11,872 .46 107 -Forestry, fishing and livestock 10,277 10,221 6 30 20Metal mining 110 110 - - -Non-metallic mining and quarrying 30,434 29,729 20 530 155Manufacturing 48,262 45,38 2,159 390 329Construction 16,192 15,864 296 32 -Electricity, gas and water services 1,090 1,090 - - -Wholesale and retail trade 132,063 122,548 8,874 56 585Banks & other financial institutions 14,120 1,116 - 4 -Insurance 622 612 - 10 -Real estate 48,893 45,629 164 3,100 -Transportation, storage & communication 41,841 41,641 42 158 -Community and business services 40,037 39,003 906 119 9Recreation and personal services 14,058 -13,453 602 3 -
1970 .13.967 25,018 9,576 1,928 1,4h5
Agriculture 5,794 5,771 8 15 -Forestry, fishing and livestock 9,601 9,546 50 -Metal mining 4,126 4,126 - - -Non-metallic mining and quarrying 50,738 48,949 209 743 837Manufacturing 52,690 50,295 2,171 115 109Construction 21,847 21,813 3k - -Electricity, gas and water services 1,506 1,506 - - -Wholesale and retail trade 137,953 131,313 5,890 298 h52Banks & other 1f1nncial institutions 19,797 19,664 133 - -Insurance k11 390 21 - -Real estate 64,225 63,561 23k 400 30Transportation, storage & communication 15,482 15,396 71 - 15Community and business services 33,528 33,109 265 152 2Recreation and personal services 20,269 19,579 190 200 -
Source: Central Bank of the Philippines

7аЫ
а8.1
Э
Сот
регlеап
о1 Е
вС lт
вЕ ед
li ацц
Ргlое в
of 9eleated
In
duoW
lal Рм
диоtв
1n tЬв
Рh111р
р 1де
вт
дLhe
Ue1Led 9
цц
в.
1970
(2п
U.9.
доца г
в)
Ph111pp1neeP
ercmt
Rв t1o
ot tа т
цl в
11 в
иch
вnge U.9.A.
Ph111pp1nee to
percmt
IEem
U�1t
1-1 _�
0 196
ВLo
1970 1970
U.9.A
.. 1970
Аа
Уаl огет
Cumxnt
metrlc
Еап28
1G
-ЦэЭ 7
�4э1
Uaaallnr
(regulnr) 11
Еег
.Otl -
- .ОЧ
- 2В
итоатвЕп
аЕоп
1гвез
-з5 9Э
.в9 5
9ulphurlc а г:1д
" "
- -
Ээ-
Э4 �у7
Алпопlи п
eulplate "
' S7
- э 8
1.5UCauatlc
в одв1Ц 1
В7 -56
- -
above 60 j/
Ря.с.
" э54
- -
- -
60Chlorlne
° "
90 87
-} 8Э
1.05 ви
g�E
" "
26 г7.5
Ь2Ч
.95 1ос
S111ce "
- 2�7
- Э4
Оур вит
и"
- 12
- -
-
Llmeetone
0�7
- -
-
zэ �lп в�.
505 ЦЭ Ь
-14 э оо
г.45 1ии
1у1п.
44z З ов
-зи2ио
1.5L 1ои
Кg,[гlя т ' гв
чсиЫ
сгt.
Эб5 Э е5
5 21и
1.в7
15о11
cubic tL.
41о5э8
Э1 ?2и
2.44 15 о
1i аиЫ
оft.
ЦЬО769
67 2aU
?.65 l?
и
Fraece1
wЫ
сfnoL
4Э5
56Ц
э и225
2.51 1S0
!7 cublo fооь
51Э897
75 2Цо
2.64 1ги
А� гСоd� 1t1o пг
12.иг-
�-
4з и1 в5
-1ог7 о
1.Цз14о
21,,иии
вти525
Т1 ВЭ7
ЦЦу-1.Ь о
1Ц и
_S��
Е0� 1
_ в(einglo
sErengEh) (10
ив�
. Y
t.)�
п7т
810 -
- -
- 7 и
�.ут/т
1,з30 -
- -
- 7 о
5 т/т
2.600 -
- -
- 70
Тeto
вог
2U
W,
Э!�
4,076 -
- -
- 1 о
InEarnatlonal 42
Э, Ц
иНР
Ц,575
- -
- -
1оFord
Эии<1, 46
НР4
,5Ь4
- -
- -
10D
av1d Вго
тууи
, 55
Ч1' S
,0э 0 -
- -
- 10
J. Deere
251и, 55 !�
6�6� U
_
_ _
_ 10
Iпtе
гмll
ппвl
B-O
1L, 6
2.5НУ
FакдSUU. 67НУ
Ь, ВЬО-
- -
- 1о
1�'Ч
С1[9
нTnter
пatlonal FЭerveater
Моде1
18ои
7,950 8,1
иэ2
Ь,Ь
ЦЦ а1.22
15F210D
(far logging lлдшtry) 2y,75U
25,114
-16 17,ВЭ 1в1.Ц1 20
Auto
оЫ1вв
/'iat
оn СС
" 2,17
Ч2,2
у5 5
1.75о
� / 1.з 1
�
Reneult 4
Е2,2
Ч5 2,295
о1,795
�1 1.2
ВSim
aa 1(К
N
г.$26
Э, и26
20 1,875
1.Ы
lиииОС
Ео15и0 сс
"tara
согЕlпа2,уЬ2
2,Ч4ч-.L
2,20и
1.Э4
ОаЕвип
Р1-Ц
11 2,56'1
э.71
В45
2,1UU
1.77
'�1 м1 каапtЕ, z п -9ваапэд
ц > з,? Э7
Цг, эои
t.ЬиТау
аЕв
Спrппа
, Ц
fТ -:)еди
2r7Ь
Ч3
,uW
в
2,эЧ1
1.2
5l �ltU
lpU
С'
'
�гс
оМв
пгсю
, 4 U
-9оаи5,
гхх �5,76Ч
15 4,96
о� /
1.16Тvу
ог.а
nrrnn, h Р -иедвn
Э,17 гЦ,.157
гЧ2,)Ы
1.В5
Pпuget 1iuh.
h П -Jпди!,718
э,tSЦ б)
3,hy4 '� /
1.7п�' ио
Гги�
�iс
нobnvY
. �
г�
' ьаш
i h,7'!7
h,)i в7 -Ь
Э. бгю1.2
5Мвгвп�lаи
�1bn'.. ?.u-r, Ц D �:Мди, ч,1 и1 у, г)7 1.Ц G,'
пХ1 1.74
гоvва
tьв, ti1> �:мди
Ь, и2[, 6,154
г2.
вииг.?
о�
г51 ��i�
н
lнмЕ иивг�
г �го5.'
�и7 �г,17у
гоз.1 ио
г.э гИ 'аМ
ииlатlп, 5 и0
6,24Ц, 7,692
2ээ.J
ск1 2.
ЭЭНм
Ыnг
Ам,гlоап, 4 D-9еди
4,821 б,у 2э
44 4.1
Ц 2 1.67
УЕ ее
1 F'г
од ив
Ев�
тв
Сгlп
ten
веЬегв
" '
1Э3 119
1.12 7S
Merch
иL Ь
ане
' '
�172
147 1.17
Э5
Т1пр
lвtов''
" Э 1Ц
181 1.7
ЭЦи
Со 1дrallad
eheetв
" "
186 17
Э1.U
в15
9kalpa '
147 -
- 7�5
Hot
г аllод
eheeE ап
др
lаЕев
' 155
165 �у4
15B111ata
" В4
1l9 i/
.71 nona
Y1g
Iг оп"
" ЬЬ
ЬЧ
Н/ :96
none
+ Fetlmete
trnm
15'Ь8 р тlсе1пPh111pp1nee идU.S.
�
L
Рh1
11р
р 1гюretall
ргl
с ее
ивг еогlg
lпвц
уglven
1пU
.S. dollere,
св lсиlа
tл.дв
Еth
во1д
ea �oln
ng
e га ц.
2/ Таrц
'f гм
cromиt
(а)
вЕида
гдportl
иd
g.v. 1U
U
Rrsa. Р.
Э �50(Ь) оЕм
ге .У.
1ооке в. Р. 1.5о
�Тhв
duty 1в
У.
2U р вт
1uD
1IQe. g.V
.l1/ The Ear1Sf диЕlввагегевотЫодUпввеетЫед
и1
Еh noL
тот
иth
иЦ
суllгд
еrвЦОх
25�
rlth 6 ауlц
деrе
80>< 60¢
иlth т
огеth
и6
оуllпде
ге100¢
100х
dteeel ог
ветl-
дlе
вв] э5�
20¢�/
F1at G
W D 1е
net в
оlд
вnул
огв1л
the U.9.
74юргl
оеehoen
1в!ог
Р1аЕ
$оA
enault 4
F. "
" '
' "
' "
" Renault
101Sercedee Ввпв200
" " " " " ' ' " " нМегоадевВепв220Yeugot
4W,
пп
нн
ни
ии
ни
" п
иPeugot
5UЦ
6/ 'Chn lп
fоавehnrn
вго
екfвotлry
ртlсо
еfor
Lhe 11.9.
�/ 9'ha
ип11. eh
пvn for
U.Y. prtoo
1Ч70 1е1п
net tппв.
в/
�i н
ни
ни
пн
п8
ГО
ОО
Ет
.
904г
Мв
г�I
nn �l
.q А
рг11
гэ, 197U
, р
. 158i
1 !
д�
t�вст
цт
, June
8, 1970{
Jou !
1 о
СJune
S 197
о.i'гfы
в-of
ваге
1лU
.9. �b
Ealn
sd Ьу
цер
оп�}
1�
аДопам
е�
геаЕi
тв
rTS
h
деQегв
1n Мвв
г�ол
,�
.G.1
�
оk,
Mqy 11,
1970.Ph111pp1ne
ргl
аее
мго
еЪц
lпедlrom
да
Евsu
Ьmltted
by 1ho
В02 ап
дtt
иm
lпц
лlеи
еиlth
pLnt
ти
вgете
евде
by the
Чог1д
Bank М1а
еlоп

Table 8.14
Average Effective..Rates of Protection Z SeptOrand Manufacturing BrAnc e_s, 1965
Percent,
Agri pixlture 17
Mining -17
Forestry -26
Export (e.-kdluding sugar) -20'
Manufacturing 50
Sugar 186Capital goods (rriachiner7 only) 35Truck s- and bu se s 77Intermediate goods 67Inputointo construction 67Consumption goods 87
Source:' J.R. Power, and G.P. Sicdt.,. Industrialization in.thelPhilippines, published- by the Wdord. University Fre'sil§1971-
No other estimates available.

Table 8.15
Average Effective Rate of Protection for Selected ProjectsProposed by the Board of Investments
Ex-factory CIF import Nominal Nominal 1/ Effec,ivedomestic price price tariff Protection Protection
P P t t Cd w j j j
Product (in pesos) (in U.S. $) () () (%)
Polystyrene resins GPS 1,835,00 MT 222.00 MTHPS 2,706,00 MT 333.00 MT 25 32 56
Nylon fibers 8 .50/Kg 1.57/Kg 15 20 20Polyacrylic sheets 6 .20/Kg 1.20/Kg 20 27 38Benzene hexachloride 1,200.00 MT 175.50/MT 15 20 10Antibiotics 158.00/kilo 27.00/kilo 5 7 12Edible salt 50.00/MT 10.00/MT 50 S 71Special & alloy steel 3,600.00/MT 728.72/T 10 13 lHigh carbon steel wire 1,150.00/MT 231.73/T 10 l 6Copper tubes 8.00/kilo 1.73/kilo 10 17 49Pliers and wrenches Pliers 2.00/unit .50/unit) 10, 14 23
Wrenches 3.50/unit .80/unit)Shapers 6,500,00/unit 1,092.00/unit 10 19 19Electric drills 140,00/unit 28.h6/unit 10 17 19Electric grinders 300.00/unit 60.60/unit 10 15 11Lathes 12,000.00/unit 2,4"t.00/unit 10 14 16Drill presses 1,200.00/unit 21.00/unit 10 14 5Fishing winches 25,000.00/unit 5,060.00/unit 10 19 19Band saws 20,000.00/unit 4,200.'00/unit 10 15 8Carbide-tipped tools 4.95/unit3 1.00/uniti/ 10 13 11Platform scales 550.00/unit lU2.00/unit 30 40 70Pumps h60.00/unit 96.7 /unit 5 10 8Palay threshers 3,300.00/unit 668.00/unit 10 l 11Steam boilers 65,000.00/unit 13,150,00/unit 10 14 12High-HP diesel engines
(100 HP and above) 35,000.00/unit 7,083.00/unit 10 11 12
Note: Prices are based on $1 = Ph except those for polystyrene resins and benzene hexachloride which are based on$ 1 = P6.
1/ Includes effects of advanced sales tax on imports and domestic sales tax.T/ GPS means general purpose polystyrene resin: HPS, high powered polystyrene resins.7/ Price of standard brazed tools of sizes 1/4", 5/16", 3/8", 7/16".
Source: Board of Investments.


Table 9.1
Price Indices, 1962-70(Twelve monthly averages)
I t e m 1962 1963 1964 1965 1966 1967 1968 1969 1970
General wholesale price indexfor Manila (1955 = 100) 129.4 142.0 148.6 151.9 158.5 165.9 170.7 171.9 205.4
Percentage rate of change 5.0 9.7 4.6 2.2 4.3 4.7 2.9 0.7 19.5
Sectoral components:Locally produced for homeconsumption 119.6 130.1 139.2 142.8 151.2 158.4 161.2 163.3 190.5
Import products 158.2 167.8 169.4 170.2 172.3 173.5 174.6 178.2 220.9Ecport products 167.1 200.0 194.2 199.6 197.7 216.2 243.0 233.3 304.8
Consumer price index for the -Philippines (1957 = 100) 1/ 113.6 122,6 133.5 137.6 144.5 153.0 154.1 156.7 180.7
Percentage rate of change 3.0 7.9 8.9 3.1 5.0 5.9 0.7 1.7 15.3
Individual components:Foodstuffs 116.6 132.5 151.2 156.3 167.0 180.8 179.9 181.0 207.3Clothing 121.4 125.3 129.6 136.1 142.1 150.3 155.7 160.2 187.0Rent and repairs 103.2 104.8 105.7 107.1 109.0 111.1 114.3 115.3 120.9Fuel, etc. 108.8 111.2 116.9 121.7 123.0 123.1 123.1 124.2 144.8Miscellaneous 2/ 109.4 111.6 114.5 117.0 120.0 122.7 125.7 130.4 154.2
GNP price deflator(1955=100) 3/ (calendar years) 123.8 133.0 139.3 143.0 148.7 157.0 163.9±/ 169.81/ 185.42
Percentage rate of change 7.4 4.7 2.7 4.0 5.6 4.4 3.6 9.2
1/ Constructed from the consumers price indices for Manila and for regions -outside Manila. . The weighing pattern was- developed on the basis of surveys conducted in 1953-54. This index is intended to reflect changes in the retail prices
(including indirect taxes) of a "fixed basket of goods and services" purchased by an average household. This can beinterpreted as a cost-of-living index. This is also regarded as .an indicator of price stability by the monetaryauthorities.
2/ Consists mostly of various services (such as education and medical care), transportation, beverages and tobacco, etc.3/ Ratio of gross national product in current prices to the same in constant 1955 prices multiplied by 100.r/ Revised.p/ Preliminary.
Source: Department of Economic Research, Central Bank of the Philippines. OSCAS, NEC.

Table 9.2
Wholesale Price Indikes, 1957-70
A. General Wholesale Price Indices in Manila(1955 = 100)
1957 1958 1959 1960 1961 1962 1963 1964 1965 1966 1967 1968 1969 1970
Food 107.5 110.6 103.7 110.8 119.5 122.7 139.0 148.3 150.3 165.8 174.5 175.9 178.3 208.3Beverages and Tobacco 105.7 106.4 107.0 108.3 111.3 113.0 118.2 120.1 123.0 124.0 133.5 133.2 138.8 149.2Crude Materials (inedible) 109.2 117.4 138.1 137.1 135.2 131.5 168.9 179.0 192.3 181.3 197.1 222.8 218.9 274.9Mineral Fuels 110.4 110.5 112.3 114.8 127.5 135.4 140.5 140.5 142.2 146.9 147.6 147.6 149.2 175.7Animal and vegetable oils and fats 99.2 134.6 164.6 145.3 138.1 163.7 183.0 197.2 230.0 201.3 225.3 267.0 234.4 347.9Cheicals 105.5 109.7 113.6 110.9 115.4 131.4 138.5 141.0 142.4 141.2 143.8 147.0 147.8 183.9Manufactured Goods 112.8 112.9 119.6 123.0 126.6 130.9 135.3 1h0.0 143.4 146.3 146.7 147.3 151.2 192.3Machinery and Transportation Equipment 106.7 115.4 128.3 147.6 163.5 174.7 189.2 188.5 188.7 190.8 193.0 196.0 202.1 248.8Miscellaneous Manufactured Art. Nec. 101.8 103.9 110.8 116.5 116.2 123.4 130.6 131.7 128.5 131.0 132.2 132.6 133.5 151.4All Items 107.6 111.2 112.7 117.4 123.2 129.4 1h2.0 148.6 151.9 158.5 165.9 170.7 171.9 205.4
B. Wholesale Price Index of Dome stic Products in Manila
Food 107.1 110.2 102.1 109.0 117.7 119.6 136.4 146.0 147.8 163.9 173.1 174.5 176.6 20.2Beverages and Tobacco 103.4 103.1 103.0 10.0 107.0 107.9 113.1 114.7 117.5 120.1 129.4 134.5 134.5 143.0Crude Materials (inedible) 109.5 118.0 138.8 137.4 134.8 151.5 169.2 179.5 193.0 181.7 197.7 224.0 219.9 276.6Mineral Fuels 109.2 109.3 111.0 113.4 122.6 129.4 133.9 134.0 136.5 139.6 140.5 140.5 141.4 164.2Animal and Vegetable oils and fats 98.8 135.4 166.5 145.8 138.4 164.6 184.5 199.0 232.8 202.7 227.1 270.1 236.3 350.7Chemicals 101.0 102.8 10.1 103.9 112.1 126.8 131.7 135.3 138.0 135.9 139.0 143.3 143.6 176.9Manufactured Goods 110.3 109.6 114.3 116.9 120.4 120.6 122.7 .128.8 134.6 138.0 138.4 138.2 143.4 190.8Machinery and Transportation Equipment 106.9 113.9 121.8 1[4.1 171.5 181.4 194.4 196.1 200.1 202.2 207.4 212.6 227.9 298.6Miscellaneous Manufactured Art. Nec. 100.4 102.2 108.4 114.2 113.5 120.0 127.4 128.8 125.4 127.9 129.1 129.6 130.2 144.8All Items 106.4 109.9 109.9 114.1 119.7 124.7 137.7 145.2 1h9.0 156.3 164.6 170.0 170.8 .202.8
Source: Central Bank of the Philippines
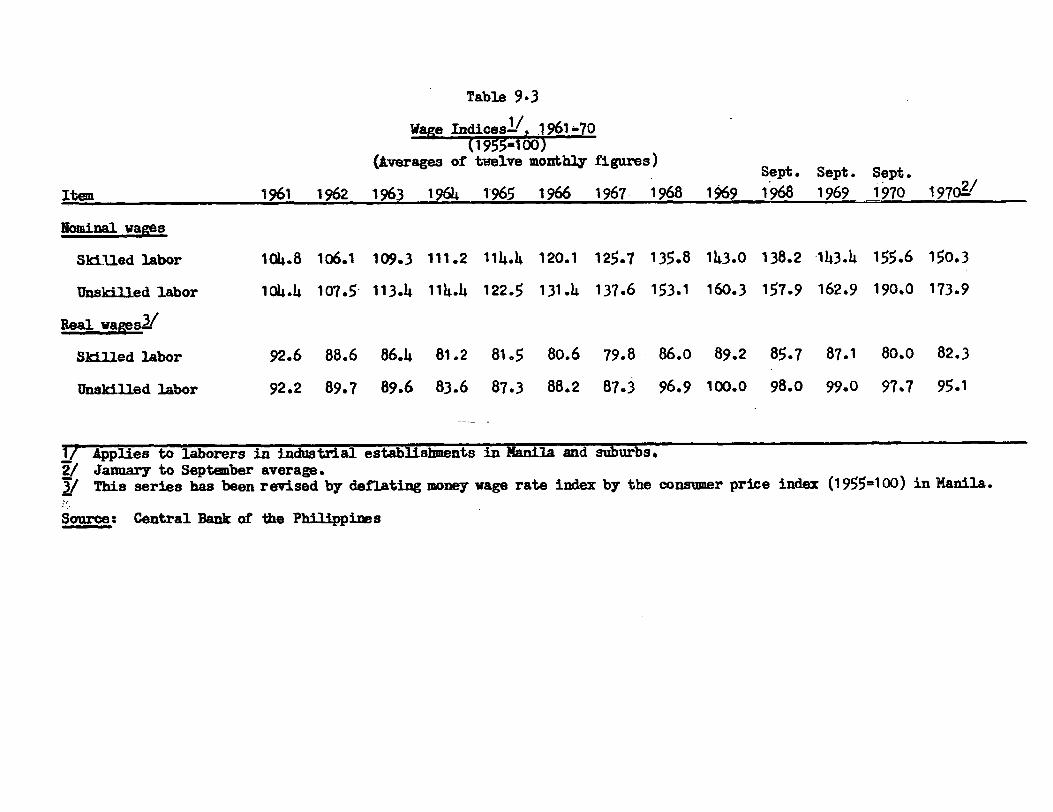
Table 9.3
WaRe IndicesY 19 70(1955-100)
(Averages of twelve monthly figures) Sept. Sept. Sept.
Iten 1961 1962 1963 1964 1-965 1966 1967- 1968 1969 1968 1969 1970 1970-2/
Nominal yages
Skilled labor 104.8 106.1 109.3 111.2 114.4 120.1 125.7 135.8 143.0 138.2 143.4 155.6 150.3
Unskilled labor 10.4 107.5 113.4 114.4 122.5 131.4 137.6 153.1 160.3 157.9 162.9 190.0 173.9
Real wages
Skilled labor 92.6 88.6 86.4 81.2 81.5 80.6 79.8 86.0 89.2 85.7 87.1 80.0 82.3
Unskilled labor 92.2 89.7 89.6 83.6 87.3 88.2 87.3 96.9 100.0 98.0 99.0 97.7 95.1
Y Applies to laborers in industrial establishments in Manila and suburbs.2/ January to September average.3/ This series has been revised by deflating money wage rate index by the consumer price index (1955-100) in Manila.
Sources Central Bank of the Philippines
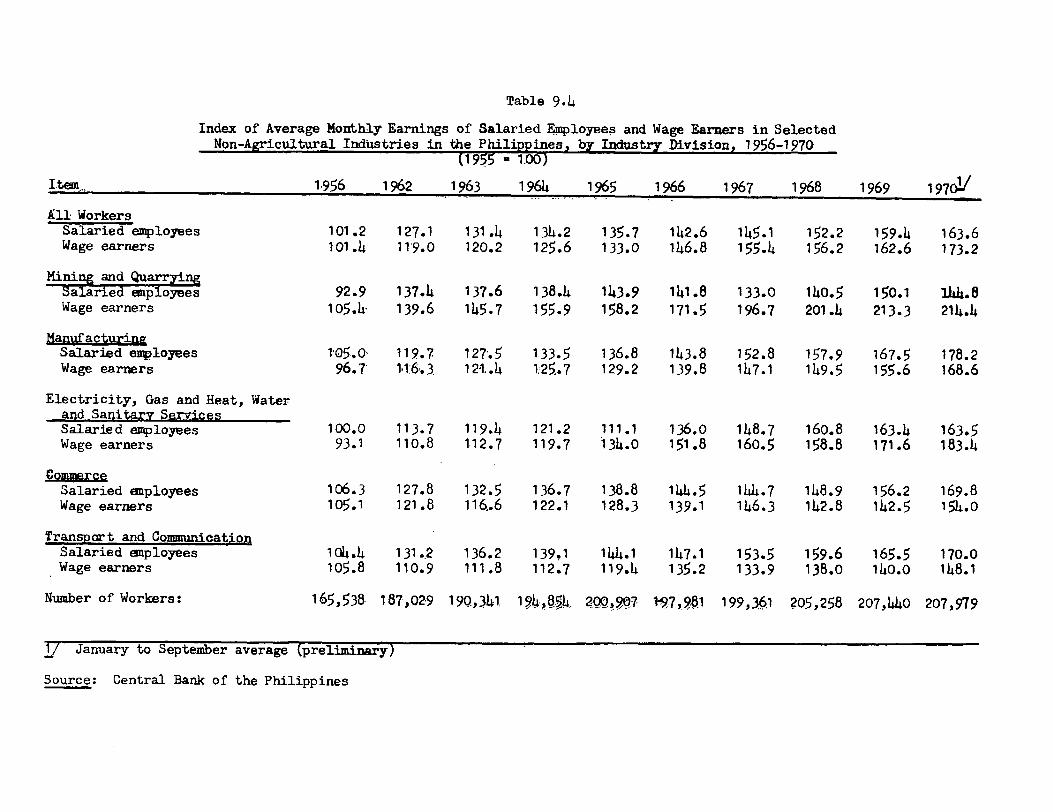
Table 9.4
Index of Average Monthly Earnings of Salaried Employees and Wage Earners in SelectedNon-Agricultural Industries in the Philippines, by Industry Division, 1956-1970
(1955 = 1.00)
Item 1956 1962 1963 1964 1965 1966 1967 1968 1969 1970All Workers
Salaried employees 101.2 127.1 131.4 134.2 135.7 142.6 145.1 152.2 159.4 163.6Wage earners 101.4 119.0 120.2 125.6 133.0 146.8 155.4 156.2 162.6 173.2
Mining and Quarrying7alaried employees 92.9 137.4 137.6 138.4 143.9 141.8 133.0 140.5 150.1 144.8Wage earners 105.4 139.6 145.7 155.9 158.2 171.5 196.7 201.4 213.3 214.4
ManufacturinaSalaried employees 105.0 119.7 127.5 133.5 136.8 143.8 152.8 157.9 167.5 178.2Wage earners 96.7 11:6.3 121.4 125.7 129.2 139.8 147.1 149.5 155.6 168.6
Electricity, Gas and Heat, Waterand Sanitary ServicesSalaried employees 100.0 113.7 119.4 121.2 111.1 136.0 148.7 160.8 163.4 163.5Wage earners 93.1 110.8 112.7 119.7 134.0 151.8 160.5 158.8 171.6 183.4
CommerceSalaried enployees 106.3 127.8 132.5 136.7 138.8 144.5 144.7 148.9 156.2 169.8Wage earners 105.1 121.8 116.6 122.1 128.3 139.1 146.3 142.8 142.5 154.0
Transport and CommunicationSalaried employees 104.4 131.2 136.2 139.1 144.1 147.1 153.5 159.6 165.5 170.0Wage earners 105.8 110.9 111.8 112.7 119.4 135.2 133.9 138.0 140.0 148.1
Number of Workers: 165,538 187,029 190,341 194,84 ?09,97 197,901 199,31 205,258 207,440 207,979
1/ January to September average (preliminary)
Source: Central Bank of the Philippines

Table 10.1
Department of Education EMMeditures-(In millan pesos)
1936 ,613 1963/64 1%/5 16/661967 16/8 1968/69 % 76*Burean of Vocational Education) 31 35 20 32 37 39 45 70Bureau of Public Schoola ) 378 412 477 504 62o 667 718 827 911Bureau of Private Schools 1 1 1 1 1 2 1 2 2Office of the Secretary 1 1 1 1 1 1 1 2 2Other Officeev 2 1 2 2 2 2 2 3 3
Tota 1 382 445 516 537 656 709 762 878 988
Including Institute of National Language, National Libraryand National Museum
y Source: Annual Report FY 1969/1970, Department of Education
Sources Budget Documents FY 1964-FY 1971.

Table 10.2
School Enrolment at i Levels of Education
1967-1968 1968-1969 1969-1970!/
Bureau of Public Schools 6,577,852 7,248,938 Z16341202
Pre-School 881 919 bJ 1,078Elementary 6,116,200 6,720,420 / 7,011,280Secondary 452,771 521,041 8 584,916Collegiate
Undergraduate 8,000 7,047 W 6,928Graduate -- -
Bureau of Private Schools 1,61,255 1,825288 it942,633
Pre-school 37,760 44,994 46,874Elementary 287,111 330,640 348,367Secondary 812,906 8814,764 938,439CollegiateUndergraduate 531,302 553,371 596,367Graduate 8,176 11,519 12,586
State Colleges and Unyersities 219 597 65,81
Pre-School 334 286 466Elementary 3, 295 2,681 3,904Secondary 14,527 11,258 16,749Collegiate
Undergraduate 41,925 38,445 42,259Graduate 2,.058 2',327 2,1436
Bureau of Vocational Education 9221, 97,0o34 97,560
Pre-School - -Elementary 220. 312 416Secondary 82,925 87,315 87,963CollegiateUndergraduate 9,070 9,407 9,181Graduate - - -
Total Enrolment
Pre-School 38,975 46,199 48,418Elementary 6,1406,826 7,0514,053 7,393,967Secondary 1,363,,.129 1,5004,378 1,628,067CollegiateUndergraduate 590,297 4608,270 654,735Graduate 10,234 13,846 15,022
Grand Total 8,4o9,461 9226,746 9,7140,209
a, Projectedb/ For normal schools only1/ Data for 1968-1969, do not include enrolment reports from five state colleges and
one state university.
SOArce: Annial Report. 1969-1970 Denartment of Eb-nation