restructuring retirement risks · isbn 0–19–920465–9 978–0–19 ... understanding and...
TRANSCRIPT

RestructuringRetirement Risks
Edited by
David Blitzstein, Olivia S. Mitchell,and Stephen P. Utkus
1

3Great Clarendon Street, Oxford ox2 6dp
Oxford University Press is a department of the University of Oxford.It furthers the University’s objective of excellence in research, scholarship,
and education by publishing worldwide in
Oxford New York
Auckland Cape Town Dar es Salaam Hong Kong KarachiKuala Lumpur Madrid Melbourne Mexico City Nairobi
New Delhi Shanghai Taipei Toronto
With offices in
Argentina Austria Brazil Chile Czech Republic France GreeceGuatemala Hungary Italy Japan Poland Portugal SingaporeSouth Korea Switzerland Thailand Turkey Ukraine Vietnam
Oxford is a registered trade mark of Oxford University Pressin the UK and in certain other countries
Published in the United Statesby Oxford University Press Inc., New York
� Pension Research Council, The Wharton School,University of Pennsylvania, 2006
The moral rights of the authors have been asserted
Database right Oxford University Press (maker)
First published 2006
All rights reserved. No part of this publication may be reproduced,stored in a retrieval system, or transmitted, in any form or by any means,
without the prior permission in writing of Oxford University Press,or as expressly permitted by law, or under terms agreed with the appropriate
reprographics rights organization. Enquiries concerning reproductionoutside the scope of the above should be sent to the Rights Department,
Oxford University Press, at the address above
You must not circulate this book in any other binding or coverand you must impose the same condition on any acquirer
British Library Cataloguing in Publication Data
Data available
Library of Congress Cataloging in Publication Data
Data available
Typeset by SPI Publisher Services, Pondicherry, IndiaPrinted in Great Britain
on acid-free paper byBiddles Ltd., King’s Lynn, Norfolk
ISBN 0–19–920465–9 978–0–19–920465–6
1 3 5 7 9 10 8 6 4 2

Chapter 11
Understanding and Allocating Investment Risksin a Hybrid Pension Plan
Peter Albrecht, Joachim Coche, Raimond Maurer, and Ralph Rogalla
First introduced in the USA by the Bank of America in 1985, hybrid types ofpension plans altered the traditional form of pension plan design in thedeveloped world.1 The term ‘hybrid’ pension plan subsumes plans withelements of both defined contribution (DC) and defined benefit (DB)plans. The motivation for hybrid plans is to combine the best character-istics of DB and DC plans while circumventing their major disadvantages.Most include a DC-type individual account, but also provide minimumand/or maximum annuity benefits at retirement using a DB-type formula.Additionally, investment returns credited to the individual accounts may besubject to return guarantees and/or return caps.2
When setting up and running a pension plan, the costs implied by thespecific plan design, as well as the asset allocation decision for the accu-mulated funds, are of major importance. In a pure DC plan, plan membershave extensive control over their accounts’ investment strategy (subject tothe investment menu they are offered). This enables participants to shapetheir portfolio’s risk/return profile to their individual risk preferences.The sponsor only promises to make a certain contribution to the account,so the investment risk is therefore completely borne by the members;consequently, the plan sponsor tends to be rather indifferent toward theindividual’s investment policy, as it poses no cost implications. By contrast,in a pure DB plan, the sponsor is obliged to provide adequate funds tocover the plan liabilities, so he is fully exposed to capital market risk. Theasset allocation decision has direct cost implications for his funding situ-ation. In a hybrid pension plan, both parties have an interest in influencingthe plan’s investment policy. This can result in a conflict of interest, whichis the object of investigation of this chapter. At the same time, we scrutinizethe costs inherent in different DB-type elements.
To do so, we construct several hypothetical hybrid pension plans, makeassumptions about key parameters, and the optimal investment strategy forparticular objective functions. These include cost minimization from theperspective of plan sponsor versus maximizing risk-adjusted pension bene-fits from the perspective of plan members. Although the design of the plan
andtheassumedparametersdonotexactly matchactuallyparticularpensionplans, the models draw on real-world elements. In particular, the formula-tion presented here draws on prior analysis of the European Central Bankretirement plan,3 though the model plan developed here is less complex.4
This chapter is organized as follows. First, we discuss the main elementsof the hybrid plan evaluated including the minimum pensions guarantee,maximum pension limits, and the return guarantee/caps. Next, we focuson technical aspects of the model and the decision-making processassumed. Finally, we analyze the optimal investment strategy, both fromthe perspective of the plan sponsor as well as plan members.
Designing a Hybrid Pension PlanThe pension arrangement analyzed in this study is taken to be a mandatoryplan whose members do not contribute to any other public or privatepension scheme. It is a noncontributory funded pension plan, consistingof two types of accounts. First, every plan member owns an individualaccount endowed by the plan sponsor with an assumed payment of 17percent of the members’ annual salary,5 representing the employer’s regu-lar plan contributions. In addition to this, the plan sponsor owns a separateaccount, called the contingency reserve, which plays the role of a settlementaccount for transfers to or from the individual accounts. The funds in boththe individual accounts as well as the contingency reserve represent totalplan assets. All plan funds must be invested in the same asset allocation,and the return on this portfolio is credited pro rata to the individualaccounts and the contingency reserve.
In addition to the plan sponsor’s pledge to finance the individualaccounts with regular contributions, the plan design includes a combinationof additional guarantees and/or limits. These are related to the level ofbenefits at retirement and/or to the asset return credited to the individualaccounts. Incorporating this element influences plan obligations, and itmay require additional payments from the sponsor (in addition to regularcontributions). These supplementary contributions may be triggered intwo cases. First, when guaranteeing a minimum return on the plan assets,the plan sponsor must cover shortfalls below the target return by replen-ishing the individual accounts through supplementary contributions. Sec-ond, supplementary contributions may be needed if there are guaranteedminimum pension benefits. Specifically, we posit that if the market value ofthe total plan assets falls below 90 percent of the actuarial present valueof the plan liabilities (i.e. the solvency ratio falls below 0.9), the plansponsor must immediately endow the contingency reserve with enoughfunds to reestablish a solvency ratio of one.
In this plan, participants cannot withdraw funds during the accumula-tion phase. Members leaving the plan before retirement (e.g. due to
11 // Understanding and Allocating Investment Risks 205

workforce turnover) may either leave their funds in the plan, or receive thebalance of their individual account as a lump sum (limited to the actuarialvalue of the maximum pension where applicable). At the retirement age of65, the available funds are converted into a life annuity. This conversionmay be subject to the guaranteed minimum pension benefits and to max-imum pension limits, depending on the exact design of the benefit struc-ture, to be discussed subsequently.
Benefit Structure. In what follows, six distinct hybrid pension plan benefitdesigns are scrutinized. Every plan is characterized by a uniquecombination of the elements mentioned earlier. The reason to comparethese designs is to investigate their differential effects on plan costs andpension benefit levels, and implications for optimal plan asset allocation.
In Case I, which we term the ‘benchmark’ design, the pension planconsists of an individual account for every plan member endowed by theplan sponsor with regular contributions of 17 percent of the current salary.These funds are invested in the capital markets. Beneficiaries are protectedfrom return shortfalls by an annual capital guarantee, i.e. a guaranteedyearly minimum return of 0 percent.6 In case the funds earn less than 0percent in any given year, the sponsor must make additional contributions.If the funds accumulated over a plan member’s career are insufficient topay for an adequate pension, this plan also will guarantee a minimum levelof pension benefits, corresponding to 2 percent of the career-average salaryper year of service. In addition, this plan limits the maximum level ofbenefits to 2 percent of the beneficiaries’ final salary (times years ofservice).7 In the event of a member either leaving the plan or retiring,any funds in the individual account that exceed the actuarial value of themaximum benefits are transferred to the contingency reserve.
The subsequent Cases II–V are constructed by eliminating certain planelements, compared to the benchmark case. Case II excludes the capitalguarantee, and in Case III, the maximum benefits are also removed. CaseIV eliminates the minimum benefit from the benchmark case, while Case Vonly includes the annual capital guarantee. Case VI includes the annualcapital guarantee and additionally a return cap of 10 percent per year, butprovides no further benefit elements relating to salary and years of service.If the asset return on the funds in the individual accounts in any yearexceeds the 10 percent level, the excess return will be credited to thecontingency reserve. Case VII does not include any guarantees or capsand, therefore, can be interpreted as a pure defined contribution plan.Table 11-1 summarizes the various plan designs.
The minimum rate of return guarantee increases the complexity of thepension plan substantially. More specifically, the minimum rate of returnguarantee may introduce an asymmetric link between assets and liabilities.Suppose the value of a given investment account corresponds to a pension
206 Peter Albrecht et al.

payment in-between the minimum and the maximum pension limit. In thissituation, a high asset return in any given year permanently increases thesponsors’ liabilities for the current and future years. Negative returns insubsequent years do not decrease the liability as the minimum rate ofreturn guarantee requires the sponsor to replenish the investment ac-count. Thus the high asset return in the first year had a permanent effecton the liabilities.8 However, in a situation where the investment accountcorresponds to a pension payment either below the minimum pensionguarantee or above the maximum pension limit, asset returns do nothave an immediate effect on the sponsor’s liabilities.
Asset Liability Modeling and the Pension Decision-Making Process. Nextwe evaluate the asset–liability model and decision-making process neededto determine the fund’s asset allocation behavior. To do so, we describe thekey assumptions about how assets and liabilities are projected forward, andthen specify decision rules used either by the plan sponsor or by thebeneficiaries to identify the optimal asset allocation. Regardless ofwhether the asset allocation decision is made by the sponsor or by thebeneficiaries, a two-step heuristic method is applied which is often found inpractical decision-making formats. In the first step, the set of mean-variance efficient asset allocations is determined using a standardMarkowitz-type portfolio optimization. In the second step, all portfoliosfrom the efficient frontier are assessed against a projection of asset andliabilities over a horizon of thirty years.
To project the return and risk effects of a certain asset allocation overtime, it is necessary to specify the stochastic processes governing asset classreturns, interest rates for maturities of three months (representing moneymarket investments) and ten years, as well as inflation rates. The
Table 11.1 Summary of Hybrid Pension Plan Designs
Case I Case II Case III Case IV Case V Case VI Case VII
Individual account H H H H H H HMinimum benefits H H H — — — —Maximum benefits H H — H — — —Capital guarantee H — — H H H —Return cap — — — — — H —
Source: Authors’ compilations.Notes: Minimum benefits are defined as 2 percent of career-average salary per year ofservice; maximum benefits are defined as 2 percent of final salary per year of service;capital guarantee refers to a guaranteed minimal return of 0 percent per year for theindividual accounts; the return cap limits the annual return credited to the individualaccounts to 10 percent.
11 // Understanding and Allocating Investment Risks 207

difference between the nominal ten-year interest rate and the inflation rate(i.e. the real ten-year interest rate) is used to discount future pensionliabilities. The stochastic dynamics of the (uncertain) market values ofthe assets are modeled as geometric Brownian motion, which implies thatthe log return of every asset is independent and identically normallydistributed. Long- and short-term interest rates as well as the inflationrate are modeled using the multidimensional Ornstein/Uhlenbeck pro-cess, to cover the empirically observable mean reversion characteristics inthese time series.9
The investment universe comprises the broad asset classes, money mar-ket instruments, euro area bonds, worldwide diversified equities, andemerging market equities. A regime-switching model is used to deriveexpected returns for the fixed-income asset classes (i.e. money marketinstruments and Eurobonds). This technique allows consistent generationof yield curve projections contingent on expectations about economicactivity (Bernadell et al. 2005). In the long-term projection of the macro-economic environment, we rely on the economist intelligence unit (EIU)as an external provider of forecasts for the Euro area, the US, and Japan.10
Expected returns on equity investments are approximated by add-ons tothe long-term yields on government bonds. In the analysis, the equity riskpremium is fixed at 2.5 percent annually for worldwide diversified equity.Reflecting higher risk of emerging market investments we assume anequity risk premium of 4 percent for this asset class. All asset classes aresubject to short selling constraints and, in addition, the investment inemerging market equity is restricted to a maximum of 5 percent of overallinvestments.
The projection of liabilities is based on a discontinuance valuationmethod usually applied by plan actuaries; this relies on the assumptionthat service of each participant ceases on the respective valuation date. Itassumes that at a given valuation date the individual investment accountsare translated into a (usually deferred) life annuity with inflation-adjustedpayments, whereby the minimum and maximum pension limits laid outearlier are applied. The real discount rates used for this exercise are thereal ten-year interest rates determined by the asset model. Discontinuancevaluation is performed for each year over the thirty-year analysis horizon(Bacinello 2000). The valuation of liabilities requires projecting popula-tion dynamics comprising the evolution of the number and composition ofstaff, salaries, number of retirees, and dependents. For this purpose ahypothetical population comprising initially of 1,000 staff members is con-structed. The population is evolved forward using an inhomogeneous,discrete-time Markov chain. Transition probabilities are derived usingassumptions for the company’s recruitment, promotion and turnover pat-terns, evolution of salaries as a function of consumer price inflation, andmortality rates.
208 Peter Albrecht et al.

Comparing the value of liabilities with the projected value of assets at therespective valuation date allows for the evolution of the plan’s solvencyratio to be determined and supplementary contributions to be made by thesponsor and average benefits. Given the complexity of the plan design,solutions are determined using Monte Carlo simulation over 1,000 simula-tion runs. In the process, we make a number of specific assumptions aboutselection criteria used to determine the plan’s optimal asset allocation. Tothis end, two different regimes are introduced. Under the first regime,arguably the standard for hybrid pension plans, the plan sponsor is solelyresponsible for the investment strategy. Correspondingly, the secondregime assumes that decisions are made by the beneficiaries. In both
Table 11-2 Parameter Assumptions for Asset Returns, Interest Rates, and
Inflation Dynamics
Correlations
Mean Volatility Eurobonds Global equities EM equities
Eurobonds 5.1 3.7 1 — —Global equities 7.6 17.9 0.21 1 —EM equities 9.1 27.5 0.1 0.73 1
Correlations of innovations
u k s
3-m interestrate
10-y interestrate
Inflationrate
3-m interestrate
0.043 0.114 0.012 1 — —
10-y interest rate 0.05 0.075 0.01 0.8461 1 —Inflation rate 0.02 0.286 0.011 0.7757 0.8103 1Eurobonds — — — 0.0683 0.1396 0.0740Global equities — — — �0.0100 0.0000 0.0100EM equities — — — �0.0100 0.0000 0.0100
Source: Authors’ calculations.Notes: Return expectations are derived using yield curve projections as laid down inBernadell et al. (2005) as well as the assumption of equity risk premia of 2.5 and 4% forglobal equities and emerging markets (EM) equities. Furthermore, the return dynamicsare assumed to follow a geometric Brownian motion. The three-month and ten-yearinterest rates as well as the inflation rate are modeled using the process specified by�ddXt ¼ k(u� Xt )�ddt þ s�ddWt where Xt is the value of the Ornstein/Uhlenbeck process in t,kappa (k) is the speed of mean-reversion, theta (u) is the long-run mean, and sigma (s) isthe volatility of changes of the process. �ddWt is the increment of a standard Wiener process.The above estimates are made on the basis of monthly data from January 1986 throughoutDecember 2002 for the JP Morgan European Bond index (Eurobonds), MSCI World exEMU index (Global Equities), and MSCI Emerging Markets Free index (EM Equities), aswell as German inflation rates, three-month Euribor and REX ten-year yields.
11 // Understanding and Allocating Investment Risks 209

cases, investment decisions apply simultaneously to all individual invest-ment accounts and the contingency reserve.
For the sponsor, we assume the objective is to minimize the costs ofrunning the plan. More specifically the sponsor is modeled as minimizingthe worst-case value of discounted supplementary contributions, where theworst-case value is defined as the 5 percent quantile of the distribution ofthe sum of discounted supplementary contributions over the 30-yearinvestment horizon. Thus, decision criteria other than costs (such as plansolvency) are not considered explicitly. Plan funding is accounted for bythe solvency rule, as specified later, according to which the funding ratiocannot fall short of 90 percent in any single year. More formally, let SCt bethe total amount of supplementary contributions to be made by the plansponsor in period t and r the appropriate discount rate, then the objectivefunction is given by:
min VaR5%
X30
t¼1
SCt
(1þ r)t
" #(1)
Investment decisions for the plan are made collaboratively for all invest-ment accounts. These decisions may be made in the context of aninvestment committee composed of staff representatives. Such a body isassumed to maximize the expected value of the constant-relative-risk-aver-sion (CRRA) utility function u(PBF) with risk-aversion parameter g > 0.
max E[u(PBF )] ¼ max EPBF 1�g
1� g
� �� �(2)
Utility is defined over the pension benefit factor PBF which refers topension payments per year service expressed as the percentage of finalsalary at time of retirement. Factor PBF comprises all simulation runs andall plan members retiring over the thirty-year investment horizon.
The Plan Sponsor’s Investment DecisionWe next take the perspective of the plan sponsor, to evaluate the interrela-tion between asset allocation in the individual pension accounts and theresulting plan costs measured in terms of supplementary contributions bythe plan sponsor. Figure 11-1 depicts the worst-case supplementary contri-butions for Cases I–IV for different portfolio allocations, and Figure 11-2for Cases V and VI. Worst-case costs are measured as the 5 percent value atrisk of the supplementary contributions, i.e. the present value of contribu-tions by the plan sponsor exceeding the regular payments of 17 percent ofthe salaries. Portfolio allocations are represented by the mean-varianceefficient portfolio returns. Details of the cost-optimal asset allocations,including the asset weights for cash, Eurobonds, global, and emerging
210 Peter Albrecht et al.

market equities appear in Panel 1 of Table 11-3. Panel 2 contains thedistributional characteristics of the discounted supplementary contribu-tions for the cost-optimal asset allocations. Finally, Panel 3 reports thepension benefits for these allocations in terms of certainty equivalents.11
These certainty equivalents are calculated according to the utility functionstated earlier and for four different parameters of relative risk aversion.
Table 11-3 Optimal Investment Decisions: The Plan Sponsor’s Perspective
Case I Case II Case III Case IV Case V Case VI
Panel 1: Cost-optimal asset allocation (%)Mean return 5.57 5.70 5.76 5.63 4.55 5.95Volatility 4.68 5.23 5.53 4.94 2.17 6.53Cash 0.00 0.00 0.00 0.00 71.28 0.00Eurobonds 84.27 79.16 76.61 81.72 28.04 68.95Global equities 10.73 15.84 18.39 13.28 0.68 26.05Emerging markets
equities5.00 5.00 5.00 5.00 0.00 5.00
Panel 2: Distributional characteristics of DSC with optimal asset allocation (%)Mean DSC 19.64 18.44 22.14 9.24 13.02 7.00Std. DSC 13.03 12.89 12.60 9.62 8.01 9.175%-VaR DSC 42.49 41.50 43.95 27.01 28.04 25.8725%-Q DSC 10.27 9.04 12.71 0.00 6.95 0.0050%-Q DSC 17.56 16.12 19.87 6.70 12.15 2.7775%-Q DSC 26.92 25.65 29.41 15.17 17.96 11.39
Panel 3: Distributional characteristics of PB with optimal asset allocation (%)Mean PB 1.875 1.872 2.257 1.793 1.531 1.939Std. PB 0.045 0.050 0.415 0.102 0.205 0.307Certainty equivalent
(g ¼ 1)1.874 1.872 2.223 1.790 1.517 1.915
Certainty equivalent(g ¼ 5)
1.872 1.869 2.121 1.776 1.470 1.827
Certainty equivalent(g ¼ 10)
1.869 1.866 2.040 1.750 1.421 1.726
Source: Authors’ calculations.Notes: Asset weights in percent; DSC (i.e. discounted supplementary contributions):contributions required on top of fixed regular contributions to fully fund the pensionplan (in percent of expected discounted regular contributions); PB (i.e. pensionbenefits): attainable income replacement factor (in percent of final salary per year ofservice); Gamma (g): parameter of risk aversion in a constant relative risk aversion(CRRA-) utility function of the type: u(W ) ¼ W 1�g=(1� g); Objective function: Min-imize the 5 percent VaR of DSC; Q: quantile; Case I: DC þ minimum benefits þmaximum benefits þ capital guarantee; Case II: DC þ minimum benefits þ maximumbenefits; Case III: DC þminimum benefits; Case IV: DC þmaximum benefitsþ capitalguarantee; Case V: DCþ capital guarantee; Case VI: DCþ capital guaranteeþ 10% capon asset return.
11 // Understanding and Allocating Investment Risks 211

Focusing first on the benchmark, Figure 11-1 shows that the worst-caseplan costs for Case I follow a U-shaped curve. With increasing expectedportfolio returns, the costs first decrease and then rise, resulting in min-imum supplementary contributions for an asset allocation with anexpected return of 5.57 percent. This portfolio consists of about 84 percentbonds and 16 percent equities. The minimum supplementary contribu-tions amount to 43 percent of the expected regular contributions. Hence,for every discounted Euro the sponsor regularly paid into the plan, add-itional payments of 43 discounted cents are required to cover the costs ofthe plan. The U-shape of the cost curve can be directly related to theguarantees included in Case I. Investing in portfolios mainly consisting ofcash or bonds will result in assets not being able to generate enough returnto cover the costs of the guaranteed minimum benefits. These costs have tobe borne by the plan sponsor. As the expected return on the portfolioincreases, it becomes more and more likely that the funds will suffice to atleast pay the minimum pension without further contributions by the plansponsor. The rise in expected portfolio return is in turn accompanied by anincrease in return volatility, which induces costs resulting from falling shortof the guaranteed minimum annual asset return of 0 percent. From acertain level of volatility onwards, these newly induced costs overcompen-sate the cost savings related to the minimum pension benefits and theoverall costs increase again.
Changing the structural design of the plan has some interesting effects.Eliminating the annual return guarantee for the individual accounts inCase II cuts the amount of supplementary contributions, especially in thecase of a more risky asset allocation. However, the asset allocation whichminimizes costs is only slightly different compared to Case I (i.e. about 5percent less bonds and more equities). The worst-case costs only fall from43 to 42 percent of regular contributions. This results from the fact that fora low-risk asset allocation the costs from the annual return guarantee arerelatively low.12
In Case III, not only the capital guarantee but also the maximum pensionregulation is eliminated; now the plan is basically DC but the beneficiariesare protected by a DB minimum pension benefit in the event of adversecapital market developments. Therefore, the amount of supplementarycontributions increases compared to Case II, as there are no longer fundsin excess of those needed to provide maximum pension benefits whichcould be credited to the plan sponsor. Looking at the cost minimizingasset allocation, the equity exposure is slightly further increased to about13 percent with overall worst-case supplementary contributions of 44 per-cent.
Case IV shows a quite different curve. The general U-shape is maintainedshowing a minimum of supplementary contributions for a portfolio returnof 5.6 percent, which corresponds to an asset allocation of 82 percent
212 Peter Albrecht et al.
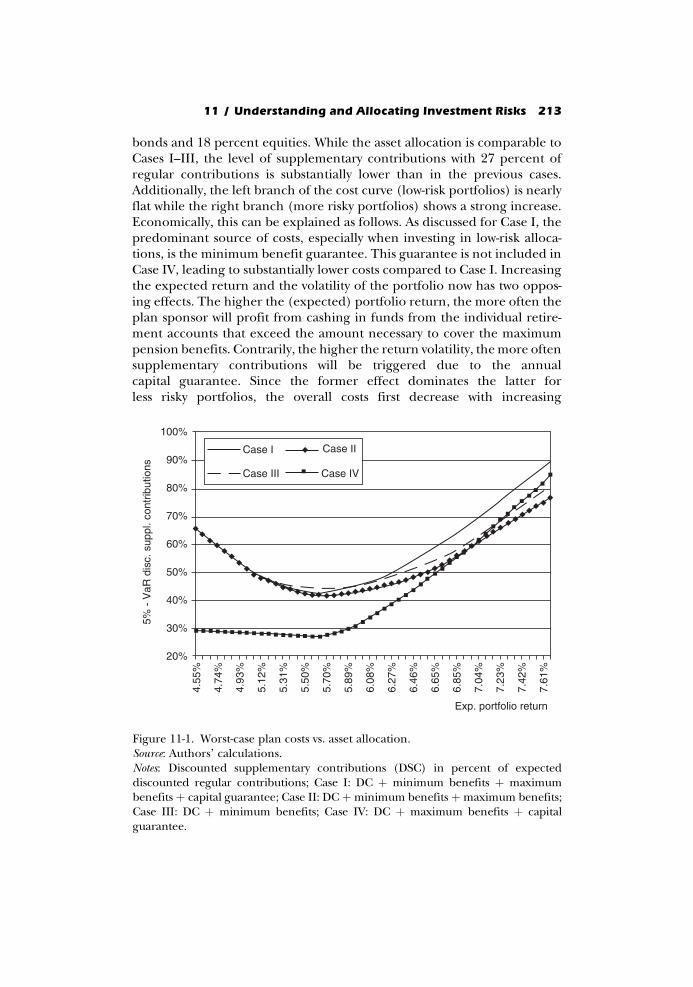
bonds and 18 percent equities. While the asset allocation is comparable toCases I–III, the level of supplementary contributions with 27 percent ofregular contributions is substantially lower than in the previous cases.Additionally, the left branch of the cost curve (low-risk portfolios) is nearlyflat while the right branch (more risky portfolios) shows a strong increase.Economically, this can be explained as follows. As discussed for Case I, thepredominant source of costs, especially when investing in low-risk alloca-tions, is the minimum benefit guarantee. This guarantee is not included inCase IV, leading to substantially lower costs compared to Case I. Increasingthe expected return and the volatility of the portfolio now has two oppos-ing effects. The higher the (expected) portfolio return, the more often theplan sponsor will profit from cashing in funds from the individual retire-ment accounts that exceed the amount necessary to cover the maximumpension benefits. Contrarily, the higher the return volatility, the more oftensupplementary contributions will be triggered due to the annualcapital guarantee. Since the former effect dominates the latter forless risky portfolios, the overall costs first decrease with increasing
20%
30%
40%
50%
60%
70%
80%
90%
100%
Case I
Case III Case IV
Case II
4.55
%
4.74
%
4.93
%
5.12
%
5.31
%
5.50
%
5.70
%
5.89
%
6.08
%
6.27
%
6.46
%
6.65
%
6.85
%
7.04
%
7.23
%
7.42
%
7.61
%
Exp. portfolio return
5% -
VaR
dis
c. s
uppl
. con
trib
utio
ns
Figure 11-1. Worst-case plan costs vs. asset allocation.Source: Authors’ calculations.Notes: Discounted supplementary contributions (DSC) in percent of expecteddiscounted regular contributions; Case I: DC þ minimum benefits þ maximumbenefits þ capital guarantee; Case II: DCþminimum benefits þmaximum benefits;Case III: DC þ minimum benefits; Case IV: DC þ maximum benefits þ capitalguarantee.
11 // Understanding and Allocating Investment Risks 213

expected portfolio return. For more risky allocations the latter effect dom-inates the former, which leads to rapidly growing contributions. As the costimpact of the minimum benefit guarantee is diminishing for increasingportfolio returns, Cases I and IV hardly differ for highly risky portfolios.
We now turn to the cases with no explicit defined minimum or max-imum benefit, depicted in Figure 11-2. Case V shows a plan with unlimitedupside potential but with a shortfall protection resulting from the annualreturn guarantee. It is clear that such a plan design results in increasingsupplementary contributions, the higher the equity exposure. Hence, min-imizing the costs in terms of supplementary contributions leads to theminimum volatility portfolio, consisting of 71 percent cash, 28 percentbonds, and only 1 percent equities. The resulting costs amount to 28percent of regular contributions.
As in Case V, Case VI offers an annual capital guarantee and thereforeprotection against return shortfalls. However, the upside potential is lim-ited due to the 10 percent return cap. This structural change has a signifi-cant impact on the shape of the cost curve. While the amount ofsupplementary contributions in Cases V and VI is approximately equalfor low-risk asset allocations, the costs in Case VI begins to decrease again
+++++
+
+++++++++++++++ ++ ++++++++
++++++++++++++++++++
Case V Case VI
4.55
%
4.74
%
4.93
%
5.12
%
5.31
%
5.50
%
5.70
%
5.89
%
6.08
%
6.27
%
6.46
%
6.65
%
6.85
%
7.04
%
7.23
%
7.42
%
7.61
%
20%
30%
40%
50%
60%
70%
80%
90%
100%
Exp. portfolio return
5% -
VaR
dis
c. s
uppl
. con
trib
utio
ns
Figure 11-2. Worst-case plan costs vs. asset allocation.Source: Authors’ calculations.Notes: Discounted supplementary contributions (DSC) in percent of expecteddiscounted regular contributions; Case V: DC þ capital guarantee; Case VI:DC þ capital guarantee þ 10% cap on asset return.
214 Peter Albrecht et al.
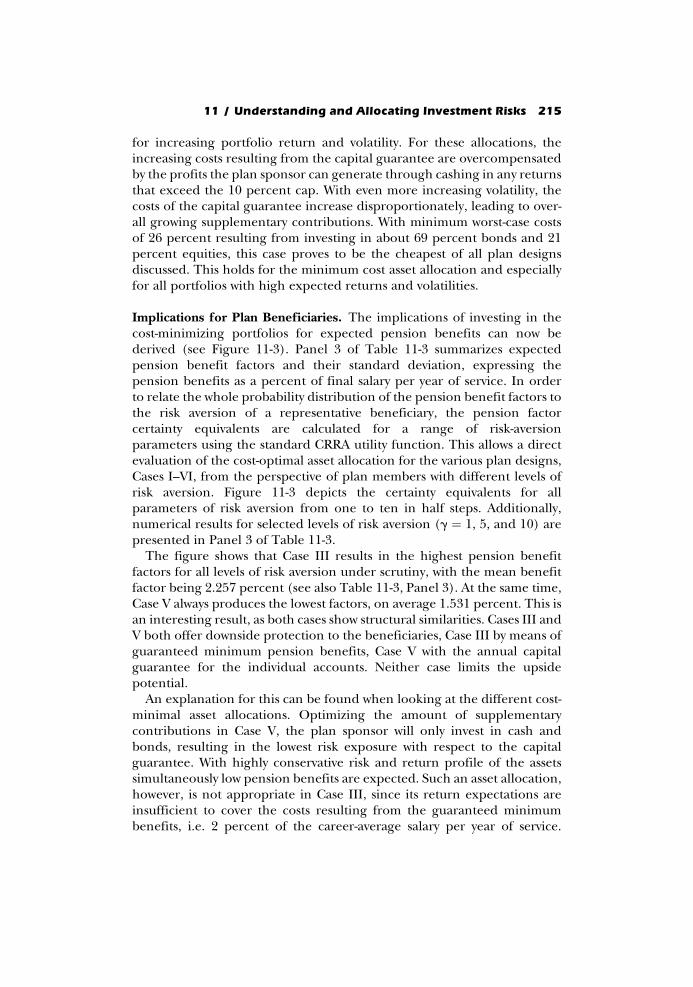
for increasing portfolio return and volatility. For these allocations, theincreasing costs resulting from the capital guarantee are overcompensatedby the profits the plan sponsor can generate through cashing in any returnsthat exceed the 10 percent cap. With even more increasing volatility, thecosts of the capital guarantee increase disproportionately, leading to over-all growing supplementary contributions. With minimum worst-case costsof 26 percent resulting from investing in about 69 percent bonds and 21percent equities, this case proves to be the cheapest of all plan designsdiscussed. This holds for the minimum cost asset allocation and especiallyfor all portfolios with high expected returns and volatilities.
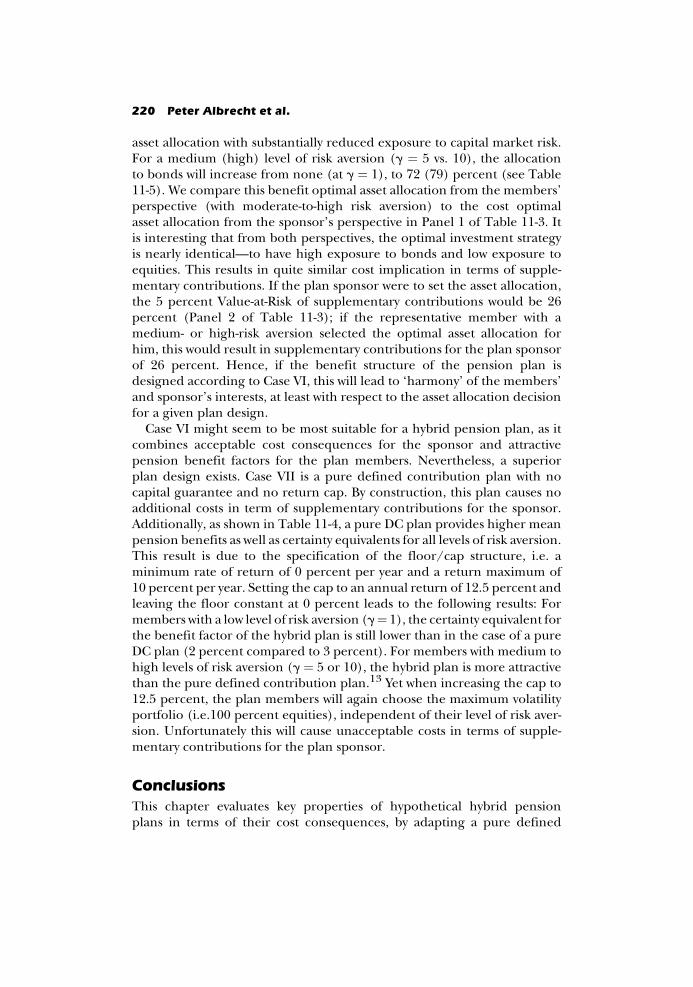
Implications for Plan Beneficiaries. The implications of investing in thecost-minimizing portfolios for expected pension benefits can now bederived (see Figure 11-3). Panel 3 of Table 11-3 summarizes expectedpension benefit factors and their standard deviation, expressing thepension benefits as a percent of final salary per year of service. In orderto relate the whole probability distribution of the pension benefit factors tothe risk aversion of a representative beneficiary, the pension factorcertainty equivalents are calculated for a range of risk-aversionparameters using the standard CRRA utility function. This allows a directevaluation of the cost-optimal asset allocation for the various plan designs,Cases I–VI, from the perspective of plan members with different levels ofrisk aversion. Figure 11-3 depicts the certainty equivalents for allparameters of risk aversion from one to ten in half steps. Additionally,numerical results for selected levels of risk aversion (g ¼ 1, 5, and 10) arepresented in Panel 3 of Table 11-3.
The figure shows that Case III results in the highest pension benefitfactors for all levels of risk aversion under scrutiny, with the mean benefitfactor being 2.257 percent (see also Table 11-3, Panel 3). At the same time,Case V always produces the lowest factors, on average 1.531 percent. This isan interesting result, as both cases show structural similarities. Cases III andV both offer downside protection to the beneficiaries, Case III by means ofguaranteed minimum pension benefits, Case V with the annual capitalguarantee for the individual accounts. Neither case limits the upsidepotential.
An explanation for this can be found when looking at the different cost-minimal asset allocations. Optimizing the amount of supplementarycontributions in Case V, the plan sponsor will only invest in cash andbonds, resulting in the lowest risk exposure with respect to the capitalguarantee. With highly conservative risk and return profile of the assetssimultaneously low pension benefits are expected. Such an asset allocation,however, is not appropriate in Case III, since its return expectations areinsufficient to cover the costs resulting from the guaranteed minimumbenefits, i.e. 2 percent of the career-average salary per year of service.
11 // Understanding and Allocating Investment Risks 215

Rather, it is necessary to implement a portfolio strategy that offers highermean returns, coming at the cost of higher volatility. This, in turn, leads tosubstantially higher supplementary contributions, since the plan sponsorfully bears the downside volatility while only the beneficiaries profit fromthe upside volatility.
Implementing a maximum benefit cap (2 percent of final salary per yearof service) results in considerably reduced volatilities of the pension benefitfactors, i.e. 0.045 percent for Case I, 0.05 percent for Case II, and 0.102percent for Case IV (see Table 11-3, Panel 3). Consequently, the certaintyequivalents of the pension benefit factors are nearly constant for the variousrisk-aversion coefficients reported in Figure 11-3. Among these cases, Case I
Case I
Case V Case VI
Case II Case III Case IV
1.0
1.5
2.0
2.5
3.0
3.5
4.0
4.5
5.0
5.5
6.0
6.5
7.0
7.5
8.0
8.5
9.0
9.5
10.0
1.4%
1.5%
1.6%
1.7%
1.8%
1.9%
2.0%
2.1%
2.2%
2.3%
Gamma
PB
cer
tain
ty e
quiv
alen
t
+ +
+
+ + + + + + + + + + + + + + + + +
Figure 11-3. Certainty equivalents of pension benefit factors for different plandesigns with sponsor’s optimal asset allocation.Source: Authors’ calculations.Notes: PB certainty equivalent: certain pension benefit (PB) factor, i.e. retirementincome in percent of final salary per year of service, that has the same utility to thebeneficiary as the random pension benefit factor provided by the pension plan.Gamma: parameter of risk aversion in a constant relative risk aversion (CRRA-)utility function of the type: u(W ) ¼ W 1�g=(1� g); Case I: DC þminimum benefitsþ maximum benefits þ capital guarantee; Case II: DC þ minimum benefits þmaximum benefits; Case III: DC þ minimum benefits; Case IV: DC þ maximumbenefits þ capital guarantee; Case V: DC þ capital guarantee; Case VI: DC þ capitalguarantee þ 10% cap on asset return.
216 Peter Albrecht et al.

offers the highest pension benefits but is also the most costly design. CaseII only offers slightly lower benefits combined with slightly lower costs.
In general, it can be concluded that hybrid plans that offer the highestexpected pension benefits tend to cause the highest amount of supple-mentary contributions. Yet there are two exceptions: Case V offers by farthe lowest pension benefits, but even given optimal asset allocation pat-terns, additional costs are not small. By contrast, Case VI has the lowestsupplementary contribution, and will lead to expected pensions benefitsthat exceed all but one other case. The rather high volatility of the pensionbenefit factor, however, causes the certainty equivalents to drop belowthose of most other cases for higher levels of risk aversion.
Beneficiaries’ Investment DecisionsIn this section we assume that the asset allocation decisions are made by theplan participants, rather than the plan sponsor; here, the plan members’objective function is to maximize the expected utility of pension benefits bychoosing an appropriate asset allocation. This analysis is undertaken forCases I–VI and also for Case VII, a pure defined contribution plan. Ourinterest here is to look at the resulting pension benefits for plan memberswith different levels of risk aversion, as well as the composition of theoptimal asset allocation. For simplicity, we assume that the asset allocationdecision made by the beneficiaries and their cost impact have no repercus-sive effects on plan member salaries; neither will rising supplementarycontributions lead to lower salaries/salary increases nor will reductions ofplan costs be passed on to the workers.
As earlier, we represent the plan’s portfolio allocations by the mean-variance efficient portfolio returns; details of the benefit-optimal investmentweights (i.e. the mean and volatility of asset returns, mean and certaintyequivalents of pension benefit factors for plan members as well the resultingcosts in terms of supplementary contributions for the plan sponsor) appearin Table 11-4. The first Panel contains the results for a representative planmember with a low coefficient of risk aversion (g¼ 1), while the other panelsshow findings for a medium (g ¼ 5) and a high (g ¼ 10) coefficient. Table11-5 provides details regarding the investment weights.
The results show that, independent of risk aversion, plan beneficiarieswould opt to invest in the asset allocation that offers the highest or almostthe highest expected return and the highest or almost the highest volatilityin Cases I–V. Table 11-5 indicates that the optimal asset allocation consistsof 100 percent stocks. This is because beneficiaries are protected againstdownside volatility of the international equity markets by guaranteed min-imum pension benefits and the annual capital guarantee. The value of thisdownside protection ceteris paribus increases with the volatility. By analogyto option pricing theory, the minimum pension benefit and the capital
11 // Understanding and Allocating Investment Risks 217

guarantee can be interpreted as a call option, for which the value is alsopositively related to the volatility of the underlying.
Looking at the level of supplementary contributions associated withthese asset allocations, it would appear that costs for the plan sponsorwould be prohibitively high. This is particularly true for Case V, in whichthe members’ individual accounts are protected against negative fluctu-ations in the capital markets while at the same time offering full participa-tion in positive returns. Here, the certainty equivalents of the pension
Table 11-4 Optimal Investment Decision: The Plan Participants’ Perspective
Case I Case II Case III Case IV Case V Case VI Case VII
Panel 1: Low level of risk aversion (g ¼ 1) (%)Mean return 7.68 7.68 7.68 7.68 7.68 7.68 7.68Volatility 17.27 17.27 17.27 17.27 17.27 17.27 17.27Mean DSC 30.91 24.60 29.80 26.58 126.85 14.29 0.005%-VaR DSC 87.93 75.71 79.28 84.52 246.62 51.33 0.00Mean PB 1.974 1.915 3.937 1.949 6.890 1.948 3.793Certainty equivalent 1.974 1.914 3.355 1.948 6.014 1.918 3.093
Panel 2: Medium level of risk aversion (g ¼ 5)(%)Mean return 7.68 7.61 7.68 7.68 7.68 5.89 6.33Volatility 17.27 16.83 17.27 17.27 17.27 6.18 8.74Mean DSC 30.91 24.14 29.80 26.58 126.85 7.35 0.005%-VaR DSC 87.93 74.14 79.28 84.52 246.62 26.06 0.00Mean PB 1.974 1.915 3.937 1.949 6.890 1.937 2.543Certainty equivalent 1.973 1.909 2.449 1.947 4.011 1.827 2.007
Panel 3: High level of risk aversion (g ¼ 10) (%)Mean return 7.68 7.61 7.61 7.68 7.68 5.76 5.76Volatility 17.27 16.83 16.83 17.27 17.27 5.53 5.53Mean DSC 30.91 24.14 29.22 26.58 126.85 7.98 0.005%-VaR DSC 87.93 74.14 77.68 84.52 246.62 26.31 0.00Mean PB 1.974 1.915 3.847 1.949 6.890 1.930 2.155Certainty equivalent 1.973 1.902 2.160 1.944 2.990 1.729 1.760
Source: Authors’ calculations.Notes: DSC (i.e. discounted supplementary contributions): contributions required on top offixed regular contributions to fully fund the pension plan (in percent of expected dis-counted regular contributions); PB (i.e. pension benefits): attainable income replacementfactor (in percent of final salary per year of service); Gamma (g): parameter of risk aversionin a constant relative risk aversion (CRRA-) utility function of the type:u(W ) ¼ W 1�g=(1� g); Objective function: maximize the expected utility of pension bene-fits using a CRRA-utility function defined over the pension benefits in percent of final salaryper year of service; Case I: DCþminimum benefitsþmaximum benefitsþ capital guaran-tee; Case II: DC þ minimum benefits þ maximum benefits; Case III: DC þ minimumbenefits; Case IV: DC þ maximum benefits þ capital guarantee; Case V: DC þ capitalguarantee; Case VI: DCþ capital guaranteeþ 10% cap on asset return; Case VII: DC.
218 Peter Albrecht et al.

benefit factors vary between 6.014 percent for a low-risk aversion (g ¼ 1)and 2.99 percent for a higher risk aversion (g ¼ 10). These high pensionbenefits are associated with worst-case (mean) supplementary contribu-tions of 247 percent (127 percent).
Cases I, II, and IV limit the upside potential available to the beneficiariesby incorporating the maximum pension benefit restriction. This results inlower benefits and lower costs compared to Case V, yet plan members stillhave the incentive to choose portfolios with very high volatility. Eventhough the costs are substantially reduced, they are still intolerably high.For example in Case IV, i.e. Case V with incorporated maximum benefitlimit, the worst-case (expected) supplementary contributions amount to 85percent (27 percent), being about three times as high as in case the plansponsor chooses the asset allocation.
Case VI produces a different picture: now, the annual capital guaranteeand a 10 percent cap on the maximum annual asset return is credited tothe beneficiaries’ individual accounts. Beneficiaries with a low level of riskaversion (g ¼ 1) will still invest in the maximum expected return/max-imum volatility portfolio, but more risk-averse plan members will choose an
Table 11-5 Optimal Asset Allocations: Participant Perspectives
Case I Case II Case III Case IV Case V Case VI Case VII
Panel 1: Low level of risk aversion (g ¼ 1) (%)Cash 0.00 0.00 0.00 0.00 0.00 0.00 0.00Eurobonds 0.00 0.00 0.00 0.00 0.00 0.00 0.00Global equities 95.00 95.00 95.00 95.00 95.00 95.00 95.00EM equities 5.00 5.00 5.00 5.00 5.00 5.00 5.00
Panel 2: Medium level of risk aversion (g ¼ 5) (%)Cash 0.00 0.00 0.00 0.00 0.00 0.00 0.00Eurobonds 0.00 2.55 0.00 0.00 0.00 71.50 53.63Global equities 95.00 92.45 95.00 95.00 95.00 23.50 41.37EM equities 5.00 5.00 5.00 5.00 5.00 5.00 5.00
Panel 3: High level of risk aversion (g ¼ 10) (%)Cash 0.00 0.00 0.00 0.00 0.00 0.00 0.00Eurobonds 0.00 2.55 2.55 0.00 0.00 76.61 76.61Global equities 95.00 92.45 92.45 95.00 95.00 18.39 18.39EM equities 5.00 5.00 5.00 5.00 5.00 5.00 5.00
Source: Authors’ calculations.Notes: Objective function: maximize the expected utility of pension benefits using a CRRA-utility function defined over the pension benefits in percent of final salary per year ofservice; Case I: DCþminimum benefitsþmaximum benefitsþ capital guarantee; Case II:DC þminimum benefitsþmaximum benefits; Case III: DCþminimum benefits; Case IV:DCþmaximum benefitsþ capital guarantee; Case V: DCþ capital guarantee; Case VI: DCþ capital guarantee þ 10% cap on asset return; Case VII: DC.
11 // Understanding and Allocating Investment Risks 219
asset allocation with substantially reduced exposure to capital market risk.For a medium (high) level of risk aversion (g ¼ 5 vs. 10), the allocationto bonds will increase from none (at g ¼ 1), to 72 (79) percent (see Table11-5). We compare this benefit optimal asset allocation from the members’perspective (with moderate-to-high risk aversion) to the cost optimalasset allocation from the sponsor’s perspective in Panel 1 of Table 11-3. Itis interesting that from both perspectives, the optimal investment strategyis nearly identical—to have high exposure to bonds and low exposure toequities. This results in quite similar cost implication in terms of supple-mentary contributions. If the plan sponsor were to set the asset allocation,the 5 percent Value-at-Risk of supplementary contributions would be 26percent (Panel 2 of Table 11-3); if the representative member with amedium- or high-risk aversion selected the optimal asset allocation forhim, this would result in supplementary contributions for the plan sponsorof 26 percent. Hence, if the benefit structure of the pension plan isdesigned according to Case VI, this will lead to ‘harmony’ of the members’and sponsor’s interests, at least with respect to the asset allocation decisionfor a given plan design.
Case VI might seem to be most suitable for a hybrid pension plan, as itcombines acceptable cost consequences for the sponsor and attractivepension benefit factors for the plan members. Nevertheless, a superiorplan design exists. Case VII is a pure defined contribution plan with nocapital guarantee and no return cap. By construction, this plan causes noadditional costs in term of supplementary contributions for the sponsor.Additionally, as shown in Table 11-4, a pure DC plan provides higher meanpension benefits as well as certainty equivalents for all levels of risk aversion.This result is due to the specification of the floor/cap structure, i.e. aminimum rate of return of 0 percent per year and a return maximum of10 percent per year. Setting the cap to an annual return of 12.5 percent andleaving the floor constant at 0 percent leads to the following results: Formembers with a low level of risk aversion (g¼ 1), the certainty equivalent forthe benefit factor of the hybrid plan is still lower than in the case of a pureDC plan (2 percent compared to 3 percent). For members with medium tohigh levels of risk aversion (g ¼ 5 or 10), the hybrid plan is more attractivethan the pure defined contribution plan.13 Yet when increasing the cap to12.5 percent, the plan members will again choose the maximum volatilityportfolio (i.e.100 percent equities), independent of their level of risk aver-sion. Unfortunately this will cause unacceptable costs in terms of supple-mentary contributions for the plan sponsor.
ConclusionsThis chapter evaluates key properties of hypothetical hybrid pensionplans in terms of their cost consequences, by adapting a pure defined
220 Peter Albrecht et al.

contribution scheme to include minimum and maximum limits forpension benefits, as well as minimum guarantees and return caps onindividual investment accounts. We also explore optimal investment strat-egies from the perspectives of both plan sponsor and beneficiaries. We findthat introducing DB elements substantially increases the overall costs ofrunning the pension plan and has a major impact on the resulting optimalportfolios.
The investment strategy chosen and the additional plan costs showstrong interrelationship. If only minimum rate of return guarantees areincluded in the plan design, additional costs increase exponentially as afunction of higher expected asset return and volatility. Consequently, plansponsors choose the minimum risk portfolio consisting of around 70percent cash, around 30 percent bonds, and virtually no equities. Enhan-cing this plan with a cap on returns credited to the individual accountsleads to a U-shaped cost curve for a broad range of possibleasset allocations. Here, the optimal portfolio consists of about 69 percentbonds and 31 percent equities, i.e. about 50 percent more equities than forany other plan design optimized from the sponsor’s perspective. At thesame time, with this design the additional costs are reduced to 26 percentfrom 28 percent in the case without the return cap.
For plan designs that guarantee minimum pension benefits, the impliedadditional costs (expected and worst-case values) are also U-shaped as afunction of expected investment returns. Therefore, assuming the objectiveto minimize the worst-case value of additional costs, the sponsor will opt forasset allocations which deviate from the minimum risk allocation as well.These portfolios comprise between 77 and 84 percent bonds and between16 and 23 percent equities. The additional costs for these plans lie in therange of 42 and 44 percent of regular contributions, i.e. about 50 percentabove the costs of a plan only guaranteeing a minimum rate of return.
Taking beneficiaries’ perspective, we also evaluate the utility implicationsof alternative DB elements and sponsor pension fund asset allocation de-cisions. To this end, certainty equivalents of pension benefits are calculatedfor a range of risk aversion parameters. Generally higher additional costsimply higher expected pension benefits, but the introduction of caps oncredited asset returns allows cost reductions with only slightly lower cer-tainty equivalents of random pension benefits. We also evaluate optimalinvestment choices from the beneficiaries’ perspective, and we find thatalmost independent of risk aversion, plan members tend to select maximumreturn, maximum risk asset allocations where the plan either guaranteesminimum pension benefits or minimum return guarantees. However, if theminimum rate of return guarantees are combined with a cap on the max-imum return credited to individual accounts, risk-averse members opt forless risky asset allocations. In this case, the optimal asset allocation includesabout 72 percent in bonds and 28 percent in equities.
11 // Understanding and Allocating Investment Risks 221

Our results are directly relevant to the moral hazard problem faced byagencies’ insurance pension plan defaults, including the PBGC in the USA,and the newly established Pension Protection Fund in the UK (see, e.g.Coronado and Liang 2006; McCarthy and Neuberger 2006; Warshawskyet al. 2006). Like the plan sponsor in this chapter, those organizations issuea put option on the value of the assets invested in the insured pensionplans. They therefore should be interested in rather conservative pensionfund asset allocations mainly concentrated in bonds. If, as for the benefi-ciaries in this chapter, the price of such an option (i.e. the insurancepremium) is set independently of its value, and if the insured party caninfluence the value, there is a chance that the insured party will seek toboost the probability of exercising the option—by investing in high-riskassets or by underfunding the pension plan. A possible solution to thismoral hazard problem is to implement funding requirements that take intoaccount both current level of funding as well as investment risk, as forexample is done for the German Individual Investment Accounts (‘Riester’accounts; cf. Maurer and Schlag 2004).
The analysis presented in this study can be useful when discussingpossible designs of hybrid pension plans. Some plan designs appear to bePareto-inefficient (e.g. minimum and maximum pension benefits in com-bination with minimum rate of return guarantee) as they are dominated byothers which imply lower additional costs and higher expected utility forplan members. Furthermore, if plan sponsors and beneficiaries are jointlyresponsible for investment decision, caps on investment returns may re-duce conflicts of interest as asset allocations will diverge less between theparties.
Endnotes1. Pension promises in the USA have traditionally been either of the pure DB or
pure DC type (Schieber 2003). In a DB scheme, the plan sponsor promises to theplan beneficiaries a final level of pension benefits. This level is usually definedaccording to a benefit formula, as a function of salary trajectory and years ofservice. Benefits are usually paid as a life annuity rather than as a lump sum. AsBodie et al. (1988) note, the foremost advantage of a DB plan is that it offersstable income replacement rates to retired beneficiaries. The major drawbacks ofDB schemes include the lack of benefit portability when leaving the companyand the complex valuation of plan liabilities. Moreover, the plan sponsor isexposed to substantial investment and longevity risk, which could result insignificant contribution expenses. In a DC scheme, by contrast, the plan sponsorcommits to paying funds into the beneficiaries’ individual accounts according toa specified formula, e.g. a fixed percentage of annual salary. The most promin-ent feature of a DC scheme is its inherent flexibility: by construction, it is fullyfunded in individual accounts. The value of the pension benefits is simplydetermined as the market value of the backing assets. Therefore, the pension
222 Peter Albrecht et al.

benefits are easily portable in case of job change. Additionally, the beneficiarieshave control over their funds’ investment strategy and at retirement can usuallytake the money as a life annuity, a phased withdrawal plan, a lump sum payment,or some combination of these. While the employer is only obliged to makeregular contributions, the employee bears the risk of uncertain replacementrates, especially caused by fluctuations in the capital markets (Bodie and Merton1992).
2. An in-depth discussion of the implications of introducing hybrid pension plansin the USA can—among others—be found in Clark and Schieber (2004), Cor-onado and Copeland (2004), Johnson and Steuerle (2004), and Mitchell andMulvey (2004).
3. The European Central Bank (ECB) operates a hybrid pension scheme; planassets, which exist solely for the purpose of providing benefits for members ofthe plan and their dependents, are included in the other assets of the ECB.Benefits payable, resulting from the ECB’s contributions, have minimum guar-antees underpinning the DC benefits.
4. For example, we do not handle dependent benefits and we assume a simplifiedpopulation model.
5. A contribution rate of 17 percent can be considered as reasonable assumptiongiven the typical structure of European pension plans. For example, in Germany,contributions to the state-run pay-as-you-go pension system currently amount to19.5 percent of salaries. As provisions for dependents’ pensions are neglected inthis study, reducing the contribution rate by 2.5 percent compared to theGerman state pension system seems a reasonable assumption.
6. Alternatively to a focus on absolute return, a minimum fixed rate of returnguarantee could be applied to a relative rate of return. For example, Chile’sprivate pension funds were long required to earn an annual real rate of returnthat depended on the average annual real rate of return earned by all of Chile’sprivate pension funds (Pennacchi 1999). Or the guarantee may be applied to theaccount balance at the time of retirement, instead of the assumed annual basis.
7. As is typical for public employees, the wage path until retirement is nondecreas-ing and so the guaranteed minimum pension benefits will always be lower thanthe maximum pension benefit limit.
8. This link between assets and liabilities is in contrast to the analogy developed byBodie and Davis (2000), who compare a pension plan to an equipment trust suchas those set up by an airline to finance the purchase of airplanes. Here theequipment serves as specific collateral for the associated debt obligation. Theborrowing firm’s liability is not affected by the value of the collateral. So, forinstance, if the market value of the equipment were to double, this would greatlyincrease the security of the promised payments, but it would not increase theirsize. As opposed to this scenario, in the scheme developed in this chapter, thevalue of the assets may well affect the liabilities as a high return in a given yearmay increase the value of the liabilities as outlined above.
9. A drawback of the Ornstein/Uhlenbeck process is the theoretically positiveprobability of negative nominal interest rates, but this is eliminated in thesimulation procedure by cutting off the negative nominal interest rates.
11 // Understanding and Allocating Investment Risks 223

10. The EIU forecasts are constructed with the aid of an econometric world model,maintained by the UK-based Oxford Economic Forecasting.
11. The certainty equivalent of a lottery is defined as the fixed payment thatprovides the same utility as the random lottery.
12. Analyzing the costs of Individual Account guarantees, Lachance and Mitchell(2004) argue that guarantee costs tend to be insensitive to the asset allocationin cases where the exercise of the guarantees is either extremely likely orextremely unlikely.
13. The certainty equivalents are 2.100 percent compared to 2.007 percent for g¼ 5,and 1.913 percent compared to 1.760 percent for g ¼ 10.
ReferencesBacinello, Anna R. (2000). ‘Valuation of Contingent-Claims Characterizing Particu-
lar Pension Schemes’, Insurance: Mathematics and Economics, 27: 177–88.Bernadell, Carlos, Joachim Coche, and Ken Nyholm (2005). ‘Yield Curve Prediction
for the Strategic Investor’, Working Paper, European Central Bank, forthcoming.Bodie, Zvi and E. Philip Davis (2000). The Foundations of Pension Finance. Chelten-
ham, UK: Edward Elgar, p. xvi.—— and Robert C. Merton (1992). ‘Pension Benefit Guarantees in the United
States: A Functional Analysis’, in Raymond Schmitt (ed.), The Future of Pensions inthe United States. Philadelphia, PA: University of Pennsylvania Press, pp. 194–234.
—— Alan J. Marcus, and Robert C. Merton (1988). ‘Defined Benefit versus DefinedContribution Pension Plans: What Are the Real Tradeoffs?’ in Zvi Bodie, John B.Shoven, and David A. Wise (eds.), Pensions in the U.S. Economy. Chicago, IL:University of Chicago Press, pp. 139–62.
Clark, Robert and Sylvester J. Schieber (2004). ‘Adopting Cash Balance PensionPlans: Implications and Issues’, The Journal of Pension Economics and Finance, 3(3):271–95.
Coronado, Julia L. and Nellie Liang (2006). ‘The Influence of PBGC Insurance onPension Fund Finances’, this volume.
—— and Philip C. Copeland (2004). ‘Cash Balance Pension Plan Conversions andthe New Economy’, The Journal of Pension Economics and Finance, 3(3): 297–314.
Johnson, Richard W. and Eugene Steuerle (2004). ‘Promoting Work at Older Ages:The Role of Hybrid Pension Plans in an Aging Population’, The Journal of PensionEconomics and Finance, 3(3): 315–37.
Lachance, Marie-Eve and Olivia S. Mitchell (2004). ‘Understanding IndividualAccount Guarantees’, in Olivia S. Mitchell and Kent Smetters (eds.), The PensionChallenge: Risk Transfers and Retirement Income Security. Oxford: Oxford UniversityPress, pp. 159–86.
Maurer, Raimond and Christian Schlag (2004). ‘Money-Back Guarantees in Indi-vidual Account Pensions: Evidence from the German Pension Reform’, in OliviaS. Mitchell and Kent Smetters (eds.), The Pension Challenge: Risk Transfers andRetirement Income Security. Oxford University Press, pp. 187–213.
McCarthy, David and Anthony Neuberger (2006). ‘The UK Approach to InsuringDefined Benefit Pension Plans’, this volume.
224 Peter Albrecht et al.

Mitchell, Olivia S. and Janemarie Mulvey (2004). ‘Potential Implications of Man-dating Choice in Corporate Defined Benefit Plans’, The Journal of Pension Econom-ics and Finance, 3(3): 339–54.
Pennacchi, George G. (1999). ‘The Value of Guarantees on Pension Fund Returns’,The Journal of Risk and Insurance, 66(2): 219–37.
Pesando, James E. (1996). ‘The Government’s Role in Insuring Pensions’, in ZviBodie, Olivia S. Mitchell, and John A. Turner (eds.), Securing Employer BasedPensions: An International Perspective. Philadelphia, PA: University of PennsylvaniaPress, pp. 286–305.
Sylvester J. Schieber (2003). A Symposium on Cash Balance Pensions: Backgroundand Introduction’, Pension Research Council Working Paper, Wharton School,http://rider.wharton.upenn. edu/�prc/wpcashbalance.html
Warshawsky, Mark J., Neal McCall, and John D. Worth (2006). ‘Regulating SingleEmployer Defined Benefit Plans: A Modern Approach’, this volume.
11 // Understanding and Allocating Investment Risks 225