result update february 7, 2018 lupin (lupin) |...
TRANSCRIPT

February 7, 2018
ICICI Securities Ltd | Retail Equity Research
Result Update
High base, price erosion continues to weigh
Revenues declined 11% YoY to |3976 crore (I-direct estimate: |3927
crore) mainly due to 34% YoY de-growth in US to | 1432 crore (I-
direct estimate: |1348 crore) led by high base of Metformin. India
sales grew 8% to | 1069 crore (ex GST impact growth was 11%; I-
direct estimate: |1170 crore), while Japan grew 23% to | 554 crore
(I-direct estimate: |502 crore) mainly driven by acquisition of
Shionogi’s portfolio
EBITDA margins declined 981 bps YoY to 17.3% (I-direct estimate:
20.7%) mainly on account of high base of Metformin sales in Q3FY17
and forex loss component (| 82.1 crore). EBITDA declined 43% YoY
to | 688 crore below I-direct estimate of | 815 crore.
Net profit declined 65% YoY to | 221 crore (I-direct estimate: | 384
crore) owing to a weak operational performance, higher depreciation
and lower other income (forex gain in Q3FY17)
US main growth engine but cGMP issues, pricing headwinds to the fore
Lupin’s US business (~47% of total turnover) owns one of the largest
ANDA pipelines comprising 382 filed ANDAs and 151 pending approvals
including ~33 FTFs. However, in line with the US generic woes this
segment is facing headwinds due to persisting pricing pressure and
recent warning letter for Goa (oral solid) and Indore (oral solid,
ophthalmic) formulation plants. The company is looking for branded
products and complex generics to overcome this issue. We expect US to
decline to |6164 crore in FY20E from |8263 crore in FY17 due to pricing
pressure and competition besides slower offtake from Goa.
Indian formulations growth steady
Lupin ranks seventh in domestic formulations with a market share of
3.3%. The acute: chronic ratio for the company is at 26:74. In terms of MR
productivity, at ~| 58 lakh per MR it has one of the best MR productivity
among large cap peers. Also, tie-ups with Eli Lilly, Boehringer for anti-
diabetics and with MSD for pneumonia vaccines are some steps to
bolster the domestic franchise. We expect sales from India to grow at a
CAGR of 12% in FY17-20E to | 5378 crore.
Core strength in geographical diversification, strong financials
Lupin has established a significant presence in the US by 1) focusing on
limited competition/FTF opportunities, 2) concentration on niche
therapies such as oral contraceptives, dermatology, ophthalmology,
respiratory, etc, and 3) acquiring small but profitable brands at the right
price. It is slowly but surely establishing itself in other geographies such
as Japan and Australia. Higher growth on a fairly consistent basis and a
healthy balance sheet (despite Gavis acquisition) are some of the
differentiators for Lupin besides management pedigree.
US woes nearing bottom; new launches, cGMP resolution to hold key
Q3 numbers were impacted due to high base in the US. However, the
silver lining was sequential growth of ~6%. Note that the warning letter
has compounded Lupin’s woes besides pricing issues but sequential
growth suggests that new product launches are still holding the key for
Lupin. Hence, going forward any further price erosion can bel offset by
new launches as the company’s pace of product launches still remains
high despite warning letter. However, we believe overall scenario in the
US will take some time to normalize. Our target price arrives at | 850
based on 18x FY20E EPS of | 45.2 and an NPV of | 34 resulting from
Lupin’s Symbiomix acquisition. We maintain HOLD as we believe the US
woes are too opaque to be made good by performances in other
geographies.
Rating matrix
Rating : Hold
Target : | 850
Target Period : 15-18 months
Potential Upside : 6%
What’s Changed?
Target Changed from | 890 to | 850
EPS FY18E Changed from | 35.5 to | 30.2
EPS FY19E Changed from | 38.5 to | 35.1
EPS FY20E Changed from | 47.6 to | 45.2
Rating Unchanged
Quarterly Performance
Q3FY18 Q3FY17 YoY (%) Q2FY18 QoQ (%)
Revenue 3,975.7 4,482.9 -11.3 3,952.0 0.6
EBITDA 688.4 1,215.8 -43.4 853.1 -19.3
EBITDA (%) 17.3 27.1 -981 bps 21.6 -427 bps
Net Profit 221.2 630.7 -64.9 455.1 -51.4
Key Financials
(| Crore) FY17 FY18E FY19E FY20E
Revenues 17494.3 15726.6 16894.3 18579.2
EBITDA 4493.1 3065.5 3362.2 4042.2
Net Profit 2561.7 1363.8 1587.2 2043.1
EPS (|) 56.7 30.2 35.1 45.2
Valuation summary
FY17 FY18E FY19E FY20E
PE (x) 14.2 26.6 22.9 17.8
Target PE (x) 15.0 28.1 24.2 18.8
EV to EBITDA (x) 9.2 13.1 11.6 9.3
Price to book (x) 2.7 2.5 2.3 2.1
RoNW (%) 19.0 9.3 10.0 11.6
RoCE (%) 16.6 10.0 10.9 13.7
Stock data
Particular
Market Capitalisation
Debt (FY17)
Cash (FY17)
EV
52 week H/L (|) 1520/782
Equity capital
Face value (|) | 2
| 90.4 crore
Amount
| 36363 crore
| 43625 crore
| 7961 crore
| 699 crore
Price performance (%)
1M 3M 6M 1Y
Lupin -10.6 -6.5 -18.3 -44.8
Dr Reddy's -15.0 -11.6 -4.7 -30.9
Sun Pharma -5.1 4.0 9.3 -17.5
Research Analyst
Siddhant Khandekar
Mitesh Shah
Harshal Mehta
Lupin (LUPIN) | 804
ICICI Securities Ltd | Retail Equity Research Page 2
Variance analysis
(| crore) Q3FY18 Q2FY18E Q3FY17 Q2FY18 YoY (%) QoQ (%) Comments
Revenue 3,975.7 3,926.6 4,482.9 3,952.0 -11.3 0.6 YoY decline was mainly due to continues decline in the in US sales
Raw Material Expenses 1,392.7 1,278.2 1,301.6 1,286.5 7.0 8.3 A 600 bps YoY contraction in gross margins to 65% mainly on the back high
base of Metformin group in Q3FY17, adverse product mix and | 10 crore of
forex loss
Employee Expenses 693.1 734.3 731.2 725.0 -5.2 -4.4
Other Expenditure 1,201.5 1,099.4 1,234.3 1,087.4 -2.7 10.5 Included forex loss of | 72 crore
EBITDA 688.4 814.6 1,215.8 853.1 -43.4 -19.3
EBITDA (%) 17.3 20.7 27.1 21.6 -981 bps -427 bps YoY decline in margin mainly due to high base of Metformin and forex loss.
Miss vis-à-vis I-Direct was mainly due to forex loss and lower gross margins
Interest 54.0 56.0 45.9 47.9 17.6 12.7
Depreciation 280.4 262.9 230.9 272.2 21.4 3.0 YoY increase in depreciation mainly due to Gavis amortisation
Other Income 28.4 32.3 103.6 74.0 -72.6 -61.6
PBT 382.5 528.1 1,042.6 607.0 -63.3 -37.0
Tax 160.8 142.6 409.5 154.1 -60.7 4.4 Included deferred tax of ~| 40 crore pertaining to US
PAT before MI 221.7 385.5 633.1 453.0 -65.0 -51.1
Minority Interest 0.5 1.6 2.4 1.9 -78.8 -73.1
Net Profit 221.2 383.9 630.7 455.1 -64.9 -51.4 Changes vis-à-vis EBITDA was mainly due to higher deferred tax and
depreciation
Key Metrics
India 1,068.8 1,169.6 991.2 1,159.3 7.8 -7.8 Ex-accounting adjustment (GST related), domestic growth was 11% YoY. Miss
vis-à-vis I-direct estimates was mainly due to longer-than-expected GST
impact
Japan 553.5 502.1 449.2 503.0 23.2 10.0 Strong sales YoY mainly due to acquisition of Shionogi's portfolio.
US 1,432.1 1,347.6 2,175.5 1,361.1 -34.2 5.2 YoY decline mainly due to price erosion in Metformin group. Miss vis-à-vis I-
direct estimates was mainly due to better-than-expected new launches sales
and gain in volume in existing business
Europe 151.3 157.1 142.8 144.0 6.0 5.1 Constant currency sales in Germany increased 20.8% YoY to €8.7 million
South Africa 120.8 124.3 112.7 131.8 7.2 -8.4
ROW markets 305.9 304.9 265.1 310.0 15.4 -1.3
API 268.0 243.7 268.4 265.0 -0.1 1.1
Change in estimates
(| Crore) Old New % Change Old New % Change
Revenue 15,633.5 15,726.6 0.6 16,726.3 16,894.3 1.0
EBITDA 3,279.3 3,065.5 -6.5 3,576.5 3,362.2 -6.0
EBITDA Margin (%) 21.0 19.5 -151 bps 21.4 19.9 -150 bps Changed mainly due to change in product mix
PAT 1,601.4 1,363.8 -14.8 1,740.6 1,587.2 -8.8
EPS (|) 35.5 30.2 -14.9 38.5 35.1 -8.7 Changed mainly in sync with operational performance and higher tax rate in Q3FY18
FY18E FY19E
Assumptions
Current Comments
(| crore) FY16 FY17 FY18E FY19E FY18E FY19E
India 3,406.4 3,815.7 4,127.2 4,676.9 4,298.3 5,064.3 Changed mainly due to higher than expected GST Impact
Japan 1,364.2 1,779.1 2,080.5 2,289.5 2,029.1 2,232.5
US 5,913.2 8,262.6 5,796.9 5,835.2 5,601.0 5,329.8 Increased FY19 sales mainly due better than expected product launches despite
warning letter
Europe 455.4 529.4 568.1 624.9 573.9 631.3
South Africa 399.7 482.2 530.3 611.5 533.8 615.6
ROW markets 947.0 1,084.2 1,265.5 1,455.3 1,264.5 1,454.1
API 1,214.9 1,138.4 1,067.9 1,089.2 1,043.5 1,064.4
Earlier
Source: Company, ICICIdirect.com Research
ICICI Securities Ltd | Retail Equity Research Page 3
Company Analysis
From a global leader in anti-tuberculosis (TB) and other infectious
diseases to one of the fastest growing prescription companies in the US,
Lupin has come a long way to emerge as a leading Indian generic
exporter. Established in 1968, the company adapted well as per the
changed industry dynamics like other peers such as Sun, Dr Reddy’s,
Ranbaxy and Cipla. During this journey, it changed focus in therapies -
from acute to chronic and also geographies, from domestic driven to
export oriented. It received USFDA approvals for two facilities-
Ankaleshwar and Mandideep way back in 1989. Besides this, the
company has been fairly active on the global M&A front. It has acquired
companies in Japan (significant acquisitions), Australia, Philippines and
South Africa. Similarly, the company also acquired small ticket but
lucrative brands in the US (Suprax, Antara, Locoid lotion, Inspira Chamber
and Alinia). Its latest acquisition, however, has been a complex injectable
technology based company (Nanomi) in the Netherlands. Infrastructure -
11 manufacturing facilities including two in Japan – seven formulations
(three USFDA approved) and four APIs (two USFDA approved).
Lupin's US subsidiary expanded into women's heath segment by
acquiring Symbiomix Therapeutics. USFDA approved Symbiomix's lead
candidate, Solosec oral granules to treat gynaecological infection and the
management expects the drug to be commercially available by H2CY18.
The drug has been designated as Qualified Infectious Disease Product
(QIDP) and is eligible for at least 10 years of exclusivity in the US. The
deal was made for a cash consideration of US$150 million, which includes
US$50 million of upfront payment by Lupin and rest time-bound
payments. The management believes the payback to be less than 5-6
years for the product. US has 6 million prescription base for this disease.
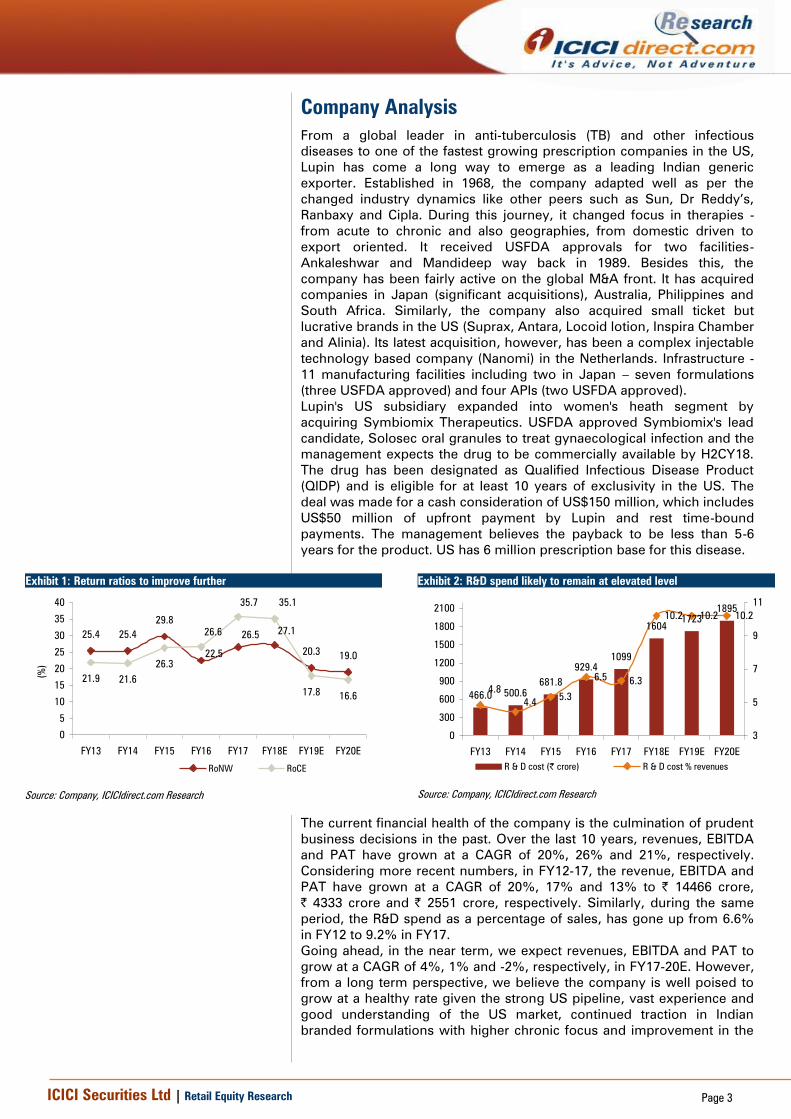
Exhibit 1: Return ratios to improve further
25.4 25.4
19.0
21.9 21.6
17.8
29.8
22.5
26.527.1
20.3
26.3
26.6
35.7 35.1
16.6
0
5
10
15
20
25
30
35
40
FY13 FY14 FY15 FY16 FY17 FY18E FY19E FY20E
(%
)
RoNW RoCE
Source: Company, ICICIdirect.com Research
Exhibit 2: R&D spend likely to remain at elevated level
466.0 500.6
681.8
929.4
1099
1604
1723
1895
5.3
6.56.3
10.2 10.2 10.2
4.8
4.4
0
300
600
900
1200
1500
1800
2100
FY13 FY14 FY15 FY16 FY17 FY18E FY19E FY20E
3
5
7
9
11
R & D cost (| crore) R & D cost % revenues
Source: Company, ICICIdirect.com Research
The current financial health of the company is the culmination of prudent
business decisions in the past. Over the last 10 years, revenues, EBITDA
and PAT have grown at a CAGR of 20%, 26% and 21%, respectively.
Considering more recent numbers, in FY12-17, the revenue, EBITDA and
PAT have grown at a CAGR of 20%, 17% and 13% to | 14466 crore,
| 4333 crore and | 2551 crore, respectively. Similarly, during the same
period, the R&D spend as a percentage of sales, has gone up from 6.6%
in FY12 to 9.2% in FY17.
Going ahead, in the near term, we expect revenues, EBITDA and PAT to
grow at a CAGR of 4%, 1% and -2%, respectively, in FY17-20E. However,
from a long term perspective, we believe the company is well poised to
grow at a healthy rate given the strong US pipeline, vast experience and
good understanding of the US market, continued traction in Indian
branded formulations with higher chronic focus and improvement in the
ICICI Securities Ltd | Retail Equity Research Page 4
Japanese market, which is perhaps the only geography where there is a
scope for improvement. On the R&D front, we see the composition spend
tilting towards NDDS, NCEs, biosimilars from the current ANDA/NDA
albeit gradually to prepare for the scenario beyond 2020.
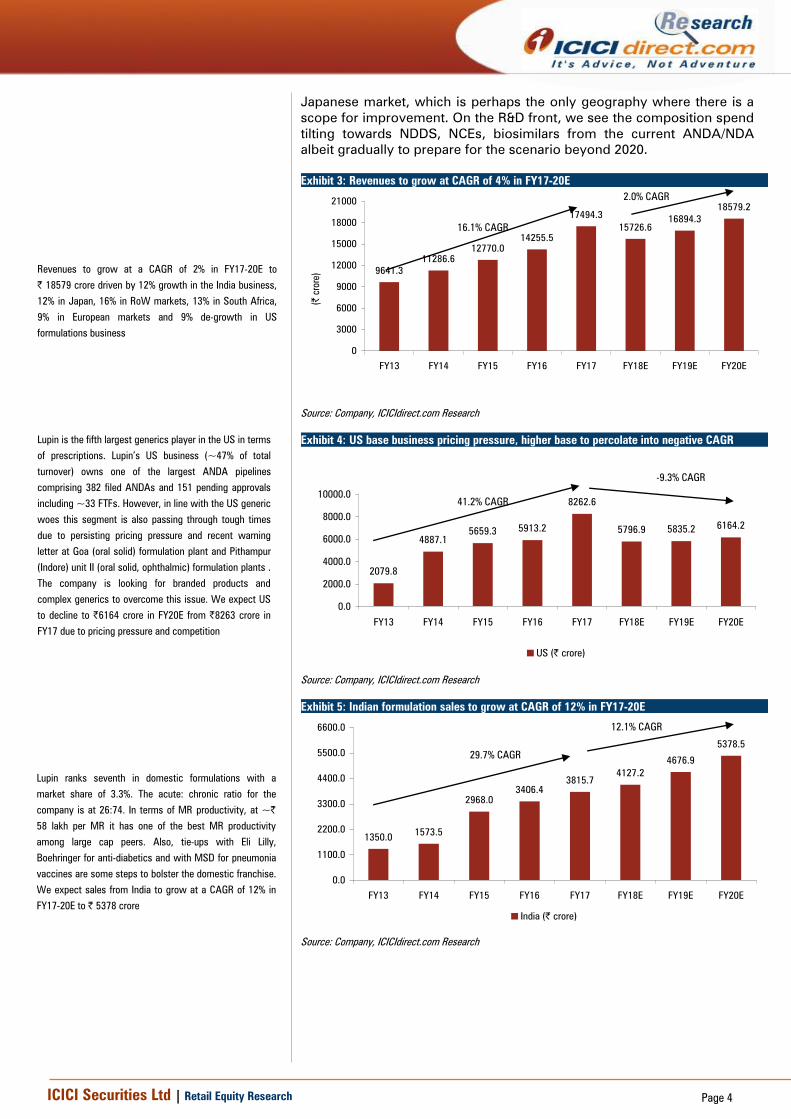
Exhibit 3: Revenues to grow at CAGR of 4% in FY17-20E
9641.3
11286.6
12770.0
14255.5
17494.3
15726.6
16894.3
18579.2
0
3000
6000
9000
12000
15000
18000
21000
FY13 FY14 FY15 FY16 FY17 FY18E FY19E FY20E
(|
crore)
Source: Company, ICICIdirect.com Research
Exhibit 4: US base business pricing pressure, higher base to percolate into negative CAGR
2079.8
4887.1
5659.35913.2
8262.6
5796.9 5835.26164.2
0.0
2000.0
4000.0
6000.0
8000.0
10000.0
FY13 FY14 FY15 FY16 FY17 FY18E FY19E FY20E
US (| crore)
Source: Company, ICICIdirect.com Research
Exhibit 5: Indian formulation sales to grow at CAGR of 12% in FY17-20E
1350.01573.5
2968.0
3406.4
3815.7
4127.2
4676.9
5378.5
0.0
1100.0
2200.0
3300.0
4400.0
5500.0
6600.0
FY13 FY14 FY15 FY16 FY17 FY18E FY19E FY20E
India (| crore)
Source: Company, ICICIdirect.com Research
Revenues to grow at a CAGR of 2% in FY17-20E to
| 18579 crore driven by 12% growth in the India business,
12% in Japan, 16% in RoW markets, 13% in South Africa,
9% in European markets and 9% de-growth in US
formulations business
Lupin is the fifth largest generics player in the US in terms
of prescriptions. Lupin’s US business (~47% of total
turnover) owns one of the largest ANDA pipelines
comprising 382 filed ANDAs and 151 pending approvals
including ~33 FTFs. However, in line with the US generic
woes this segment is also passing through tough times
due to persisting pricing pressure and recent warning
letter at Goa (oral solid) formulation plant and Pithampur
(Indore) unit II (oral solid, ophthalmic) formulation plants .
The company is looking for branded products and
complex generics to overcome this issue. We expect US
to decline to |6164 crore in FY20E from |8263 crore in
FY17 due to pricing pressure and competition
Lupin ranks seventh in domestic formulations with a
market share of 3.3%. The acute: chronic ratio for the
company is at 26:74. In terms of MR productivity, at ~|
58 lakh per MR it has one of the best MR productivity
among large cap peers. Also, tie-ups with Eli Lilly,
Boehringer for anti-diabetics and with MSD for pneumonia
vaccines are some steps to bolster the domestic franchise.
We expect sales from India to grow at a CAGR of 12% in
FY17-20E to | 5378 crore
16.1% CAGR
2.0% CAGR
41.2% CAGR
-9.3% CAGR
29.7% CAGR
12.1% CAGR
ICICI Securities Ltd | Retail Equity Research Page 5
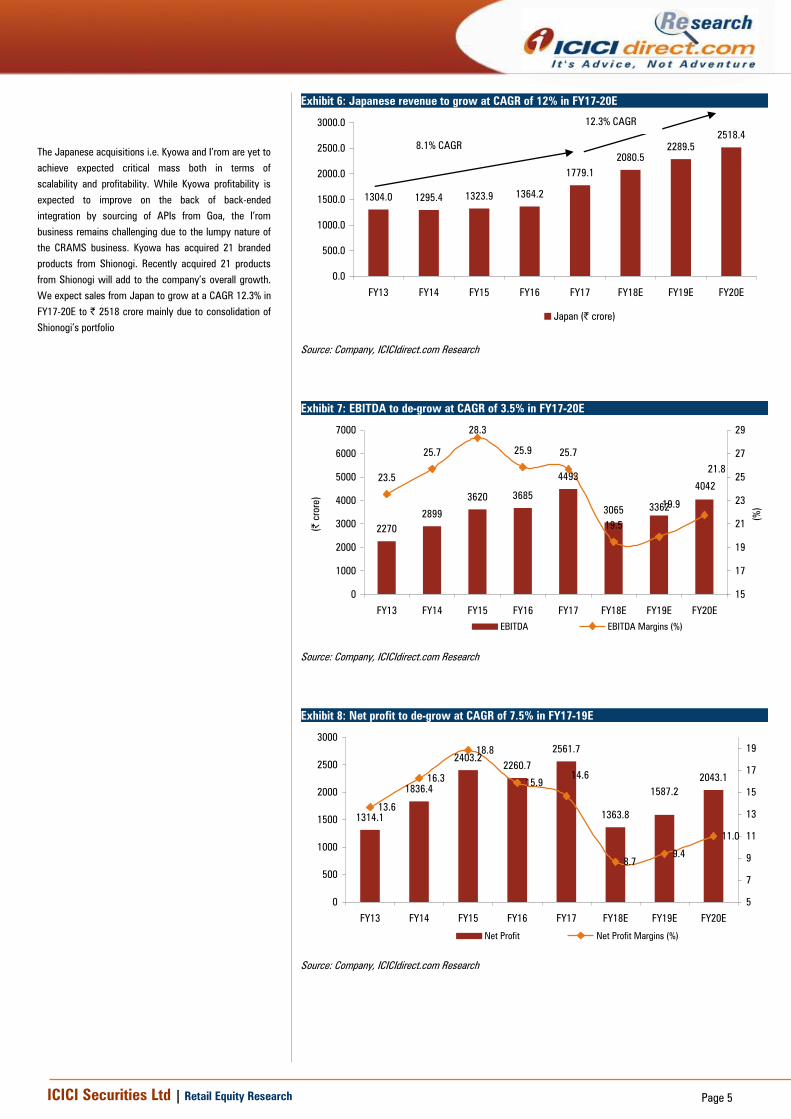
Exhibit 6: Japanese revenue to grow at CAGR of 12% in FY17-20E
1304.0 1295.4 1323.9 1364.2
1779.1
2080.5
2289.5
2518.4
0.0
500.0
1000.0
1500.0
2000.0
2500.0
3000.0
FY13 FY14 FY15 FY16 FY17 FY18E FY19E FY20E
Japan (| crore)
Source: Company, ICICIdirect.com Research
Exhibit 7: EBITDA to de-grow at CAGR of 3.5% in FY17-20E
2270
2899
3620 3685
4493
30653362
4042
23.5
25.7
28.3
25.9 25.7
19.5
19.9
21.8
0
1000
2000
3000
4000
5000
6000
7000
FY13 FY14 FY15 FY16 FY17 FY18E FY19E FY20E
(|
crore)
15
17
19
21
23
25
27
29
(%
)
EBITDA EBITDA Margins (%)
Source: Company, ICICIdirect.com Research
Exhibit 8: Net profit to de-grow at CAGR of 7.5% in FY17-19E
1314.1
1836.4
2403.2
2260.7
2561.7
1363.8
2043.1
1587.2
13.6
16.3
18.8
15.9
8.7
9.4
11.0
14.6
0
500
1000
1500
2000
2500
3000
FY13 FY14 FY15 FY16 FY17 FY18E FY19E FY20E
5
7
9
11
13
15
17
19
Net Profit Net Profit Margins (%)
Source: Company, ICICIdirect.com Research
The Japanese acquisitions i.e. Kyowa and I’rom are yet to
achieve expected critical mass both in terms of
scalability and profitability. While Kyowa profitability is
expected to improve on the back of back-ended
integration by sourcing of APIs from Goa, the I’rom
business remains challenging due to the lumpy nature of
the CRAMS business. Kyowa has acquired 21 branded
products from Shionogi. Recently acquired 21 products
from Shionogi will add to the company’s overall growth.
We expect sales from Japan to grow at a CAGR 12.3% in
FY17-20E to | 2518 crore mainly due to consolidation of
Shionogi’s portfolio
8.1% CAGR
12.3% CAGR
ICICI Securities Ltd | Retail Equity Research Page 6
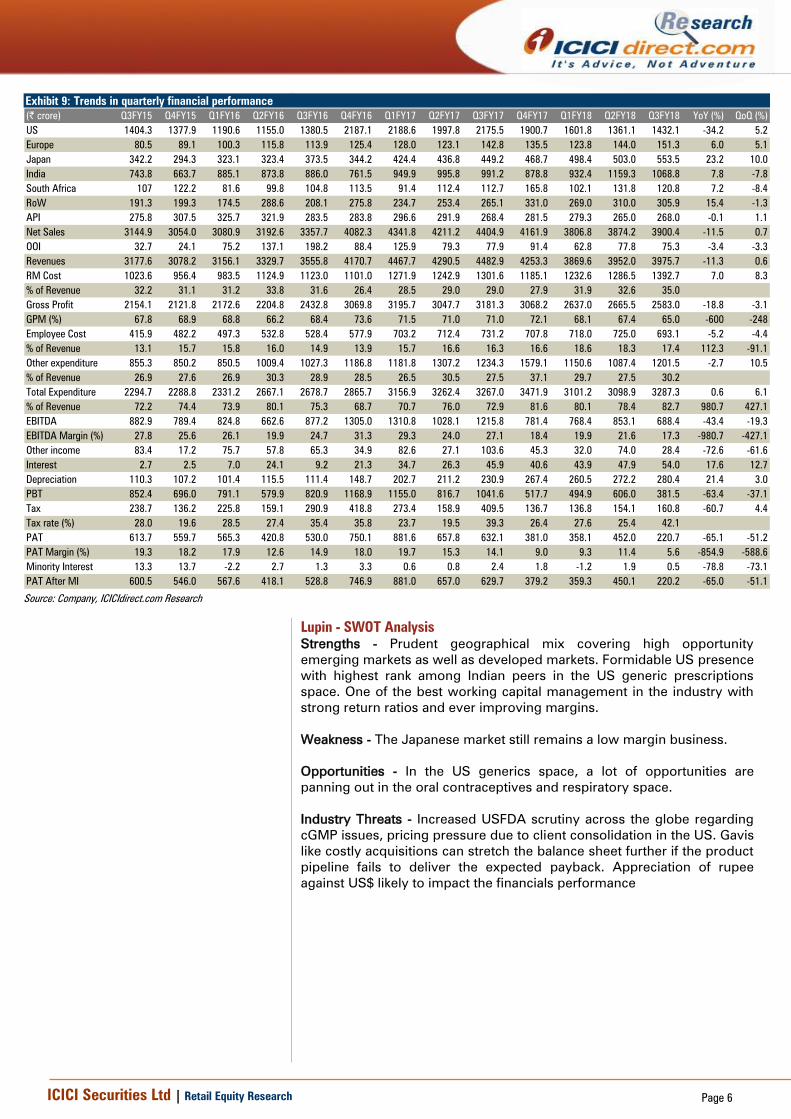
Exhibit 9: Trends in quarterly financial performance
(| crore) Q3FY15 Q4FY15 Q1FY16 Q2FY16 Q3FY16 Q4FY16 Q1FY17 Q2FY17 Q3FY17 Q4FY17 Q1FY18 Q2FY18 Q3FY18 YoY (%) QoQ (%)
US 1404.3 1377.9 1190.6 1155.0 1380.5 2187.1 2188.6 1997.8 2175.5 1900.7 1601.8 1361.1 1432.1 -34.2 5.2
Europe 80.5 89.1 100.3 115.8 113.9 125.4 128.0 123.1 142.8 135.5 123.8 144.0 151.3 6.0 5.1
Japan 342.2 294.3 323.1 323.4 373.5 344.2 424.4 436.8 449.2 468.7 498.4 503.0 553.5 23.2 10.0
India 743.8 663.7 885.1 873.8 886.0 761.5 949.9 995.8 991.2 878.8 932.4 1159.3 1068.8 7.8 -7.8
South Africa 107 122.2 81.6 99.8 104.8 113.5 91.4 112.4 112.7 165.8 102.1 131.8 120.8 7.2 -8.4
RoW 191.3 199.3 174.5 288.6 208.1 275.8 234.7 253.4 265.1 331.0 269.0 310.0 305.9 15.4 -1.3
API 275.8 307.5 325.7 321.9 283.5 283.8 296.6 291.9 268.4 281.5 279.3 265.0 268.0 -0.1 1.1
Net Sales 3144.9 3054.0 3080.9 3192.6 3357.7 4082.3 4341.8 4211.2 4404.9 4161.9 3806.8 3874.2 3900.4 -11.5 0.7
OOI 32.7 24.1 75.2 137.1 198.2 88.4 125.9 79.3 77.9 91.4 62.8 77.8 75.3 -3.4 -3.3
Revenues 3177.6 3078.2 3156.1 3329.7 3555.8 4170.7 4467.7 4290.5 4482.9 4253.3 3869.6 3952.0 3975.7 -11.3 0.6
RM Cost 1023.6 956.4 983.5 1124.9 1123.0 1101.0 1271.9 1242.9 1301.6 1185.1 1232.6 1286.5 1392.7 7.0 8.3
% of Revenue 32.2 31.1 31.2 33.8 31.6 26.4 28.5 29.0 29.0 27.9 31.9 32.6 35.0
Gross Profit 2154.1 2121.8 2172.6 2204.8 2432.8 3069.8 3195.7 3047.7 3181.3 3068.2 2637.0 2665.5 2583.0 -18.8 -3.1
GPM (%) 67.8 68.9 68.8 66.2 68.4 73.6 71.5 71.0 71.0 72.1 68.1 67.4 65.0 -600 -248
Employee Cost 415.9 482.2 497.3 532.8 528.4 577.9 703.2 712.4 731.2 707.8 718.0 725.0 693.1 -5.2 -4.4
% of Revenue 13.1 15.7 15.8 16.0 14.9 13.9 15.7 16.6 16.3 16.6 18.6 18.3 17.4 112.3 -91.1
Other expenditure 855.3 850.2 850.5 1009.4 1027.3 1186.8 1181.8 1307.2 1234.3 1579.1 1150.6 1087.4 1201.5 -2.7 10.5
% of Revenue 26.9 27.6 26.9 30.3 28.9 28.5 26.5 30.5 27.5 37.1 29.7 27.5 30.2
Total Expenditure 2294.7 2288.8 2331.2 2667.1 2678.7 2865.7 3156.9 3262.4 3267.0 3471.9 3101.2 3098.9 3287.3 0.6 6.1
% of Revenue 72.2 74.4 73.9 80.1 75.3 68.7 70.7 76.0 72.9 81.6 80.1 78.4 82.7 980.7 427.1
EBITDA 882.9 789.4 824.8 662.6 877.2 1305.0 1310.8 1028.1 1215.8 781.4 768.4 853.1 688.4 -43.4 -19.3
EBITDA Margin (%) 27.8 25.6 26.1 19.9 24.7 31.3 29.3 24.0 27.1 18.4 19.9 21.6 17.3 -980.7 -427.1
Other income 83.4 17.2 75.7 57.8 65.3 34.9 82.6 27.1 103.6 45.3 32.0 74.0 28.4 -72.6 -61.6
Interest 2.7 2.5 7.0 24.1 9.2 21.3 34.7 26.3 45.9 40.6 43.9 47.9 54.0 17.6 12.7
Depreciation 110.3 107.2 101.4 115.5 111.4 148.7 202.7 211.2 230.9 267.4 260.5 272.2 280.4 21.4 3.0
PBT 852.4 696.0 791.1 579.9 820.9 1168.9 1155.0 816.7 1041.6 517.7 494.9 606.0 381.5 -63.4 -37.1
Tax 238.7 136.2 225.8 159.1 290.9 418.8 273.4 158.9 409.5 136.7 136.8 154.1 160.8 -60.7 4.4
Tax rate (%) 28.0 19.6 28.5 27.4 35.4 35.8 23.7 19.5 39.3 26.4 27.6 25.4 42.1
PAT 613.7 559.7 565.3 420.8 530.0 750.1 881.6 657.8 632.1 381.0 358.1 452.0 220.7 -65.1 -51.2
PAT Margin (%) 19.3 18.2 17.9 12.6 14.9 18.0 19.7 15.3 14.1 9.0 9.3 11.4 5.6 -854.9 -588.6
Minority Interest 13.3 13.7 -2.2 2.7 1.3 3.3 0.6 0.8 2.4 1.8 -1.2 1.9 0.5 -78.8 -73.1
PAT After MI 600.5 546.0 567.6 418.1 528.8 746.9 881.0 657.0 629.7 379.2 359.3 450.1 220.2 -65.0 -51.1
Source: Company, ICICIdirect.com Research
Lupin - SWOT Analysis
Strengths - Prudent geographical mix covering high opportunity
emerging markets as well as developed markets. Formidable US presence
with highest rank among Indian peers in the US generic prescriptions
space. One of the best working capital management in the industry with
strong return ratios and ever improving margins.
Weakness - The Japanese market still remains a low margin business.
Opportunities - In the US generics space, a lot of opportunities are
panning out in the oral contraceptives and respiratory space.
Industry Threats - Increased USFDA scrutiny across the globe regarding
cGMP issues, pricing pressure due to client consolidation in the US. Gavis
like costly acquisitions can stretch the balance sheet further if the product
pipeline fails to deliver the expected payback. Appreciation of rupee
against US$ likely to impact the financials performance
ICICI Securities Ltd | Retail Equity Research Page 7
Conference call highlights
On the US sales front, the base business (ex-metformin) has
shown ~6% growth in 9MFY18 mainly due to new product
launches. The management believes the price erosion has more
or less been bottomed out. Going forward further price erosion
will largely offset by volume gains.
The management expects to launch 10+ products in the US
including limited competition products like gTamiflu, Axiron
(Dermatology) in Q4FY18
About Warning letter update, the company has hired consultants.
It is sending monthly update to the USFDA. The company has
already sent 2 updates to the USFDA. It expects all related work to
be complete by Q1FY19 and post that it will plans to invite USFDA
for re-inspection
US Branded business revenues grew 25% YoY in Q3FY18, largely
driven by Methergine (Gynaecology). The company expects to
launch Solosec (Gynaecology) in Q1FY19
The company expects R&D as % of sales to come down from
current level of ~12% mainly due to rationalization of product
selection
The company expects levothyroxine (thyroid; limited competition)
and Ranolazine FTF (gRanexa; CVS) USFDA approvals in FY19.
Guided for | 800-1000 crore of capex for FY19
On the Inhalation portfolio front, the company expects to receive
approval for Ablution in CY18 or early CY19. For Tiotropium the
company expects to get exclusivity. Currently this product is in
Phase III. The company continues to work on Advair as well as
other opportunities
The company is looking to file Etanercept biosimilar in the Japan
by the end of the year and subsequently in Europe.
The company expects EBITDA margins to remain at current level
of 20-21%
ICICI Securities Ltd | Retail Equity Research Page 8
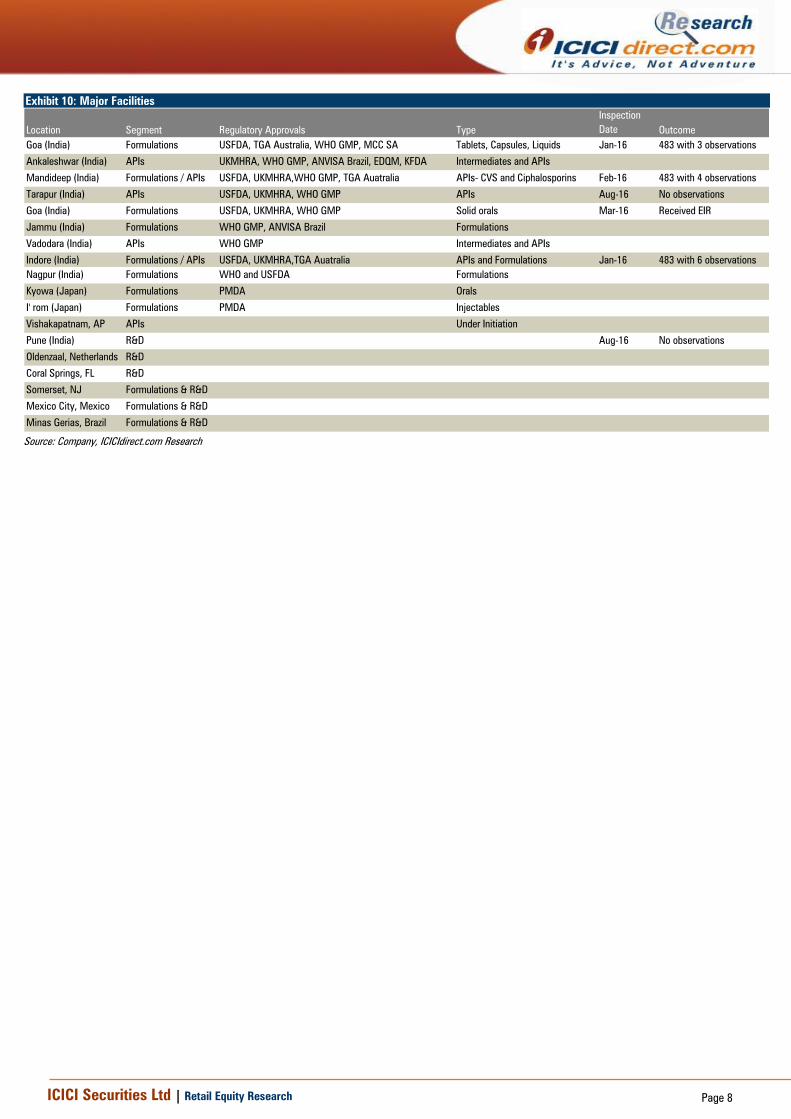
Exhibit 10: Major Facilities
Location Segment Regulatory Approvals Type
Inspection
Date Outcome
Goa (India) Formulations USFDA, TGA Australia, WHO GMP, MCC SA Tablets, Capsules, Liquids Jan-16 483 with 3 observations
Ankaleshwar (India) APIs UKMHRA, WHO GMP, ANVISA Brazil, EDQM, KFDA Intermediates and APIs
Mandideep (India) Formulations / APIs USFDA, UKMHRA,WHO GMP, TGA Auatralia APIs- CVS and Ciphalosporins Feb-16 483 with 4 observations
Tarapur (India) APIs USFDA, UKMHRA, WHO GMP APIs Aug-16 No observations
Goa (India) Formulations USFDA, UKMHRA, WHO GMP Solid orals Mar-16 Received EIR
Jammu (India) Formulations WHO GMP, ANVISA Brazil Formulations
Vadodara (India) APIs WHO GMP Intermediates and APIs
Indore (India) Formulations / APIs USFDA, UKMHRA,TGA Auatralia APIs and Formulations Jan-16 483 with 6 observations
Nagpur (India) Formulations WHO and USFDA Formulations
Kyowa (Japan) Formulations PMDA Orals
I' rom (Japan) Formulations PMDA Injectables
Vishakapatnam, AP APIs Under Initiation
Pune (India) R&D Aug-16 No observations
Oldenzaal, Netherlands R&D
Coral Springs, FL R&D
Somerset, NJ Formulations & R&D
Mexico City, Mexico Formulations & R&D
Minas Gerias, Brazil Formulations & R&D
Source: Company, ICICIdirect.com Research
ICICI Securities Ltd | Retail Equity Research Page 9
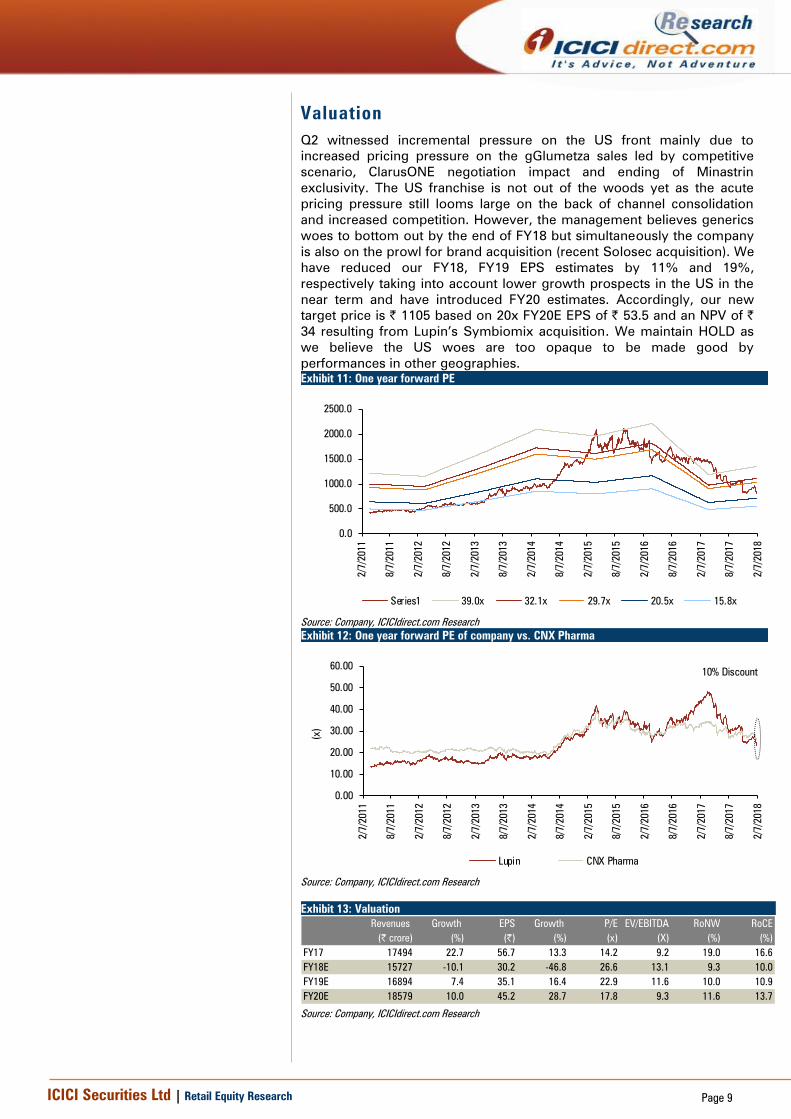
Valuation
Q2 witnessed incremental pressure on the US front mainly due to
increased pricing pressure on the gGlumetza sales led by competitive
scenario, ClarusONE negotiation impact and ending of Minastrin
exclusivity. The US franchise is not out of the woods yet as the acute
pricing pressure still looms large on the back of channel consolidation
and increased competition. However, the management believes generics
woes to bottom out by the end of FY18 but simultaneously the company
is also on the prowl for brand acquisition (recent Solosec acquisition). We
have reduced our FY18, FY19 EPS estimates by 11% and 19%,
respectively taking into account lower growth prospects in the US in the
near term and have introduced FY20 estimates. Accordingly, our new
target price is | 1105 based on 20x FY20E EPS of | 53.5 and an NPV of |
34 resulting from Lupin’s Symbiomix acquisition. We maintain HOLD as
we believe the US woes are too opaque to be made good by
performances in other geographies.
Exhibit 11: One year forward PE
0.0
500.0
1000.0
1500.0
2000.0
2500.0
2/7/2011
8/7/2011
2/7/2012
8/7/2012
2/7/2013
8/7/2013
2/7/2014
8/7/2014
2/7/2015
8/7/2015
2/7/2016
8/7/2016
2/7/2017
8/7/2017
2/7/2018
Series1 39.0x 32.1x 29.7x 20.5x 15.8x
[
Source: Company, ICICIdirect.com Research
Exhibit 12: One year forward PE of company vs. CNX Pharma
0.00
10.00
20.00
30.00
40.00
50.00
60.00
2/7/2011
8/7/2011
2/7/2012
8/7/2012
2/7/2013
8/7/2013
2/7/2014
8/7/2014
2/7/2015
8/7/2015
2/7/2016
8/7/2016
2/7/2017
8/7/2017
2/7/2018
(x)
Lupin CNX Pharma
10% Discount
Source: Company, ICICIdirect.com Research
Exhibit 13: Valuation
Revenues Growth EPS Growth P/E EV/EBITDA RoNW RoCE
(| crore) (%) (|) (%) (x) (X) (%) (%)
FY17 17494 22.7 56.7 13.3 14.2 9.2 19.0 16.6
FY18E 15727 -10.1 30.2 -46.8 26.6 13.1 9.3 10.0
FY19E 16894 7.4 35.1 16.4 22.9 11.6 10.0 10.9
FY20E 18579 10.0 45.2 28.7 17.8 9.3 11.6 13.7
Source: Company, ICICIdirect.com Research
ICICI Securities Ltd | Retail Equity Research Page 10
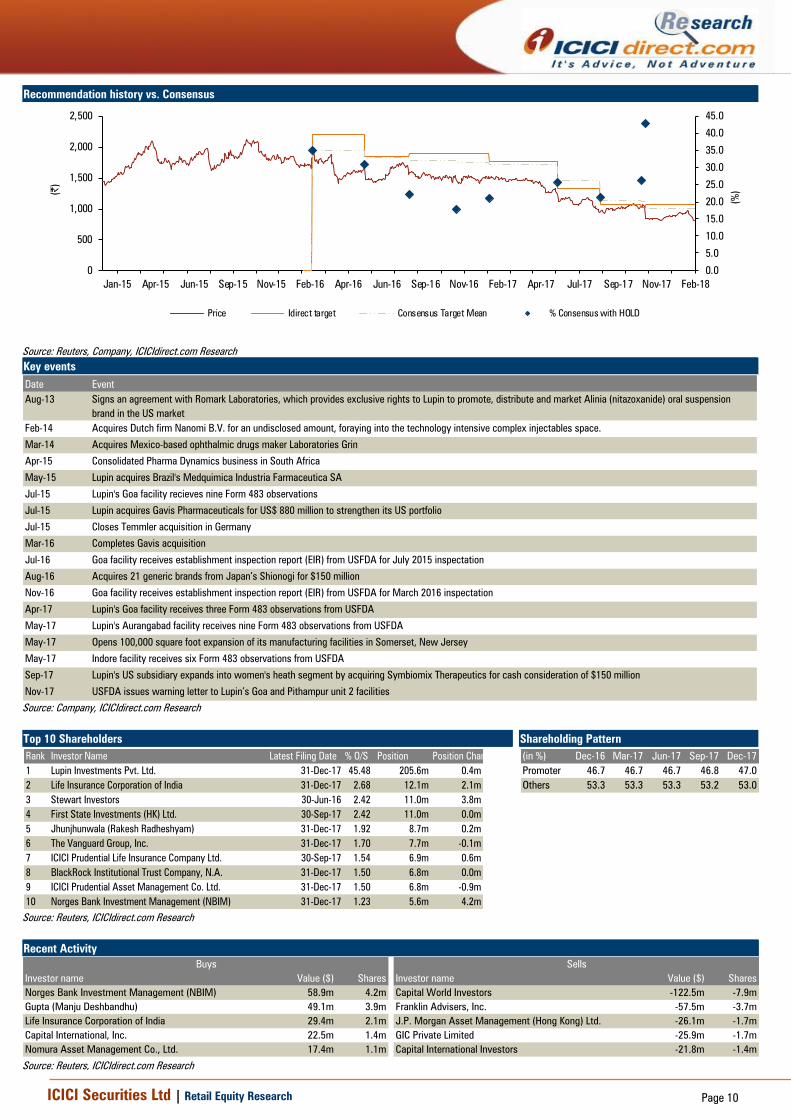
Recommendation history vs. Consensus
0.0
5.0
10.0
15.0
20.0
25.0
30.0
35.0
40.0
45.0
0
500
1,000
1,500
2,000
2,500
Feb-18Nov-17Sep-17Jul-17Apr-17Feb-17Nov-16Sep-16Jun-16Apr-16Feb-16Nov-15Sep-15Jun-15Apr-15Jan-15
(%
)(|)
Price Idirect target Consensus Target Mean % Consensus with HOLD
Source: Reuters, Company, ICICIdirect.com Research
Key events
Date Event
Aug-13 Signs an agreement with Romark Laboratories, which provides exclusive rights to Lupin to promote, distribute and market Alinia (nitazoxanide) oral suspension
brand in the US market
Feb-14 Acquires Dutch firm Nanomi B.V. for an undisclosed amount, foraying into the technology intensive complex injectables space.
Mar-14 Acquires Mexico-based ophthalmic drugs maker Laboratories Grin
Apr-15 Consolidated Pharma Dynamics business in South Africa
May-15 Lupin acquires Brazil's Medquimica Industria Farmaceutica SA
Jul-15 Lupin's Goa facility recieves nine Form 483 observations
Jul-15 Lupin acquires Gavis Pharmaceuticals for US$ 880 million to strengthen its US portfolio
Jul-15 Closes Temmler acquisition in Germany
Mar-16 Completes Gavis acquisition
Jul-16 Goa facility receives establishment inspection report (EIR) from USFDA for July 2015 inspectation
Aug-16 Acquires 21 generic brands from Japan’s Shionogi for $150 million
Nov-16 Goa facility receives establishment inspection report (EIR) from USFDA for March 2016 inspectation
Apr-17 Lupin's Goa facility receives three Form 483 observations from USFDA
May-17 Lupin's Aurangabad facility receives nine Form 483 observations from USFDA
May-17 Opens 100,000 square foot expansion of its manufacturing facilities in Somerset, New Jersey
May-17 Indore facility receives six Form 483 observations from USFDA
Sep-17 Lupin's US subsidiary expands into women's heath segment by acquiring Symbiomix Therapeutics for cash consideration of $150 million
Nov-17 USFDA issues warning letter to Lupin’s Goa and Pithampur unit 2 facilities
Source: Company, ICICIdirect.com Research
Top 10 Shareholders Shareholding Pattern
Rank Investor Name Latest Filing Date % O/S Position Position Change
1 Lupin Investments Pvt. Ltd. 31-Dec-17 45.48 205.6m 0.4m
2 Life Insurance Corporation of India 31-Dec-17 2.68 12.1m 2.1m
3 Stewart Investors 30-Jun-16 2.42 11.0m 3.8m
4 First State Investments (HK) Ltd. 30-Sep-17 2.42 11.0m 0.0m
5 Jhunjhunwala (Rakesh Radheshyam) 31-Dec-17 1.92 8.7m 0.2m
6 The Vanguard Group, Inc. 31-Dec-17 1.70 7.7m -0.1m
7 ICICI Prudential Life Insurance Company Ltd. 30-Sep-17 1.54 6.9m 0.6m
8 BlackRock Institutional Trust Company, N.A. 31-Dec-17 1.50 6.8m 0.0m
9 ICICI Prudential Asset Management Co. Ltd. 31-Dec-17 1.50 6.8m -0.9m
10 Norges Bank Investment Management (NBIM) 31-Dec-17 1.23 5.6m 4.2m
(in %) Dec-16 Mar-17 Jun-17 Sep-17 Dec-17
Promoter 46.7 46.7 46.7 46.8 47.0
Others 53.3 53.3 53.3 53.2 53.0
Source: Reuters, ICICIdirect.com Research
Recent Activity
Investor name Value ($) Shares Investor name Value ($) Shares
Norges Bank Investment Management (NBIM) 58.9m 4.2m Capital World Investors -122.5m -7.9m
Gupta (Manju Deshbandhu) 49.1m 3.9m Franklin Advisers, Inc. -57.5m -3.7m
Life Insurance Corporation of India 29.4m 2.1m J.P. Morgan Asset Management (Hong Kong) Ltd. -26.1m -1.7m
Capital International, Inc. 22.5m 1.4m GIC Private Limited -25.9m -1.7m
Nomura Asset Management Co., Ltd. 17.4m 1.1m Capital International Investors -21.8m -1.4m
Buys Sells
Source: Reuters, ICICIdirect.com Research
ICICI Securities Ltd | Retail Equity Research Page 11
.
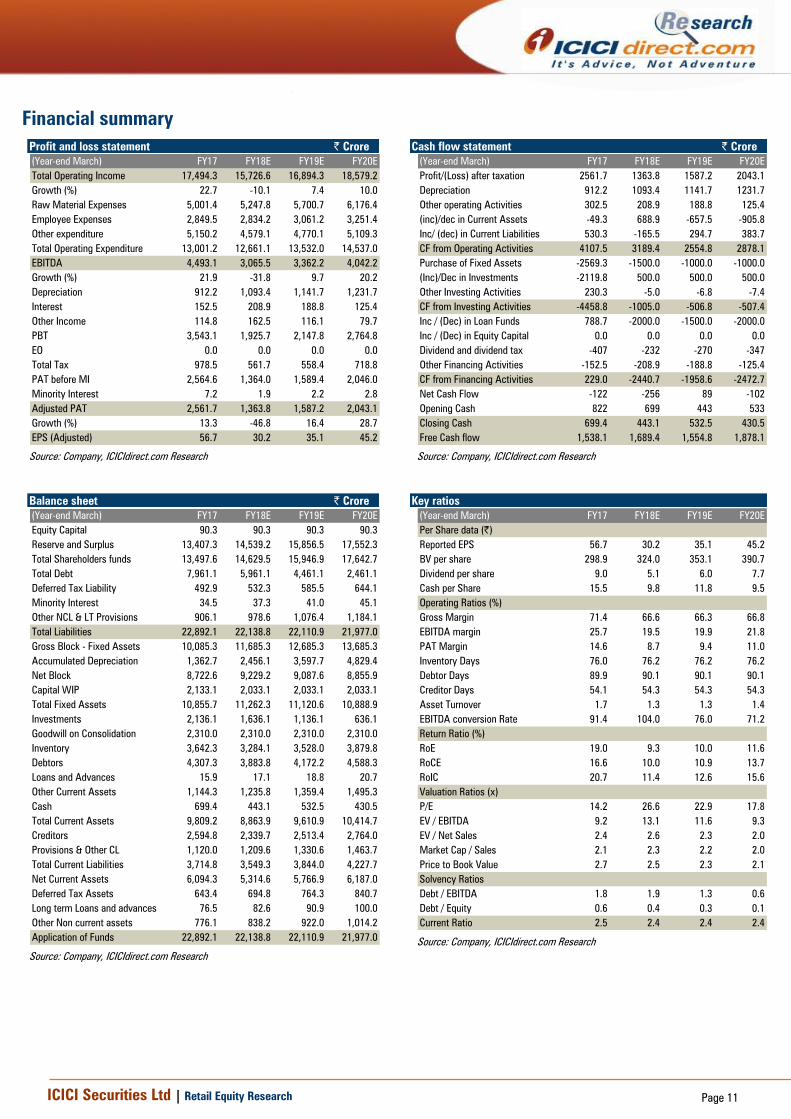
Financial summary
Profit and loss statement | Crore
(Year-end March) FY17 FY18E FY19E FY20E
Total Operating Income 17,494.3 15,726.6 16,894.3 18,579.2
Growth (%) 22.7 -10.1 7.4 10.0
Raw Material Expenses 5,001.4 5,247.8 5,700.7 6,176.4
Employee Expenses 2,849.5 2,834.2 3,061.2 3,251.4
Other expenditure 5,150.2 4,579.1 4,770.1 5,109.3
Total Operating Expenditure 13,001.2 12,661.1 13,532.0 14,537.0
EBITDA 4,493.1 3,065.5 3,362.2 4,042.2
Growth (%) 21.9 -31.8 9.7 20.2
Depreciation 912.2 1,093.4 1,141.7 1,231.7
Interest 152.5 208.9 188.8 125.4
Other Income 114.8 162.5 116.1 79.7
PBT 3,543.1 1,925.7 2,147.8 2,764.8
EO 0.0 0.0 0.0 0.0
Total Tax 978.5 561.7 558.4 718.8
PAT before MI 2,564.6 1,364.0 1,589.4 2,046.0
Minority Interest 7.2 1.9 2.2 2.8
Adjusted PAT 2,561.7 1,363.8 1,587.2 2,043.1
Growth (%) 13.3 -46.8 16.4 28.7
EPS (Adjusted) 56.7 30.2 35.1 45.2
Source: Company, ICICIdirect.com Research
Cash flow statement | Crore
(Year-end March) FY17 FY18E FY19E FY20E
Profit/(Loss) after taxation 2561.7 1363.8 1587.2 2043.1
Depreciation 912.2 1093.4 1141.7 1231.7
Other operating Activities 302.5 208.9 188.8 125.4
(inc)/dec in Current Assets -49.3 688.9 -657.5 -905.8
Inc/ (dec) in Current Liabilities 530.3 -165.5 294.7 383.7
CF from Operating Activities 4107.5 3189.4 2554.8 2878.1
Purchase of Fixed Assets -2569.3 -1500.0 -1000.0 -1000.0
(Inc)/Dec in Investments -2119.8 500.0 500.0 500.0
Other Investing Activities 230.3 -5.0 -6.8 -7.4
CF from Investing Activities -4458.8 -1005.0 -506.8 -507.4
Inc / (Dec) in Loan Funds 788.7 -2000.0 -1500.0 -2000.0
Inc / (Dec) in Equity Capital 0.0 0.0 0.0 0.0
Dividend and dividend tax -407 -232 -270 -347
Other Financing Activities -152.5 -208.9 -188.8 -125.4
CF from Financing Activities 229.0 -2440.7 -1958.6 -2472.7
Net Cash Flow -122 -256 89 -102
Opening Cash 822 699 443 533
Closing Cash 699.4 443.1 532.5 430.5
Free Cash flow 1,538.1 1,689.4 1,554.8 1,878.1
Source: Company, ICICIdirect.com Research
Balance sheet | Crore
(Year-end March) FY17 FY18E FY19E FY20E
Equity Capital 90.3 90.3 90.3 90.3
Reserve and Surplus 13,407.3 14,539.2 15,856.5 17,552.3
Total Shareholders funds 13,497.6 14,629.5 15,946.9 17,642.7
Total Debt 7,961.1 5,961.1 4,461.1 2,461.1
Deferred Tax Liability 492.9 532.3 585.5 644.1
Minority Interest 34.5 37.3 41.0 45.1
Other NCL & LT Provisions 906.1 978.6 1,076.4 1,184.1
Total Liabilities 22,892.1 22,138.8 22,110.9 21,977.0
Gross Block - Fixed Assets 10,085.3 11,685.3 12,685.3 13,685.3
Accumulated Depreciation 1,362.7 2,456.1 3,597.7 4,829.4
Net Block 8,722.6 9,229.2 9,087.6 8,855.9
Capital WIP 2,133.1 2,033.1 2,033.1 2,033.1
Total Fixed Assets 10,855.7 11,262.3 11,120.6 10,888.9
Investments 2,136.1 1,636.1 1,136.1 636.1
Goodwill on Consolidation 2,310.0 2,310.0 2,310.0 2,310.0
Inventory 3,642.3 3,284.1 3,528.0 3,879.8
Debtors 4,307.3 3,883.8 4,172.2 4,588.3
Loans and Advances 15.9 17.1 18.8 20.7
Other Current Assets 1,144.3 1,235.8 1,359.4 1,495.3
Cash 699.4 443.1 532.5 430.5
Total Current Assets 9,809.2 8,863.9 9,610.9 10,414.7
Creditors 2,594.8 2,339.7 2,513.4 2,764.0
Provisions & Other CL 1,120.0 1,209.6 1,330.6 1,463.7
Total Current Liabilities 3,714.8 3,549.3 3,844.0 4,227.7
Net Current Assets 6,094.3 5,314.6 5,766.9 6,187.0
Deferred Tax Assets 643.4 694.8 764.3 840.7
Long term Loans and advances 76.5 82.6 90.9 100.0
Other Non current assets 776.1 838.2 922.0 1,014.2
Application of Funds 22,892.1 22,138.8 22,110.9 21,977.0
Source: Company, ICICIdirect.com Research
Key ratios
(Year-end March) FY17 FY18E FY19E FY20E
Per Share data (|)
Reported EPS 56.7 30.2 35.1 45.2
BV per share 298.9 324.0 353.1 390.7
Dividend per share 9.0 5.1 6.0 7.7
Cash per Share 15.5 9.8 11.8 9.5
Operating Ratios (%)
Gross Margin 71.4 66.6 66.3 66.8
EBITDA margin 25.7 19.5 19.9 21.8
PAT Margin 14.6 8.7 9.4 11.0
Inventory Days 76.0 76.2 76.2 76.2
Debtor Days 89.9 90.1 90.1 90.1
Creditor Days 54.1 54.3 54.3 54.3
Asset Turnover 1.7 1.3 1.3 1.4
EBITDA conversion Rate 91.4 104.0 76.0 71.2
Return Ratio (%)
RoE 19.0 9.3 10.0 11.6
RoCE 16.6 10.0 10.9 13.7
RoIC 20.7 11.4 12.6 15.6
Valuation Ratios (x)
P/E 14.2 26.6 22.9 17.8
EV / EBITDA 9.2 13.1 11.6 9.3
EV / Net Sales 2.4 2.6 2.3 2.0
Market Cap / Sales 2.1 2.3 2.2 2.0
Price to Book Value 2.7 2.5 2.3 2.1
Solvency Ratios
Debt / EBITDA 1.8 1.9 1.3 0.6
Debt / Equity 0.6 0.4 0.3 0.1
Current Ratio 2.5 2.4 2.4 2.4
Source: Company, ICICIdirect.com Research
ICICI Securities Ltd | Retail Equity Research Page 12
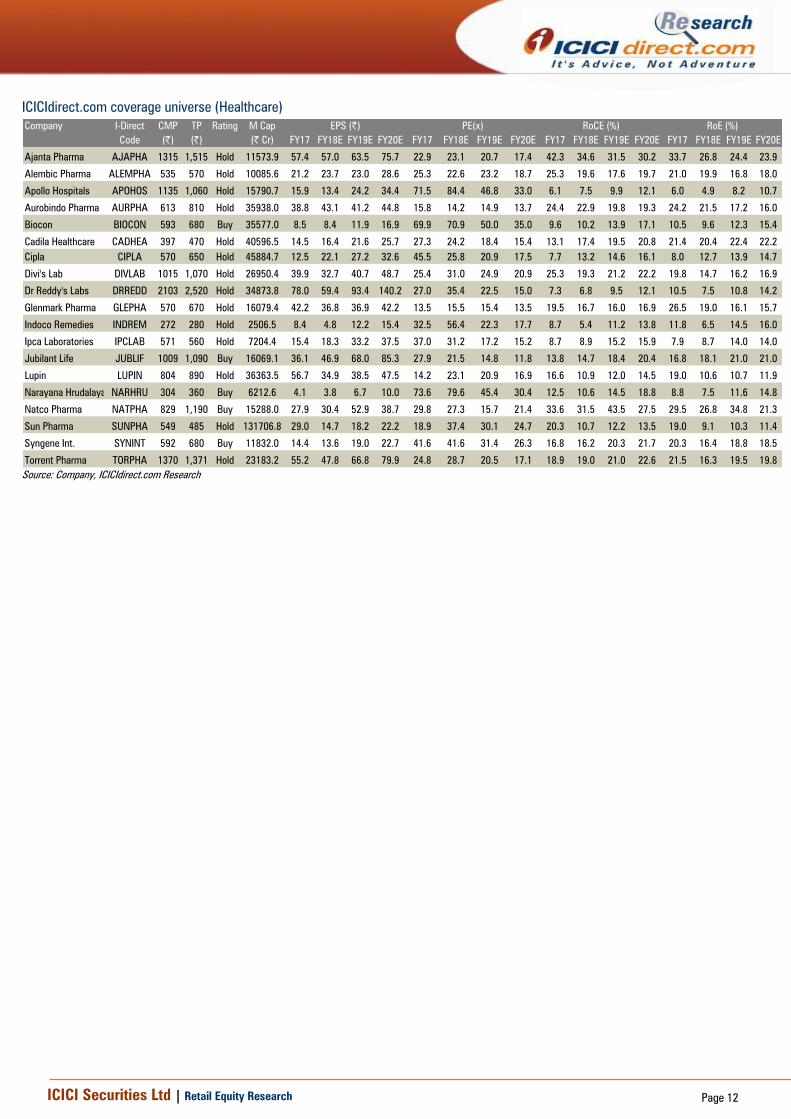
ICICIdirect.com coverage universe (Healthcare)
Company I-Direct CMP TP Rating M Cap
Code (|) (|) (| Cr) FY17 FY18E FY19E FY20E FY17 FY18E FY19E FY20E FY17 FY18E FY19E FY20E FY17 FY18E FY19E FY20E
Ajanta Pharma AJAPHA 1315 1,515 Hold 11573.9 57.4 57.0 63.5 75.7 22.9 23.1 20.7 17.4 42.3 34.6 31.5 30.2 33.7 26.8 24.4 23.9
Alembic Pharma ALEMPHA 535 570 Hold 10085.6 21.2 23.7 23.0 28.6 25.3 22.6 23.2 18.7 25.3 19.6 17.6 19.7 21.0 19.9 16.8 18.0
Apollo Hospitals APOHOS 1135 1,060 Hold 15790.7 15.9 13.4 24.2 34.4 71.5 84.4 46.8 33.0 6.1 7.5 9.9 12.1 6.0 4.9 8.2 10.7
Aurobindo Pharma AURPHA 613 810 Hold 35938.0 38.8 43.1 41.2 44.8 15.8 14.2 14.9 13.7 24.4 22.9 19.8 19.3 24.2 21.5 17.2 16.0
Biocon BIOCON 593 680 Buy 35577.0 8.5 8.4 11.9 16.9 69.9 70.9 50.0 35.0 9.6 10.2 13.9 17.1 10.5 9.6 12.3 15.4
Cadila Healthcare CADHEA 397 470 Hold 40596.5 14.5 16.4 21.6 25.7 27.3 24.2 18.4 15.4 13.1 17.4 19.5 20.8 21.4 20.4 22.4 22.2
Cipla CIPLA 570 650 Hold 45884.7 12.5 22.1 27.2 32.6 45.5 25.8 20.9 17.5 7.7 13.2 14.6 16.1 8.0 12.7 13.9 14.7
Divi's Lab DIVLAB 1015 1,070 Hold 26950.4 39.9 32.7 40.7 48.7 25.4 31.0 24.9 20.9 25.3 19.3 21.2 22.2 19.8 14.7 16.2 16.9
Dr Reddy's Labs DRREDD 2103 2,520 Hold 34873.8 78.0 59.4 93.4 140.2 27.0 35.4 22.5 15.0 7.3 6.8 9.5 12.1 10.5 7.5 10.8 14.2
Glenmark Pharma GLEPHA 570 670 Hold 16079.4 42.2 36.8 36.9 42.2 13.5 15.5 15.4 13.5 19.5 16.7 16.0 16.9 26.5 19.0 16.1 15.7
Indoco Remedies INDREM 272 280 Hold 2506.5 8.4 4.8 12.2 15.4 32.5 56.4 22.3 17.7 8.7 5.4 11.2 13.8 11.8 6.5 14.5 16.0
Ipca Laboratories IPCLAB 571 560 Hold 7204.4 15.4 18.3 33.2 37.5 37.0 31.2 17.2 15.2 8.7 8.9 15.2 15.9 7.9 8.7 14.0 14.0
Jubilant Life JUBLIF 1009 1,090 Buy 16069.1 36.1 46.9 68.0 85.3 27.9 21.5 14.8 11.8 13.8 14.7 18.4 20.4 16.8 18.1 21.0 21.0
Lupin LUPIN 804 890 Hold 36363.5 56.7 34.9 38.5 47.5 14.2 23.1 20.9 16.9 16.6 10.9 12.0 14.5 19.0 10.6 10.7 11.9
Narayana Hrudalaya NARHRU 304 360 Buy 6212.6 4.1 3.8 6.7 10.0 73.6 79.6 45.4 30.4 12.5 10.6 14.5 18.8 8.8 7.5 11.6 14.8
Natco Pharma NATPHA 829 1,190 Buy 15288.0 27.9 30.4 52.9 38.7 29.8 27.3 15.7 21.4 33.6 31.5 43.5 27.5 29.5 26.8 34.8 21.3
Sun Pharma SUNPHA 549 485 Hold 131706.8 29.0 14.7 18.2 22.2 18.9 37.4 30.1 24.7 20.3 10.7 12.2 13.5 19.0 9.1 10.3 11.4
Syngene Int. SYNINT 592 680 Buy 11832.0 14.4 13.6 19.0 22.7 41.6 41.6 31.4 26.3 16.8 16.2 20.3 21.7 20.3 16.4 18.8 18.5
Torrent Pharma TORPHA 1370 1,371 Hold 23183.2 55.2 47.8 66.8 79.9 24.8 28.7 20.5 17.1 18.9 19.0 21.0 22.6 21.5 16.3 19.5 19.8
RoE (%)EPS (|) PE(x) RoCE (%)
Source: Company, ICICIdirect.com Research
ICICI Securities Ltd | Retail Equity Research Page 13
RATING RATIONALE
ICICIdirect.com endeavours to provide objective opinions and recommendations. ICICIdirect.com
assigns ratings to its stocks according to their notional target price vs. current market price and then
categorises them as Strong Buy, Buy, Hold and Sell. The performance horizon is two years unless
specified and the notional target price is defined as the analysts' valuation for a stock.
Strong Buy: >15%/20% for large caps/midcaps, respectively, with high conviction;
Buy: >10%/15% for large caps/midcaps, respectively;
Hold: Up to +/-10%;
Sell: -10% or more;
Pankaj Pandey Head – Research [email protected]
m
ICICIdirect.com Research
Desk,
ICICI Securities Limited,
1st Floor, Akruti Trade Centre,
Road No 7, MIDC,
Andheri (East)
Mumbai – 400 093
RATING RATIONALE
ICICIdirect.com endeavours to provide objective opinions and recommendations. ICICIdirect.com assigns
ratings to its stocks according to their notional target price vs. current market price and then categorises them
as Strong Buy, Buy, Hold and Sell. The performance horizon is two years unless specified and the notional
target price is defined as the analysts' valuation for a stock.
Strong Buy: >15%/20% for large caps/midcaps, respectively, with high conviction;
Buy: >10%/15% for large caps/midcaps, respectively;
Hold: Up to +/-10%;
Sell: -10% or more;
Pankaj Pandey Head – Research [email protected]
ICICIdirect.com Research Desk,
ICICI Securities Limited,
1st Floor, Akruti Trade Centre,
Road No 7, MIDC,
Andheri (East)
Mumbai – 400 093
ICICI Securities Ltd | Retail Equity Research Page 14
ANALYST CERTIFICATION
We /I, Siddhant Khandekar CA-INTER, Mitesh Shah MS (Finance) Harshal Mehta MTech (Biotechnology) Research Analysts, authors and the names subscribed to this report, hereby certify that all of the views
expressed in this research report accurately reflect our views about the subject issuer(s) or securities. We also certify that no part of our compensation was, is, or will be directly or indirectly related to the
specific recommendation(s) or view(s) in this report.
Terms & conditions and other disclosures:
ICICI Securities Limited (ICICI Securities) is a full-service, integrated investment banking and is, inter alia, engaged in the business of stock brokering and distribution of financial products. ICICI Securities
Limited is a Sebi registered Research Analyst with Sebi Registration Number – INH000000990. ICICI Securities is a wholly-owned subsidiary of ICICI Bank which is India’s largest private sector bank and has its
various subsidiaries engaged in businesses of housing finance, asset management, life insurance, general insurance, venture capital fund management, etc. (“associates”), the details in respect of which are
available on www.icicibank.com.
ICICI Securities is one of the leading merchant bankers/ underwriters of securities and participate in virtually all securities trading markets in India. We and our associates might have investment banking and
other business relationship with a significant percentage of companies covered by our Investment Research Department. ICICI Securities generally prohibits its analysts, persons reporting to analysts and their
relatives from maintaining a financial interest in the securities or derivatives of any companies that the analysts cover.
The information and opinions in this report have been prepared by ICICI Securities and are subject to change without any notice. The report and information contained herein is strictly confidential and meant
solely for the selected recipient and may not be altered in any way, transmitted to, copied or distributed, in part or in whole, to any other person or to the media or reproduced in any form, without prior
written consent of ICICI Securities. While we would endeavour to update the information herein on a reasonable basis, ICICI Securities is under no obligation to update or keep the information current. Also,
there may be regulatory, compliance or other reasons that may prevent ICICI Securities from doing so. Non-rated securities indicate that rating on a particular security has been suspended temporarily and
such suspension is in compliance with applicable regulations and/or ICICI Securities policies, in circumstances where ICICI Securities might be acting in an advisory capacity to this company, or in certain other
circumstances.
This report is based on information obtained from public sources and sources believed to be reliable, but no independent verification has been made nor is its accuracy or completeness guaranteed. This
report and information herein is solely for informational purpose and shall not be used or considered as an offer document or solicitation of offer to buy or sell or subscribe for securities or other financial
instruments. Though disseminated to all the customers simultaneously, not all customers may receive this report at the same time. ICICI Securities will not treat recipients as customers by virtue of their
receiving this report. Nothing in this report constitutes investment, legal, accounting and tax advice or a representation that any investment or strategy is suitable or appropriate to your specific circumstances.
The securities discussed and opinions expressed in this report may not be suitable for all investors, who must make their own investment decisions, based on their own investment objectives, financial
positions and needs of specific recipient. This may not be taken in substitution for the exercise of independent judgment by any recipient. The recipient should independently evaluate the investment risks. The
value and return on investment may vary because of changes in interest rates, foreign exchange rates or any other reason. ICICI Securities accepts no liabilities whatsoever for any loss or damage of any kind
arising out of the use of this report. Past performance is not necessarily a guide to future performance. Investors are advised to see Risk Disclosure Document to understand the risks associated before
investing in the securities markets. Actual results may differ materially from those set forth in projections. Forward-looking statements are not predictions and may be subject to change without notice.
ICICI Securities or its associates might have managed or co-managed public offering of securities for the subject company or might have been mandated by the subject company for any other assignment in
the past twelve months.
ICICI Securities or its associates might have received any compensation from the companies mentioned in the report during the period preceding twelve months from the date of this report for services in
respect of managing or co-managing public offerings, corporate finance, investment banking or merchant banking, brokerage services or other advisory service in a merger or specific transaction.
ICICI Securities or its associates might have received any compensation for products or services other than investment banking or merchant banking or brokerage services from the companies mentioned in
the report in the past twelve months.
ICICI Securities encourages independence in research report preparation and strives to minimize conflict in preparation of research report. ICICI Securities or its associates or its analysts did not receive any
compensation or other benefits from the companies mentioned in the report or third party in connection with preparation of the research report. Accordingly, neither ICICI Securities nor Research Analysts
and their relatives have any material conflict of interest at the time of publication of this report.
It is confirmed that Siddhant Khandekar CA-INTER, Mitesh Shah MS (Finance) Harshal Mehta MTech (Biotechnology) Research Analysts of this report have not received any compensation from the companies
mentioned in the report in the preceding twelve months.
Compensation of our Research Analysts is not based on any specific merchant banking, investment banking or brokerage service transactions.
ICICI Securities or its subsidiaries collectively or Research Analysts or their relatives do not own 1% or more of the equity securities of the Company mentioned in the report as of the last day of the month
preceding the publication of the research report.
Since associates of ICICI Securities are engaged in various financial service businesses, they might have financial interests or beneficial ownership in various companies including the subject
company/companies mentioned in this report.
It is confirmed that Siddhant Khandekar CA-INTER, Mitesh Shah MS (Finance) Harshal Mehta MTech (Biotechnology) Research Analysts do not serve as an officer, director or employee of the companies
mentioned in the report.
ICICI Securities may have issued other reports that are inconsistent with and reach different conclusion from the information presented in this report.
Neither the Research Analysts nor ICICI Securities have been engaged in market making activity for the companies mentioned in the report.
We submit that no material disciplinary action has been taken on ICICI Securities by any Regulatory Authority impacting Equity Research Analysis activities.
This report is not directed or intended for distribution to, or use by, any person or entity who is a citizen or resident of or located in any locality, state, country or other jurisdiction, where such distribution,
publication, availability or use would be contrary to law, regulation or which would subject ICICI Securities and affiliates to any registration or licensing requirement within such jurisdiction. The securities
described herein may or may not be eligible for sale in all jurisdictions or to certain category of investors. Persons in whose possession this document may come are required to inform themselves of and to
observe such restriction.
report and information herein is solely for informational purpose and shall not be used or considered as an offer document or solicitation of offer to buy or sell or subscribe for securities or other financial
instruments. Though disseminated to all the customers simultaneously, not all customers may receive this report at the same time. ICICI Securities will not treat recipients as customers by virtue of their
receiving this report. Nothing in this report constitutes investment, legal, accounting and tax advice or a representation that any investment or strategy is suitable or appropriate to your specific circumstances.
The securities discussed and opinions expressed in this report may not be suitable for all investors, who must make their own investment decisions, based on their own investment objectives, financial
positions and needs of specific recipient. This may not be taken in substitution for the exercise of independent judgment by any recipient. The recipient should independently evaluate the investment risks. The
value and return on investment may vary because of changes in interest rates, foreign exchange rates or any other reason. ICICI Securities accepts no liabilities whatsoever for any loss or damage of any kind
arising out of the use of this report. Past performance is not necessarily a guide to future performance. Investors are advised to see Risk Disclosure Document to understand the risks associated before
investing in the securities markets. Actual results may differ materially from those set forth in projections. Forward-looking statements are not predictions and may be subject to
change without notice.
ICICI Securities or its associates might have managed or co-managed public offering of securities for the subject company or might have been mandated by the subject company for any other assignment in
the past twelve months.
ICICI Securities or its associates might have received any compensation from the companies mentioned in the report during the period preceding twelve months from the date of this report for services in
respect of managing or co-managing public offerings, corporate finance, investment banking or merchant banking, brokerage services or other advisory service in a merger or specific transaction.
ICICI Securities or its associates might have received any compensation for products or services other than investment banking or merchant banking or brokerage services from the companies mentioned in
the report in the past twelve months.
ICICI Securities encourages independence in research report preparation and strives to minimize conflict in preparation of research report. ICICI Securities or its analysts did not receive any compensation or
other benefits from the companies mentioned in the report or third party in connection with preparation of the research report. Accordingly, neither ICICI Securities nor Research Analysts have any material
conflict of interest at the time of publication of this report.
It is confirmed that Siddhant Khandekar CA-INTER Mitesh Shah MS (Finance), Harshal Mehta MTech (Biotechnology) Research Analysts of this report have not received any compensation from the companies
mentioned in the report in the preceding twelve months.
Compensation of our Research Analysts is not based on any specific merchant banking, investment banking or brokerage service transactions.