result update muthoot finance -...
TRANSCRIPT

Edelweiss Research is also available on www.edelresearch.com, Bloomberg EDEL <GO>, Thomson First Call, Reuters and Factset.
Edelweiss Securities Limited
Muthoot Finance’s (Muthoot) Q1FY18 PAT jumped ~30% YoY to INR3.5bn, supported by: (i) funding cost benefit (down >150bps YoY and >50bps QoQ to 9.9%); and (ii) controlled opex—up mere ~2% YoY. However, growth continued to be modest—gold AUM up ~8% YoY and 2% QoQ to INR278bn—impacted by lower demand and sustained auctions (INR3.6bn). We believe better asset growth momentum is a critical driver of earnings growth. Non-gold businesses that currently contribute ~5% to earnings will be scaled-up to 9-10% by FY18. Given revenue tailwinds and controlled opex, we estimate Muthoot to post >18% earnings CAGR over FY17-19. Maintain ‘BUY’.
Strong operational performance
Muthoot reported healthy operational performance during Q1FY18—operating profit
jumped >25% YoY driven by: (i) margin expansion—NIMs (rep.) rose to 12.3% (11.4% in
Q1FY17; but down QoQ due to one-off interest income gains during Q4FY17) riding
sustained yields and funding cost benefits; and (ii) controlled opex growth at ~2% YoY.
During Q1FY18, the company pruned branch count by 22 to 4,285, as it consolidated its
liability-focused branches in Kerala; however, going ahead, it plans to add 200 new
branches on an average every year. Going forward, we expect Muthoot to continue to
deliver strong operational performance, backed by NIMs tailwind (funding cost
benefits from retirement of high-cost long-term borrowings) and controlled opex.
Modest AUM growth
Given structurally lower demand for short-term financing, Muthoot’s growth trajectory
continued to be modest—at INR278bn, gold AUM rose ~8% YoY and 2% QoQ—partly
also impacted by continued auctions (INR3.6bn). On the other hand, volumes grew
~4% YoY and 2% QoQ (gold holding increased to 152 tonnes), translating into flattish
AUM/gram QoQ. Management is targeting ~10-15% AUM growth for FY18.
Outlook and valuations: Growth to drive rerating; maintain ‘BUY’
Notwithstanding weak traction, we expect AUM growth to pick up pace—>15% CAGR
over FY17-19E—on stabilising gold prices, gap in AUM/gram (INR1,827 versus
incremental lending at INR1,950) and branch expansion. This, coupled with controlled
costs, is estimated to drive >18% earnings CAGR. The stock is trading at 2.2x FY19E
P/ABV for RoA/RoE of 5%/20%. We maintain ‘BUY/SO’ with TP of INR570 (2.75x FY19E
P/ABV).
RESULT UPDATE
MUTHOOT FINANCE NIMs support earnings; asset growth modest
COMPANYNAME
COMPANYNAME
COMPANYNAME
EDELWEISS 4D RATINGS
Absolute Rating BUY
Rating Relative to Sector Outperform
Risk Rating Relative to Sector Medium
Sector Relative to Market Overweight
MARKET DATA (R: MUTT.BO, B: MUTH IN)
CMP : INR 457
Target Price : INR 570
52-week range (INR) : 489 / 261
Share in issue (mn) : 399.5
M cap (INR bn/USD mn) : 183 / 2,862
Avg. Daily Vol.BSE/NSE(‘000) : 744.4
SHARE HOLDING PATTERN (%)
Current Q4FY17 Q3FY17
Promoters *
73.7 73.7 74.6
MF's, FI's & BK’s 11.2 8.1 7.5
FII's 11.3 13.6 13.8
Others 3.8 4.6 4.1
* Promoters pledged shares (% of share in issue)
: NIL
PRICE PERFORMANCE (%)
Stock Nifty EW Banks and
Financial Services Index
1 month 1.9 2.5 3.9
3 months 15.4 6.3 6.6
12 months 20.4 14.2 27.2
Kunal Shah +91 22 4040 7579
Nilesh Parikh +91 22 4063 5470
Prakhar Agarwal +91 22 6620 3076
Malav Simaria +91 22 6623 3357
India Equity Research| Banking and Financial Services
August 9, 2017
Financials (INR mn)
Year to March Q1FY18 Q1FY17 Growth (%) Q4FY17 Growth (%) FY17 FY18E FY19E
Net revenue 8,660 7,437 16.4 11,672 (25.8) 34,529 36,737 41,754
Net profit 3,511 2,703 29.9 3,218 9.1 11,798 14,436 16,471
Dil. EPS (INR) 8.8 6.7 30.6 8.0 9.1 29.5 36.1 41.2
Adj. BV (INR) 155.2 179.6 206.8
Price/ Adj book (x) 2.9 2.5 2.2
Price/ Earnings (x) 15.5 12.7 11.1

Banking and Financial Services
2 Edelweiss Securities Limited
Performance of subsidiaries
Muthoot’s focus on scaling up its non-gold businesses continued to be on track, with
subsidiaries now contributing ~INR120mn to quarterly profits. Going forward,
management aims to take the proportion of non-gold businesses to ~9-10% by FY18
(versus ~5% currently).
Muthoot Homefin sustained growth momentum during the quarter—at INR1.6bn,
disbursements jumped ~11x YoY, leading to loan book growth of ~14x YoY to INR5.9bn.
Revenue came in at INR192mn (INR14mn last year), flowing into PAT of INR37mn (loss
of INR4mn last year). The business is currently operational in 5 states (Maharashtra,
Gujarat, Rajasthan, Madhya Pradesh and Kerala) and 29 locations, with management
aiming to expand reach to Karnataka, Telangana, Andhra Pradesh and Haryana. Focus
within this vertical continues to be on extending affordable housing finance, with thrust
on EWS and LIG customers (average ticket size of INR1mn in FY17). Moreover, the
board has decided to acquire balance 11.73% stake in Muthoot Homefin (at an
aggregate price of INR387.2mn), post which it will become a wholly-owned subsidiary.
Belstar Investment and Finance’s loan portfolio stood at INR6.3bn (up ~2x YoY), with
172 branches spread across 6 states (Tamil Nadu, Karnataka, Madhya Pradesh,
Maharashtra, Kerala and Odisha) and 1 Union Territory (Pondicherry). Revenue for the
quarter stood at INR419mn (INR178mn last year), translating into PAT of INR52mn
(INR22mn last year).
Muthoot Insurance Brokers generated first-year premium collection of INR157mn
during Q1FY18 (INR102mn last year), with active distribution of life as well as non-life
insurance products. Number of policies insured came in at 2,16,301 (1,36,212 last year).
Asia Asset Finance’s loan portfolio came in at LKR9.1bn (up ~22% YoY), with 17
branches across Sri Lanka. Revenue came in at LKR593mn during Q1FY18 (LKR454mn
last year) with PAT of LKR57mn (LKR56mn last year).
Table 1: Key takeaways from Q1FY18 earnings
(INR mn) Q1FY18 Q1FY17 YoY (%) Q4FY17 QoQ (%) Comments
Interest income 13,923 12,964 7.4 17,096 (18.6)
Interest expense 5,326 5,571 (4.4) 5,460 (2.5) Lower interest expense, on CoF benefits -
down >150bps YoY/50bps QoQ to 9.9%
Net interest income 8,597 7,393 16.3 11,636 (26.1) Healthy NII traction, driven by expansion
in margins
Non-interest income 63 44 42.8 36 76.1
Net revenues 8,660 7,437 16.4 11,672 (25.8)
Operating expenses 3,075 3,025 1.7 3,349 (8.2) Controlled opex, following continued
focus on operating efficiency
-Staff expense 1,773 1,849 (4.1) 1,802 (1.6) Employee count reduced by >800
sequentially to 23,391
-Depreciation 104 117 (10.8) 133 (21.7)
-Other opex 1,198 1,059 13.1 1,414 (15.3)
Operating profit 5,585 4,413 26.6 8,323 (32.9)
Provisions 66 176 (62.2) 2,430 (97.3)
Profit before tax 5,518 4,237 30.2 5,893 (6.4)
Tax expense 2,007 1,534 30.8 2,675 (25.0)
Profit after tax 3,511 2,703 29.9 3,218 9.1 Strong PAT growth, backed by healthy
revenue traction and restricted opex
EPS (INR) 8.8 6.7 30.6 8.0 9.1

Muthoot Finance
3 Edelweiss Securities Limited
Table 1: Key takeaways from Q1FY18 earnings (Contd.)
Source: Company, Edelweiss research
(INR mn) Q1FY18 Q1FY17 YoY (%) Q4FY17 QoQ (%) Comments
Key Metrics
Gross retail loan AUM 2,78,517 2,58,606 7.7 2,72,785 2.1 Modest AUM growth - Management cited
growth guidance of ~10-15%
Gold loans 2,77,750 2,58,226 7.6 2,72,199 2.0
Other loans 767 380 101.8 586 30.9
Gold holding (tonnes) 152 146 4.1 149 2.0 Volume growth flows into flattish AUM /
gram sequentially
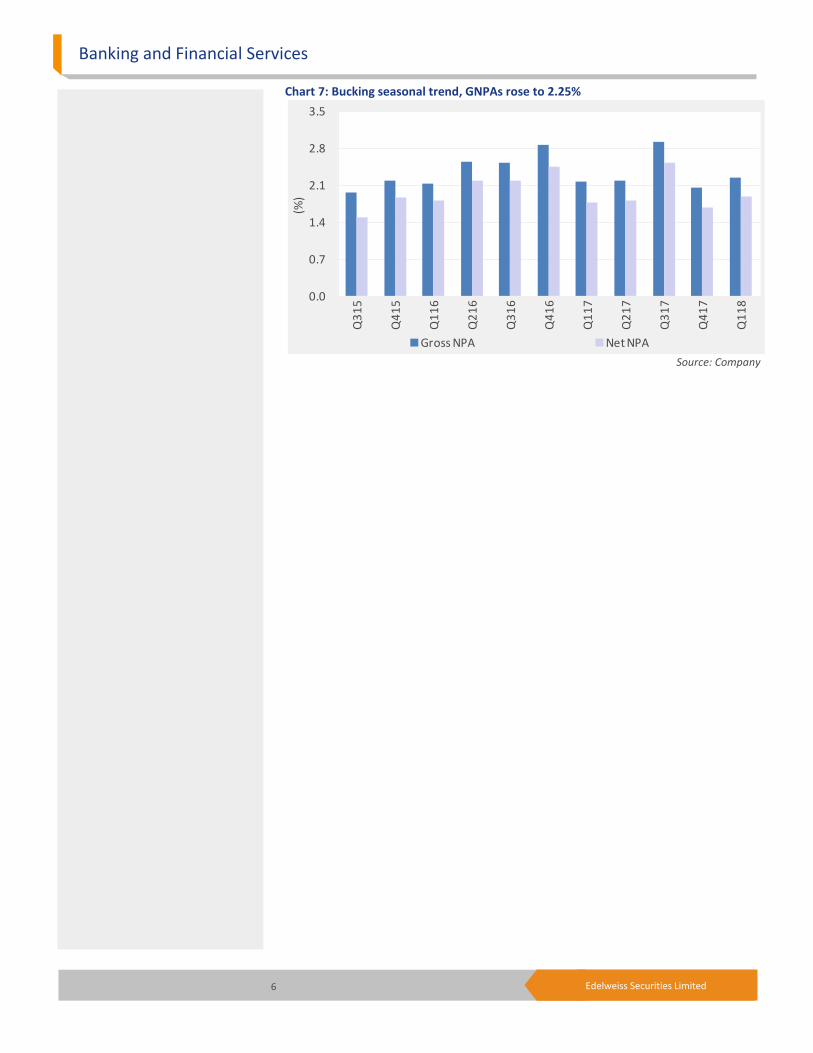
GNPA 6,279 5,618 11.8 5,621 11.7
NNPA 5,260 4,599 14.4 4,602 14.3
GNPA (%) 2.3 2.2 2.1 Bucking seasonal trend, GNPAs rise on a
sequential basis
NNPA (%) 1.9 1.8 1.7
NIM (reported, %) 12.3 11.4 17.0 NIMs expand, on back of sustained yields
and funding cost benefits
Subsidiaries
Asia Asset Finance
Loan portfolio (LKR) 9,082 7,421 22.4 8,662 4.8 Strong loan book growth, on expanding
reach - branch count increased to 17
PAT (LKR) 57 56 1.8 86 (33.7) PAT supported by higher revenues -
LKR593mn (vs. LKR454mn in Q1FY17)
Muthoot Homefin
Loan portfolio 5,957 441 NM 4,408 35.1 Robust loan book growth, riding strong
disbursements - up ~11x YoY to INR1.6bn
PAT 37 (4) NA 21 76.2 Strong PAT traction, on better revenues -
INR192mn (vs. INR14mn in Q1FY17)
Muthoot Insurance Brokers
Premium collection 157 102 53.9 259 (39.4) Healthy premium collections, given
greater number of policies insured -
2,16,301 (vs. 1,36,212 in Q1FY17)
PAT 12 6 100.0 22 (45.5) PAT supported by higher revenues -
INR25mn (vs. INR15mn in Q1FY17)
Belstar Investment & Finance
Loan portfolio 6,285 2,872 118.8 5,668 10.9 Strong loan growth, backed by rising
presence - branch count increased to 172
PAT 52 22 136.4 37 40.5 Healthy PAT traction, on better revenues -
INR419mn (vs. INR178mn in Q1FY17)

Banking and Financial Services
4 Edelweiss Securities Limited
Chart 1: AUM growth to pick up pace going forward
Chart 2: Growth momentum remains modest—AUM up ~8% YoY
Chart 3: Branch count pruned following consolidation of liability-focused branches
Source: Company
1,500
1,600
1,700
1,800
1,900
2,000
0
80
160
240
320
400
FY12 FY13 FY14 FY15 FY16 FY17 FY18E FY19E
Gold loan AUMs (INR bn, LHS) Gold loan AUMs (tonnes, LHS)
Gold loan AUMs / gms (RHS)
0
60
120
180
240
300
Q3
15
Q4
15
Q1
16
Q2
16
Q3
16
Q4
16
Q1
17
Q2
17
Q3
17
Q4
17
Q1
18
(AU
M i
n IN
R b
n)
3,500
3,700
3,900
4,100
4,300
4,500
Q3
15
Q4
15
Q1
16
Q2
16
Q3
16
Q4
16
Q1
17
Q2
17
Q3
17
Q4
17
Q1
18
(No
. of b
ran
che
s)

Muthoot Finance
5 Edelweiss Securities Limited
Chart 4: Continued focus on operating efficiency—employee count down by >800
Chart 5: NIMs benefit from funding cost advantage
Chart 6: Incremental borrowing through public-issue debentures
Source: Company
20
21
22
23
24
25
Q3
15
Q4
15
Q1
16
Q2
16
Q3
16
Q4
16
Q1
17
Q2
17
Q3
17
Q4
17
Q1
18
No
. of e
mp
loye
es
(in
'00
0)
8.0
10.0
12.0
14.0
16.0
18.0
0.0
6.0
12.0
18.0
24.0
30.0
Q3
15
Q4
15
Q1
16
Q2
16
Q3
16
Q4
16
Q1
17
Q2
17
Q3
17
Q4
17
Q1
18
(%)
(%)
Yields (calc.) Cost of funds (calc.) NIMs (calc.)
0.0
20.0
40.0
60.0
80.0
100.0
Q4
14
Q1
15
Q2
15
Q3
15
Q4
15
Q1
16
Q2
16
Q3
16
Q4
16
Q1
17
Q2
17
Q3
17
Q4
17
Q1
18
(%)
Secured NCDs Bank borrowings CP Others
Banking and Financial Services
6 Edelweiss Securities Limited
Chart 7: Bucking seasonal trend, GNPAs rose to 2.25%
Source: Company
0.0
0.7
1.4
2.1
2.8
3.5
Q3
15
Q4
15
Q1
16
Q2
16
Q3
16
Q4
16
Q1
17
Q2
17
Q3
17
Q4
17
Q1
18
(%)
Gross NPA Net NPA

Muthoot Finance
7 Edelweiss Securities Limited
Financial snapshot (INR mn) Year to March Q1FY18 Q1FY17 % change Q4FY17 % change FY17 FY18E FY19E
Operating income 13,923 12,964 7.4 17,096 (18.6) 57,272 60,540 68,024 Interest expended 5,326 5,571 (4.4) 5,460 (2.5) 22,938 24,002 26,500
Other income 63 44 42.8 36 76.1 195 200 230
Net revenues 8,660 7,437 16.4 11,672 (25.8) 34,529 36,737 41,754
Operating expenses 2,971 2,908 2.2 3,216 (7.6) 12,020 13,341 14,799
Pre-provision profit 5,689 4,530 25.6 8,456 (32.7) 22,508 23,396 26,955
Provisions & write-offs 66 176 (62.2) 2,430 (97.3) 2,816 838 1,400
Operating profit 5,622 4,354 29.1 6,026 (6.7) 19,692 22,558 25,555
Depreciation 104 117 (11.1) 133 (21.8) 483 518 408
Profit before tax 5,518 4,237 30.2 5,893 (6.4) 19,210 22,039 25,147
Tax 2,007 1,534 30.8 2,675 (25.0) 7,411 7,604 8,676
PAT 3,511 2,703 29.9 3,218 9.1 11,798 14,436 16,471
Diluted EPS (INR) 8.8 6.7 30.6 8.0 9.1 29.5 36.1 41.2
Other information
Branches (No.) 4,285 4,294 4,307 4,307 4,302 4,352
Employees (No.) 23,391 23,165 24,205 24,205 24,177 24,458
Gold AUM 277,750 258,226 272,199 272,199 309,421 363,501
Ratios
Gross NPA - Gold loan (%) 6,279 5,618 5,621 5,621 7,117 10,178
Net NPA - Gold loan (%) 5,260 4,599 4,602 4,602 5,693 8,041
Tax rate (%) 36.4 36.2 45.4 38.6 34.5 34.5
Valuation metrics
B/V per share (INR) 163.3 189.5 220.9
Adj book value / share 155.2 179.6 206.8
Price/ Book (x) 2.8 2.4 2.1
Price/ Adj. book (x) 2.9 2.5 2.2
Price/ Earnings 15.5 12.7 11.1
Change in Estimates
FY18E FY19E
New Old % change New Old % change Comments
NII 36,537 36,057 1.3 41,524 40,612 2.2 Benefit of NIMs expansion
PPOP 22,878 22,202 3.0 26,547 25,297 4.9 Benefit of controlled opex
Provisions 838 1,067 (21.4) 1,400 1,403 (0.2) Lower-than-anticipated credit costs
PAT 14,436 13,843 4.3 16,471 15,651 5.2
NIMs 12.7 12.3 12.6 12.1 Building in funding cost benefits and
stable yields

Banking and Financial Services
8 Edelweiss Securities Limited
Q1FY18 Earnings Concall Key Takeaways
Management commentary
Management guided for >10% gold AUM growth going forward
o Including subsidiaries, the growth at group level should be close to 15% levels
o Growth will be driven through expansion as well as increase in per branch business
Management aims to take the proportion of non-gold business to 9-10% by FY18 (vs.
5% currently)
o Post that, it would target to increase the proportion by another 5% in FY19
With respect to margins
Management is confident of maintaining yields at ~20% levels
Management expects borrowing costs to come down to sub-9% levels in the next 6
months
o This is on back of redemption of high-cost debentures in the months to come
o Cost of borrowings during the quarter stood at 9.3% (vs. 10.8% last year)
Other highlights
In terms of expansion, plan is to increase the number of branches by 200 every year
o Over the past year, the company has merged several low-performing branches
Majority of disbursements are in the form of cash - ~80-90% in terms of no. of
transactions
o Avg. ticket size stood in the range of INR30,000-35,000
The company will move towards 90dpd NPA recognition norms during the last quarter
of the year
o On 90dpd basis, GNPAs would have been higher by ~INR1.5bn (vs. reported of
INR6.3bn)
Muthoot is now focusing more on interest collection periodically
o Online interest collections stood at 6% (vs. high of 15% post demonetisation)
Reduction in employee count was due to focus on efficiency and more off-roll
employees
Avg tenure of gold loans stood at 3-4 months, with avg LTV (blended) of 67%
Of the total gold portfolio, <1-year products would constitute ~30%
Subsidiaries
Management expects Muthoot Homefin’s book to grow to INR13.5bn by FY18 (vs.
INR5.9bn currently)
o Business can secure RoA of 2.5-3% by end of year, with target NIMs at ~3% levels
o Will expand its reach to the states of Karnataka, Telangana, Andhra Pradesh and
Haryana

Muthoot Finance
9 Edelweiss Securities Limited
Will increase the total branch count to 40 (vs. 29 currently)
o Board has decided to acquire the remaining 11.73% stake for a price of
INR387.2mn
Post this transaction, Muthoot Homefin will become a wholly-owned
subsidiary
Additionally, the Board has decided to infuse INR1bn as equity share capital
o Avg. ticket size in the business stood at INR1.2mn
o <5% of cases are balance transfers from other companies
Belstar’s MFI portfolio is not seeing any asset quality issue, as ~90% of disbursements
are towards SHGs
o Average ticket size in the MFI business stood at INR17,500
Asia Asset Finance, the Sri Lankan subsidiary, has paid dividend for the first time
o Gold loans are seeing good traction in Sri Lanka

Banking and Financial Services
10 Edelweiss Securities Limited
Company Description
Muthoot is the largest gold financing NBFC with operating history of more than 70 years
when Mr. M. George Muthoot (father of promoters) founded a gold loan business in 1939.
Currently, it is a closely held family-owned business with promoters (sons of Mr. M. George
Muthoot and their family) continuing to hold substantial stake of ~74%. Headquartered in
Kerala, the gold loan NBFC has a network of 4,285 branches, ~62% of which are located in
South India as of June 2017. Muthoot has created leadership in lending against gold
jewellery, with AUM of ~INR278bn and more than 7mn customers.
In addition to gold loan business, it also provides money transfer services through branches
as sub-agents of various registered money transfer agencies, providing collection agency
services and has recently ventured into the micro-finance business. Its other initiatives
include sale of gold coins, insurance products and housing finance amongst various other
services.
The Muthoot Group has interests in a diverse range of business in areas of hospitality,
media, education, healthcare, information technology etc. However, gold loans continue to
be the mainstay and hence Muthoot Finance continues to be the flagship company.
Investment Theme
Muthoot had been reeling under various regulatory pressures earlier. However, with most
negatives now done away with—leading to strengthened practices, the RBI is
acknowledging the systemic importance of gold loan companies and macros are
improving—we expect this space to gather momentum going ahead. We expect the
company to be key beneficiary and bolster its market share as it is a lead player in the sector
(underpinned by sound brand, extensive franchise and superior operations) and level
playing field is emerging for all players (LTV at par for all). Given revenue tailwinds and
controlled opex, we estimate Muthoot to post >18% earnings CAGR over FY17-19.
Key Risks
• Gold loan dynamics of regions beyond South India are different.
• Pressure on growth in case of slower ramp up of new branches or decline in gold price.

11 Edelweiss Securities Limited
Muthoot Finance
Financial Statements
Income statement (INR mn)
Year to March FY16 FY17 FY18E FY19E
Interest income 48,576 57,272 60,540 68,024
Interest expended 22,577 22,938 24,002 26,500
Net interest income 25,999 34,334 36,537 41,524
- Fee & forex income 175 195 200 230
Net revenues 26,174 34,529 36,737 41,754
Operating expense 11,619 12,503 13,860 15,207
- Employee exp 6,656 7,280 7,999 8,901
- Depn /amortisation 575 483 518 408
- Other opex 4,388 4,740 5,342 5,897
Preprovision profit 14,554 22,026 22,878 26,547
Provisions 1,624 2,816 838 1,400
Profit Before Tax 12,930 19,210 22,039 25,147
Less: Provision for Tax 4,981 7,411 7,604 8,676
Profit After Tax 7,950 11,798 14,436 16,471
Reported Profit 7,950 11,798 14,436 16,471
Shares o /s (mn) 396 399 399 399
Basic EPS (INR) 20.1 29.5 36.1 41.2
Diluted shares o/s (mn) 396 399 399 399
Adj. Diluted EPS (INR) 20.1 29.5 36.1 41.2
Dividend per share (DPS) 6.0 6.0 8.5 8.5
Dividend Payout Ratio(%) 29.9 20.3 23.5 20.6
Growth ratios (%)
Year to March FY16 FY17 FY18E FY19E
Revenues 18.0 31.9 6.4 13.7
NII growth 17.9 32.1 6.4 13.6
Opex growth 0.7 7.6 10.9 9.7
PPP growth 36.7 51.3 3.9 16.0
Provisions growth 337.8 73.4 (70.2) 67.0
Adjusted Profit 18.6 48.4 22.4 14.1
Operating ratios
Year to March FY16 FY17 FY18E FY19E
Yield on advances 20.3 22.2 20.8 20.2
Cost of funds 11.8 11.5 10.9 10.6
Net interest margins 10.8 13.4 12.7 12.6
Spread 8.3 10.8 10.1 10.0
Cost-income 44.4 36.2 37.7 36.4
Tax rate 38.5 38.6 34.5 34.5
Key Assumptions
Year to March FY16 FY17 FY18E FY19E
Macro
GDP(Y-o-Y %) 7.2 6.5 7.1 7.7
Inflation (Avg) 4.9 4.5 4.0 4.5
Repo rate (exit rate) 6.8 6.3 5.8 5.8
USD/INR (Avg) 65.0 67.5 66.0 66.0
Sector
Credit growth 9.3 9.0 12.0 14.0
Deposit growth 8.6 14.0 12.0 13.0
Bank's base rate (%) 9.5 9.0 9.0 9.0
Wholesale borr. cost (%) 8.5 8.5 8.5 8.5
G-sec yield 7.5 6.5 6.5 6.5
Company
Op. metric assumptions (%)
Yield on advances 20.3 22.2 20.8 20.2
Cost of funds 11.8 11.5 10.9 10.6
Net interest margins 10.8 13.4 12.7 12.6
Opex growth
- employee cost 11.0 2.9 10.0 10.0
- advertisement (3.8) (15.1) 10.0 5.0
- rent 3.8 4.8 15.0 7.0
Tax rate (%) 38.5 38.6 34.5 34.5
Bal. sheet assumptions (%)
Number of branches 4,275 4,307 4,302 4,352
Gold loan tenure 2.6 2.6 2.6 2.6
AUMs (in tonnes)/branch 33.2 34.6 37.7 42.6
Average INR per gm 1,714 1,827 1,907 1,960
Average LTV 71.9 72.0 72.0 72.0
Gross NPLs 2.9 2.1 2.3 2.8
Prov Cov 14.5 18.1 20.0 21.0

12 Edelweiss Securities Limited
Banking and Financial Services
Peer comparison valuation
Market cap Diluted P/E (X) P/B (X) ROAE (%)
Name (USD mn) FY18E FY19E FY18E FY19E FY18E FY19E
Muthoot Finance 2,862 12.7 11.1 2.4 2.1 20.5 20.1
Dewan Housing Finance 2,101 12.0 10.4 1.5 1.4 13.8 14.5
HDFC 43,206 21.3 18.2 4.2 3.4 19.9 20.9
Indiabulls Housing Finance 7,704 14.4 11.9 3.7 3.3 27.3 29.3
LIC Housing Finance 5,351 16.5 14.8 2.7 2.3 18.8 18.4
Mahindra & Mahindra Financial Services 3,774 37.0 23.2 3.5 3.2 9.8 14.4
Manappuram General Finance 1,302 9.9 8.6 2.3 2.0 24.9 24.9
Power Finance Corp 5,546 5.2 5.1 0.9 0.8 17.8 16.1
Reliance Capital 3,164 16.2 13.0 1.2 1.1 7.5 8.7
Repco Home Finance 661 20.2 16.5 3.2 2.7 17.0 17.8
Rural Electrification Corporation 5,421 5.9 5.4 0.9 0.8 16.6 15.9
Shriram City Union Finance 2,211 16.9 12.0 2.5 2.1 15.6 19.0
Shriram Transport Finance 3,350 12.4 8.1 1.7 1.4 14.5 19.2
Median - 12.7 11.1 2.3 2.0 17.0 18.4
AVERAGE - 13.8 10.8 2.0 1.8 17.2 18.4
Source: Edelweiss research
RoE decomposition (%)
Year to March FY16 FY17 FY18E FY19E
Net int. income/assets 10.8 13.4 12.7 12.6
Non int. income/assets 0.1 0.1 0.1 0.1
Net revenues/assets 10.9 13.5 12.8 12.7
Operating expense/assets (4.8) (4.9) (4.8) (4.6)
Provisions/assets (0.7) (1.1) (0.3) (0.4)
Taxes/assets (2.1) (2.9) (2.6) (2.6)
Total costs/assets (7.6) (8.9) (7.7) (7.7)
ROA 3.3 4.6 5.0 5.0
Equity/assets 22.2 23.6 24.4 24.8
ROAE (%) 14.9 19.4 20.5 20.1
Valuation parameters
Year to March FY16 FY17 FY18E FY19E
Adj. Diluted EPS (INR) 20.1 29.5 36.1 41.2
Y-o-Y growth (%) 19.4 47.2 22.4 14.1
BV per share (INR) 140.8 163.3 189.5 220.9
Adj. BV per share (INR) 130.3 155.2 179.6 206.8
Diluted P/E (x) 22.8 15.5 12.7 11.1
P/B (x) 3.2 2.8 2.4 2.1
Price/ Adj. book (x) 3.5 2.9 2.5 2.2
Balance sheet (INR mn)
As on 31st March FY16 FY17 FY18E FY19E
Share capital 3,990 3,995 3,995 3,995
Reserves & Surplus 52,202 61,170 71,633 84,131
Shareholders' funds 56,192 65,164 75,627 88,126
Short term borrowings 130,486 147,671 160,278 189,312
Long term borrowings 55,923 63,288 68,690 81,134
Total Borrowings 186,409 210,959 228,968 270,445
Long Term Liabilities 19,495 21,650 24,116 26,601
Def. Tax Liability (net) (520) (560) (560) (560)
Sources of funds 261,577 297,213 328,151 384,611
Gross Block 5,471 5,855 5,848 6,028
Net Block 2,138 2,039 1,515 1,286
Capital work in progress 89 - - -
Intangible Assets 47 43 32 27
Total Fixed Assets 2,274 2,082 1,546 1,313
Non current investments 983 2,091 2,391 2,691
Cash and Equivalents 6,791 15,346 10,830 12,723
Loans & Advances 243,355 272,205 309,421 363,501
Current assets (ex cash) 14,673 12,706 12,001 13,250
Trade payable 1,040 1,155 1,286 1,419
Other Current Liab 5,459 6,062 6,753 7,448
Total Current Liab 6,498 7,217 8,039 8,867
Net Curr Assets-ex cash 8,174 5,489 3,962 4,383
Uses of funds 261,577 297,213 328,151 384,611
BVPS (INR) 140.8 163.3 189.5 220.9

13 Edelweiss Securities Limited
Muthoot Finance
Holding - Top 10
Perc. Holding Perc. Holding
Reliance Capital Trustee 3.53 Goldman Sachs Group 2.38
SBI Funds Management 1.68 ICICI Prudential Asset Management 1.54
Birla Sun Life Asset Management 1.32 Tata Asset Management 1.11
Grantham Mayo Van Otterloo & Co. 1.06 Vanguard Group 0.72
HSBC 0.67 India Infoline 0.49
*as per last available data
Insider Trades
Reporting Data Acquired / Seller B/S Qty Traded
No Data Available
*in last one year
Bulk Deals Data Acquired / Seller B/S Qty Traded Price
26 Sep 2016 Barclays Merchant Bank (Singapore) Ltd Buy 3056502 373.00
26 Sep 2016 Baring India Pvt Equity Fund Iii Listed Investments Ltd Sell 3056502 373.00
*in last one year
Additional Data
Directors Data M. G. George Muthoot Chairman George Alexander Muthoot Managing Director
George Thomas Muthoot Joint Managing Director George Jacob Muthoot Joint Managing Director
Alexander George Muthoot Whole time Director K. John Mathew Director
K. George John Director George Joseph Director
Pamela Anna Mathew Director John K. Paul Director
Auditors - Rangamani & Co.
*as per last annual report

14 Edelweiss Securities Limited
Company Absolute
reco
Relative
reco
Relative
risk
Company Absolute
reco
Relative
reco
Relative
Risk
Allahabad Bank HOLD SU M Axis Bank BUY SO M
Bajaj Finserv HOLD SP L Bank of Baroda BUY SP M
Bharat Financial Inclusion BUY SO M Capital First BUY SO M
DCB Bank HOLD SU M Dewan Housing Finance BUY SO M
Equitas Holdings Ltd. BUY SO M Federal Bank BUY SP L
HDFC HOLD SP L HDFC Bank BUY SO L
ICICI Bank BUY SO L IDFC Bank HOLD SP L
Indiabulls Housing Finance BUY SO M IndusInd Bank BUY SP L
Karnataka Bank BUY SP M Kotak Mahindra Bank HOLD SP M
L&T FINANCE HOLDINGS LTD BUY SO M LIC Housing Finance BUY SP M
Magma Fincorp BUY SP M Mahindra & Mahindra Financial Services HOLD SU M
Manappuram General Finance BUY SO H Max Financial Services BUY SO L
Multi Commodity Exchange of India BUY SP M Muthoot Finance BUY SO M
Oriental Bank Of Commerce HOLD SP L Power Finance Corp BUY SO M
Punjab National Bank BUY SP M Reliance Capital BUY SP M
Repco Home Finance BUY SO M Rural Electrification Corporation BUY SO M
Shriram City Union Finance BUY SO M Shriram Transport Finance BUY SO L
South Indian Bank BUY SP M State Bank of India BUY SP L
Union Bank Of India HOLD SP M Yes Bank BUY SO M
RATING & INTERPRETATION
ABSOLUTE RATING
Ratings Expected absolute returns over 12 months
Buy More than 15%
Hold Between 15% and - 5%
Reduce Less than -5%
RELATIVE RETURNS RATING
Ratings Criteria
Sector Outperformer (SO) Stock return > 1.25 x Sector return
Sector Performer (SP) Stock return > 0.75 x Sector return
Stock return < 1.25 x Sector return
Sector Underperformer (SU) Stock return < 0.75 x Sector return
Sector return is market cap weighted average return for the coverage universe
within the sector
RELATIVE RISK RATING
Ratings Criteria
Low (L) Bottom 1/3rd percentile in the sector
Medium (M) Middle 1/3rd percentile in the sector
High (H) Top 1/3rd percentile in the sector
Risk ratings are based on Edelweiss risk model
SECTOR RATING
Ratings Criteria
Overweight (OW) Sector return > 1.25 x Nifty return
Equalweight (EW) Sector return > 0.75 x Nifty return
Sector return < 1.25 x Nifty return
Underweight (UW) Sector return < 0.75 x Nifty return

15 Edelweiss Securities Limited
Muthoot Finance
Edelweiss Securities Limited, Edelweiss House, off C.S.T. Road, Kalina, Mumbai – 400 098.
Board: (91-22) 4009 4400, Email: [email protected]
Aditya Narain
Head of Research
Coverage group(s) of stocks by primary analyst(s): Banking and Financial Services
Allahabad Bank, Axis Bank, Bharat Financial Inclusion, Bajaj Finserv, Bank of Baroda, Capital First, DCB Bank, Dewan Housing Finance, Equitas Holdings Ltd., Federal Bank, HDFC, HDFC Bank, ICICI Bank, IDFC Bank, Indiabulls Housing Finance, IndusInd Bank, Karnataka Bank, Kotak Mahindra Bank, LIC Housing Finance, L&T FINANCE HOLDINGS LTD, Max Financial Services, Multi Commodity Exchange of India, Manappuram General Finance, Magma Fincorp, Mahindra & Mahindra Financial Services, Muthoot Finance, Oriental Bank Of Commerce, Punjab National Bank, Power Finance Corp, Reliance Capital, Rural Electrification Corporation, Repco Home Finance, State Bank of India, Shriram City Union Finance, Shriram Transport Finance, South Indian Bank, Union Bank Of India, Yes Bank
Distribution of Ratings / Market Cap
Edelweiss Research Coverage Universe
Rating Distribution* 161 67 11 240 * 1stocks under review
Market Cap (INR) 156 62 11
Date Company Title Price (INR) Recos
Recent Research
04-Aug-17 Repco Home Finance
Growth takes a beating, yet again; trend to reverse; Result Update
767 Buy
03-Aug-17 ICICI Bank 20F findings: Stress elevated, but pursuing prudent course; Company Update
296 Buy
02-Aug-17 Capital First
Momentum sustained; Result Update
781 Buy
> 50bn Between 10bn and 50 bn < 10bn
Buy Hold Reduce Total
Rating Interpretation
Buy appreciate more than 15% over a 12-month period
Hold appreciate up to 15% over a 12-month period
Reduce depreciate more than 5% over a 12-month period
Rating Expected to
-
149
297
446
594
743
Jan
-14
Feb
-14
Mar
-14
Ap
r-1
4
May
-14
Jun
-14
Jul-
14
Au
g-1
4
Sep
-14
Oct
-14
No
v-1
4
De
c-1
4
(IN
R)
One year price chart
100
200
300
400
500
600
Au
g-1
6
Au
g-1
6
Sep
-16
Oct
-16
Oct
-16
No
v-1
6
De
c-1
6
Jan
-17
Jan
-17
Feb
-17
Mar
-17
Mar
-17
Ap
r-1
7
May
-17
May
-17
Jun
-17
Jul-
17
Jul-
17
(IN
R)
Muthoot Finance

16 Edelweiss Securities Limited
Banking and Financial Services
DISCLAIMER
Edelweiss Securities Limited (“ESL” or “Research Entity”) is regulated by the Securities and Exchange Board of India (“SEBI”) and is licensed to carry on the business of broking, depository services and related activities. The business of ESL and its Associates (list available on www.edelweissfin.com) are organized around five broad business groups – Credit including Housing and SME Finance, Commodities, Financial Markets, Asset Management and Life Insurance.
This Report has been prepared by Edelweiss Securities Limited in the capacity of a Research Analyst having SEBI Registration No.INH200000121 and distributed as per SEBI (Research Analysts) Regulations 2014. This report does not constitute an offer or solicitation for the purchase or sale of any financial instrument or as an official confirmation of any transaction. Securities as defined in clause (h) of section 2 of the Securities Contracts (Regulation) Act, 1956 includes Financial Instruments and Currency Derivatives. The information contained herein is from publicly available data or other sources believed to be reliable. This report is provided for assistance only and is not intended to be and must not alone be taken as the basis for an investment decision. The user assumes the entire risk of any use made of this information. Each recipient of this report should make such investigation as it deems necessary to arrive at an independent evaluation of an investment in Securities referred to in this document (including the merits and risks involved), and should consult his own advisors to determine the merits and risks of such investment. The investment discussed or views expressed may not be suitable for all investors.
This information is strictly confidential and is being furnished to you solely for your information. This information should not be reproduced or redistributed or passed on directly or indirectly in any form to any other person or published, copied, in whole or in part, for any purpose. This report is not directed or intended for distribution to, or use by, any person or entity who is a citizen or resident of or located in any locality, state, country or other jurisdiction, where such distribution, publication, availability or use would be contrary to law, regulation or which would subject ESL and associates / group companies to any registration or licensing requirements within such jurisdiction. The distribution of this report in certain jurisdictions may be restricted by law, and persons in whose possession this report comes, should observe, any such restrictions. The information given in this report is as of the date of this report and there can be no assurance that future results or events will be consistent with this information. This information is subject to change without any prior notice. ESL reserves the right to make modifications and alterations to this statement as may be required from time to time. ESL or any of its associates / group companies shall not be in any way responsible for any loss or damage that may arise to any person from any inadvertent error in the information contained in this report. ESL is committed to providing independent and transparent recommendation to its clients. Neither ESL nor any of its associates, group companies, directors, employees, agents or representatives shall be liable for any damages whether direct, indirect, special or consequential including loss of revenue or lost profits that may arise from or in connection with the use of the information. Our proprietary trading and investment businesses may make investment decisions that are inconsistent with the recommendations expressed herein. Past performance is not necessarily a guide to future performance .The disclosures of interest statements incorporated in this report are provided solely to enhance the transparency and should not be treated as endorsement of the views expressed in the report. The information provided in these reports remains, unless otherwise stated, the copyright of ESL. All layout, design, original artwork, concepts and other Intellectual Properties, remains the property and copyright of ESL and may not be used in any form or for any purpose whatsoever by any party without the express written permission of the copyright holders.
ESL shall not be liable for any delay or any other interruption which may occur in presenting the data due to any reason including network (Internet) reasons or snags in the system, break down of the system or any other equipment, server breakdown, maintenance shutdown, breakdown of communication services or inability of the ESL to present the data. In no event shall ESL be liable for any damages, including without limitation direct or indirect, special, incidental, or consequential damages, losses or expenses arising in connection with the data presented by the ESL through this report.
We offer our research services to clients as well as our prospects. Though this report is disseminated to all the customers simultaneously, not all customers may receive this report at the same time. We will not treat recipients as customers by virtue of their receiving this report.
ESL and its associates, officer, directors, and employees, research analyst (including relatives) worldwide may: (a) from time to time, have long or short positions in, and buy or sell the Securities, mentioned herein or (b) be engaged in any other transaction involving such Securities and earn brokerage or other compensation or act as a market maker in the financial instruments of the subject company/company(ies) discussed herein or act as advisor or lender/borrower to such company(ies) or have other potential/material conflict of interest with respect to any recommendation and related information and opinions at the time of publication of research report or at the time of public appearance. ESL may have proprietary long/short position in the above mentioned scrip(s) and therefore should be considered as interested. The views provided herein are general in nature and do not consider risk appetite or investment objective of any particular investor; readers are requested to take independent professional advice before investing. This should not be construed as invitation or solicitation to do business with ESL.

17 Edelweiss Securities Limited
Muthoot Finance
ESL or its associates may have received compensation from the subject company in the past 12 months. ESL or its associates may have managed or co-managed public offering of securities for the subject company in the past 12 months. ESL or its associates may have received compensation for investment banking or merchant banking or brokerage services from the subject company in the past 12 months. ESL or its associates may have received any compensation for products or services other than investment banking or merchant banking or brokerage services from the subject company in the past 12 months. ESL or its associates have not received any compensation or other benefits from the Subject Company or third party in connection with the research report. Research analyst or his/her relative or ESL’s associates may have financial interest in the subject company. ESL and/or its Group Companies, their Directors, affiliates and/or employees may have interests/ positions, financial or otherwise in the Securities/Currencies and other investment products mentioned in this report. ESL, its associates, research analyst and his/her relative may have other potential/material conflict of interest with respect to any recommendation and related information and opinions at the time of publication of research report or at the time of public appearance.
Participants in foreign exchange transactions may incur risks arising from several factors, including the following: ( i) exchange rates can be volatile and are subject to large fluctuations; ( ii) the value of currencies may be affected by numerous market factors, including world and national economic, political and regulatory events, events in equity and debt markets and changes in interest rates; and (iii) currencies may be subject to devaluation or government imposed exchange controls which could affect the value of the currency. Investors in securities such as ADRs and Currency Derivatives, whose values are affected by the currency of an underlying security, effectively assume currency risk.
Research analyst has served as an officer, director or employee of subject Company: No
ESL has financial interest in the subject companies: No
ESL’s Associates may have actual / beneficial ownership of 1% or more securities of the subject company at the end of the month immediately preceding the date of publication of research report.
Research analyst or his/her relative has actual/beneficial ownership of 1% or more securities of the subject company at the end of the month immediately preceding the date of publication of research report: No
ESL has actual/beneficial ownership of 1% or more securities of the subject company at the end of the month immediately preceding the date of publication of research report: No
Subject company may have been client during twelve months preceding the date of distribution of the research report.
There were no instances of non-compliance by ESL on any matter related to the capital markets, resulting in significant and material disciplinary action during the last three years except that ESL had submitted an offer of settlement with Securities and Exchange commission, USA (SEC) and the same has been accepted by SEC without admitting or denying the findings in relation to their charges of non registration as a broker dealer.
A graph of daily closing prices of the securities is also available at www.nseindia.com
Analyst Certification:
The analyst for this report certifies that all of the views expressed in this report accurately reflect his or her personal views about the subject company or companies and its or their securities, and no part of his or her compensation was, is or will be, directly or indirectly related to specific recommendations or views expressed in this report.
Additional Disclaimers
Disclaimer for U.S. Persons
This research report is a product of Edelweiss Securities Limited, which is the employer of the research analyst(s) who has prepared the research report. The research analyst(s) preparing the research report is/are resident outside the United States (U.S.) and are not associated persons of any U.S. regulated broker-dealer and therefore the analyst(s) is/are not subject to supervision by a U.S. broker-dealer, and is/are not required to satisfy the regulatory licensing requirements of FINRA or required to otherwise comply with U.S. rules or regulations regarding, among other things, communications with a subject company, public appearances and trading securities held by a research analyst account.
This report is intended for distribution by Edelweiss Securities Limited only to "Major Institutional Investors" as defined by Rule 15a-6(b)(4) of the U.S. Securities and Exchange Act, 1934 (the Exchange Act) and interpretations thereof by U.S. Securities and Exchange Commission (SEC) in reliance on Rule 15a 6(a)(2). If the recipient of this report is not a Major Institutional Investor as specified above, then it should not act upon this report and return the same to the sender. Further, this report may not be copied, duplicated and/or transmitted onward to any U.S. person, which is not the Major Institutional Investor.

18 Edelweiss Securities Limited
Banking and Financial Services
Access the entire repository of Edelweiss Research on www.edelresearch.com
In reliance on the exemption from registration provided by Rule 15a-6 of the Exchange Act and interpretations thereof by the SEC in order to conduct certain business with Major Institutional Investors, Edelweiss Securities Limited has entered into an agreement with a U.S. registered broker-dealer, Edelweiss Financial Services Inc. ("EFSI"). Transactions in securities discussed in this research report should be effected through Edelweiss Financial Services Inc. Disclaimer for U.K. Persons
The contents of this research report have not been approved by an authorised person within the meaning of the Financial Services and Markets Act 2000 ("FSMA"). In the United Kingdom, this research report is being distributed only to and is directed only at (a) persons who have professional experience in matters relating to investments falling within Article 19(5) of the FSMA (Financial Promotion) Order 2005 (the “Order”); (b) persons falling within Article 49(2)(a) to (d) of the Order (including high net worth companies and unincorporated associations); and (c) any other persons to whom it may otherwise lawfully be communicated (all such persons together being referred to as “relevant persons”). This research report must not be acted on or relied on by persons who are not relevant persons. Any investment or investment activity to which this research report relates is available only to relevant persons and will be engaged in only with relevant persons. Any person who is not a relevant person should not act or rely on this research report or any of its contents. This research report must not be distributed, published, reproduced or disclosed (in whole or in part) by recipients to any other person. Disclaimer for Canadian Persons
This research report is a product of Edelweiss Securities Limited ("ESL"), which is the employer of the research analysts who have prepared the research report. The research analysts preparing the research report are resident outside the Canada and are not associated persons of any Canadian registered adviser and/or dealer and, therefore, the analysts are not subject to supervision by a Canadian registered adviser and/or dealer, and are not required to satisfy the regulatory licensing requirements of the Ontario Securities Commission, other Canadian provincial securities regulators, the Investment Industry Regulatory Organization of Canada and are not required to otherwise comply with Canadian rules or regulations regarding, among other things, the research analysts' business or relationship with a subject company or trading of securities by a research analyst. This report is intended for distribution by ESL only to "Permitted Clients" (as defined in National Instrument 31-103 ("NI 31-103")) who are resident in the Province of Ontario, Canada (an "Ontario Permitted Client"). If the recipient of this report is not an Ontario Permitted Client, as specified above, then the recipient should not act upon this report and should return the report to the sender. Further, this report may not be copied, duplicated and/or transmitted onward to any Canadian person. ESL is relying on an exemption from the adviser and/or dealer registration requirements under NI 31-103 available to certain international advisers and/or dealers. Please be advised that (i) ESL is not registered in the Province of Ontario to trade in securities nor is it registered in the Province of Ontario to provide advice with respect to securities; (ii) ESL's head office or principal place of business is located in India; (iii) all or substantially all of ESL's assets may be situated outside of Canada; (iv) there may be difficulty enforcing legal rights against ESL because of the above; and (v) the name and address of the ESL's agent for service of process in the Province of Ontario is: Bamac Services Inc., 181 Bay Street, Suite 2100, Toronto, Ontario M5J 2T3 Canada. Disclaimer for Singapore Persons
In Singapore, this report is being distributed by Edelweiss Investment Advisors Private Limited ("EIAPL") (Co. Reg. No. 201016306H) which is a holder of a capital markets services license and an exempt financial adviser in Singapore and (ii) solely to persons who qualify as "institutional investors" or "accredited investors" as defined in section 4A(1) of the Securities and Futures Act, Chapter 289 of Singapore ("the SFA"). Pursuant to regulations 33, 34, 35 and 36 of the Financial Advisers Regulations ("FAR"), sections 25, 27 and 36 of the Financial Advisers Act, Chapter 110 of Singapore shall not apply to EIAPL when providing any financial advisory services to an accredited investor (as defined in regulation 36 of the FAR. Persons in Singapore should contact EIAPL in respect of any matter arising from, or in connection with this publication/communication. This report is not suitable for private investors.
Copyright 2009 Edelweiss Research (Edelweiss Securities Ltd). All rights reserved