results for half-year 2021 presentation to analysts and
TRANSCRIPT

Results for half-year 2021
Presentation to analysts and investors
September 2021
Contents
Sections
1 Highlights 4
2 Business review: Global Advisory 8
3 Business review: Wealth & Asset Management 15
4 Business review: Merchant Banking 25
5 Corporate responsibility 31
6 Financials 34
7 Targets and outlook 42
Appendices 45

Highlights
1
Public
Highlights
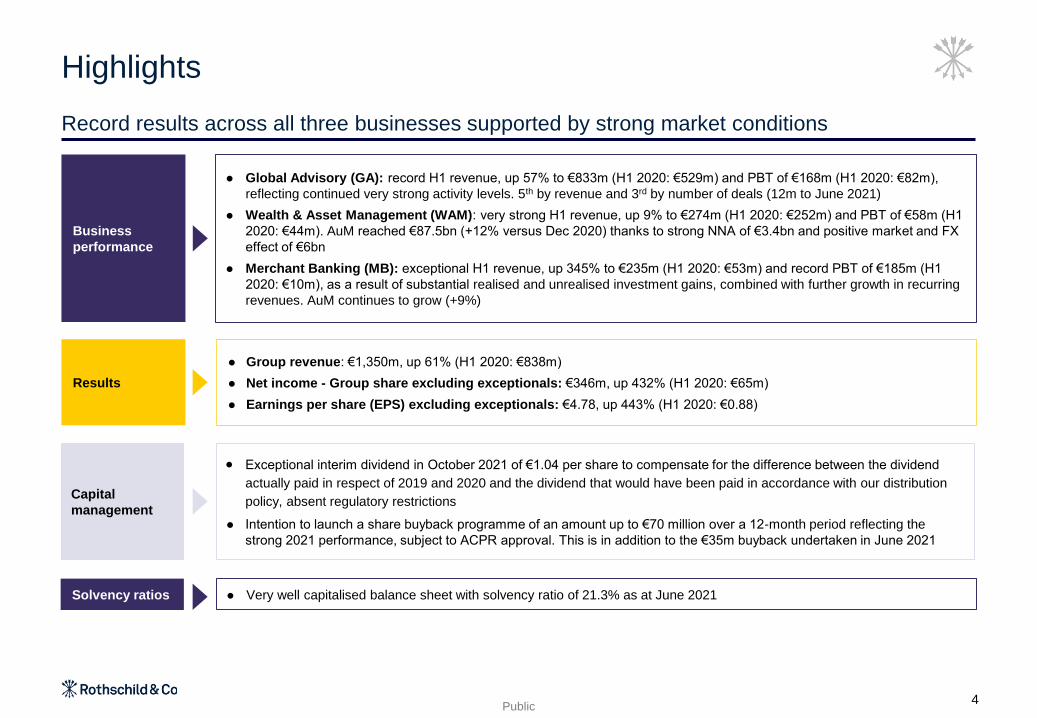
Record results across all three businesses supported by strong market conditions
4
Business
performance
Results
⚫ Global Advisory (GA): record H1 revenue, up 57% to €833m (H1 2020: €529m) and PBT of €168m (H1 2020: €82m),
reflecting continued very strong activity levels. 5th by revenue and 3rd by number of deals (12m to June 2021)
⚫ Wealth & Asset Management (WAM): very strong H1 revenue, up 9% to €274m (H1 2020: €252m) and PBT of €58m (H1
2020: €44m). AuM reached €87.5bn (+12% versus Dec 2020) thanks to strong NNA of €3.4bn and positive market and FX
effect of €6bn
⚫ Merchant Banking (MB): exceptional H1 revenue, up 345% to €235m (H1 2020: €53m) and record PBT of €185m (H1
2020: €10m), as a result of substantial realised and unrealised investment gains, combined with further growth in recurring
revenues. AuM continues to grow (+9%)
⚫ Group revenue: €1,350m, up 61% (H1 2020: €838m)
⚫ Net income - Group share excluding exceptionals: €346m, up 432% (H1 2020: €65m)
⚫ Earnings per share (EPS) excluding exceptionals: €4.78, up 443% (H1 2020: €0.88)
Solvency ratios ⚫ Very well capitalised balance sheet with solvency ratio of 21.3% as at June 2021
Capital
management
• Exceptional interim dividend in October 2021 of €1.04 per share to compensate for the difference between the dividend
actually paid in respect of 2019 and 2020 and the dividend that would have been paid in accordance with our distribution
policy, absent regulatory restrictions
⚫ Intention to launch a share buyback programme of an amount up to €70 million over a 12-month period reflecting the
strong 2021 performance, subject to ACPR approval. This is in addition to the €35m buyback undertaken in June 2021
Public
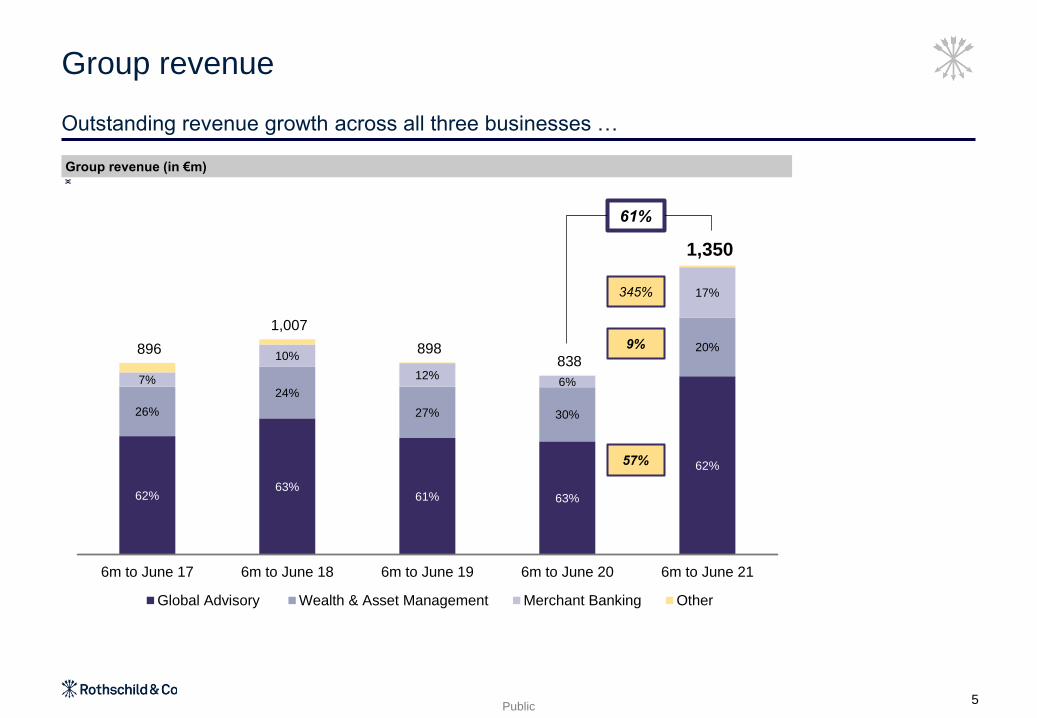
62%63%
61% 63%
62%
26%
24%
27% 30%
20%
7%
10%
12%6%
17%
896
1,007
898 838
1,350
6m to June 17 6m to June 18 6m to June 19 6m to June 20 6m to June 21
Global Advisory Wealth & Asset Management Merchant Banking Other
Group revenue (in €m)
Group revenue
61%
57%
9%
345%
Outstanding revenue growth across all three businesses …
5

Public
1.31
2.14
1.88
0.82
4.78
1.41
2.18
1.73
0.88
4.78
6m to June 17
6m to June 18
6m to June 19
6m to June 20
6m to June 21
EPS (in €)EPS excluding exceptionals (in €)
Group EPS
Average number
of shares – 000s
483%443%
74,512
75,108
71,1981
71,793
72,159
… that translates into exceptional EPS progression
6
Note
1 Average number of shares decreased as a consequence of the share buy back as part of Edmond de Rothschild deal in August 2018

Business review: Global Advisory
2

Public8
Highlights of H1 2021
Global Advisory
Performance
⚫ Record H1 revenue performance, driven from increased deal activity by volume
and by value
⚫ Reclaimed 5th position on the global Revenue League Table for last 12 months
⚫ Record M&A H1 performance, c.50% up from H1 2020 and out performing the
market
⚫ Record Financing Advisory H1 performance, c.80% up from H1 last year
⚫ Robust performance across geographies, sectors and products
Positive pipeline development across all regions
Successfully growing our Private Capital capabilities
⚫ Advised on nine capital raises, eight minority transactions and three GP solutions
mandates
1st globally
by number and value
for Debt Advisory
3rd
by number of M&A deals
globally in H1
1stfor restructuring
Globally by number /
Europe by value
1st
by number of M&A deals
in Europe in H1
Advised on Europe’s
largest IPOs, rights
issues and block trades
1stglobally
by number and value
for Equity Advisory

Public
Global M&A market by values
Global Advisory
9
Source: Dealogic
-
1,000
2,000
3,000
4,000
5,000
6,000
7,000
1995 1996 1997 1998 1999 2000 2001 2002 2003 2004 2005 2006 2007 2008 2009 2010 2011 2012 2013 2014 2015 2016 2017 2018 2019 2020 LTMJune2021
Announced deal value ($bn) Completed deal value ($bn)
16 vs 15 17 vs 16 18 vs 17 19 vs 18 20 vs 19LTM 06/21 vs
LTM 06/20
H1 21 vs
H1 20
% var Announced (17%) (5%) 16% (3%) 51% 89% 167%
% var Completed (5%) (5%) 17% (11%) 8% 7% 31%

Public
67%
77%80%
73%
69%
33%
23%
20%27%
31%
554
636
545 529
833
H1 2017 H1 2018 H1 2019 H1 2020 H1 2021
M&A Advisory Financing Advisory (debt advisory and restructuring & equity advisory)
Revenue by product (in €m)
Global Advisory
57%
49%
80%
Record half-year revenue across both business lines
10
Public
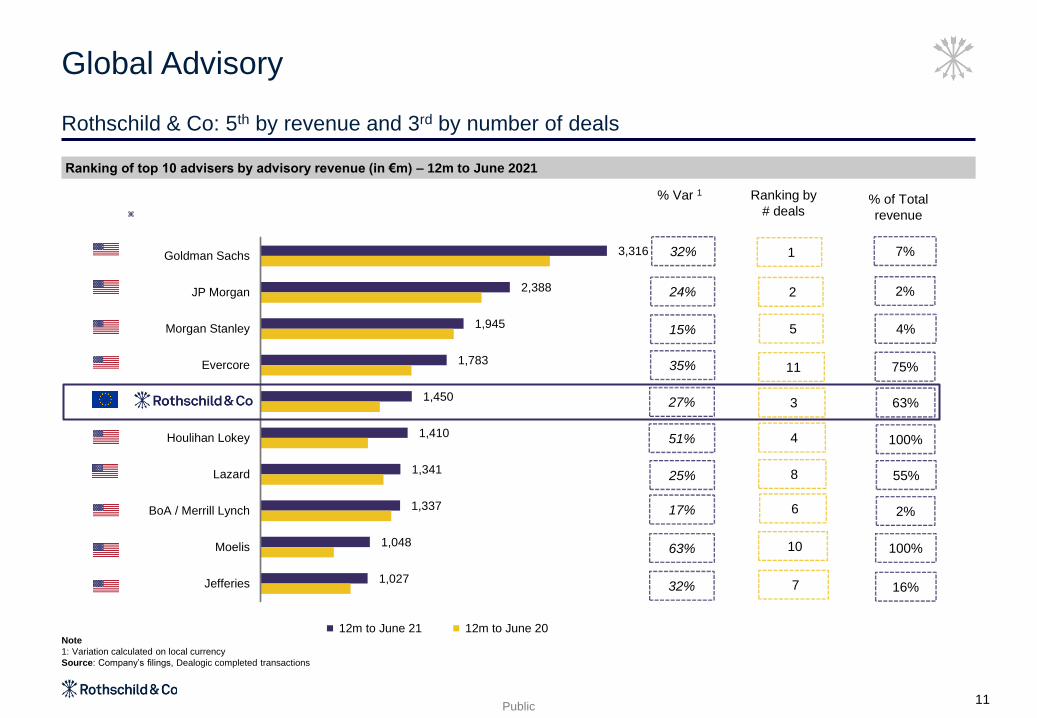
3,316
2,388
1,945
1,783
1,450
1,410
1,341
1,337
1,048
1,027
Goldman Sachs
JP Morgan
Morgan Stanley
Evercore
Houlihan Lokey
Lazard
BoA / Merrill Lynch
Moelis
Jefferies
12m to June 21 12m to June 20
1 7%
10
6
8
4
3
11
5
2
7 16%
100%
2%
55%
100%
63%
75%
4%
2%
32%
24%
15%
35%
27%
51%
25%
17%
63%
32%
Ranking of top 10 advisers by advisory revenue (in €m) – 12m to June 2021
Rothschild & Co: 5th by revenue and 3rd by number of deals
Global Advisory
Ranking by
# deals% of Total
revenue
Note
1: Variation calculated on local currency
Source: Company’s filings, Dealogic completed transactions
11
% Var 1

Public
111 117
93 82
168
20%
18%
17%
15%
20%
10.0%
15.0%
20.0%
25.0%
30.0%
35.0%
40.0%
-
50
100
150
200
250
H1 2017 H1 2018 H1 2019 H1 2020 H1 2021
PBT excluding US investments costs % PBT margin excl. US investments
Global Advisory
105%
Record revenue drives record profits
12
Profit Before Tax (in €m) and PBT margin - pre US investment costs1
Note
1 US investment costs were €14m in H1 2017, €10m in H1 2018, €10m H1 2019, €7m in H1 2020 and €3m in H1 2021. Our US investment costs are expected to be around 2% of revenue subject to
the right opportunities

Public
Strength in M&A deal volumes in H1 2021
Update on our North America development
13
Selection of landmark deals advised by Rothschild & Co North America in H1 2021
Rothschild & Co North America H1 Performance1Overview
M&
A
De
als
Re
str
uc
turi
ng
De
als
1 Source Refinitiv, any North America involvement on completed transactions
⚫ Investments in senior and other bankers are generating strong results
and meaningful increases in deal numbers
⚫ Rothschild & Co North America continues to grow its sector and
geographic presence
⚫ Successful track record in North America restructuring deals (#5 by
announced value in H1 2021)
2. Business review: Global Advisory
+240%
+211%
M&A Deal value
M&A Deal number
$11bn $37bn
H1 2021H1 2020
18 56
Ad Hoc Group of First
Lien Lenders of GEE
US$1.0bn Chapter 11
restructuring
2021
TLB Lenders of Seadrill
Partners
$2.8bn Chapter 11
restructuring and
subsequent formation into
Aquadrill
2021
Ad Hoc Group of Garrett
Motion Shareholders
US$4.0bn Chapter 11
restructuring
2021
FirstGroup
Lead joint financial
advisor on US$4.6bn
divestiture of First Student
and First Transit to EQT
Infrastructure
Current
Inteliquent
US$1.14bn sale to Sinch
AB
Current
Advent International
US$2.3bn sale of Laird
Performance Materials to
DuPont
Current
wmh
US$1.5bn merger with
Silver Spike Acquisition
Corp
2021
2020
Chicago
New York
WashingtonPalo Alto
Los Angeles
Stamford
Boston
2021
Toronto
⚫ c.210 advisory bankers
2018
2014
2016

4
Business review: Wealth &
Asset Management
3
Public
Closing of
Banque Pâris
Bertrand acquisition
15
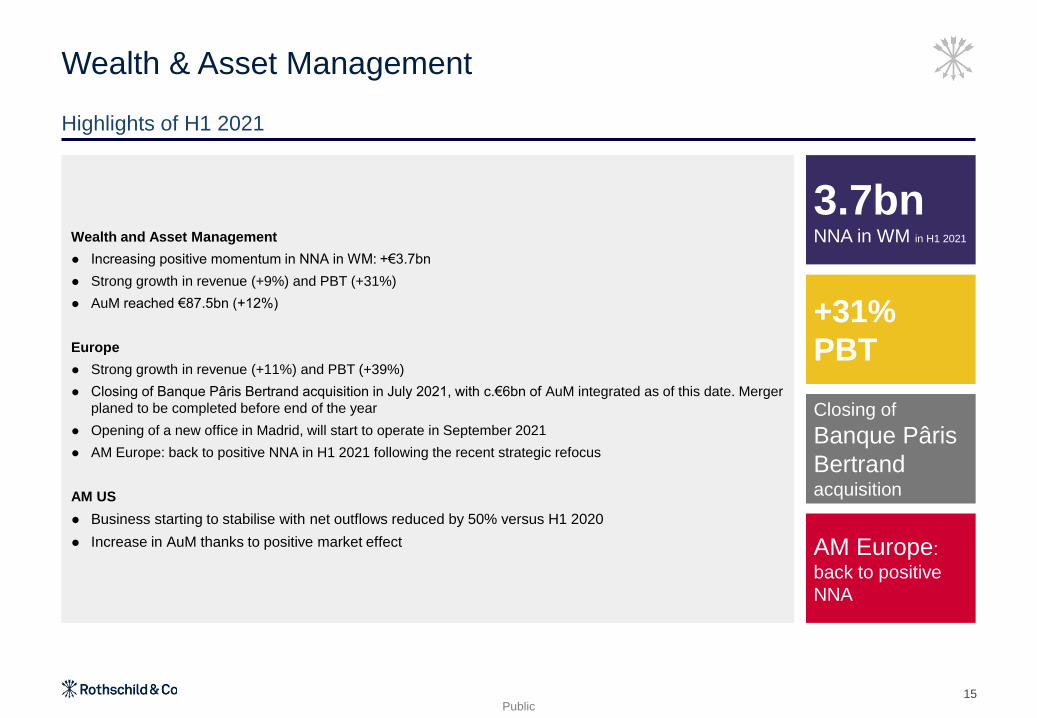
Wealth and Asset Management
⚫ Increasing positive momentum in NNA in WM: +€3.7bn
⚫ Strong growth in revenue (+9%) and PBT (+31%)
⚫ AuM reached €87.5bn (+12%)
Europe
⚫ Strong growth in revenue (+11%) and PBT (+39%)
⚫ Closing of Banque Pâris Bertrand acquisition in July 2021, with c.€6bn of AuM integrated as of this date. Merger
planed to be completed before end of the year
⚫ Opening of a new office in Madrid, will start to operate in September 2021
⚫ AM Europe: back to positive NNA in H1 2021 following the recent strategic refocus
AM US
⚫ Business starting to stabilise with net outflows reduced by 50% versus H1 2020
⚫ Increase in AuM thanks to positive market effect
Highlights of H1 2021
Wealth & Asset Management
+31%
PBT
3.7bn NNA in WM in H1 2021
AM Europe:
back to positive
NNA

Public
3.7
0.4 (0.7)
4.2
0.8 1.0
7.9
1.2
0.3
NNA Market and FX effect
55.8
63.7
14.1
15.3 8.2
8.5 78.1
87.5
31/12/2020 WM AM Europe AM US 30/06/2021
Wealth Management Asset Management Europe Asset Management US
16
Assets under management (in €bn)
AuM growth driven by record level of NNA in Wealth Management and positive market effect
Wealth & Asset Management
12%
Public
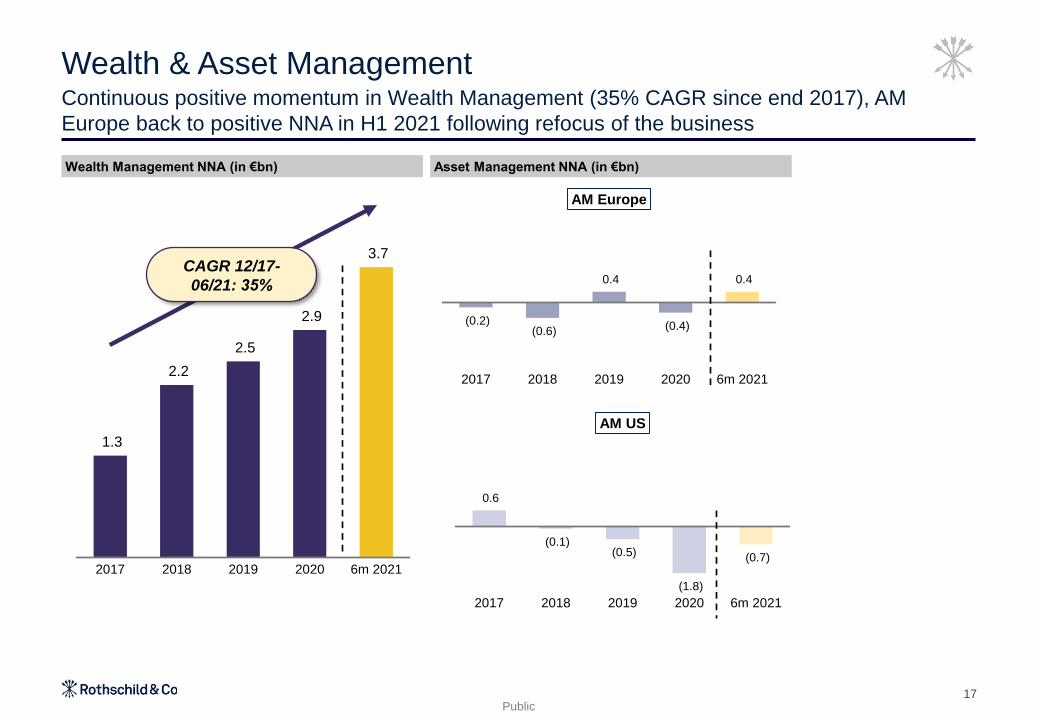
1.3
2.2
2.5
2.9
3.7
2017 2018 2019 2020 6m 2021
Asset Management NNA (in €bn)Wealth Management NNA (in €bn)
Continuous positive momentum in Wealth Management (35% CAGR since end 2017), AM
Europe back to positive NNA in H1 2021 following refocus of the business
Wealth & Asset Management
CAGR 12/17-
06/21: 35%
17
(0.2)(0.6)
0.4
(0.4)
0.4
2017 2018 2019 2020 6m 2021
AM Europe
0.6
(0.1)(0.5)
(1.8)
(0.7)
2017 2018 2019 2020 6m 2021
AM US
Public
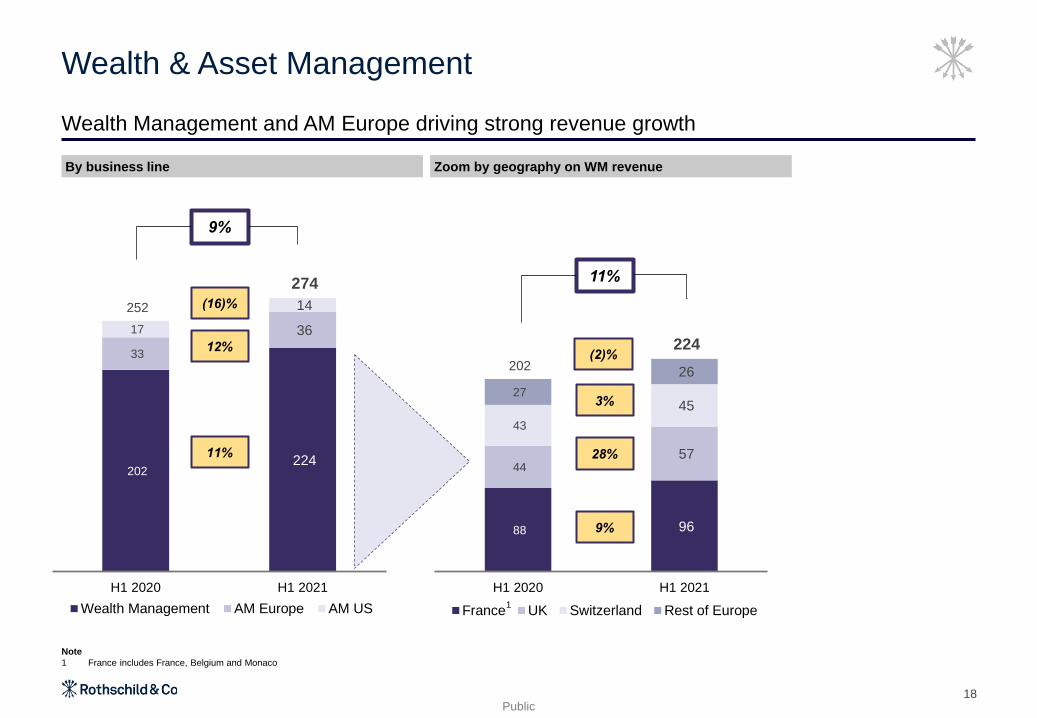
88 96
44 57
43
45 27
26 202
224
H1 2020 H1 2021
Chart Title
France UK Switzerland Rest of Europe
18
Zoom by geography on WM revenueBy business line
Wealth Management and AM Europe driving strong revenue growth
Wealth & Asset Management
Note
1 France includes France, Belgium and Monaco
11%
12%
9%
9%
3%
28%
1
11%
(16)%
(2)%
202 224
33
36 17
14 252
274
H1 2020 H1 2021
Chart Title
Wealth Management AM Europe AM US
Public
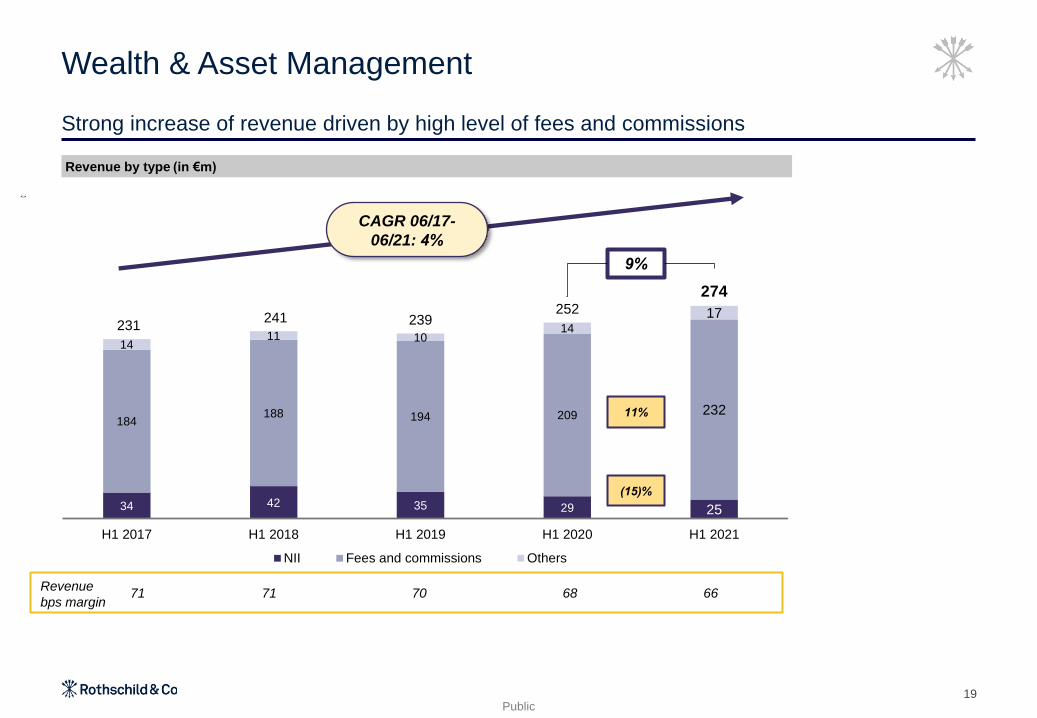
34 42 35 29 25
184188 194 209 232
1411 10
14
17231
241 239252
274
-
50
100
150
200
250
300
350
400
H1 2017 H1 2018 H1 2019 H1 2020 H1 2021
NII Fees and commissions Others
19
Revenue by type (in €m)
Strong increase of revenue driven by high level of fees and commissions
Wealth & Asset Management
9%
Revenue
bps margin71 71 70 68 66
11%
(15)%
CAGR 06/17-
06/21: 4%

Public
14
9
4
21
20
21
35
29
25
H1 2019 H1 2020 H1 2021
Treasury management Lending
20
Breakdown of NII between lending and treasury
NII continues to reduce due to low interest rate environment
Wealth & Asset Management
(59)%
4%
(15)%
(17)%
(30)%
(3)%
(37)%

Public
44 41
58
25
3
(3)
(11)
H1 2020 AM US H1 2020WAM Europe
Revenue Operatingexpenses
CoR H1 2021WAM Europe
21
Profit Before Tax (in €m) and PBT margin
PBT up 31% versus H1 2020 – WAM Europe PBT margin of 22%
Wealth & Asset Management
PBT
margin17.4% 17.5% 22.0%
WAM Europe: 39%
31%
Note
1. AM US stabilized with a small positive profit for H1 2021 (<€0.5m)

5
Business review: Merchant
Banking
4

Public
€144m of cash distributions
+10%of recurring
revenues
€17.1bn of AuM
NAV of
€804m
23
Highlights of H1 2021
Merchant Banking
Investment activity
⚫ Several attractive investments and profitable exits completed across all strategies
⚫ Many transactions involved coordinated efforts across different funds, both in Europe and in the US
Investment performance
⚫ Valuations in private equity increased significantly in line with the long-term value creation potential of our portfolio
⚫ Private equity investment performance was further enhanced by a number of successful exits completed during H1
2021
⚫ Private debt portfolio continued to perform well, with positive returns generated by both our direct lending and our
leveraged loan products
Business performance
⚫ Record-high and growing management fees, a stable source of recurring profitability for the Group
⚫ Highest recorded investment and performance revenue with positive contributions from all our lines of business
Business development and fundraising
⚫ Launch of a continuation fund to benefit from the additional value creation potential of the remaining FAPI I portfolio
⚫ Final closing for our new growth capital private equity fund (FAGC I) materially above its fundraising target
⚫ Multiple closings for our 3rd generation direct lending fund (FADP III) with commitments in excess of €1.0 billion already
secured
⚫ Launch of two new CLOs in Europe and US and final closing of Oberon IV (senior secured loan fund)
⚫ Preparation to launch a number of funds in H2 2021 including FAPI IV and a sustainable investment fund

Public
Assets under Management (in €bn)
Continuing growth of AuM thanks to development of business activities
Merchant Banking
+9%
24
CAGR 12/17- 06/21:
23%
10% 9% 9% 8% 8%
90%
91%
91%
92%92%8.3
11.1
14.0
15.7
17.1
2017 2018 2019 2020 30/06/2021
Group Third party
Private Equity26%
Secondaries / Co-
investments17%
Direct Lending
12%
Credit Management
45%

Public
27 36 41
53 59 13
24 33
64
27
45 36
112
67
105 110
53
235
6m to June 2017 6m to June 2018 6m to June 2019 6m to June 2020 6m to June 2021
Recurring Revenue Carried interest Value gains (realised and unrealised)
25
Revenue (in €m)
Record level of investment and performance revenue (carry and value gains)
Merchant Banking
345%
10%
3y average HY
revenue (in €m)61 80 94 89 133
CAGR 06/17-
06/21: 37%
% recurring /
total
revenue: 25%
Public
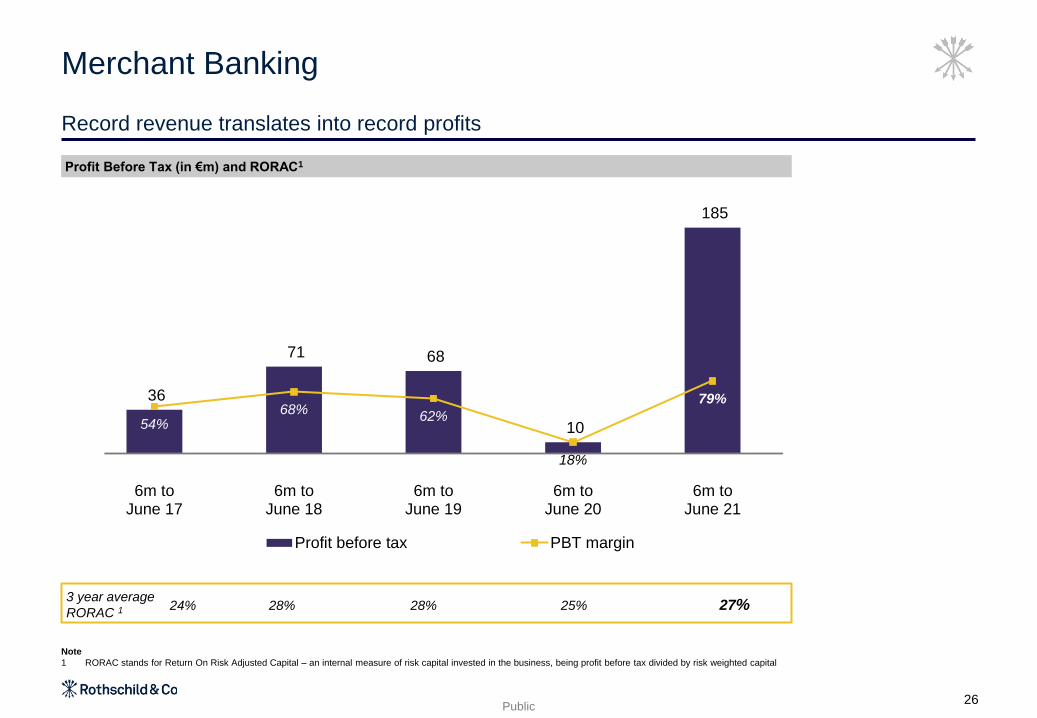
36
71 68
10
185
54%68%
62%
18%
79%
-
50.0%
100.0%
150.0%
200.0%
250.0%
(5)
45
95
145
195
6m toJune 17
6m toJune 18
6m toJune 19
6m toJune 20
6m toJune 21
Profit before tax PBT margin
Record revenue translates into record profits
Merchant Banking
Profit Before Tax (in €m) and RORAC1
Note
1 RORAC stands for Return On Risk Adjusted Capital – an internal measure of risk capital invested in the business, being profit before tax divided by risk weighted capital
3 year average
RORAC 124% 28% 28% 25% 27%
26

Public
Change in Net Asset Value (NAV) of the Group’s investment (in €m)
Record NAV driven by strong portfolio performance, partly offset by distributions
Merchant Banking
27
464
73
168 (106)
599
215
16
12 (38)
205 679
89
180
(144)
804
31/12/2020 Additions Value creation Distributions 30/06/2021
Private Equity Private Debt

Corporate responsibility
5
Public29
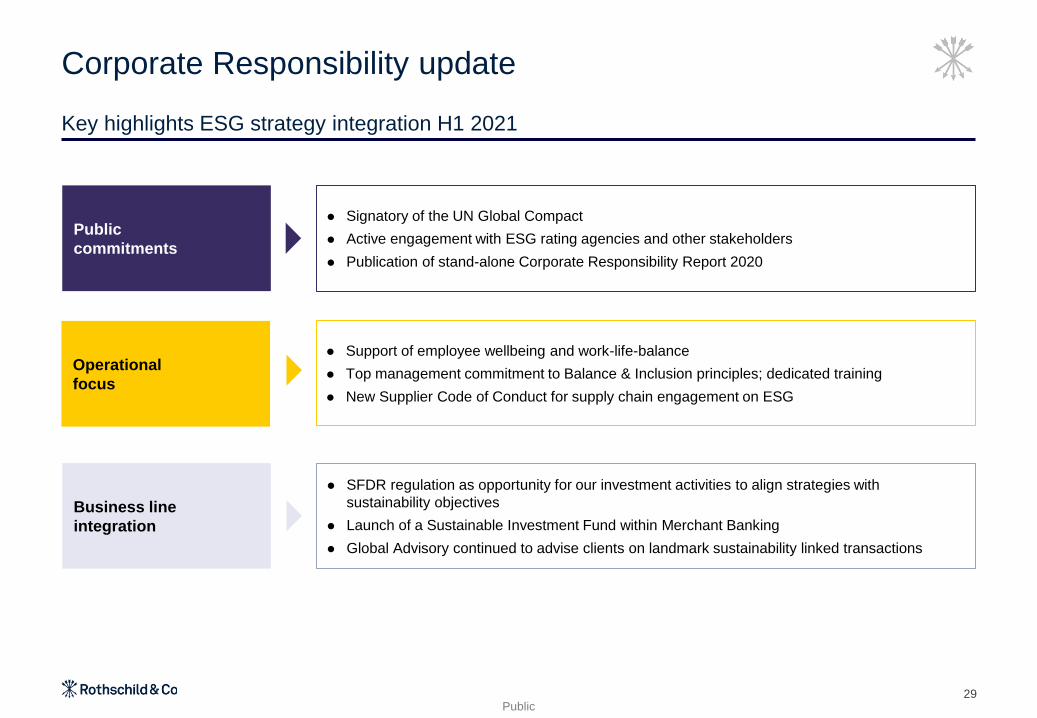
Corporate Responsibility update
Public
commitments
Operational
focus
⚫ Signatory of the UN Global Compact
⚫ Active engagement with ESG rating agencies and other stakeholders
⚫ Publication of stand-alone Corporate Responsibility Report 2020
⚫ Support of employee wellbeing and work-life-balance
⚫ Top management commitment to Balance & Inclusion principles; dedicated training
⚫ New Supplier Code of Conduct for supply chain engagement on ESG
Business line
integration
Key highlights ESG strategy integration H1 2021
⚫ SFDR regulation as opportunity for our investment activities to align strategies with
sustainability objectives
⚫ Launch of a Sustainable Investment Fund within Merchant Banking
⚫ Global Advisory continued to advise clients on landmark sustainability linked transactions

9
Financials
6
Public
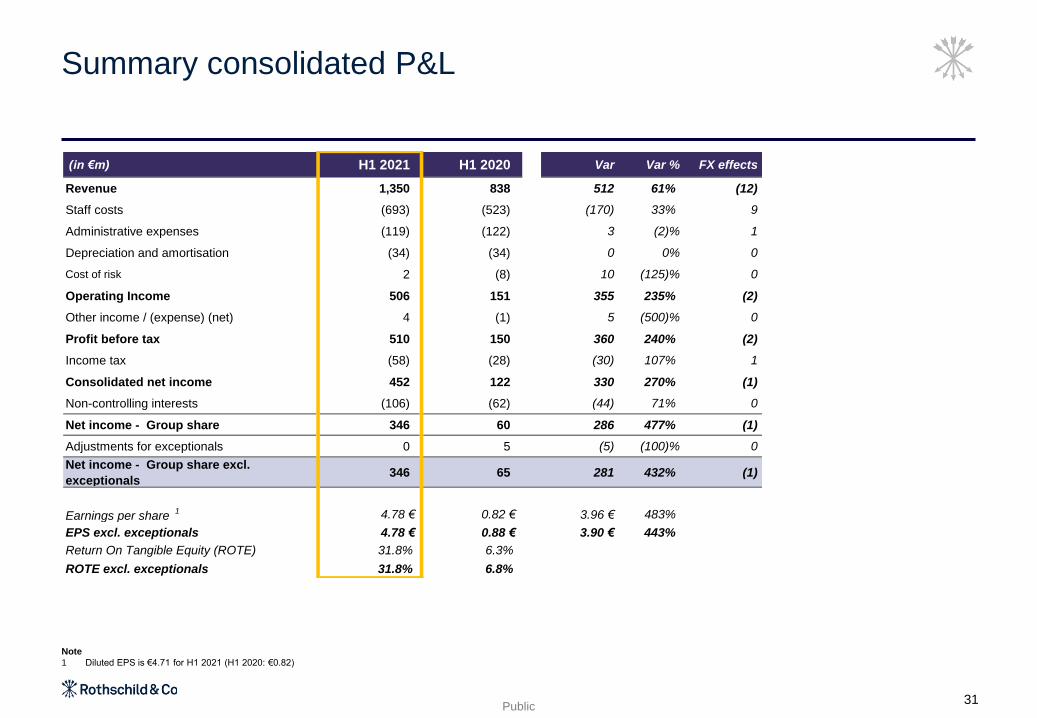
Summary consolidated P&L
Note
1 Diluted EPS is €4.71 for H1 2021 (H1 2020: €0.82)
31
(in €m) H1 2021 H1 2020 Var Var % FX effects
Revenue 1,350 838 512 61% (12)
Staff costs (693) (523) (170) 33% 9
Administrative expenses (119) (122) 3 (2)% 1
Depreciation and amortisation (34) (34) 0 0% 0
Cost of risk 2 (8) 10 (125)% 0
Operating Income 506 151 355 235% (2)
Other income / (expense) (net) 4 (1) 5 (500)% 0
Profit before tax 510 150 360 240% (2)
Income tax (58) (28) (30) 107% 1
Consolidated net income 452 122 330 270% (1)
Non-controlling interests (106) (62) (44) 71% 0
Net income - Group share 346 60 286 477% (1)
Adjustments for exceptionals 0 5 (5) (100)% 0
Net income - Group share excl.
exceptionals346 65 281 432% (1)
Earnings per share 1 4.78 € 0.82 € 3.96 € 483%
EPS excl. exceptionals 4.78 € 0.88 € 3.90 € 443%
Return On Tangible Equity (ROTE) 31.8% 6.3%
ROTE excl. exceptionals 31.8% 6.8%
Public
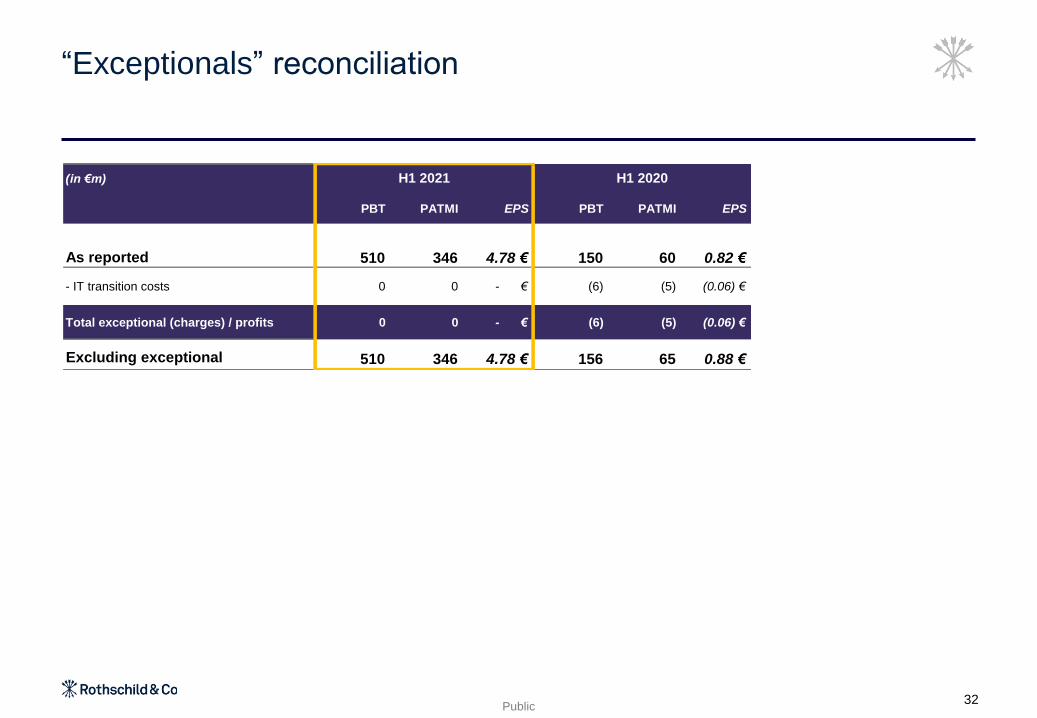
“Exceptionals” reconciliation
32
(in €m)
PBT PATMI EPS PBT PATMI EPS
As reported 510 346 4.78 € 150 60 0.82 €
- IT transition costs 0 0 - € (6) (5) (0.06) €
Total exceptional (charges) / profits 0 0 - € (6) (5) (0.06) €
Excluding exceptional 510 346 4.78 € 156 65 0.88 €
H1 2021 H1 2020
Public
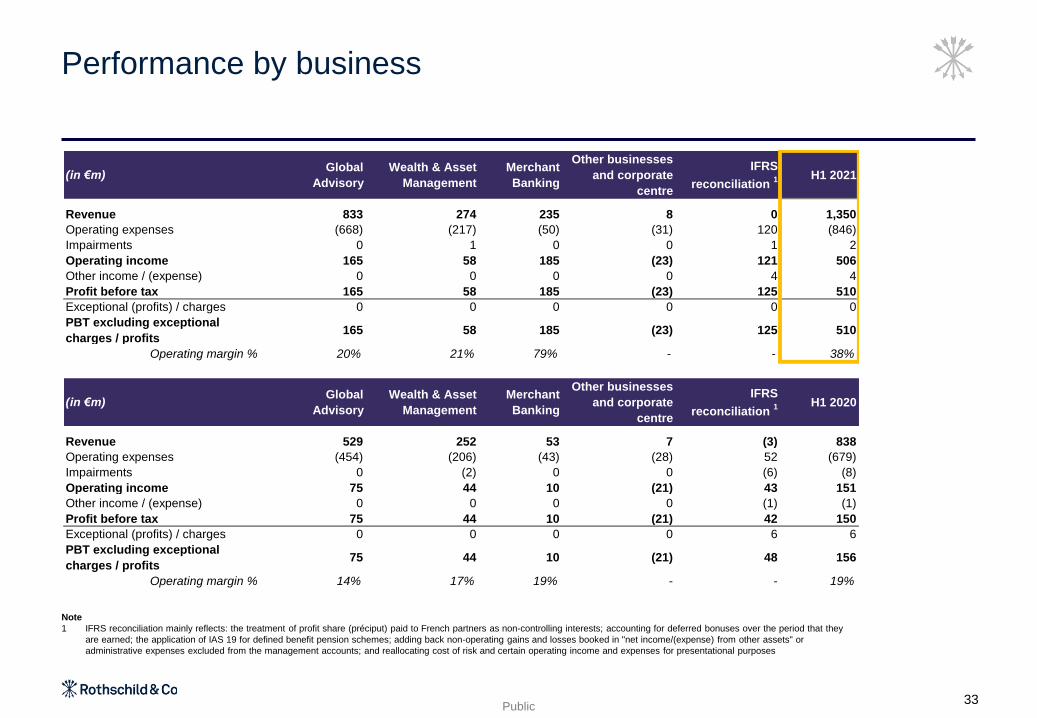
Performance by business
Note
1 IFRS reconciliation mainly reflects: the treatment of profit share (préciput) paid to French partners as non-controlling interests; accounting for deferred bonuses over the period that they
are earned; the application of IAS 19 for defined benefit pension schemes; adding back non-operating gains and losses booked in "net income/(expense) from other assets" or
administrative expenses excluded from the management accounts; and reallocating cost of risk and certain operating income and expenses for presentational purposes
33
(in €m)Global
Advisory
Wealth & Asset
Management
Merchant
Banking
Other businesses
and corporate
centre
IFRS
reconciliation 1 H1 2021
Revenue 833 274 235 8 0 1,350
Operating expenses (668) (217) (50) (31) 120 (846)
Impairments 0 1 0 0 1 2
Operating income 165 58 185 (23) 121 506
Other income / (expense) 0 0 0 0 4 4
Profit before tax 165 58 185 (23) 125 510
Exceptional (profits) / charges 0 0 0 0 0 0
PBT excluding exceptional
charges / profits165 58 185 (23) 125 510
Operating margin % 20% 21% 79% - - 38%
(in €m)Global
Advisory
Wealth & Asset
Management
Merchant
Banking
Other businesses
and corporate
centre
IFRS
reconciliation 1 H1 2020
Revenue 529 252 53 7 (3) 838
Operating expenses (454) (206) (43) (28) 52 (679)
Impairments 0 (2) 0 0 (6) (8)
Operating income 75 44 10 (21) 43 151
Other income / (expense) 0 0 0 0 (1) (1)
Profit before tax 75 44 10 (21) 42 150
Exceptional (profits) / charges 0 0 0 0 6 6
PBT excluding exceptional
charges / profits75 44 10 (21) 48 156
Operating margin % 14% 17% 19% - - 19%
Public
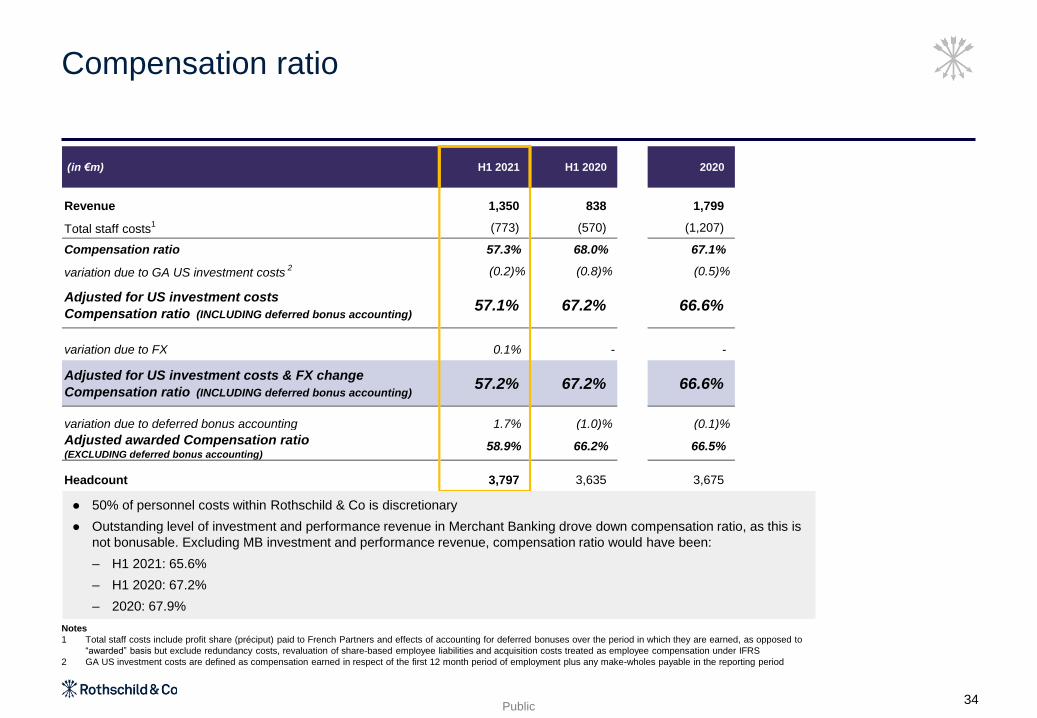
Compensation ratio
Notes
1 Total staff costs include profit share (préciput) paid to French Partners and effects of accounting for deferred bonuses over the period in which they are earned, as opposed to
“awarded” basis but exclude redundancy costs, revaluation of share-based employee liabilities and acquisition costs treated as employee compensation under IFRS
2 GA US investment costs are defined as compensation earned in respect of the first 12 month period of employment plus any make-wholes payable in the reporting period
34
⚫ 50% of personnel costs within Rothschild & Co is discretionary
⚫ Outstanding level of investment and performance revenue in Merchant Banking drove down compensation ratio, as this is
not bonusable. Excluding MB investment and performance revenue, compensation ratio would have been:
– H1 2021: 65.6%
– H1 2020: 67.2%
– 2020: 67.9%
(in €m) H1 2021 H1 2020 2020
Revenue 1,350 838 1,799
Total staff costs1 (773) (570) (1,207)
Compensation ratio 57.3% 68.0% 67.1%
variation due to GA US investment costs2 (0.2)% (0.8)% (0.5)%
Adjusted for US investment costs
Compensation ratio (INCLUDING deferred bonus accounting)57.1% 67.2% 66.6%
variation due to FX 0.1% - -
Adjusted for US investment costs & FX change
Compensation ratio (INCLUDING deferred bonus accounting)57.2% 67.2% 66.6%
variation due to deferred bonus accounting 1.7% (1.0)% (0.1)%
Adjusted awarded Compensation ratio (EXCLUDING deferred bonus accounting)
58.9% 66.2% 66.5%
Headcount 3,797 3,635 3,675

Public
20.1%21.3%
31 Dec 2020 30 June 2021
Capital ratio min: 10.5%
CET 1 with buffer min: 7%
Global solvency ratio1Risk weighted assets (in €m)
Risk weighted assets and ratios under full application of Basel 3 rules
Solvency ratios comfortably above minimum requirements
35
Note
1 The ratio submitted to ACPR as at 30 June 2021 was 19.0%, which excludes the profit of the first half of the year as non-audited at the time of the submission
⚫ Ratio improved from December 2020 to June 2021 to 21.3% due to:
– Strong growth in capital reflecting H1 2021 profit, positive reserve movements on pensions and FX, partially offset
by €35m share buyback
– Increase of RWA, mainly reflecting credit risk relating to Merchant Banking value accretion and increase of private
client lending
⚫ Acquisition of Banque Pâris Bertrand in July reduces Rothschild & Co’s CET 1 ratio by around 1%
5,5916,364
331
373
3,279
3,278
9,20110,015
31 Dec 2020 30 June 2021
Credit risk Market risk Operational risk

Public
Summary Balance sheet
36
30/06/2021 31/12/2020
Loans / Deposits 38% 35%
Liquid assets / Total assets 57% 59%
Net book value / share €37.31 €31.90
Net tangible book value /
share€32.98 €27.67
(in €bn) 30/06/2021 31/12/2020 Var
Banks 13.0 12.3 0.7
Credit exposures 3.9 3.5 0.4
o/w Private client lending (PCL) 3.6 3.1 0.5
Cash and treasury assets 8.0 7.9 0.1 o/w amounts deposited by non-bank Group
subsidiaries 0.4 0.4 0.0
Other current and non-current assets 1.1 0.9 0.2
Non-Banks 2.6 2.4 0.2
Merchant Banking investments 0.8 0.7 0.1
Cash and treasury assets 0.9 0.8 0.1
o/w central Group 0.5 0.6 (0.1)
Other current and non-current assets 0.9 0.9 0.0
Total assets 15.6 14.7 0.9
Banks 12.0 11.3 0.7
Due to customers 10.4 9.9 0.5
Due to banks 0.3 0.3 0.0
Other current and non-current liabilities 1.3 1.1 0.2
Non-Banks 0.5 0.7 (0.2)
Long term borrowing - central Group 0.2 0.2 0.0
Other current and non-current liabilities 0.3 0.5 (0.2)
Capital 3.1 2.7 0.4
Shareholders' equity - Group share 2.7 2.3 0.4
Non-controlling interests 0.4 0.4 0.0
Total capital and liabilities 15.6 14.7 0.9

Targets and outlook
7

Public
Our financial targets
Group
targets
Businesses
targets
Target
Mid to high-teens
through the cycle
Around 18%4
by 2022
Above 15%
through the cycle
Global Advisory:
Profit before tax margin3
Wealth & Asset Management:
Profit before tax margin4
Merchant Banking:
3 years average RORAC5
H1
2020
15%
17.5%
25%
H1
2021
20%
22.0%
27%
Low to mid 60’s
through the cycleCompensation
ratio1 67.2%57.2%
10 to 15%
through the cycleReturn on
tangible equity2 6.8%31.8%
Notes
1 As adjusted including deferred bonus accounting– see slide 34
2 ROTE based on Net income – Group share excl. exceptionals items. See definition on slide 45 and calculation on slide 47
3 GA PBT margin pre-US investments. Would be 19.8% if US investments included (H1 2020: 14.1%)
4 Excluding AM US
5 See definition on slide 45 and calculation on slide 47
38
2020
16%
15.6%
20%
66.6%
8.8%

Public
€0.70
€0.85
€0.19
€0.19€0.85
€0.89
€1.04
2019(not paid)
2020 (restricted to €0.70)
Special interimpayment
in 10/2021
Chart Title
39
⚫ Considering the strong 2021 performance, intention to
launch a share buyback programme of an amount up to
€70 million over a 12-month period, subject to ACPR
approval (and assuming no material adverse
developments)
⚫ These buyback shares will be used either to meet
requirements under the equity schemes and share based
remuneration plans of Rothschild & Co up to 1% or will be
cancelled.
⚫ This is in addition to the €35m buyback undertaken in
June 2021
Share buyback
⚫ Exceptional interim dividend in October 2021 of €1.04
per share to compensate for the difference between
the dividend actually paid in respect of 2019 and 2020
and the dividend that would have been paid in
accordance with our distribution policy, subject to the
lifting of regulatory restrictions
Dividend
Dividend and return of capital

Public40
Outlook
Merchant
Banking
Global Advisory
Wealth & Asset
Management
⚫ Our visible pipeline of business is well diversified and significantly ahead of previous years
⚫ Expect activity levels to remain strong through the remainder of 2021
⚫ Remain very positive regarding the performance outlook for our business in 2021
⚫ Positive outlook thanks to strong new business pipeline, combined with higher than budgeted AuM at the end
of June
⚫ No expected changes in interest rates in near future
⚫ Expect to continue to grow recurring revenue base and generate further investment and performance
revenue, albeit much lower level in H2 versus H1 2021
⚫ Investments should continue to show resilience and accelerate their value creation trajectory
⚫ Portfolios and resulting NAV should continue to perform
Group
⚫ Current macro environment still positive for our three core businesses
⚫ Optimistic for a strong performance for the rest of the year thanks to clear strategies of each business line, if
current momentum and market conditions persist

8
Appendices
Public
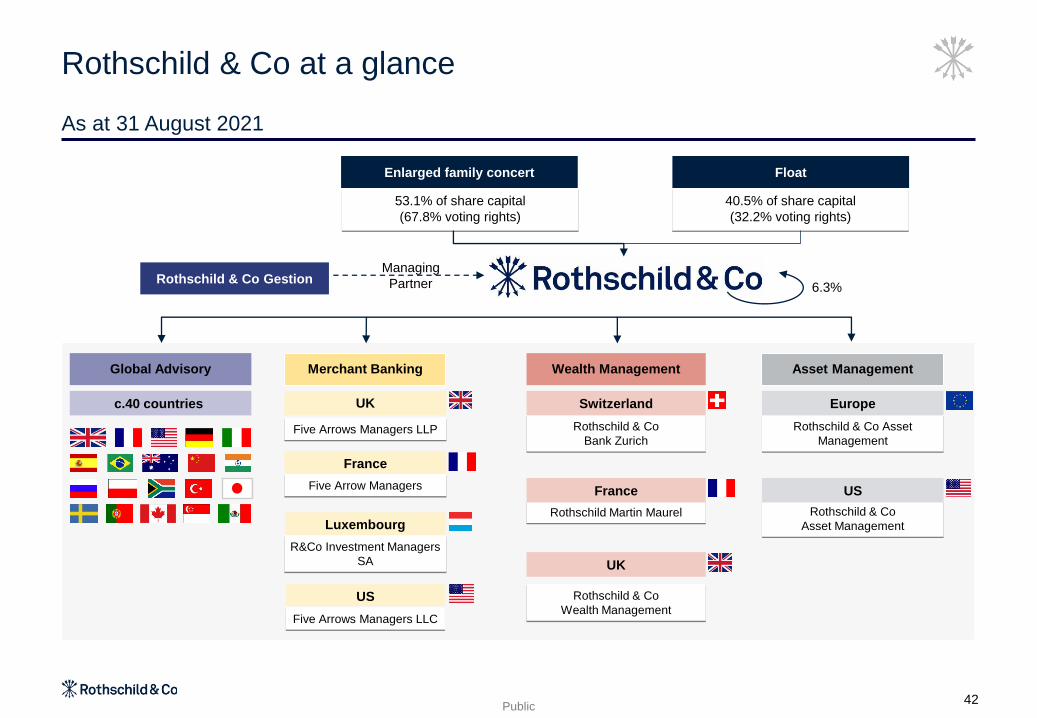
Rothschild & Co at a glance
As at 31 August 2021
42
Five Arrows Managers LLP
53.1% of share capital
(67.8% voting rights)
Enlarged family concert
40.5% of share capital
(32.2% voting rights)
Rothschild & Co GestionManaging
Partner 6.3%
Global Advisory
c.40 countries
Merchant Banking
Luxembourg
R&Co Investment Managers
SA
France
Five Arrow Managers
UK
Float
Five Arrows Managers LLC
US
Rothschild & Co
Bank Zurich
Switzerland
Asset ManagementWealth Management
Rothschild Martin Maurel
France
Rothschild & Co
Wealth Management
UK
Rothschild & Co Asset
Management
Europe
Rothschild & Co
Asset Management
US
Public
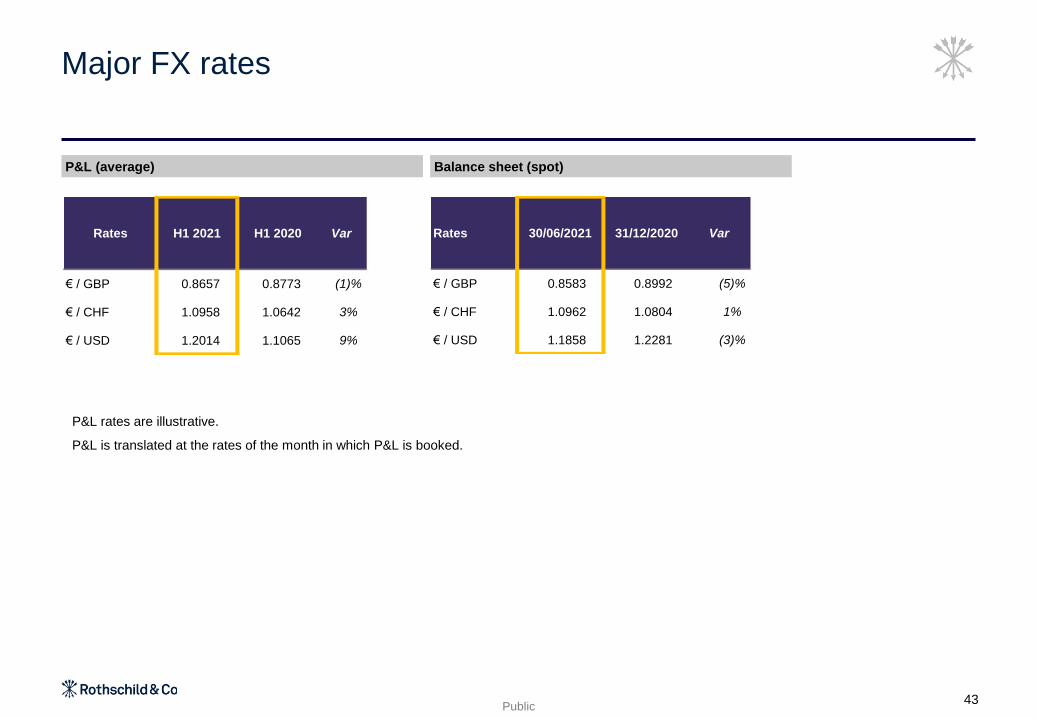
Balance sheet (spot)P&L (average)
Major FX rates
43
Rates H1 2021 H1 2020 Var
€ / GBP 0.8657 0.8773 (1)%
€ / CHF 1.0958 1.0642 3%
€ / USD 1.2014 1.1065 9%
Rates 30/06/2021 31/12/2020 Var
€ / GBP 0.8583 0.8992 (5)%
€ / CHF 1.0962 1.0804 1%
€ / USD 1.1858 1.2281 (3)%
P&L rates are illustrative.
P&L is translated at the rates of the month in which P&L is booked.
Public
Balance sheetP&L
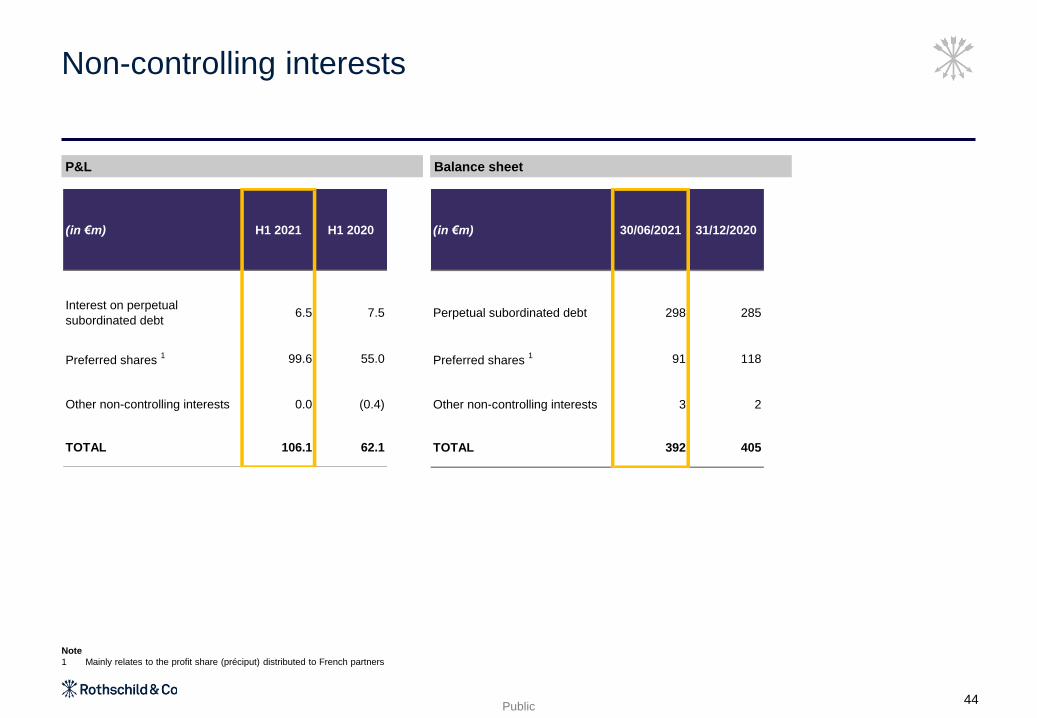
Non-controlling interests
Note
1 Mainly relates to the profit share (préciput) distributed to French partners
44
(in €m) H1 2021 H1 2020
Interest on perpetual
subordinated debt6.5 7.5
Preferred shares 1 99.6 55.0
Other non-controlling interests 0.0 (0.4)
TOTAL 106.1 62.1
(in €m) 30/06/2021 31/12/2020
Perpetual subordinated debt 298 285
Preferred shares 1 91 118
Other non-controlling interests 3 2
TOTAL 392 405
Public
Alternative performance measures (APM)
45
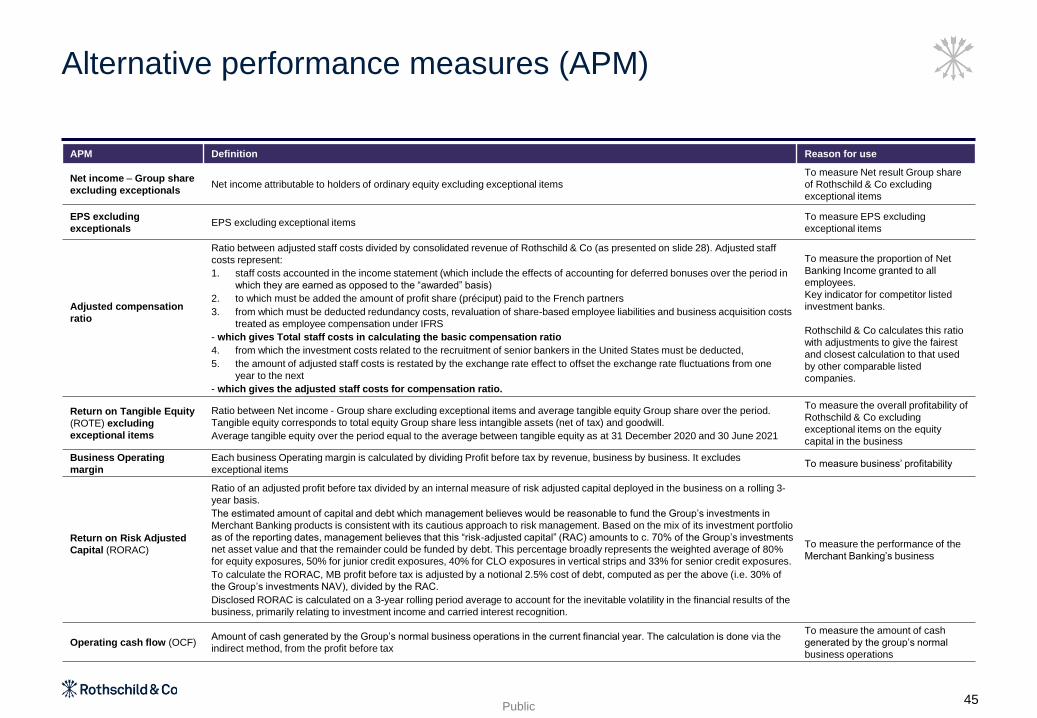
APM Definition Reason for use
Net income – Group share
excluding exceptionalsNet income attributable to holders of ordinary equity excluding exceptional items
To measure Net result Group share
of Rothschild & Co excluding
exceptional items
EPS excluding
exceptionalsEPS excluding exceptional items
To measure EPS excluding
exceptional items
Adjusted compensation
ratio
Ratio between adjusted staff costs divided by consolidated revenue of Rothschild & Co (as presented on slide 28). Adjusted staff
costs represent:
1. staff costs accounted in the income statement (which include the effects of accounting for deferred bonuses over the period in
which they are earned as opposed to the “awarded” basis)
2. to which must be added the amount of profit share (préciput) paid to the French partners
3. from which must be deducted redundancy costs, revaluation of share-based employee liabilities and business acquisition costs
treated as employee compensation under IFRS
- which gives Total staff costs in calculating the basic compensation ratio
4. from which the investment costs related to the recruitment of senior bankers in the United States must be deducted,
5. the amount of adjusted staff costs is restated by the exchange rate effect to offset the exchange rate fluctuations from one
year to the next
- which gives the adjusted staff costs for compensation ratio.
To measure the proportion of Net
Banking Income granted to all
employees.
Key indicator for competitor listed
investment banks.
Rothschild & Co calculates this ratio
with adjustments to give the fairest
and closest calculation to that used
by other comparable listed
companies.
Return on Tangible Equity
(ROTE) excluding
exceptional items
Ratio between Net income - Group share excluding exceptional items and average tangible equity Group share over the period.
Tangible equity corresponds to total equity Group share less intangible assets (net of tax) and goodwill.
Average tangible equity over the period equal to the average between tangible equity as at 31 December 2020 and 30 June 2021
To measure the overall profitability of
Rothschild & Co excluding
exceptional items on the equity
capital in the business
Business Operating
margin
Each business Operating margin is calculated by dividing Profit before tax by revenue, business by business. It excludes
exceptional itemsTo measure business’ profitability
Return on Risk Adjusted
Capital (RORAC)
Ratio of an adjusted profit before tax divided by an internal measure of risk adjusted capital deployed in the business on a rolling 3-
year basis.
The estimated amount of capital and debt which management believes would be reasonable to fund the Group’s investments in
Merchant Banking products is consistent with its cautious approach to risk management. Based on the mix of its investment portfolio
as of the reporting dates, management believes that this “risk-adjusted capital” (RAC) amounts to c. 70% of the Group’s investments
net asset value and that the remainder could be funded by debt. This percentage broadly represents the weighted average of 80%
for equity exposures, 50% for junior credit exposures, 40% for CLO exposures in vertical strips and 33% for senior credit exposures.
To calculate the RORAC, MB profit before tax is adjusted by a notional 2.5% cost of debt, computed as per the above (i.e. 30% of
the Group’s investments NAV), divided by the RAC.
Disclosed RORAC is calculated on a 3-year rolling period average to account for the inevitable volatility in the financial results of the
business, primarily relating to investment income and carried interest recognition.
To measure the performance of the
Merchant Banking’s business
Operating cash flow (OCF)Amount of cash generated by the Group’s normal business operations in the current financial year. The calculation is done via the
indirect method, from the profit before tax
To measure the amount of cash
generated by the group’s normal
business operations
Public46
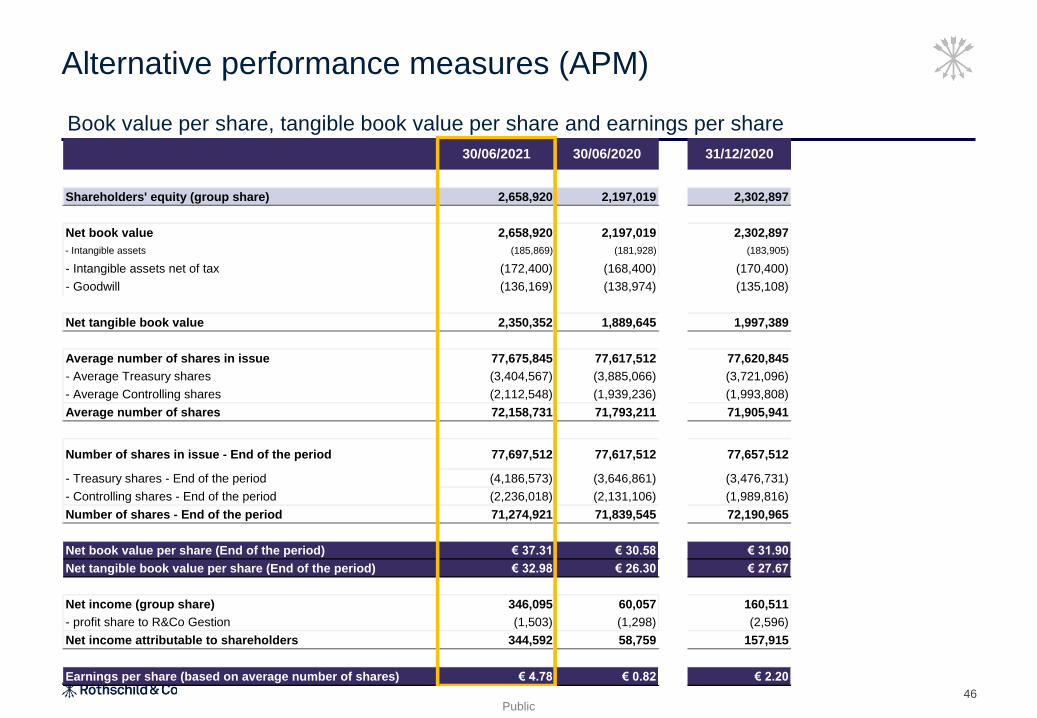
Alternative performance measures (APM)
Book value per share, tangible book value per share and earnings per share
30/06/2021 30/06/2020 31/12/2020
Shareholders' equity (group share) 2,658,920 2,197,019 2,302,897
Net book value 2,658,920 2,197,019 2,302,897
- Intangible assets (185,869) (181,928) (183,905)
- Intangible assets net of tax (172,400) (168,400) (170,400)
- Goodwill (136,169) (138,974) (135,108)
Net tangible book value 2,350,352 1,889,645 1,997,389
Average number of shares in issue 77,675,845 77,617,512 77,620,845
- Average Treasury shares (3,404,567) (3,885,066) (3,721,096)
- Average Controlling shares (2,112,548) (1,939,236) (1,993,808)
Average number of shares 72,158,731 71,793,211 71,905,941
Number of shares in issue - End of the period 77,697,512 77,617,512 77,657,512
- Treasury shares - End of the period (4,186,573) (3,646,861) (3,476,731)
- Controlling shares - End of the period (2,236,018) (2,131,106) (1,989,816)
Number of shares - End of the period 71,274,921 71,839,545 72,190,965
Net book value per share (End of the period) € 37.31 € 30.58 € 31.90
Net tangible book value per share (End of the period) € 32.98 € 26.30 € 27.67
Net income (group share) 346,095 60,057 160,511
- profit share to R&Co Gestion (1,503) (1,298) (2,596)
Net income attributable to shareholders 344,592 58,759 157,915
Earnings per share (based on average number of shares) € 4.78 € 0.82 € 2.20
Public
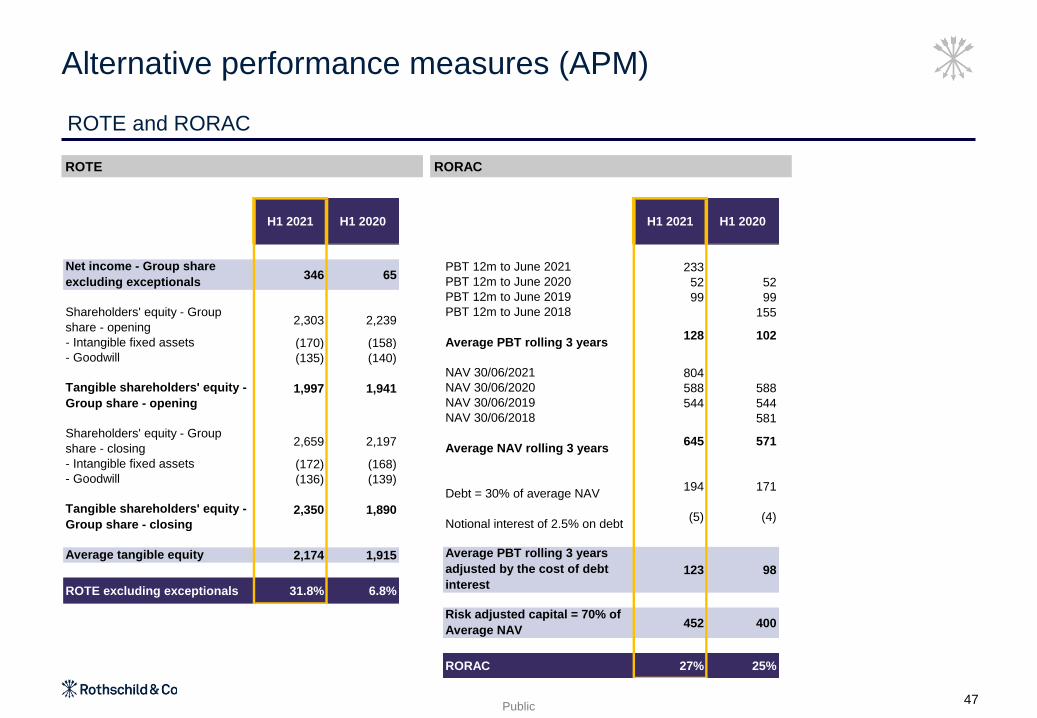
RORACROTE
ROTE and RORAC
Alternative performance measures (APM)
47
H1 2021 H1 2020
Net income - Group share
excluding exceptionals346 65
Shareholders' equity - Group
share - opening2,303 2,239
- Intangible fixed assets (170) (158)
- Goodwill (135) (140)
Tangible shareholders' equity -
Group share - opening
1,997 1,941
Shareholders' equity - Group
share - closing2,659 2,197
- Intangible fixed assets (172) (168)
- Goodwill (136) (139)
Tangible shareholders' equity -
Group share - closing
2,350 1,890
Average tangible equity 2,174 1,915
ROTE excluding exceptionals 31.8% 6.8%
H1 2021 H1 2020
PBT 12m to June 2021 233
PBT 12m to June 2020 52 52
PBT 12m to June 2019 99 99
PBT 12m to June 2018 155
Average PBT rolling 3 years128 102
NAV 30/06/2021 804
NAV 30/06/2020 588 588
NAV 30/06/2019 544 544
NAV 30/06/2018 581
Average NAV rolling 3 years645 571
Debt = 30% of average NAV194 171
Notional interest of 2.5% on debt (5) (4)
Average PBT rolling 3 years
adjusted by the cost of debt
interest
123 98
Risk adjusted capital = 70% of
Average NAV452 400
RORAC 27% 25%

Public48
Operating cash flow
Alternative performance measures (APM)
Notes
1 Includes payment in respect of French profit share (préciput), rental payments, movement in working capital and interest on perpetual debts
2 Excluding cash inflow/(outflow) from treasury assets
3 Excluding MB investing activities, PPE and intangibles (acquisition)/disposal disclosed in operating activities
The cash flows shown in this document are
prepared on an operating business basis to
give a better understanding of the cash
generation of the activities of the group
whereas for the statutory accounts the cash
flows are shown on a ‘’cash usage’’ basis.
This means that the main differences of
treatment and classification between the
cash flows shown here and those in the
statutory cash flow statement are:
• Cash and treasury assets include all
liquid assets held at FVTPL and at
amortised cost, the entire loans and
advances to banks and to central banks
but exclude the amounts due to banks
on demand.
• For the statutory cash flow the focus is
on pure cash assets less any amounts
‘’due to banks on demand’’ which is a
much narrower definition of cash. In
addition to resulting in a different
movement in cash, these definition
differences impact the treasury activities
and the exchange rates lines
H1 2021 H1 2020 H1 2019
Consolidated Profit before tax 510 150 234
Non cash items (155) 34 (61)
Profit before tax and non cash items 355 184 173
Acquisition of MB investments (89) (25) (59)
Distribution of MB investments 144 54 71
Net (acquisition)/disposal of PPE and intangible assets (10) (12) 36
Tax paid (54) (31) (20)
Net cash inflow/(outflow) relating to other operating activities 1 (241) (348) (349)
Operating cash flow (OCF) 105 (178) (148)
Net (advance)/repayment of loans to customers (466) (78) (147)
Net cash inflow/(outflow) related to treasury activities 2 555 309 851
Net cash inflow/(outflow) related to investing activities 3 (1) (5) (33)
Net cash inflow/(outflow) related to financing activities (86) (2) (80)
Impact of exchange rate changes on cash and treasury assets 84 (132) 35
Net inflow/(outflow) of cash and treasury assets 191 (86) 478
Treasury assets cash inflow/(outflow) (109) (367) (37)
Impact of exchange rate on treasury asset (6) 30 (2)
Interbank demand deposits and overnight loans 39 60 127
Net inflow/(outflow) of cash disclosed in consolidated accounts 115 (363) 566

Public1
This presentation has been prepared solely for information purposes and must not be construed as or
considered as constituting or giving any investment advice. It does not take into account, in any way whatsoever,
the investment objectives, financial situation or specific needs of its recipients.
This presentation and its contents may not be copied or disseminated, in part or as a whole, without prior written
consent of Rothschild & Co.
This presentation may contain forward-looking information and statements pertaining to Rothschild & Co SCA
(“Rothschild & Co”), its subsidiaries (together, the “Rothschild & Co Group”) and its and their results. Forward-
looking information is not historical. It reflects objectives that are based on management’s current expectations or
estimates and is subject to a number of factors and uncertainties, that could cause actual figures to differ
materially from those described in the forward-looking statements including those discussed or identified in the
documentation publicly released by Rothschild & Co, including its annual report.
Rothschild & Co does not undertake to update such forward-looking information and statements unless required
by applicable laws and regulations. Subject to the foregoing, Rothschild & Co has no obligation to update or
amend such information and statements, neither as a result of new information or statements, nor as a result of
new events or for any other reason.
No representation or warranty whatsoever, express or implied, is made as to the accuracy, completeness,
consistency or the reliability of the information contained in this document. It may not be considered by its
recipients as a substitute to their judgment.
This presentation does not constitute an offer to sell or a solicitation to buy any securities.
This presentation is qualified in its entirety by the information contained in Rothschild & Co’ financial statements,
the notes thereto and the related half-year financial report. In case of a conflict, such financial statements, notes
and financial reports must prevail. Only the information contained therein is binding on Rothschild & Co and the
Rothschild & Co Group. If the information contained herein is presented differently from the information contained
in such financial statements, notes and reports, only the latter is binding on Rothschild & Co and the Rothschild
& Co Group.
For more information on Rothschild & Co: www.rothschildandco.com
Disclaimer
49