results for the six months ended 30 june 2021
TRANSCRIPT

Results for the six months
ended 30 June 2021

REVENUEFrom R1 590m to R1 784m
12%EBITDA
From R466m to R390m
16%HEPS
From 37.9 cents to 19.4 cents
49%
HIGHLIGHTS FOR THE SIX MONTHS ENDED 30 JUNE 2021
‘No brain, no gain. Stay in school.’
– Michael Jordan
#Learners2Leaders – Curro Academy Wilgeheuwel
Please note that some images used in this document were taken prior to the COVID-19 pandemic.
AVERAGE LEARNER NUMBERS
From 61 746 to 66 167
7%CASH GENERATED FROM OPERATING ACTIVITIES
From R355m to R525m
48%
RECURRING HEPSFrom 39.7 cents to 19.4 cents
51%Results for the six months ended 30 June 2021 32 Results for the six months ended 30 June 2021

OverviewThe COVID-19 pandemic continued to disrupt our lives and the economy in 2021. Schools in particular have been significantly affected by the pandemic.
Despite this, our staff, learners and the communities we serve maintained their tenacious focus on education, and Curro is proud of the learner number growth achieved, as well as the strategic progress made by the business over the last six months.
Results for the six monthsCurro had 66 366 learners enrolled at 30 June 2021, representing a 9.2% increase on the 60 777 average number of learners enrolled for the 2020 year.
Curro’s average learner numbers for the first half increased by 7.2% to 66 167 learners (2020: 61 746 average number of learners) and revenue increased by 12.2% to R1 784 million (2020: R1 590 million) for the period.
Tuition fees increased by 9.8% from the corresponding prior period, due to the growth in learners, coupled with the annual inflationary fee increase. Revenue growth was weighed down by lower ancillary school income, which was R8 million less than the first half of 2020.
Curro granted non-recurring discount relief of R60 million to its clients in the comparable period due to COVID-19. If this discount is excluded, discounts granted increased marginally to 9.1% of tuition fees from 8.8% in the comparable period.
Expected credit losses of R62 million were provided for during this period (2020: R82 million). The nonperforming portion of the debtors book mainly relates to learners who have left Curro and concerted efforts are being made to recover same. The quality and ageing of outstanding accounts for enrolled learners improved during the first half of this year.
Schools’ EBITDA (earnings before interest, taxation, depreciation, amortisation and head office expenditure) decreased by 6.8% to R509 million for the period, while EBITDA (after head office expenditure) declined by 16.3% to R390 million (2020: R466 million).
Headline earnings and headline earnings per share (‘HEPS’) decreased by 27.5% from R160 million to R116 million and by 48.8% from 37.9 cents to 19.4 cents, respectively.
Recurring headline earnings and recurring headline earnings per share (‘RHEPS’) decreased by 30.5% to R116 million (2020: R167 million) and by 51.1% to 19.4 cents (2020: 39.7 cents), respectively.
Earnings per share (‘EPS’) of 21.7 cents for the first half of this year was slightly lower than the 22.0 cents in the comparable period.
In evaluating these results, shareholders should take the following matters into account:
• The R1.5 billion rights issue in September 2020 resulted in there being 42% more weighted average shares in issue in the first half of 2021 compared to the first half of last year, which reduce the respective earnings per share figures meaningfully. The company now has 597 961 595 shares issued, compared to 412 087 989 shares at the end of the previous comparable period.
• Curro’s earnings for the previous financial year ended 31 December 2020 were significantly weighted toward the first half of 2020. As a result, R167 million or 93.3% of the total recurring headline earnings for 2020 of R179 million, was recorded in the first half of the 2020 year.
Schools were closed for three months pursuant to the COVID-19 induced lockdown with concomitant cost savings and TERS payments received in the first half of 2020, but were fully operational in the second half of 2020 and in 2021. The quantum and timing of impairment charges, fee discounts granted, provisions for expected credit losses and significant increases in municipal charges also impacted more on the second half of 2020.
We expect a more balanced distribution of earnings across the 2021 financial year.
| COMMENTARY
‘Believe you can and you’re halfway there.’
– Theodore Roosevelt
#Learners2Leaders – Curro Delft
Results for the six months ended 30 June 2021 54 Results for the six months ended 30 June 2021
#Learners2Leaders – Curro Delft
• Due to the ongoing lockdown restrictions, Curro’s ancillary revenue is lower than the comparable periodin 2020, as well as the first half of 2019. The levels of bad debt and fee discounts granted were also higherduring the first half of 2020 than what the company experienced historically before the pandemic.
• Net finance cost in the first half of 2021 reduced by R44 million to R91 million (2020: R135 million) as aresult of the reduction in debt following the rights issue.
• Curro recognised impairments of lower-yielding schools of R83 million (net of tax) in the previous comparableperiod. These impairment charges are included in the calculation of EPS but are added back for purposes ofthe calculation of HEPS, and accordingly accounts for the key difference between HEPS and EPS in 2020.
• HEPS for the previous corresponding period included a non-recurring acquisition cost of R7 million (net oftax), which represents the difference between RHEPS and HEPS in that period.
Investments and expansionCurro invested a further R374 million in the business during the period under review, mainly to complete projects already started in 2020 to expand capacity and on the construction of the new Curro Durbanville high school. The primary objective for Curro remains to increase capacity utilisation of its existing facilities.
Other investing activities of R19 million in the statement of cash flows represent the net increase on money market investments (2020: R171 million withdrawal).
The acquisition of Heronbridge College remains subject to approval by the Competition Commission, and we are on track with our overall capex programme to invest up to R1.1 billion in the business this year.
Balance sheet and fundingCurro generated R525 million of cash from its operating activities, 48% higher than the first half of the previous year.
The company repaid a term loan with a high interest cost at the end of this period and will introduce more flexible revolving credit facilities in the second half of this year.
During June 2021, GCR Ratings reaffirmed Curro’s long-term and short-term national scale issuer credit ratings of BBB+(ZA) and A2(ZA), respectively, with a stable outlook.
Pursuant to the uncertainties brought about by the ongoing COVID-19 pandemic and in light of the recent rights issue concluded, the board has resolved to not pay a dividend in respect of the period under review in order to preserve cash and to deliberately use capital to fund Curro’s further expansion and growth prospects. The board will re-evaluate Curro’s dividend policy at the end of this year.
ProspectsThe ongoing COVID-19 pandemic and its associated impact on the economy and our business remain unpredictable. Curro is in a healthy financial position following the R1.5 billion rights issue concluded during 2020. The strong learner growth recorded this year endorses the credibility of our robust product offering.
True to Curro’s entrepreneurial spirit, management is constantly innovating with improvements in the business, including an increased focus on the development of digital education solutions. We remain committed to continue providing excellent education to all our learners, thereby making a positive contribution to society at large.
On behalf of the board
SL Botha AJF GreylingChairperson Chief Executive Officer
18 August 2021
Results for the six months ended 30 June 2021 76 Results for the six months ended 30 June 2021

KEY RATIOS31 Dec 2018 31 Dec 2019 31 Dec 2020 30 June 2021
Number of campuses 58 70 76 76
Number of schools 139 166 177 178
Average number of learners 51 305 57 597 60 777 66 167
Average number of learners per campus 885 823 800 871
Number of employees 5 628 6 076 5 963 6 308
Number of teachers 2 945 3 230 3 425 3 639
Learner/teacher ratio 17 18 18 18
Building size (m2) 656 081 700 946 713 084 745 554
Land size (ha) 514 536 536 549
Capital invested (R million) 1 373 1 246* 650 374
– Existing campuses (R million) 590 910 635 241
New 549 878 602 215
Replacement 41 32 33 26
– New campuses (R million) 534 209 12 132
– Acquisitions (R million) 369 127 3 1
– Stadio (R million) (120) – – –
* Figure adjusted from R1 285 million previously reported to exclude the other investing activities.
| STATISTICS
#Learners2Leaders – Curro Foreshore
#Learners2Leaders – Curro Rivonia
Curro offers an innovative and relevant
curriculum in an
environment that is ethical,
balanced, values-based and learner-
centred.
Results for the six months ended 30 June 2021 98 Results for the six months ended 30 June 2021
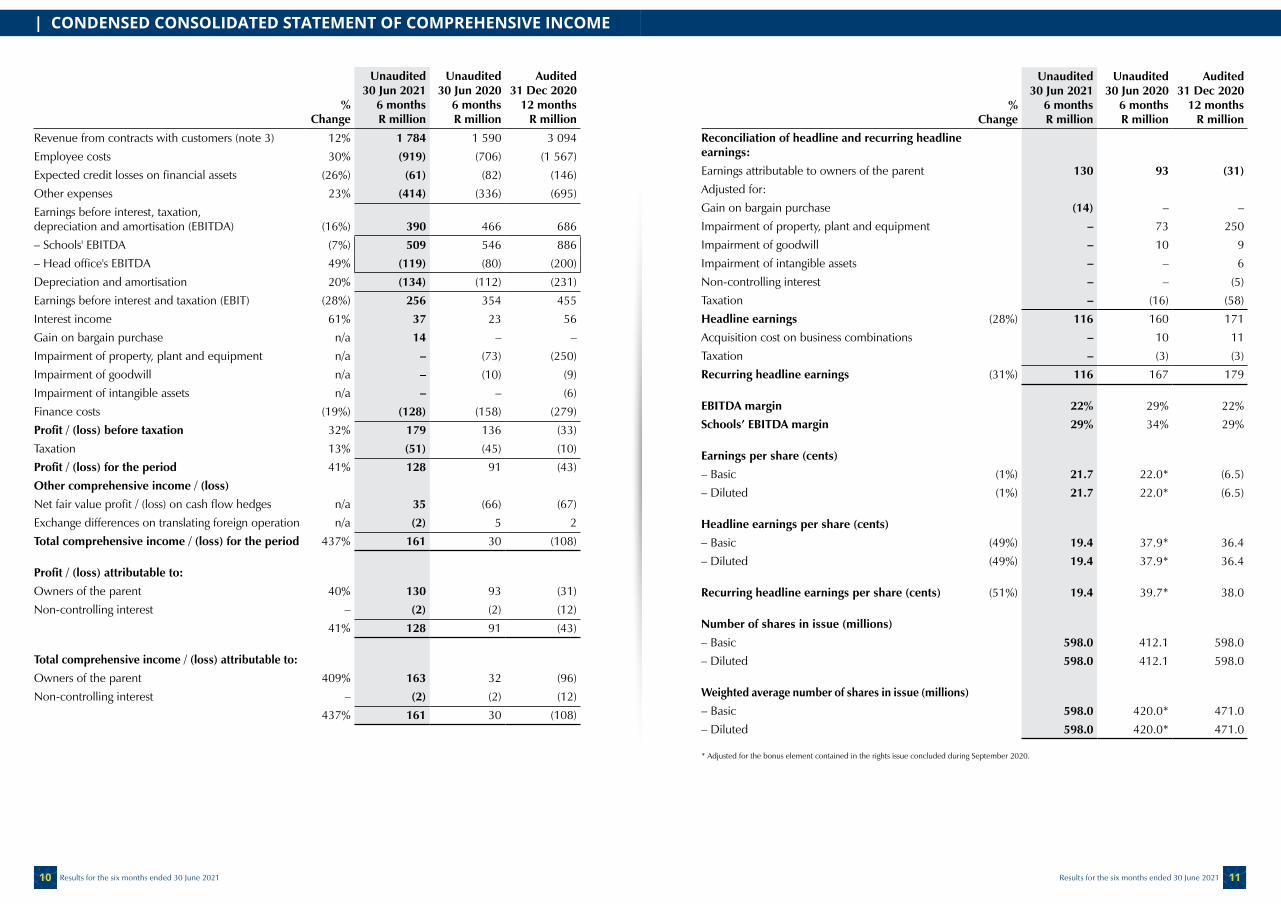
| CONDENSED CONSOLIDATED STATEMENT OF COMPREHENSIVE INCOME
%
Change
Unaudited30 Jun 2021
6 monthsR million
Unaudited30 Jun 2020
6 monthsR million
Audited31 Dec 2020
12 monthsR million
Revenue from contracts with customers (note 3) 12% 1 784 1 590 3 094Employee costs 30% (919) (706) (1 567)Expected credit losses on financial assets (26%) (61) (82) (146)Other expenses 23% (414) (336) (695)Earnings before interest, taxation, depreciation and amortisation (EBITDA) (16%) 390 466 686– Schools' EBITDA (7%) 509 546 886– Head office's EBITDA 49% (119) (80) (200)Depreciation and amortisation 20% (134) (112) (231)Earnings before interest and taxation (EBIT) (28%) 256 354 455Interest income 61% 37 23 56Gain on bargain purchase n/a 14 – –Impairment of property, plant and equipment n/a – (73) (250)Impairment of goodwill n/a – (10) (9)Impairment of intangible assets n/a – – (6)Finance costs (19%) (128) (158) (279)Profit / (loss) before taxation 32% 179 136 (33)Taxation 13% (51) (45) (10)Profit / (loss) for the period 41% 128 91 (43)Other comprehensive income / (loss)
Net fair value profit / (loss) on cash flow hedges n/a 35 (66) (67)Exchange differences on translating foreign operation n/a (2) 5 2Total comprehensive income / (loss) for the period 437% 161 30 (108) Profit / (loss) attributable to:
Owners of the parent 40% 130 93 (31)Non-controlling interest – (2) (2) (12)
41% 128 91 (43) Total comprehensive income / (loss) attributable to:
Owners of the parent 409% 163 32 (96)Non-controlling interest – (2) (2) (12)
437% 161 30 (108)
%
Change
Unaudited30 Jun 2021
6 monthsR million
Unaudited30 Jun 2020
6 monthsR million
Audited31 Dec 2020
12 monthsR million
Reconciliation of headline and recurring headline earnings:
Earnings attributable to owners of the parent 130 93 (31)
Adjusted for:
Gain on bargain purchase (14) – –Impairment of property, plant and equipment – 73 250Impairment of goodwill – 10 9Impairment of intangible assets – – 6Non-controlling interest – – (5)Taxation – (16) (58)Headline earnings (28%) 116 160 171Acquisition cost on business combinations – 10 11Taxation – (3) (3)Recurring headline earnings (31%) 116 167 179 EBITDA margin 22% 29% 22%Schools’ EBITDA margin 29% 34% 29%
Earnings per share (cents)
– Basic (1%) 21.7 22.0* (6.5)– Diluted (1%) 21.7 22.0* (6.5) Headline earnings per share (cents)
– Basic (49%) 19.4 37.9* 36.4– Diluted (49%) 19.4 37.9* 36.4
Recurring headline earnings per share (cents) (51%) 19.4 39.7* 38.0
Number of shares in issue (millions)
– Basic 598.0 412.1 598.0– Diluted 598.0 412.1 598.0
Weighted average number of shares in issue (millions)
– Basic 598.0 420.0* 471.0– Diluted 598.0 420.0* 471.0
* Adjusted for the bonus element contained in the rights issue concluded during September 2020.
Results for the six months ended 30 June 2021 1110 Results for the six months ended 30 June 2021

Unaudited30 Jun 2021
R million
Unaudited30 Jun 2020
R million
Audited31 Dec 2020
R millionASSETSNon-current assets 10 552 10 203 10 286Property, plant and equipment 9 397 9 024 9 120Right-of-use assets 311 326 319Goodwill 561 563 561Other intangible assets 271 281 271Other financial assets 9 5 7Deferred tax assets 3 4 8Current assets 803 879 814Inventories 9 10 17Current tax receivable 1 1 3Other financial assets 29 30 27Trade receivables (note 4) 231 254 232Other receivables 97 165 102Investment in money market funds 311 231 334Cash and cash equivalents 125 188 99Non-current assets held for sale 13 43 14Total assets 11 368 11 125 11 114EQUITYEquity attributable to owners of the parent 6 949 5 403 6 768Share capital 6 205 4 733 6 205Other reserves (13) (58) (65)Retained earnings 757 728 628Non-controlling interest (4) 8 (2)Total equity 6 945 5 411 6 766LIABILITIESNon-current liabilities 3 685 4 796 3 781Other financial liabilities at amortised cost 2 661 3 814 2 774Other financial liabilities at fair value (note 5) 71 74 120Deferred tax liabilities 612 584 551Lease liabilities 325 312 323Contract liabilities 16 12 13Current liabilities 738 918 567Other financial liabilities at amortised cost 52 196 59Other financial liabilities at fair value (note 5) – 44 – Current tax payable 4 – 1Lease liabilities 34 33 33Trade and other payables 254 194 206Contract liabilities (mainly prepaid school fees) 346 309 227Development and acquisition payables 48 43 41Bank overdraft – 99 –
Total liabilities 4 423 5 714 4 348
Total equity and liabilities 11 368 11 125 11 114Net asset value per share (cents) 1 162 1 311 1 132
| CONDENSED CONSOLIDATED STATEMENT OF FINANCIAL POSITION
Unaudited30 Jun 2021
6 monthsR million
Unaudited30 Jun 2020
6 monthsR million
Audited31 Dec 2020
12 monthsR million
Balance at the beginning of the period 6 766 5 416 5 416Total comprehensive income / (loss) 163 32 (96)Rights issue – – 1 473Dividends paid – (42) (42)Non-controlling interest (2) (2) (12)Other 18 7 27Balance at the end of the period 6 945 5 411 6 766
CONDENSED CONSOLIDATED STATEMENT OF CASH FLOWS |
%
Change
Unaudited30 Jun 2021
6 monthsR million
Unaudited30 Jun 2020
6 monthsR million
Audited31 Dec 2020
12 monthsR million
Cash flows from operating activities Cash generated from operations (14%) 410 474 714Tax paid n/a – – (3)Net finance cost (35%) (68) (105) (200)Working capital movements - operations n/a 183 (14) 3Net cash generated from operating activities 48% 525 355 514
Cash flows from investing activities Purchase of property, plant and equipment 37% (356) (259) (632)Sale of property, plant and equipment – 1 1 48Purchase of intangible assets (26%) (26) (35) (55)Business combinations (note 6) (50%) (1) (2) (2)Development and acquisition investment n/a 8 (7) (9)Other investing activities n/a 19 (171) (271)Net cash utilised in investing activities (25%) (355) (473) (921)
Cash flows from financing activities Proceeds from shares issued pursuant to rights issue n/a – – 1 500Transaction cost pertaining to rights issue n/a – – (27)Proceeds from other financial liabilities n/a – 1 150 1 150Repayment of other financial liabilities (85%) (140) (914) (2 083)Dividends paid to company shareholders n/a – (42) (42)Principal elements of lease payments 33% (4) (3) (7)Net cash generated from financing activities n/a (144) 191 491
Cash and cash equivalents movement for the period (64%) 26 73 84Cash and cash equivalents at the beginning of the period* 560% 99 15 15Effect of foreign exchange rate movements n/a – 1 –Cash and cash equivalents at the end of the period*^ 40% 125 89 99
* Includes cash and cash equivalents and the bank overdraft on the statement of financial position. ^ Curro has additional liquid resources amounting to R331m (June 2020: R231m; December 2020: R334m) available in the form of its money market investments.
CONDENSED CONSOLIDATED STATEMENT OF CHANGES IN EQUITY |
Results for the six months ended 30 June 2021 1312 Results for the six months ended 30 June 2021

%
Change
Unaudited30 Jun 2021
6 monthsR million
Unaudited30 Jun 2020
6 monthsR million
Audited31 Dec 2020
12 monthsR million
Average learners for the period 7% 66 167 61 746◊ 60 777- Curro 8% 56 441 52 159◊ 51 249- Meridian 1% 9 726 9 587◊ 9 528Revenue 12% 1 784 1 590 3 094- Curro 12% 1 606 1 437 2 805- Meridian 16% 178 153 289Schools' EBITDA (7%) 509 546 886- Curro (7%) 469 506 828- Meridian – 40 40 58Net head office’s expenditure 49% (119) (80) (200)- Curro 48% (114) (77) (193)- Meridian 67% (5) (3) (7)EBITDA margin 22% 29% 22%- Curro 22% 30% 23%- Meridian 20% 24% 18%Recurring headline earnings (31%) 116 167 179- Curro (31%) 120 173 204- Meridian^ (33%) (4) (6) (25)Recurring headine earnings per share (cents) (51%) 19.4 39.7* 38.0- Curro (51%) 20.0 41.1* 41.5- Meridian^ (57%) (0.6) (1.4)* (3.5)Earnings per share (cents) (1%) 21.7 22.0* (6.5)- Curro (5%) 22.3 23.4* (1.6)- Meridian (57%) (0.6) (1.4)* (4.9)Total assets 2% 11 368 11 125 11 114- Curro 2% 10 633 10 393 10 402- Meridian 1% 735 732 712Total liabilities (23%) 4 423 5 714 4 348- Curro (27%) 3 666 4 997 3 621- Meridian 6% 757 717 727Net asset value per share (cents) 1 162 1 311 1 132
◊ Adjusted to reflect average learners in the period. Actual learners previously reported was at the end of the period: 59 967, Curro: 50 438, Meridian: 9 529.^ Included in the Meridian results is an interest charge of R29m (June 2020: R25m; December 2020: R49m) to shareholders in proportion to their shareholding.* Adjusted for the bonus element contained in the rights issue concluded during September 2020.
| CONDENSED CONSOLIDATED SEGMENTAL REPORT
1. STATEMENT OF COMPLIANCEThe condensed consolidated interim financial statements for the six months ended 30 June 2021 have been prepared in accordance with the framework concepts and the measurement and recognition requirements of International Financial Reporting Standards (IFRS), the SAICA Financial Reporting Guides as issued by the Accounting Practices Committee and Financial Reporting Pronouncements as issued by the Financial Reporting Standards Council, and also, as a minimum, contain the information required by IAS 34 Interim Financial Reporting, the requirements of the JSE Limited (JSE) and the requirements of the Companies Act of South Africa, as amended. The results have not been reviewed or audited by the Company’s auditor. The condensed consolidated interim financial statements have been prepared internally under the supervision of the Chief Financial Officer, JP Loubser, CA(SA).
2. ACCOUNTING POLICIESThe accounting policies applied in the preparation of the condensed consolidated interim financial statements are in terms of IFRS and are materially consistent with those of the annual financial statements for the year ended 31 December 2020. For a full list of standards and interpretations which have been adopted, we refer you to the 31 December 2020 annual financial statements.
NOTES TO THE CONDENSED CONSOLIDATED FINANCIAL STATEMENTS |
#Learners2Leaders – Curro
Results for the six months ended 30 June 2021 1514 Results for the six months ended 30 June 2021

3. REVENUE FROM CONTRACTS WITH CUSTOMERS
30 Jun 20216 monthsR million
30 Jun 20206 monthsR million
31 Dec 202012 months
R million
Included in revenue from contracts with customers:
Registration and tuition fees 1 808 1 646 3 226Other income 25 17 34Recovery income 36 35 47Boarding school fees 33 35 67Aftercare fees 21 39 56Bus income 18 19 35Rental income 4 2 4Subsidy income 3 1 2Discounts granted (164) (204) (377)
Personnel (45) (42) (83)Bursaries (40) (35) (73)Enrolments (3) (1) (6)COVID-19 – (60) (81)Other* (76) (66) (134)
1 784 1 590 3 094
* Other discounts mainly comprise of discretionary discounts, financial assistance and Ruta Sechaba bursaries.
4. TRADE RECEIVABLES
30 Jun 2021
R million30 Jun 2020
R million31 Dec 2020
R million
Gross receivables 508 407 447Expected credit loss provision (277) (153) (215)Net trade receivables 231 254 232
5. CASH FLOW HEDGES
30 Jun 2021
R million30 Jun 2020
R million31 Dec 2020
R million
Fixed-for-variable interest rate swap liabilities 71 118 120
The interest rate swap agreements are valued at the present value of the estimated future cash flows based on observable yield curves, representing a Level 2 fair value measurement for financial reporting purposes.
| NOTES TO THE CONDENSED CONSOLIDATED FINANCIAL STATEMENTS (continued)
6. BUSINESS COMBINATIONSEffective 1 January 2021, Curro acquired the entire business operations and properties of St George’s Preparatory School in Gqeberha (Port Elizabeth), South Africa for a total purchase consideration of R3 million combined.
R million
The following assets and liabilities were recognised: Property, plant and equipment 21
Cash and cash equivalents 2
Trade and other receivables 1
Deferred tax liability (5)
Contract liabilities (2)
Total identifiable net assets 17
Gain on bargain purchase (14)
Purchase consideration paid in cash 3
Net cash outflow on acquisition
Cash paid (3)
Cash and cash equivalents acquired 2
(1)
#Learners2Leaders – Curro Bloemfontein
Results for the six months ended 30 June 2021 1716 Results for the six months ended 30 June 2021

| J-CURVE
The table below illustrates the J-curve effect from the newly established schools to more mature schools by age. All figures and amounts are as at 30 June.
Campuses Schools Average learner
numbers GrowthSchools’ EBITDA
(R million) Growth Schools’ EBITDA marginBuilt capacity
utilisedEventual capacity
utilised
2021 2021 2019 2020# 2021 19/20 20/21 2019 2020 2021 19/20 20/21 2019 2020 2021 2019 2020 2021 2019 2020 2021
Developed schools 51 120 35 747 39 021 42 714 9% 9% 296 343 304 16% (11%) 34% 35% 28% 65% 63% 66% 46% 45% 56%
2009 & before* 4 9 4 130 4 149 4 228 0% 2% 42 50 45 19% (10%) 35% 40% 33% 85% 82% 85% 73% 71% 71%2010 2 6 2 215 2 244 2 200 1% (2%) 25 27 25 8% (8%) 41% 41% 36% 75% 74% 61% 55% 55% 61%2011 5 15 4 429 4 301 4 198 (3%) (2%) 37 46 35 24% (24%) 32% 38% 28% 63% 59% 61% 53% 50% 57%2012 2 6 1 891 1 975 2 082 4% 5% 15 17 15 13% (7%) 29% 31% 26% 72% 73% 77% 56% 57% 72%2013 4 12 6 357 6 412 6 291 1% (2%) 70 82 69 17% (16%) 42% 48% 39% 73% 71% 68% 64% 65% 65%2014 4 9 2 343 2 423 2 533 3% 5% 11 13 8 18% (36%) 23% 25% 14% 56% 52% 70% 47% 46% 65%2015 7 17 6 494 6 759 6 973 4% 3% 39 38 31 (3%) (16%) 31% 29% 22% 65% 66% 65% 49% 50% 59%2016 4 8 1 905 1 794 1 813 (6%) 1% 26 19 11 (27%) (42%) 41% 30% 18% 49% 39% 46% 36% 29% 42%2017 3 8 3 143 3 722 3 908 18% 5% 29 38 35 31% (6%) 41% 44% 37% 91% 78% 75% 51% 58% 64%2018 4 8 1 107 1 376 1 638 24% 19% 4 – (4) (100%) – 17% 2% (13%) 33% 39% 47% 17% 20% 43%2019 7 13 1 733 3 367 4 609 94% 37% (1) 19 31 n/a 58% (4%) 31% 31% 43% 74% 79% 17% 32% 43%2020 5 9 – 499 2 241 – 349% – (6) 3 – n/a – (84%) 7% – 16% 48% – 7% 27%
Acquired schools 25 58 21 426 22 725 23 453 6% 3% 196 216 209 10% (3%) 33% 35% 31% 80% 76% 78% 66% 67% 70%
2012 & before 7 17 7 261 7 571 8 011 4% 6% 82 78 88 (5%) 13% 38% 37% 37% 79% 76% 82% 64% 65% 77%2013** 2 2 3 684 3 715 3 654 1% (2%) 17 20 21 18% 4% 26% 32% 27% 74% 75% 79% 74% 75% 79%
2014 2 6 2 763 2 645 2 412 (4%) (9%) 41 35 26 (15%) (24%) 39% 38% 28% 85% 79% 69% 80% 74% 69%2015 & 2016 5 14 4 468 5 208 5 110 6% (2%) 32 46 40 44% (12%) 27% 36% 26% 99% 80% 78% 71% 67% 72%2018 3 6 1 881 1 984 2 020 5% 2% 20 27 28 35% 6% 38% 43% 44% 82% 81% 83% 56% 64% 59%2019 4 8 1 369 1 216 1 342 32% 10% 4 9 8 125% (15%) 11% 19% 21% 52% 67% 69% 44% 59% 51%2020 1 3 – 386 608 – 57% – 1 – – – – 12% (1%) – 55% 84% – 39% 52%2021 1 2 – – 296 – – – – (2) – – – – (24%) – – 64% – – 64%
Non-recurring costs – (10) – Property rental, royalties and other*** (1) (3) (4) Total 76 178 57 173 61 746 66 167 8% 7% 491 546 509 11% (7%) 33% 34% 29% 70% 67% 70% 52% 51% 60%
Acquired schools indicate the year the school was incorporated into Curro. All acquired schools have been established for at least seven years.* 2009 and before schools have a maximum of 20 learners per class, which has a direct impact on the EBITDA. Other schools have a maximum of 25 learners for Curro and Select or 35 for Meridian and Academy schools.** Learner number losses at Northern Academy.*** No rental expense pursuant to the adoption of IFRS 16 with effect from 1 January 2019.# Adjusted to reflect average learners in the period. Actual learners previously reported was at the end of the period: 59 967.
Results for the six months ended 30 June 2021 1918 Results for the six months ended 30 June 2021

Directors: SL Botha** (Chairperson), TP Baloyi**, AJF Greyling (CEO), ZN Mankai**, T Molefe**, PJ Mouton*, SWF Muthwa**, DM Ramaphosa**, JP Loubser (CFO), CR van der Merwe** Non-executive** Independent non-executive
Registered office: 38 Oxford Street, Durbanville, Cape Town, 7550
Transfer secretaries: Computershare Investor Services Proprietary Limited Rosebank Towers, 15 Biermann Avenue, Rosebank, Johannesburg, 2196
Corporate adviser and JSE Equity and Debt sponsor: PSG Capital
Independent joint JSE Equity sponsor: UBS South Africa
Group Company Secretary: M Lategan
Shareholders are referred to the announcement released on SENS on 1 June 2021 where shareholders were advised that Mrs M Lategan has been appointed as Executive: Corporate Services and Group Company Secretary of the company with effect from 1 June 2021. Mrs Lategan replaces Mr R Botha, who served as the acting company secretary of Curro pending the appointment of a permanent company secretary.
Curro Holdings LimitedIncorporated in the Republic of South AfricaRegistration number: 1998/025801/06JSE Equity Alpha Code: COHJSE Debt Alpha Code: COHIISIN: ZAE000156253(‘Curro’ or ‘the company’ or ‘the group’)Announcement date: 18 August 2021
| STATUTORY AND ADMINISTRATION
‘If your dreams don’t scare you, they are too small.’
– Richard Branson
#Learners2Leaders – Curro Academy Wilgeheuwel
Results for the six months ended 30 June 2021 2120 Results for the six months ended 30 June 2021

Contact details: 021 979 1204/5 | [email protected] | www.curro.co.za