results in 2017 program highlights 2018 · depreciation and amortization 11,350 11,424 ... (20%...
TRANSCRIPT

Results in 2017 Program Highlights 2018
Francis Gurry Director General World Intellectual Property Organization (WIPO) Briefing for Ambassadors 22 March 2018

Agenda
• Global IP Context
• Financial Results 2017 and Outlook
• Operational Results 2017 and Program for 2018
• Other Selected Highlights/Challenges for 2018 and Beyond

Global IP Context
• Demand continues to rise at rates above global economic growth
• Geography of demand continues to shift

World IP Filings 2016

0
500,000
1,000,000
1,500,000
2,000,000
2,500,000
3,000,000
3,500,000
1996 1998 2000 2002 2004 2006 2008 2010 2012 2014 2016
3.1 million patent applications worldwide in 2016
App
licat
ions

Asia Share 2016 Patents 64.6% Trademarks 60.0% Designs 69.3%

Distribution of Global Patenting has Shifted in Recent Decades
0
200,000
400,000
600,000
800,000
1,000,000
1,200,000
1,400,000
1886 1896 1906 1916 1926 1936 1945 1956 1966 1976 1986 1996 2006 2016
China U.S. Japan Rep. of Korea EPO
App
licat
ions

The U.S. leads in filings abroad
295,327
260,244
73,574
163,424
1,204,981
24,714
8,729
19,009
9,128
4,078
215,918
191,819
75,378
69,945
51,522
33,316
27,903
27,443
19,957
19,897
U.S.
Japan
Germany
Rep. of Korea
China
France
Switzerland
U.K.
Netherlands
Canada
Residents Abroad
Absolute count

Financial Results 2017
• Overall surplus of CHF 18.6 million 2016: restated surplus CHF 37.3 million (surplus before restatement amounted to CHF 32 million)
• Revenue CHF 413.5 million +CHF 25.8 million over 2016
• Expenditure CHF 394.9 million
+CHF 44.5 million over restated 2016 figures following the implementation of IPSAS 39 “ Employee Benefits”

Statement of Financial Performance (in thousands of Swiss francs) Note 2017 2016 (restated)
REVENUE 25
Assessed contributions 17,829 17,337Voluntary contributions 12,096 10,176Publications revenue 242 426
Investment revenue 4,337 21
Fees
PCT system 296,356 290,719Madrid system 69,952 59,580Hague system 5,076 4,956Lisbon system 39 25
Sub-total fees 371,423 355,280
Arbitration and Mediation 1,689 1,641
Other/miscellaneous revenue 5,860 2,832
TOTAL REVENUE 413,476 387,713
EXPENSES 26
Personnel expenditure 228,594 219,093Internships and WIPO fellowships 3,853 3,261
Travel, training and grants 18,195 15,810Contractual services 89,422 74,398Operating expenses 26,300 21,946Supplies and materials 3,457 2,039Furniture and equipment 1,669 172Depreciation and amortization 11,350 11,424Finance costs 12,007 2,310
TOTAL EXPENSES 394,847 350,453
SURPLUS/(DEFICIT) FOR THE PERIOD 18,629 37,260

Composition of 2017 Revenue on an IPSAS basis (millions of Swiss francs)

Composition of Expenditure on an IPSAS basis (millions of Swiss francs)

Evolution of Overall Result for Organization
Note: Following the introduction of IPSAS 39 related to employment benefits, the Financial Statements will restate the 2016 IPSAS adjustment downward by 5.3 million Swiss francs. This will modify the operating result to 40.9 million Swiss francs and the overall result to 37.3 million Swiss francs for 2016.

Net Assets Reserves and Working Capital Funds (RWCF)
(in millions of Swiss francs)
2010 2011 2012 2013 2014 2015 2016 2017
Net Assets (Actuarial Gains/(Losses) excluded) * 194.6 174.2 193.7 208.8 245.8 279.1 322.7 341.4 RWCF Target (Regular Budget)*** 116.8 116.8 120.6 120.6 124.7 124.7 157.0 157.0 Difference 77.8 57.4 73.1 88.2 121.0 154.3 165.7 184.4 Actuarial Gains/(Losses) (173.3) (138.7)Total Net Assets** 149.4 202.7
75.9 47.2 81.4 76.8 68.1 88.4 136.1 119.7
23.7 16.8 11.8
* Net Assets (Actuarial Gains/(Losses) excluded) were restated for 2011, 2012 and 2016.
***RWCF target for 2016/17 is based on the new target percentage for the PCT system (20% versus 15% in earlier periods)
Note: Appropriations already approved, not yet spent
** As per Financial Statements
Net Current Assets (Net Liquid Assets - non current investments included)
-
50.0
100.0
150.0
200.0
250.0
300.0
350.0
400.0
2010 2011 2012 2013 2014 2015 2016 2017
in m
ln C
HF
Net Assets (Actuarial Gains/(Losses) excluded)*RWCF Target (Regular Budget)***Net Current Assets (Net Liquid Assets - non current investments included)

Global IP Systems - 2017
• Significant growth in three major systems
• PCT 243,500 international applications +4.5% over 2016
• Madrid System
56,200 applications +5% over 2016
• Hague System
19,429 designs +3.8% over 2016
• Priorities Extending geographical reach and participation Quality, efficiency and cost-effectiveness of service Comprehensive IT environments

Trend in PCT filings
2.1
-4.8
5.8
11.07.1
5.1 4.41.4
7.2
4.5
0
50,000
100,000
150,000
200,000
250,000
2007 2008 2009 2010 2011 2012 2013 2014 2015 2016 2017
Gro
wth
(%
)
Nu
mb
er o
f PC
T f
ilin
gs
Growth (%) Number of PCT filings

PCT Filings by origin – top 10 origins
56,62448,882 48,208
18,982 15,7638,012 5,567 4,491 4,431 3,981
0
25,000
50,000
75,000
Nu
mb
er o
f PC
T f
ilin
gs
2007 2017

Share of PCT filings
0.0
10.0
20.0
30.0
40.0
50.0
60.0
2007 2008 2009 2010 2011 2012 2013 2014 2015 2016 2017
Sh
are
of t
otal
PC
T fi
lin
gs (
%)
U.S. Asia Europe
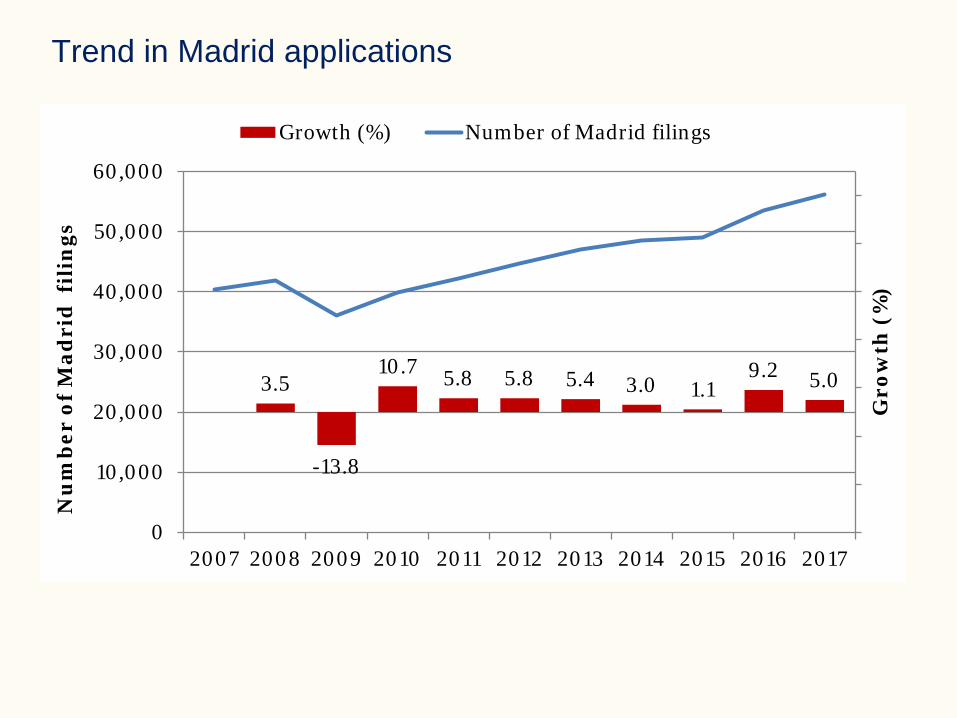
Trend in Madrid applications
3.5
-13.8
10.7 5.8 5.8 5.4 3.0 1.19.2 5.0
0
10,000
20,000
30,000
40,000
50,000
60,000
2007 2008 2009 2010 2011 2012 2013 2014 2015 2016 2017
Gro
wth
(%
)
Nu
mb
er o
f Mad
rid
fil
ings
Growth (%) Number of Madrid filings

Madrid applications for the top 10 origins
7,8847,316
5,2304,261
3,292 3,272 2,878 2,495 2,1151,460
0
2,000
4,000
6,000
8,000
Nu
mb
er o
f Mad
rid
fil
ings
2007 2017

Trend in Hague applications (# of designs)
38.8
3.5
24.2
4.2 3.5 5.8 9.6 13.8 13.93.8
0
5,000
10,000
15,000
20,000
2007 2008 2009 2010 2011 2012 2013 2014 2015 2016 2017
Gro
wth
(%
)
Nu
mb
er o
f des
ign
s
Growth (%) Designs in Hague filings

Hague applications for the top 10 origins (No. of Designs)
4,261
2,935
1,7421,661
1,396 1,065831 807
457 421
0
1,000
2,000
3,000
4,000
5,000
Nu
mb
er o
f des
ign
s
2007 2017
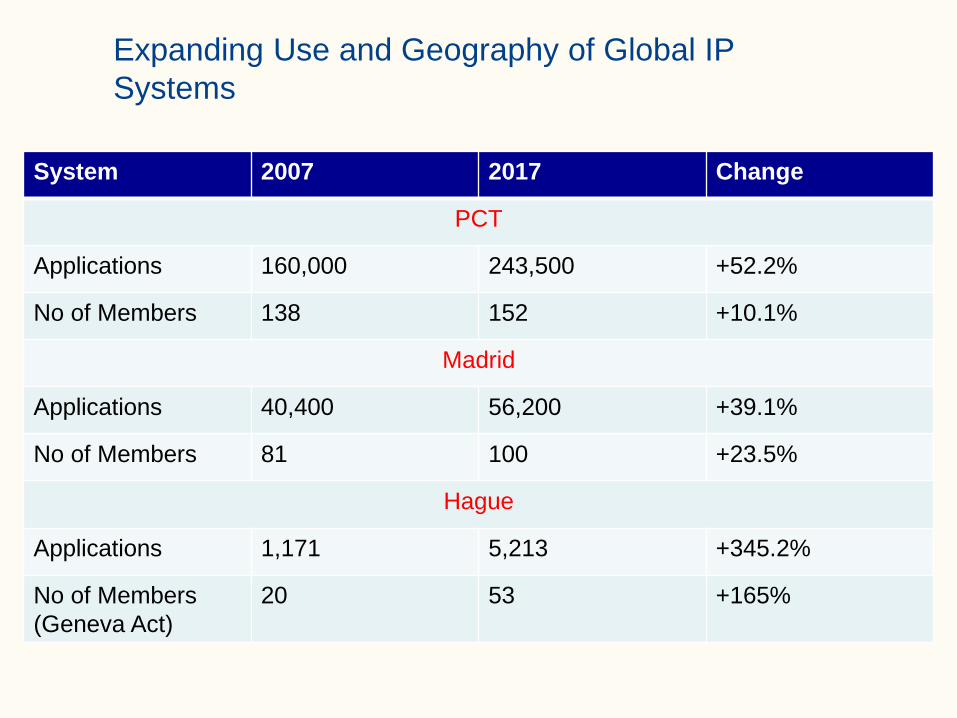
Expanding Use and Geography of Global IP Systems
System 2007 2017 Change
PCT
Applications 160,000 243,500 +52.2%
No of Members 138 152 +10.1%
Madrid
Applications 40,400 56,200 +39.1%
No of Members 81 100 +23.5%
Hague
Applications 1,171 5,213 +345.2%
No of Members (Geneva Act)
20 53 +165%
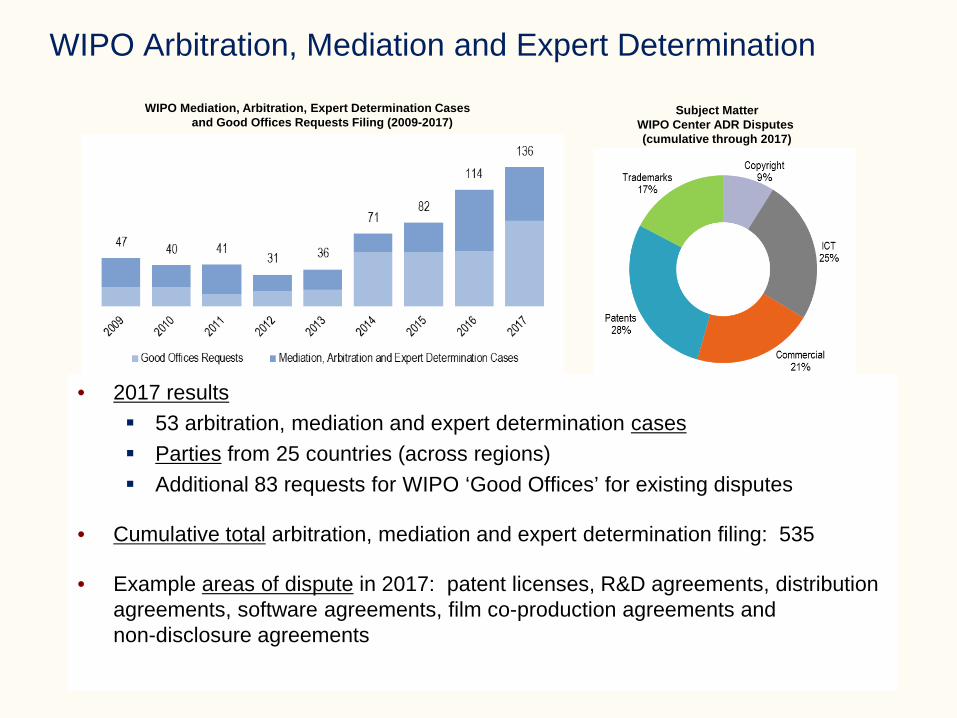
• 2017 results 53 arbitration, mediation and expert determination cases Parties from 25 countries (across regions) Additional 83 requests for WIPO ‘Good Offices’ for existing disputes
• Cumulative total arbitration, mediation and expert determination filing: 535
• Example areas of dispute in 2017: patent licenses, R&D agreements, distribution agreements, software agreements, film co-production agreements and non-disclosure agreements
WIPO Arbitration, Mediation and Expert Determination
Subject Matter WIPO Center ADR Disputes (cumulative through 2017)
WIPO Mediation, Arbitration, Expert Determination Cases and Good Offices Requests Filing (2009-2017)

• Increasing collaboration with Member States’ intellectual property authorities for promotion and/or integration of alternative dispute resolution options
WIPO Center Collaborations with IP and Copyright Offices
* in 2017

• 2017 results Record 3,074 WIPO UDRP-based cases (+1.3%), 6,370 domain names Parties from 112 countries, 298 panelists appointed, 15 languages of proceedings Many cases including allegations of counterfeiting and phishing New gTLD domain names 12% of WIPO 2017 caseload
• Since 1999: 39,000+ WIPO UDRP-based cases for 74,000+ domain names
• 76 ccTLDs designating WIPO dispute resolution • 17% of WIPO 2017 caseload • 2017 additions: .EU (European Union) and .SE (Sweden)
• All-new edition launched in 2017 of posted WIPO Jurisprudential Overview
WIPO Domain Name Dispute Resolution

Normative Program
• Proposed Design Law Treaty
• IGC
• Broadcasting

Global Databases
• Patentscope 68 million documents (PCT, ARIPO, EAPO, EPO and 51 national patent collections) multilingual search in 14 languages WIPO Translate: neural machine translation using artificial intelligence the most visited WIPO web site with 27,000 visitors per day
• Global Brands Database
34 million records (Madrid, Lisbon, emblems, EUIPO and 38 national TM collections) with a pioneer image-search tool
• Global Designs Database
1.8 million records (Hague, 6 national designs collections)
• WIPO Lex
14,000 national IP laws and regulations and 800 treaties More than 3.7 million users in 2017, an increase of 82% from 2016

Inter-Office Platforms
• Digital Access Service (DAS) Secure exchange of priority documents between IP Offices Meets the requirements of the Paris Convention for certification in a
digital environment In service since 2009 17 participating Offices
• Centralized Access to Search and Examination (WIPO CASE) Secure exchange of search and examination information to facilitate
work sharing Examiners from participating patent Offices can search and access the
dossier information of other Offices In service since 2011 32 participating Offices, including 15 data-providing Offices

Platforms for Development
• Industrial Property Administration System (IPAS)
Systems to support the business operations of IP Offices – filing, administration, examination, registration, publication/dissemination of IP information
WIPO free of charge software, supplemented by free services of digitization, data capture, quality improvement, workflow optimization
In use in 81 IP Offices in all regions
• WIPO Connect Deployed in 2016 Supports the business operations of Collective Management
Organizations (CMOs) More widespread deployment in 2017

Platforms for Development (2)
• Technology and Innovation Support Centers (TISCs) Over 700 in 71 national networks in developing and least-developed
countries
• Public-Private Partnerships on Access to Information and Knowledge ARDI
o part of UN partnership “Research4Life” with free/affordable access to 28,000 science and technology books/journals
o 1,100 institutions actively using ARDI ASPI – free/affordable access to seven commercial patent
databases

Accessible Books Consortium
• Consortium between authors, publishers, libraries, blind associations
• Functions
International (Accessible Format) Book Exchange 29 Authorized Entities (AEs) Catalogue of 400,000 works in 76 languages
Inclusive Publishing ABC Charter for Accessible Publishing
Capacity Building Capacity building projects in Argentina, Bangladesh, Botswana, India,
Nepal, Sri Lanka and Uruguay 4,000 educational titles produced in accessible formats

WIPO Re:Search
Global initiative established to encourage and facilitate the sharing of intellectual property assets to advance drug, vaccine, and diagnostic development for malaria, tuberculosis, and neglected tropical diseases (NTDs)
Improved global health through innovation that mobilizes intellectual property and the power of private and public sector collaborations.
Access to Intellectual
Property
Sharing Know-How and Expertise
Accelerated Product
Development
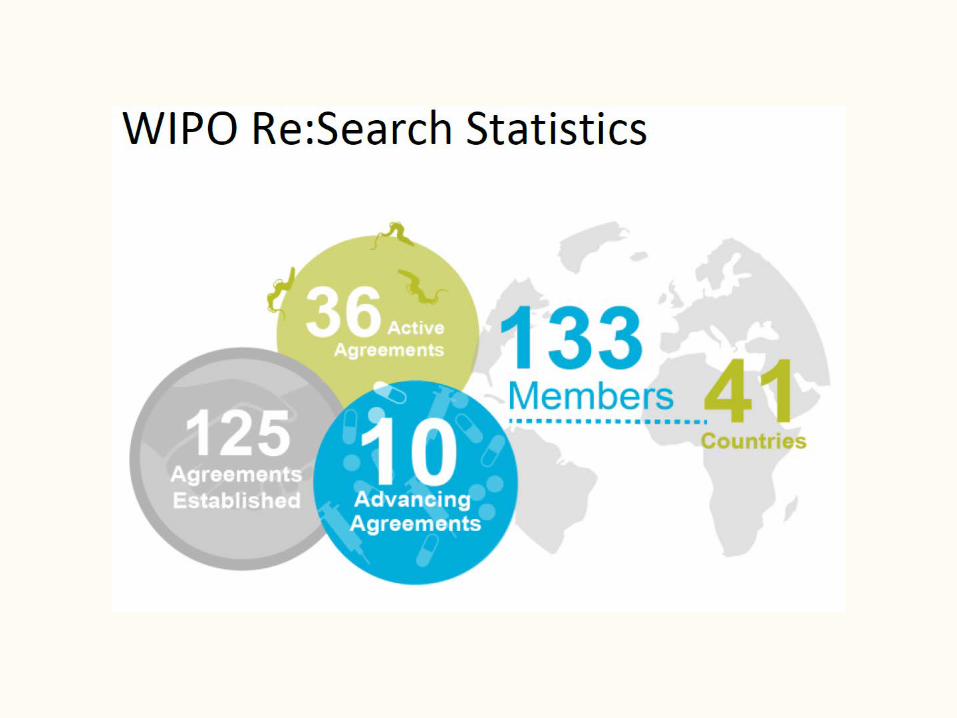
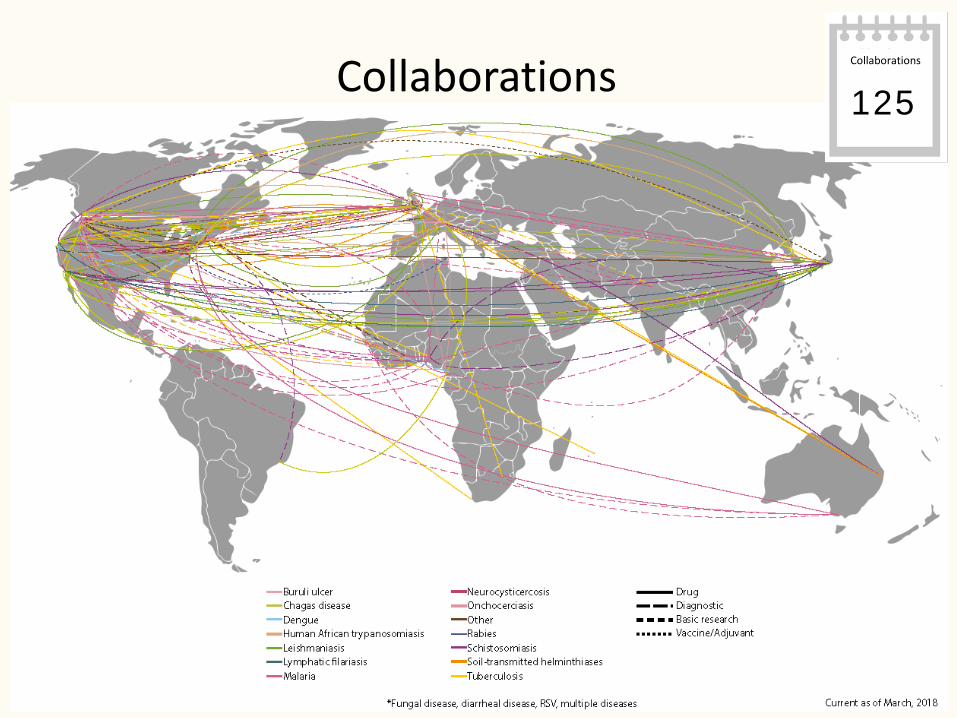
Collaborations 125 Collaborations

WIPO Re:Search Collaborations
Source: BIO Ventures for Global Health

Capacity Building

Statistical Reports
• World Intellectual Property Indicators Published each December for preceding year Reports on IP filings worldwide
• Annual Reports on PCT, Madrid and the Hague Systems Published each April for preceding year

Global Innovation Index
• Published each year in cooperation with INSEAD and Cornell University
• Provides benchmarks for innovation capacity and best practices


WIPO Academy’s Record (1998-2018)
518,325 individuals have followed our distance learning courses since 2001
10,412 specialized courses have been organized with our Member States for over 4,300 government officials since 2000 1,595 students have graduated from our Joint Master’s Program since 2003, of whom 695 received scholarships as government officials Five national IP training centers have been established, and 138 trainers have been certified. More than 3,355 participants have taken part in the WIPO Summer Schools since 1998

Communications wipo.int
0
5,000,000
10,000,000
15,000,000
20,000,000
25,000,000
2012 2013 2014 2015 2016 2017
users
sessions
0
20,000,000
40,000,000
60,000,000
80,000,000
100,000,000
120,000,000
2012 2013 2014 2015 2016 2017
pageviews

India, 8.2% United States of America, 8.1%
Mexico, 7.5%
Brazil, 4.9%
Egypt, 4.7%
France, 1.9%
Colombia, 1.9% United Kingdom, 1.9%
Pakistan, 1.9%
Peru, 1.9% Italy, 1.8%
Spain, 1.7% Algeria, 1.6% Viet Nam, 1.4%
Bangladesh, 1.3%
Rest of the world & n/a, 49.4%
A global fan base on Facebook
“Likes” of World IP Day Facebook Page.

503 World IP Day celebrations in 124 countries around the world in 2017
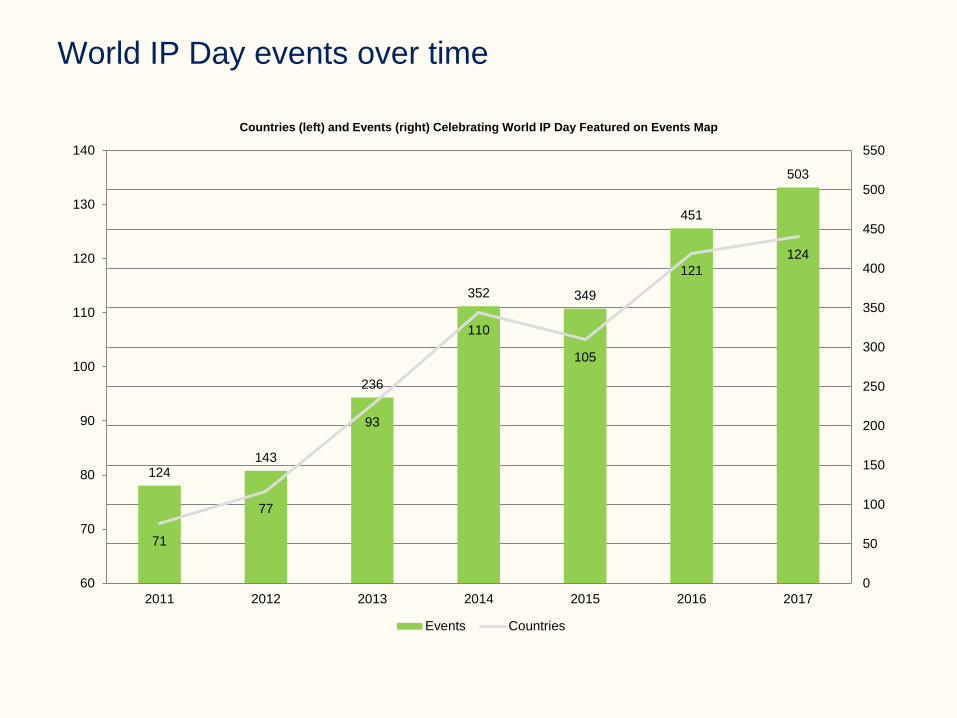
World IP Day events over time
124 143
236
352 349
451
503
71
77
93
110
105
121 124
60
70
80
90
100
110
120
130
140
2011 2012 2013 2014 2015 2016 20170
50
100
150
200
250
300
350
400
450
500
550
Countries (left) and Events (right) Celebrating World IP Day Featured on Events Map
Events Countries

Initiatives and Challenges in 2018
Advanced Technology Applications Center (ATAC) Artificial Intelligence (AI) applications In operation
WIPO Translate, Classifications, Image Search Under study or development
Voice recognition and verbatim reports Customer service Digital tutor (Academy) HR recruitment
ICT Strategies and AI for IP Administration, May 2018
Tech Trends Report
Judicial Administration of IP

Initiatives and Challenges in 2018 (2)
Patent Drafting Training and Certification
External Offices Establishment of Offices in Algeria and Nigeria Decision on up to four new Offices
World IP Day
April 26 Powering change: Women in innovation and creativity
Major IT Transformations Global IP Platform Hague IT Platform Madrid IT Platform
SDGs