results of the 2012 nrmp program director survey 1 all specialties percentage of programs citing...
TRANSCRIPT

Results of the 2012
NRMP Program Director Survey
www.nrmp.org
August 2012

Requests for permission to use these data as well as questions about the content of this
publication or the National Resident Matching Program data and reports may be directed to
Mei Liang, Director of Research, NRMP, at [email protected].
Questions about the NRMP should be directed to Mona Signer, Executive Director, NRMP,
Suggested Citation
National Resident Matching Program, Data Release and Research Committee: Results of the
2012 NRMP Program Director Survey. National Resident Matching Program, Washington, DC.
2012.
Copyright © 2012 National Resident Matching Program.

Table of Contents

Introduction
1NRMP Program Director Survey Results, 2012
Specialty Surveys Sent Number Responding Response Rate
Anesthesiology 191 88 46.1%
Child Neurology 104 46 44.2%
Dermatology 117 53 45.3%
Emergency Medicine 153 98 64.1%
Family Medicine 451 235 52.1%
General Surgery 530 164 30.9%
Internal Medicine 731 296 40.5%
Internal Medicine/Pediatrics 76 35 46.1%
Neurological Surgery 98 42 42.9%
Neurology 142 59 41.5%
Obstetrics and Gynecology 251 113 45.0%
Orthopaedic Surgery 161 87 54.0%
Otolaryngology 107 51 47.7%
Pathology 147 78 53.1%
Pediatrics 253 131 51.8%
Physical Medicine and Rehabilitation 56 37 66.1%
Plastic Surgery 57 27 47.4%
Psychiatry 190 88 46.3%
Radiation Oncology 85 45 52.9%
Radiology 199 88 44.2%
Transitional Year 110 49 44.5%
Vascular Surgery 35 13 37.1%
All others 127 37 29.1%
Total 4,371 1,960 44.8%
The National Resident Matching Program (NRMP) conducted
a survey of the directors of all programs participating in the
2012 Main Residency Match℠. The primary purpose of the
survey was to shed light on the factors that program directors
use in both (1) selecting applicants to interview and (2)
ranking applicants for The Match.
The survey was fielded during the 19 days between the rank
order list deadline and Match Week so that program match
outcomes would not influence respondents' answers.
The survey solicited information on:
· the number of applications received, screened, and
reviewed, as well as the number of applicants
interviewed and ranked
· the percentage of interview slots offered prior to the
November 1 release date of the Medical Student
Performance Evaluation (MSPE/Dean's Letter)
· whether the program typically interviews and ranks
specific applicant groups
· the use of test scores in considering which applicants
to interview, and
· the factors used for both interview selection and for
ranking applicants.
The overall response rate for all specialties in this report
was 44.8 percent. Transitional Year and 21 specialties with
10 or more responses are included in this report. Their
response rates are listed in the table below. Response rates
for those specialties ranged from a high of 66.1 percent for
Physical Medicine and Rehabilitation to a low of 30.9 for
General Surgery.
Numbers of responses are presented in most of the graphs.
Some graphs use data from multiple survey questions. In
those cases, different N's are listed. Numbers of applicants
ranked and positions in the Match are extracted from the
NRMP database. Graphs are suppressed for specialties
with less than five responses.
This report presents results by specialty on selected items
from the survey. The NRMP hopes that program directors,
medical school officials, and applicants find these data
useful as they prepare for and participate in The Match._______________
The NRMP's data reporting and research activities are
guided by its Data Release and Research Committee.
NRMP data and reports can be found at:
www.nrmp.org/data/.

All Specialties Combined
2NRMP Program Director Survey Results, 2012

Figure 1All Specialties
Percentage of Programs Citing Each Factor in Selecting Applicants to Interview
3NRMP Program Director Survey Results, 2012
0% 20% 40% 60% 80% 100%
USMLE/COMLEX Step 1 score
Letters of recommendation in the specialty
Personal Statement
Grades in required clerkships
USMLE/COMLEX Step 2 score
Grades in clerkship in desired specialty
Graduate of U.S. allopathic medical school
Medical Student Performance Evaluation(MSPE/Dean's Letter)
Class ranking/quartile
Gaps in medical education
Personal prior knowledge of the applicant
Perceived commitment to specialty
Honors in clinical clerkships
Applicant was flagged with Match violation by theNRMP
Volunteer/extracurricular experiences
Other life experience
Honors in clerkship in desired specialty
Consistency of grades
Audition elective/rotation within your department
82%
81%
77%
71%
70%
69%
69%
68%
67%
67%
63%
63%
62%
62%
61%
61%
61%
60%
60%
N=1,666

Figure 1All Specialties
Percentage of Programs Citing Each Factor in Selecting Applicants to Interview
(continuted)
4NRMP Program Director Survey Results, 2012
0% 20% 40% 60% 80% 100%
Evidence of professionalism and ethics
Interpersonal skills
Perceived interest in program
Graduate of highly regarded U.S. medical school
Leadership qualities
Alpha Omega Alpha (AOA) membership
Demonstrated involvement and interest in research
Feedback from current residents
Visa status*
Honors in basic sciences
Fluency in language spoken by your patient population
Interest in academic career
Away rotation in your specialty at another institution
USMLE/COMLEX Step 3 score*
Other post-interview contact
Gold Society membership
55%
55%
54%
53%
53%
51%
51%
50%
49%
45%
36%
34%
28%
27%
23%
23%
* International Medical Graduates only
N=1,666

All Specialties
Mean Importance Ratings* of Factors in Ranking Applicants
Figure 2
*Ratings on a scale from 1 (not at all important) to 5 (very important).
5NRMP Program Director Survey Results, 2012
0 1 2 3 4 5
Applicant was flagged with Match violation by theNRMP
Interactions with faculty during interview and visit
Interpersonal skills
Interactions with housestaff during interview andvisit
Feedback from current residents
Evidence of professionalism and ethics
Grades in clerkship in desired specialty
Perceived commitment to specialty
Letters of recommendation in the specialty
Graduate of U.S. allopathic medical school
USMLE/COMLEX Step 1 score
Leadership qualities
Honors in clerkship in desired specialty
Gaps in medical education
Grades in required clerkships
USMLE/COMLEX Step 2 score
Honors in clinical clerkships
Class ranking/quartile
Medical Student Performance Evaluation(MSPE/Dean's Letter)
Personal prior knowledge of the applicant
4.8
4.7
4.7
4.6
4.5
4.5
4.2
4.2
4.2
4.1
4.1
4.1
4.0
4.0
4.0
4.0
3.9
3.9
3.8
3.8
N=1,666

All Specialties
Mean Importance Ratings* of Factors in Ranking Applicants
(continuted)
Figure 2
*Ratings on a scale from 1 (not at all important) to 5 (very important).
** International Medical Graduates only
6NRMP Program Director Survey Results, 2012
0 1 2 3 4 5
Consistency of grades
Perceived interest in program
Visa status**
Audition elective/rotation within your department
Graduate of highly regarded U.S. medical school
Alpha Omega Alpha (AOA) membership
Fluency in language spoken by your patientpopulation
Personal Statement
Other life experience
Demonstrated involvement and interest in research
Honors in basic sciences
Volunteer/extracurricular experiences
USMLE/COMLEX Step 3 score**
Other post-interview contact
Interest in academic career
Gold Society membership
Second interview/visit
Away rotation in your specialty at anotherinstitution
3.8
3.7
3.7
3.7
3.6
3.4
3.3
3.3
3.2
3.1
3.0
3.0
3.0
2.8
2.8
2.8
2.6
2.4
N=1,666

0%
20%
40%
60%
80%
100%
Yes, pass only Yes, target score No
33%
48%
20%
Scores required?
All Specialties
Programs That Use USMLE Step 1 and Step 2 Clinical Knowledge (CK) Scores When
Considering Which Applicants to Interview
Figure 3
Percentage of Programs That Use USMLE Step 1 Score
Percentage of Programs That Use USMLE Step 2 (CK) Score
7NRMP Program Director Survey Results, 2012
0%
20%
40%
60%
80%
100%
Yes, pass only Yes, target score No
36%
63%
1%
Scores required?
0%
20%
40%
60%
80%
100%
Never Seldom Often
26%
61%
13%
Would your program consider applicants who fail theirexam on the 1st attempt?
0%
20%
40%
60%
80%
100%
Never Seldom often
32%
59%
8%
Would your program consider applicants who fail theirexam on the 1st attempt?
N=1,844N=1,494
N=1,771 N=1,303
N=506N=689N=997
USMLE Step 1 and Step 2 CK Scores
Programs Consider When Granting Interviews
N=708
100
120
140
160
180
200
220
240
260
280
Scores Below Which Programs
Generally Does Not Grant Interviews
100
120
140
160
180
200
220
240
260
280
Scores Above Which Programs
Almost Always Grant Interviews
The boxes in the boxplots above represent the interquartile range (or IQR, which is the range between the 25th and 75th
percentiles) and the line in thebox is the median. The x-shaped symbol in the box is the mean.
USMLE Step 2 CKUSMLE Step 1USMLE Step 2 CKUSMLE Step 1

0%
10%
20%
30%
40%
50%
60%
70%
80%
90%
100%
Yes, pass only Yes, target score No
21%
8%
71%
COMLEX-USA Level 3*
0%
10%
20%
30%
40%
50%
60%
70%
80%
90%
100%
Yes, pass only Yes, target score No
42%
35%
23%
COMLEX-USA Level 1*
N=760%
10%
20%
30%
40%
50%
60%
70%
80%
90%
100%
Yes, pass only No
77%
23%
USMLE Step 2 Clinical Skills (CS)
0%
10%
20%
30%
40%
50%
60%
70%
80%
90%
100%
Yes, pass only Yes, target score No
39%
29% 32%
COMLEX-USA Level 2-CE*
N=530%
10%
20%
30%
40%
50%
60%
70%
80%
90%
100%
Yes, pass only Yes, target score No
21%
10%
69%
USMLE Step 3
0%
10%
20%
30%
40%
50%
60%
70%
80%
90%
100%
Yes, pass only Yes, target score No
55%
10%
35%
COMLEX-USA Level 2-PE*
N=1,262 N=1,212
N=1,166 N=878
* Osteopathic applicants only
Figure 4 All Specialties
Percentage of Programs That Use USMLE Step 2 Clinical Skill (CS), Step 3, and
COMLEX-USA Scores* When Considering Which Applicants to Interview
N=1,705 N=1,138
8NRMP Program Director Survey Results, 2012
Percentage of Programs That Use USMLE Step 2 CS and Step 3 Scores
Percentage of Programs That Use COMLEX-USA Level 1 and Level 2-CE Scores
Percentage of Programs That Use COMLEX-USA Level 2-PE and Level 3 Scores

0%
10%
20%
30%
40%
50%
60%
70%
80%
90%
100%
U.S. Senior U.S. Grad Osteopathic Canadian Fifth Pathway U.S. IMG Non-U.S. IMG
98%
73% 73%
55%
42%
63%
52%
Percentage of Programs that Typically Interview and Rank Each Applicant Groups
All Specialties
Program's Interview Activities Figure 5
9NRMP Program Director Survey Results, 2012
0%
10%
20%
30%
40%
50%
0% 1-24% 25-49% 50-74% 75-99% 100%
25%
12% 11%
16%
26%
10%
Percentage of Program's Interview Slots Extended Prior to the November 1st MSPE/Dean's Letter Release Date
0
100
200
300
400
500
600
700
800
Number ofapplications
received
Number ofapplicantsinterviewed
Number ofapplicants
ranked
Number ofpostions in The
Match
765
8966
7
Average Number of Applications Received, ApplicantsInterviewed and Ranked and Positions in The Match
0%
10%
20%
30%
40%
50%
60%
70%
80%
90%
100%
Percentage of applicationsrejected without an interview
Percentage of applicantsreceiving an interview
53%
46%
Average Percentage of Applications Interviewed
N=1,836
N=1,844 N=1,849
N=1,868
37% of all programs consider all applicants

Anesthesiology (N=88)
NRMP Program Director Survey Results, 2012 10

Figure AN-1Anesthesiology
Percentage of Programs Citing Each Factor in Selecting Applicants to Interview
0% 20% 40% 60% 80% 100%
USMLE/COMLEX Step 1 score
Letters of recommendation in the specialty
Personal Statement
Grades in required clerkships
USMLE/COMLEX Step 2 score
Grades in clerkship in desired specialty
Graduate of U.S. allopathic medical school
Medical Student Performance Evaluation(MSPE/Dean's Letter)
Class ranking/quartile
Gaps in medical education
Personal prior knowledge of the applicant
Perceived commitment to specialty
Honors in clinical clerkships
Applicant was flagged with Match violation by theNRMP
Volunteer/extracurricular experiences
Other life experience
Honors in clerkship in desired specialty
Consistency of grades
Audition elective/rotation within your department
84%
88%
82%
82%
72%
72%
74%
72%
84%
74%
66%
66%
76%
69%
70%
73%
70%
76%
73%
N=74
NRMP Program Director Survey Results, 2012 11
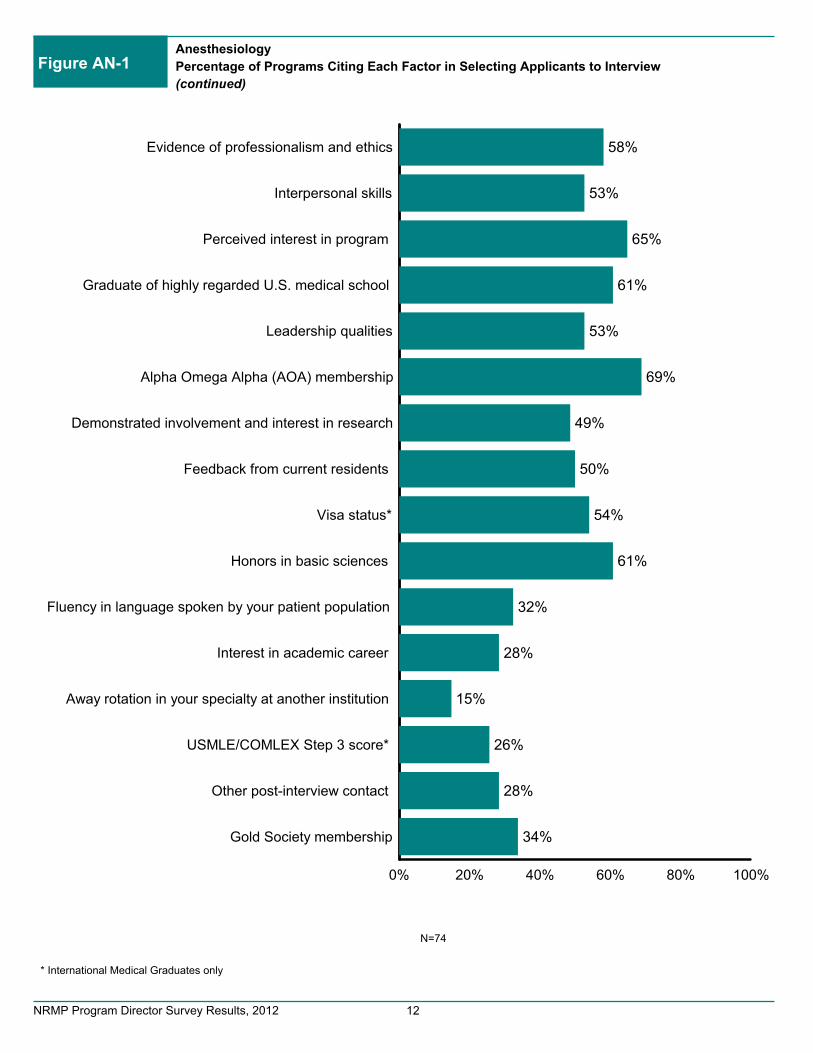
Figure AN-1Anesthesiology
Percentage of Programs Citing Each Factor in Selecting Applicants to Interview
(continued)
0% 20% 40% 60% 80% 100%
Evidence of professionalism and ethics
Interpersonal skills
Perceived interest in program
Graduate of highly regarded U.S. medical school
Leadership qualities
Alpha Omega Alpha (AOA) membership
Demonstrated involvement and interest in research
Feedback from current residents
Visa status*
Honors in basic sciences
Fluency in language spoken by your patient population
Interest in academic career
Away rotation in your specialty at another institution
USMLE/COMLEX Step 3 score*
Other post-interview contact
Gold Society membership
58%
53%
65%
61%
53%
69%
49%
50%
54%
61%
32%
28%
15%
26%
28%
34%
N=74
* International Medical Graduates only
NRMP Program Director Survey Results, 2012 12

Anesthesiology
Mean Importance Ratings* of Factors in Ranking Applicants
Figure AN-2
0 1 2 3 4 5
Applicant was flagged with Match violation by theNRMP
Interactions with faculty during interview and visit
Interpersonal skills
Interactions with housestaff during interview andvisit
Feedback from current residents
Evidence of professionalism and ethics
Grades in clerkship in desired specialty
Perceived commitment to specialty
Letters of recommendation in the specialty
Graduate of U.S. allopathic medical school
USMLE/COMLEX Step 1 score
Leadership qualities
Honors in clerkship in desired specialty
Gaps in medical education
Grades in required clerkships
USMLE/COMLEX Step 2 score
Honors in clinical clerkships
Class ranking/quartile
Medical Student Performance Evaluation(MSPE/Dean's Letter)
Personal prior knowledge of the applicant
4.9
4.7
4.7
4.6
4.4
4.6
4.2
4.0
3.9
4.2
4.2
4.0
4.1
4.2
4.2
4.0
4.2
4.3
3.9
3.8
N=74
*Ratings on a scale from 1 (not at all important) to 5 (very important).
NRMP Program Director Survey Results, 2012 13

Figure AN-2Anesthesiology
Mean Importance Ratings* of Factors in Ranking Applicants
(continued)
0 1 2 3 4 5
Consistency of grades
Perceived interest in program
Visa status**
Audition elective/rotation within your department
Graduate of highly regarded U.S. medical school
Alpha Omega Alpha (AOA) membership
Fluency in language spoken by your patientpopulation
Personal Statement
Other life experience
Demonstrated involvement and interest inresearch
Honors in basic sciences
Volunteer/extracurricular experiences
USMLE/COMLEX Step 3 score**
Other post-interview contact
Interest in academic career
Gold Society membership
Second interview/visit
Away rotation in your specialty at anotherinstitution
4.0
3.7
3.6
3.6
3.7
3.8
3.1
3.1
3.3
3.0
3.5
2.8
3.0
2.6
2.8
2.7
2.3
2.1
N=74
*Ratings on a scale from 1 (not at all important) to 5 (very important).
** International Medical Graduates only
NRMP Program Director Survey Results, 2012 14

100
120
140
160
180
200
220
240
260
280
Anesthesiology
Programs That Use USMLE Step 1 and Step 2 Clinical Knowledge (CK) Scores When
Considering Which Applicants to Interview
Figure AN-3
Percentage of Programs That Use USMLE Step 2 (CK) Score
0%
10%
20%
30%
40%
50%
60%
70%
80%
90%
100%
Never Seldom Often
35%
62%
3%
Would your program consider applicants who failtheir exam on the 1st attempt?
0%
10%
20%
30%
40%
50%
60%
70%
80%
90%
100%
Never Seldom often
51% 49%
0%
Would your program consider applicants who failtheir exam on the 1st attempt?
0%
10%
20%
30%
40%
50%
60%
70%
80%
90%
100%
Yes, pass only Yes, target score No
18%
82%
0%
Scores required?
0%
10%
20%
30%
40%
50%
60%
70%
80%
90%
100%
Yes, pass only Yes, target score No
17%
57%
26%
Scores required?
N=87
N=69
N=81 N=61
N=46N=64 N=48 N=36
Average USMLE Step 1 and Step 2 CK Scores Programs
Consider When Granting Interviews
Percentage of Programs That Use USMLE Step 1 Score
100
120
140
160
180
200
220
240
260
280
USMLE Step 2 CKUSMLE Step 1 USMLE Step 1 USMLE Step 2 CK
The boxes in the boxplots above represent the interquartile range (or IQR, which is the range between the 25th and 75th
percentiles) and the line in the box is the median. The x-shaped symbol is the mean.
Scores Above Which Programs
Almost Always Grant Interviews
Scores Below Which Programs
Generally Does Not Grant Interviews
NRMP Program Director Survey Results, 2012 15

0%
10%
20%
30%
40%
50%
60%
70%
80%
90%
100%
Yes, pass only Yes, target score No
29%
54%
17%
COMLEX-USA Level 1*
N=76
0%
10%
20%
30%
40%
50%
60%
70%
80%
90%
100%
Yes, pass only No
67%
33%
USMLE Step 2 CS
Anesthesiology
Percentage of Programs That Use USMLE Step 2 Clinical Skill (CS), Step 3, and
COMLEX-USA Scores* When Considering Which Applicants to Interview
Figure AN-4
0%
10%
20%
30%
40%
50%
60%
70%
80%
90%
100%
Yes, pass only Yes, target score No
29% 31%
39%
COMLEX-USA Level 2-CE*
N=53
0%
10%
20%
30%
40%
50%
60%
70%
80%
90%
100%
Yes, pass only Yes, target score No
21%
11%
68%
USMLE Step 3
0%
10%
20%
30%
40%
50%
60%
70%
80%
90%
100%
Yes, pass only Yes, target score No
29%
3%
69%
COMLEX-USA Level 3*
0%
10%
20%
30%
40%
50%
60%
70%
80%
90%
100%
Yes, pass only Yes, target score No
53%
4%
43%
COMLEX-USA Level 2-PE*
N=76 N=53
N=59 N=51
N=47 N=35
* Osteopathic applicants only
Percentage of Programs That Use USMLE Step 2 CS and Step 3 Scores
Percentage of Programs That Use COMLEX-USA Level 1 and Level 2-CE Scores
Percentage of Programs That Use COMLEX-USA Level 2-PE and Level 3 Scores
NRMP Program Director Survey Results, 2012 16

0%
10%
20%
30%
40%
50%
60%
70%
80%
90%
100%100%
84% 83%
54%
45%
68%
52%
U.S. Senior U.S. Grad Osteopathic Canadian Fifth Pathway U.S. IMG Non-U.S. IMG
Percentage of Programs that Typically Interview and Rank Each Applicant Groups
Figure AN-5Anesthesiology
Program's Interview Activities
0%
10%
20%
30%
40%
50%
60%
70%
80%
90%
100%
0% 1-24% 25-49% 50-74% 75-99% 100%
7% 8%
17%22%
37%
8%
Percentage of Program's Interview Slots Extended Prior to the November 1st MSPE/Dean's Letter Release Date
0
100
200
300
400
500
600
700
800
900
1,000
Number ofapplications
received
Number ofapplicants
interviewed
Number ofapplicants ranked
Number ofpositions in The
Match
719
117 98
8
Average Number of Applications Received, ApplicantsInterviewed and Ranked and Positions in The Match
0%
10%
20%
30%
40%
50%
60%
70%
80%
90%
100%
Percentage of applicationsrejected
Percentage of applicantsreceiving an interview
48% 46%
Average Percentage of Applications Rejected andReviewed
N=86
N=86N=83N=88*N=88*N=86N=86
N=87
39% of Anesthesiology programs consider all applicants
* Data from the NRMP database
NRMP Program Director Survey Results, 2012 17

Child Neurology (N=46)
NRMP Program Director Survey Results, 2012 18

Figure CN-1Child Neurology
Percentage of Programs Citing Each Factor in Selecting Applicants to Interview
0% 20% 40% 60% 80% 100%
USMLE/COMLEX Step 1 score
Letters of recommendation in the specialty
Personal Statement
Grades in required clerkships
USMLE/COMLEX Step 2 score
Grades in clerkship in desired specialty
Graduate of U.S. allopathic medical school
Medical Student Performance Evaluation(MSPE/Dean's Letter)
Class ranking/quartile
Gaps in medical education
Personal prior knowledge of the applicant
Perceived commitment to specialty
Honors in clinical clerkships
Applicant was flagged with Match violation by theNRMP
Volunteer/extracurricular experiences
Other life experience
Honors in clerkship in desired specialty
Consistency of grades
Audition elective/rotation within your department
78%
88%
73%
66%
54%
71%
49%
80%
73%
68%
66%
73%
61%
66%
56%
61%
61%
63%
66%
N=41
NRMP Program Director Survey Results, 2012 19

Figure CN-1Child Neurology
Percentage of Programs Citing Each Factor in Selecting Applicants to Interview
(continued)
0% 20% 40% 60% 80% 100%
Evidence of professionalism and ethics
Interpersonal skills
Perceived interest in program
Graduate of highly regarded U.S. medical school
Leadership qualities
Alpha Omega Alpha (AOA) membership
Demonstrated involvement and interest in research
Feedback from current residents
Visa status*
Honors in basic sciences
Fluency in language spoken by your patient population
Interest in academic career
Away rotation in your specialty at another institution
USMLE/COMLEX Step 3 score*
Other post-interview contact
Gold Society membership
59%
56%
51%
56%
51%
46%
54%
39%
59%
49%
44%
46%
32%
39%
32%
17%
N=41
* International Medical Graduates only
NRMP Program Director Survey Results, 2012 20

Child Neurology
Mean Importance Ratings* of Factors in Ranking Applicants
Figure CN-2
0 1 2 3 4 5
Applicant was flagged with Match violation by theNRMP
Interactions with faculty during interview and visit
Interpersonal skills
Interactions with housestaff during interview andvisit
Feedback from current residents
Evidence of professionalism and ethics
Grades in clerkship in desired specialty
Perceived commitment to specialty
Letters of recommendation in the specialty
Graduate of U.S. allopathic medical school
USMLE/COMLEX Step 1 score
Leadership qualities
Honors in clerkship in desired specialty
Gaps in medical education
Grades in required clerkships
USMLE/COMLEX Step 2 score
Honors in clinical clerkships
Class ranking/quartile
Medical Student Performance Evaluation(MSPE/Dean's Letter)
Personal prior knowledge of the applicant
4.8
4.6
4.7
4.5
4.4
4.4
4.3
4.3
4.4
3.6
4.1
4.1
4.1
3.8
3.8
4.1
3.8
3.8
4.1
4.1
N=41
*Ratings on a scale from 1 (not at all important) to 5 (very important).
NRMP Program Director Survey Results, 2012 21

Figure CN-2Child Neurology
Mean Importance Ratings* of Factors in Ranking Applicants
(continued)
0 1 2 3 4 5
Consistency of grades
Perceived interest in program
Visa status**
Audition elective/rotation within your department
Graduate of highly regarded U.S. medical school
Alpha Omega Alpha (AOA) membership
Fluency in language spoken by your patientpopulation
Personal Statement
Other life experience
Demonstrated involvement and interest inresearch
Honors in basic sciences
Volunteer/extracurricular experiences
USMLE/COMLEX Step 3 score**
Other post-interview contact
Interest in academic career
Gold Society membership
Second interview/visit
Away rotation in your specialty at anotherinstitution
3.6
4.0
4.0
3.9
3.6
3.4
3.7
3.6
3.3
3.5
3.2
3.1
3.5
3.4
3.5
2.7
3.1
2.8
N=41
*Ratings on a scale from 1 (not at all important) to 5 (very important).
** International Medical Graduates only
NRMP Program Director Survey Results, 2012 22

100
120
140
160
180
200
220
240
260
280
Child Neurology
Programs That Use USMLE Step 1 and Step 2 Clinical Knowledge (CK) Scores When
Considering Which Applicants to Interview
Figure CN-3
Percentage of Programs That Use USMLE Step 2 (CK) Score
0%
10%
20%
30%
40%
50%
60%
70%
80%
90%
100%
Never Seldom Often
11%
82%
8%
Would your program consider applicants who failtheir exam on the 1st attempt?
0%
10%
20%
30%
40%
50%
60%
70%
80%
90%
100%
Never Seldom often
18%
76%
6%
Would your program consider applicants who failtheir exam on the 1st attempt?
0%
10%
20%
30%
40%
50%
60%
70%
80%
90%
100%
Yes, pass only Yes, target score No
43%
55%
2%
Scores required?
0%
10%
20%
30%
40%
50%
60%
70%
80%
90%
100%
Yes, pass only Yes, target score No
35%
45%
20%
Scores required?
N=44
N=38
N=40 N=33
N=14N=19 N=11 N=7
Average USMLE Step 1 and Step 2 CK Scores Programs
Consider When Granting Interviews
Percentage of Programs That Use USMLE Step 1 Score
100
120
140
160
180
200
220
240
260
280
USMLE Step 2 CKUSMLE Step 1 USMLE Step 1 USMLE Step 2 CK
The boxes in the boxplots above represent the interquartile range (or IQR, which is the range between the 25th and 75th
percentiles) and the line in the box is the median. The x-shaped symbol is the mean.
Scores Above Which Programs
Almost Always Grant Interviews
Scores Below Which Programs
Generally Does Not Grant Interviews
NRMP Program Director Survey Results, 2012 23

0%
10%
20%
30%
40%
50%
60%
70%
80%
90%
100%
Yes, pass only Yes, target score No
48%
30%
21%
COMLEX-USA Level 1*
N=40
0%
10%
20%
30%
40%
50%
60%
70%
80%
90%
100%
Yes, pass only No
75%
25%
USMLE Step 2 CS
Child Neurology
Percentage of Programs That Use USMLE Step 2 Clinical Skill (CS), Step 3, and
COMLEX-USA Scores* When Considering Which Applicants to Interview
Figure CN-4
0%
10%
20%
30%
40%
50%
60%
70%
80%
90%
100%
Yes, pass only Yes, target score No
45%
26%29%
COMLEX-USA Level 2-CE*
N=33
0%
10%
20%
30%
40%
50%
60%
70%
80%
90%
100%
Yes, pass only Yes, target score No
18%
27%
55%
USMLE Step 3
0%
10%
20%
30%
40%
50%
60%
70%
80%
90%
100%
Yes, pass only Yes, target score No
33%
15%
52%
COMLEX-USA Level 3*
0%
10%
20%
30%
40%
50%
60%
70%
80%
90%
100%
Yes, pass only Yes, target score No
48%
21%
31%
COMLEX-USA Level 2-PE*
N=40 N=33
N=33 N=31
N=29 N=27
* Osteopathic applicants only
Percentage of Programs That Use USMLE Step 2 CS and Step 3 Scores
Percentage of Programs That Use COMLEX-USA Level 1 and Level 2-CE Scores
Percentage of Programs That Use COMLEX-USA Level 2-PE and Level 3 Scores
NRMP Program Director Survey Results, 2012 24

0%
10%
20%
30%
40%
50%
60%
70%
80%
90%
100% 98%
84% 86% 86%
61%
77% 77%
U.S. Senior U.S. Grad Osteopathic Canadian Fifth Pathway U.S. IMG Non-U.S. IMG
Percentage of Programs that Typically Interview and Rank Each Applicant Groups
Figure CN-5Child Neurology
Program's Interview Activities
0%
10%
20%
30%
40%
50%
60%
70%
80%
90%
100%
0% 1-24% 25-49% 50-74% 75-99% 100%
19% 19%
7%
24% 21%
10%
Percentage of Program's Interview Slots Extended Prior to the November 1st MSPE/Dean's Letter Release Date
0
100
200
300
400
500
600
700
800
900
1,000
Number ofapplications
received
Number ofapplicants
interviewed
Number ofapplicants ranked
Number ofpositions in The
Match
5117 12 2
Average Number of Applications Received, ApplicantsInterviewed and Ranked and Positions in The Match
0%
10%
20%
30%
40%
50%
60%
70%
80%
90%
100%
Percentage of applicationsrejected
Percentage of applicantsreceiving an interview
31%
73%
Average Percentage of Applications Rejected andReviewed
N=42
N=43N=43N=46*N=46*N=43N=43
N=44
61% of Child Neurology programs consider all applicants
* Data from the NRMP database
NRMP Program Director Survey Results, 2012 25

Dermatology (N=53)
NRMP Program Director Survey Results, 2012 26

Figure D-1Dermatology
Percentage of Programs Citing Each Factor in Selecting Applicants to Interview
0% 20% 40% 60% 80% 100%
USMLE/COMLEX Step 1 score
Letters of recommendation in the specialty
Personal Statement
Grades in required clerkships
USMLE/COMLEX Step 2 score
Grades in clerkship in desired specialty
Graduate of U.S. allopathic medical school
Medical Student Performance Evaluation(MSPE/Dean's Letter)
Class ranking/quartile
Gaps in medical education
Personal prior knowledge of the applicant
Perceived commitment to specialty
Honors in clinical clerkships
Applicant was flagged with Match violation by theNRMP
Volunteer/extracurricular experiences
Other life experience
Honors in clerkship in desired specialty
Consistency of grades
Audition elective/rotation within your department
70%
77%
74%
60%
45%
57%
72%
85%
70%
49%
49%
55%
64%
51%
66%
55%
55%
51%
51%
N=47
NRMP Program Director Survey Results, 2012 27

Figure D-1Dermatology
Percentage of Programs Citing Each Factor in Selecting Applicants to Interview
(continued)
0% 20% 40% 60% 80% 100%
Evidence of professionalism and ethics
Interpersonal skills
Perceived interest in program
Graduate of highly regarded U.S. medical school
Leadership qualities
Alpha Omega Alpha (AOA) membership
Demonstrated involvement and interest in research
Feedback from current residents
Visa status*
Honors in basic sciences
Fluency in language spoken by your patient population
Interest in academic career
Away rotation in your specialty at another institution
USMLE/COMLEX Step 3 score*
Other post-interview contact
Gold Society membership
60%
64%
57%
40%
60%
57%
62%
62%
26%
40%
28%
47%
30%
13%
17%
15%
N=47
* International Medical Graduates only
NRMP Program Director Survey Results, 2012 28

Dermatology
Mean Importance Ratings* of Factors in Ranking Applicants
Figure D-2
0 1 2 3 4 5
Applicant was flagged with Match violation by theNRMP
Interactions with faculty during interview and visit
Interpersonal skills
Interactions with housestaff during interview andvisit
Feedback from current residents
Evidence of professionalism and ethics
Grades in clerkship in desired specialty
Perceived commitment to specialty
Letters of recommendation in the specialty
Graduate of U.S. allopathic medical school
USMLE/COMLEX Step 1 score
Leadership qualities
Honors in clerkship in desired specialty
Gaps in medical education
Grades in required clerkships
USMLE/COMLEX Step 2 score
Honors in clinical clerkships
Class ranking/quartile
Medical Student Performance Evaluation(MSPE/Dean's Letter)
Personal prior knowledge of the applicant
4.4
4.9
4.8
4.7
4.6
4.7
4.2
4.3
4.5
4.2
4.2
4.4
4.3
3.3
4.1
3.7
4.3
3.9
3.6
4.1
N=47
*Ratings on a scale from 1 (not at all important) to 5 (very important).
NRMP Program Director Survey Results, 2012 29

Figure D-2Dermatology
Mean Importance Ratings* of Factors in Ranking Applicants
(continued)
0 1 2 3 4 5
Consistency of grades
Perceived interest in program
Visa status**
Audition elective/rotation within your department
Graduate of highly regarded U.S. medical school
Alpha Omega Alpha (AOA) membership
Fluency in language spoken by your patientpopulation
Personal Statement
Other life experience
Demonstrated involvement and interest inresearch
Honors in basic sciences
Volunteer/extracurricular experiences
USMLE/COMLEX Step 3 score**
Other post-interview contact
Interest in academic career
Gold Society membership
Second interview/visit
Away rotation in your specialty at anotherinstitution
4.0
4.1
3.6
3.9
3.5
3.4
3.1
3.9
3.4
3.7
3.4
3.5
3.0
2.9
3.4
2.7
2.8
2.7
N=47
*Ratings on a scale from 1 (not at all important) to 5 (very important).
** International Medical Graduates only
NRMP Program Director Survey Results, 2012 30

100
120
140
160
180
200
220
240
260
280
Dermatology
Programs That Use USMLE Step 1 and Step 2 Clinical Knowledge (CK) Scores When
Considering Which Applicants to Interview
Figure D-3
Percentage of Programs That Use USMLE Step 2 (CK) Score
0%
10%
20%
30%
40%
50%
60%
70%
80%
90%
100%
Never Seldom Often
61%
39%
0%
Would your program consider applicants who failtheir exam on the 1st attempt?
0%
10%
20%
30%
40%
50%
60%
70%
80%
90%
100%
Never Seldom often
68%
32%
0%
Would your program consider applicants who failtheir exam on the 1st attempt?
0%
10%
20%
30%
40%
50%
60%
70%
80%
90%
100%
Yes, pass only Yes, target score No
22%
78%
0%
Scores required?
0%
10%
20%
30%
40%
50%
60%
70%
80%
90%
100%
Yes, pass only Yes, target score No
17%
34%
49%
Scores required?
N=51
N=36
N=47 N=25
N=17N=36 N=12 N=6
Average USMLE Step 1 and Step 2 CK Scores Programs
Consider When Granting Interviews
Percentage of Programs That Use USMLE Step 1 Score
100
120
140
160
180
200
220
240
260
280
USMLE Step 2 CKUSMLE Step 1 USMLE Step 1 USMLE Step 2 CK
The boxes in the boxplots above represent the interquartile range (or IQR, which is the range between the 25th and 75th
percentiles) and the line in the box is the median. The x-shaped symbol is the mean.
Scores Above Which Programs
Almost Always Grant Interviews
Scores Below Which Programs
Generally Does Not Grant Interviews
NRMP Program Director Survey Results, 2012 31

0%
10%
20%
30%
40%
50%
60%
70%
80%
90%
100%
Yes, pass only Yes, target score No
13%9%
78%
COMLEX-USA Level 1*
N=41
0%
10%
20%
30%
40%
50%
60%
70%
80%
90%
100%
Yes, pass only No
46%54%
USMLE Step 2 CS
Dermatology
Percentage of Programs That Use USMLE Step 2 Clinical Skill (CS), Step 3, and
COMLEX-USA Scores* When Considering Which Applicants to Interview
Figure D-4
0%
10%
20%
30%
40%
50%
60%
70%
80%
90%
100%
Yes, pass only Yes, target score No
0%
9%
91%
COMLEX-USA Level 2-CE*
N=37
0%
10%
20%
30%
40%
50%
60%
70%
80%
90%
100%
Yes, pass only Yes, target score No
11%16%
73%
USMLE Step 3
0%
10%
20%
30%
40%
50%
60%
70%
80%
90%
100%
Yes, pass only Yes, target score No
0%5%
95%
COMLEX-USA Level 3*
0%
10%
20%
30%
40%
50%
60%
70%
80%
90%
100%
Yes, pass only Yes, target score No
4% 4%
91%
COMLEX-USA Level 2-PE*
N=41 N=37
N=23 N=23
N=23 N=21
* Osteopathic applicants only
Percentage of Programs That Use USMLE Step 2 CS and Step 3 Scores
Percentage of Programs That Use COMLEX-USA Level 1 and Level 2-CE Scores
Percentage of Programs That Use COMLEX-USA Level 2-PE and Level 3 Scores
NRMP Program Director Survey Results, 2012 32

0%
10%
20%
30%
40%
50%
60%
70%
80%
90%
100% 98%
67%
31% 33%
21%
33%
23%
U.S. Senior U.S. Grad Osteopathic Canadian Fifth Pathway U.S. IMG Non-U.S. IMG
Percentage of Programs that Typically Interview and Rank Each Applicant Groups
Figure D-5Dermatology
Program's Interview Activities
0%
10%
20%
30%
40%
50%
60%
70%
80%
90%
100%
0% 1-24% 25-49% 50-74% 75-99% 100%
90%
2% 2% 2% 4%0%
Percentage of Program's Interview Slots Extended Prior to the November 1st MSPE/Dean's Letter Release Date
0
100
200
300
400
500
600
700
800
900
1,000
Number ofapplications
received
Number ofapplicants
interviewed
Number ofapplicants ranked
Number ofpositions in The
Match
332
33 273
Average Number of Applications Received, ApplicantsInterviewed and Ranked and Positions in The Match
0%
10%
20%
30%
40%
50%
60%
70%
80%
90%
100%
Percentage of applicationsrejected
Percentage of applicantsreceiving an interview
37%
57%
Average Percentage of Applications Rejected andReviewed
N=51
N=51N=51N=53*N=53*N=53N=50
N=52
19% of Dermatology programs consider all applicants
* Data from the NRMP database
NRMP Program Director Survey Results, 2012 33

Emergency Medicine (N=98)
NRMP Program Director Survey Results, 2012 34

Figure EM-1Emergency Medicine
Percentage of Programs Citing Each Factor in Selecting Applicants to Interview
0% 20% 40% 60% 80% 100%
USMLE/COMLEX Step 1 score
Letters of recommendation in the specialty
Personal Statement
Grades in required clerkships
USMLE/COMLEX Step 2 score
Grades in clerkship in desired specialty
Graduate of U.S. allopathic medical school
Medical Student Performance Evaluation(MSPE/Dean's Letter)
Class ranking/quartile
Gaps in medical education
Personal prior knowledge of the applicant
Perceived commitment to specialty
Honors in clinical clerkships
Applicant was flagged with Match violation by theNRMP
Volunteer/extracurricular experiences
Other life experience
Honors in clerkship in desired specialty
Consistency of grades
Audition elective/rotation within your department
75%
93%
68%
80%
63%
86%
76%
70%
73%
65%
67%
69%
74%
57%
69%
69%
80%
65%
78%
N=88
NRMP Program Director Survey Results, 2012 35

Figure EM-1Emergency Medicine
Percentage of Programs Citing Each Factor in Selecting Applicants to Interview
(continued)
0% 20% 40% 60% 80% 100%
Evidence of professionalism and ethics
Interpersonal skills
Perceived interest in program
Graduate of highly regarded U.S. medical school
Leadership qualities
Alpha Omega Alpha (AOA) membership
Demonstrated involvement and interest in research
Feedback from current residents
Visa status*
Honors in basic sciences
Fluency in language spoken by your patient population
Interest in academic career
Away rotation in your specialty at another institution
USMLE/COMLEX Step 3 score*
Other post-interview contact
Gold Society membership
60%
64%
44%
59%
61%
57%
56%
53%
41%
43%
28%
38%
64%
25%
23%
25%
N=88
* International Medical Graduates only
NRMP Program Director Survey Results, 2012 36

Emergency Medicine
Mean Importance Ratings* of Factors in Ranking Applicants
Figure EM-2
0 1 2 3 4 5
Applicant was flagged with Match violation by theNRMP
Interactions with faculty during interview and visit
Interpersonal skills
Interactions with housestaff during interview andvisit
Feedback from current residents
Evidence of professionalism and ethics
Grades in clerkship in desired specialty
Perceived commitment to specialty
Letters of recommendation in the specialty
Graduate of U.S. allopathic medical school
USMLE/COMLEX Step 1 score
Leadership qualities
Honors in clerkship in desired specialty
Gaps in medical education
Grades in required clerkships
USMLE/COMLEX Step 2 score
Honors in clinical clerkships
Class ranking/quartile
Medical Student Performance Evaluation(MSPE/Dean's Letter)
Personal prior knowledge of the applicant
4.8
4.8
4.7
4.7
4.6
4.4
4.6
3.8
4.8
4.3
3.7
3.9
4.4
3.6
3.9
3.8
4.0
3.6
3.6
3.9
N=88
*Ratings on a scale from 1 (not at all important) to 5 (very important).
NRMP Program Director Survey Results, 2012 37

Figure EM-2Emergency Medicine
Mean Importance Ratings* of Factors in Ranking Applicants
(continued)
0 1 2 3 4 5
Consistency of grades
Perceived interest in program
Visa status**
Audition elective/rotation within your department
Graduate of highly regarded U.S. medical school
Alpha Omega Alpha (AOA) membership
Fluency in language spoken by your patientpopulation
Personal Statement
Other life experience
Demonstrated involvement and interest inresearch
Honors in basic sciences
Volunteer/extracurricular experiences
USMLE/COMLEX Step 3 score**
Other post-interview contact
Interest in academic career
Gold Society membership
Second interview/visit
Away rotation in your specialty at anotherinstitution
3.4
3.2
3.4
4.2
3.3
3.4
2.9
2.6
3.1
2.7
2.5
2.8
3.0
2.6
2.5
2.7
2.5
3.8
N=88
*Ratings on a scale from 1 (not at all important) to 5 (very important).
** International Medical Graduates only
NRMP Program Director Survey Results, 2012 38

100
120
140
160
180
200
220
240
260
280
Emergency Medicine
Programs That Use USMLE Step 1 and Step 2 Clinical Knowledge (CK) Scores When
Considering Which Applicants to Interview
Figure EM-3
Percentage of Programs That Use USMLE Step 2 (CK) Score
0%
10%
20%
30%
40%
50%
60%
70%
80%
90%
100%
Never Seldom Often
16%
77%
7%
Would your program consider applicants who failtheir exam on the 1st attempt?
0%
10%
20%
30%
40%
50%
60%
70%
80%
90%
100%
Never Seldom often
42%
58%
0%
Would your program consider applicants who failtheir exam on the 1st attempt?
0%
10%
20%
30%
40%
50%
60%
70%
80%
90%
100%
Yes, pass only Yes, target score No
46%
54%
0%
Scores required?
0%
10%
20%
30%
40%
50%
60%
70%
80%
90%
100%
Yes, pass only Yes, target score No
25%
45%
30%
Scores required?
N=96
N=83
N=92 N=69
N=35N=47 N=32 N=27
Average USMLE Step 1 and Step 2 CK Scores Programs
Consider When Granting Interviews
Percentage of Programs That Use USMLE Step 1 Score
100
120
140
160
180
200
220
240
260
280
USMLE Step 2 CKUSMLE Step 1 USMLE Step 1 USMLE Step 2 CK
The boxes in the boxplots above represent the interquartile range (or IQR, which is the range between the 25th and 75th
percentiles) and the line in the box is the median. The x-shaped symbol is the mean.
Scores Above Which Programs
Almost Always Grant Interviews
Scores Below Which Programs
Generally Does Not Grant Interviews
NRMP Program Director Survey Results, 2012 39

0%
10%
20%
30%
40%
50%
60%
70%
80%
90%
100%
Yes, pass only Yes, target score No
38%
27%
35%
COMLEX-USA Level 1*
N=88
0%
10%
20%
30%
40%
50%
60%
70%
80%
90%
100%
Yes, pass only No
67%
33%
USMLE Step 2 CS
Emergency Medicine
Percentage of Programs That Use USMLE Step 2 Clinical Skill (CS), Step 3, and
COMLEX-USA Scores* When Considering Which Applicants to Interview
Figure EM-4
0%
10%
20%
30%
40%
50%
60%
70%
80%
90%
100%
Yes, pass only Yes, target score No
29%
20%
51%
COMLEX-USA Level 2-CE*
N=58
0%
10%
20%
30%
40%
50%
60%
70%
80%
90%
100%
Yes, pass only Yes, target score No
14%
5%
81%
USMLE Step 3
0%
10%
20%
30%
40%
50%
60%
70%
80%
90%
100%
Yes, pass only Yes, target score No
15%9%
76%
COMLEX-USA Level 3*
0%
10%
20%
30%
40%
50%
60%
70%
80%
90%
100%
Yes, pass only Yes, target score No
35%
7%
57%
COMLEX-USA Level 2-PE*
N=88 N=58
N=63 N=59
N=54 N=46
* Osteopathic applicants only
Percentage of Programs That Use USMLE Step 2 CS and Step 3 Scores
Percentage of Programs That Use COMLEX-USA Level 1 and Level 2-CE Scores
Percentage of Programs That Use COMLEX-USA Level 2-PE and Level 3 Scores
NRMP Program Director Survey Results, 2012 40

0%
10%
20%
30%
40%
50%
60%
70%
80%
90%
100%100%
72%68%
35%
23%
41%
26%
U.S. Senior U.S. Grad Osteopathic Canadian Fifth Pathway U.S. IMG Non-U.S. IMG
Percentage of Programs that Typically Interview and Rank Each Applicant Groups
Figure EM-5Emergency Medicine
Program's Interview Activities
0%
10%
20%
30%
40%
50%
60%
70%
80%
90%
100%
0% 1-24% 25-49% 50-74% 75-99% 100%
12%
20%14%
32%
22%
1%
Percentage of Program's Interview Slots Extended Prior to the November 1st MSPE/Dean's Letter Release Date
0
100
200
300
400
500
600
700
800
900
1,000
Number ofapplications
received
Number ofapplicants
interviewed
Number ofapplicants ranked
Number ofpositions in The
Match
719
132 117
11
Average Number of Applications Received, ApplicantsInterviewed and Ranked and Positions in The Match
0%
10%
20%
30%
40%
50%
60%
70%
80%
90%
100%
Percentage of applicationsrejected
Percentage of applicantsreceiving an interview
39%
57%
Average Percentage of Applications Rejected andReviewed
N=95
N=96N=96N=98*N=98*N=96N=97
N=96
20% of Emergency Medicine programs consider all applicants
* Data from the NRMP database
NRMP Program Director Survey Results, 2012 41

Family Medicine (N=235)
NRMP Program Director Survey Results, 2012 42

Figure FM-1Family Medicine
Percentage of Programs Citing Each Factor in Selecting Applicants to Interview
0% 20% 40% 60% 80% 100%
USMLE/COMLEX Step 1 score
Letters of recommendation in the specialty
Personal Statement
Grades in required clerkships
USMLE/COMLEX Step 2 score
Grades in clerkship in desired specialty
Graduate of U.S. allopathic medical school
Medical Student Performance Evaluation(MSPE/Dean's Letter)
Class ranking/quartile
Gaps in medical education
Personal prior knowledge of the applicant
Perceived commitment to specialty
Honors in clinical clerkships
Applicant was flagged with Match violation by theNRMP
Volunteer/extracurricular experiences
Other life experience
Honors in clerkship in desired specialty
Consistency of grades
Audition elective/rotation within your department
87%
76%
82%
61%
82%
61%
62%
57%
50%
72%
60%
73%
47%
66%
61%
59%
48%
52%
58%
N=205
NRMP Program Director Survey Results, 2012 43

Figure FM-1Family Medicine
Percentage of Programs Citing Each Factor in Selecting Applicants to Interview
(continued)
0% 20% 40% 60% 80% 100%
Evidence of professionalism and ethics
Interpersonal skills
Perceived interest in program
Graduate of highly regarded U.S. medical school
Leadership qualities
Alpha Omega Alpha (AOA) membership
Demonstrated involvement and interest in research
Feedback from current residents
Visa status*
Honors in basic sciences
Fluency in language spoken by your patient population
Interest in academic career
Away rotation in your specialty at another institution
USMLE/COMLEX Step 3 score*
Other post-interview contact
Gold Society membership
52%
52%
55%
40%
44%
24%
17%
46%
58%
34%
41%
15%
20%
31%
30%
18%
N=205
* International Medical Graduates only
NRMP Program Director Survey Results, 2012 44

Family Medicine
Mean Importance Ratings* of Factors in Ranking Applicants
Figure FM-2
0 1 2 3 4 5
Applicant was flagged with Match violation by theNRMP
Interactions with faculty during interview and visit
Interpersonal skills
Interactions with housestaff during interview andvisit
Feedback from current residents
Evidence of professionalism and ethics
Grades in clerkship in desired specialty
Perceived commitment to specialty
Letters of recommendation in the specialty
Graduate of U.S. allopathic medical school
USMLE/COMLEX Step 1 score
Leadership qualities
Honors in clerkship in desired specialty
Gaps in medical education
Grades in required clerkships
USMLE/COMLEX Step 2 score
Honors in clinical clerkships
Class ranking/quartile
Medical Student Performance Evaluation(MSPE/Dean's Letter)
Personal prior knowledge of the applicant
4.9
4.8
4.7
4.7
4.7
4.6
3.8
4.6
4.1
4.0
3.8
4.0
3.6
4.3
3.5
4.0
3.4
3.4
3.8
3.9
N=205
*Ratings on a scale from 1 (not at all important) to 5 (very important).
NRMP Program Director Survey Results, 2012 45

Figure FM-2Family Medicine
Mean Importance Ratings* of Factors in Ranking Applicants
(continued)
0 1 2 3 4 5
Consistency of grades
Perceived interest in program
Visa status**
Audition elective/rotation within your department
Graduate of highly regarded U.S. medical school
Alpha Omega Alpha (AOA) membership
Fluency in language spoken by your patientpopulation
Personal Statement
Other life experience
Demonstrated involvement and interest inresearch
Honors in basic sciences
Volunteer/extracurricular experiences
USMLE/COMLEX Step 3 score**
Other post-interview contact
Interest in academic career
Gold Society membership
Second interview/visit
Away rotation in your specialty at anotherinstitution
3.5
3.9
3.9
3.8
3.3
2.6
3.6
3.8
3.3
2.1
2.6
3.3
3.3
3.4
2.1
2.5
3.2
2.2
N=205
*Ratings on a scale from 1 (not at all important) to 5 (very important).
** International Medical Graduates only
NRMP Program Director Survey Results, 2012 46

100
120
140
160
180
200
220
240
260
280
Family Medicine
Programs That Use USMLE Step 1 and Step 2 Clinical Knowledge (CK) Scores When
Considering Which Applicants to Interview
Figure FM-3
Percentage of Programs That Use USMLE Step 2 (CK) Score
0%
10%
20%
30%
40%
50%
60%
70%
80%
90%
100%
Never Seldom Often
3%
54%
42%
Would your program consider applicants who failtheir exam on the 1st attempt?
0%
10%
20%
30%
40%
50%
60%
70%
80%
90%
100%
Never Seldom often
8%
67%
25%
Would your program consider applicants who failtheir exam on the 1st attempt?
0%
10%
20%
30%
40%
50%
60%
70%
80%
90%
100%
Yes, pass only Yes, target score No
66%
34%
0%
Scores required?
0%
10%
20%
30%
40%
50%
60%
70%
80%
90%
100%
Yes, pass only Yes, target score No
58%
35%
7%
Scores required?
N=229
N=173
N=226 N=170
N=53N=57 N=43 N=38
Average USMLE Step 1 and Step 2 CK Scores Programs
Consider When Granting Interviews
Percentage of Programs That Use USMLE Step 1 Score
100
120
140
160
180
200
220
240
260
280
USMLE Step 2 CKUSMLE Step 1 USMLE Step 1 USMLE Step 2 CK
The boxes in the boxplots above represent the interquartile range (or IQR, which is the range between the 25th and 75th
percentiles) and the line in the box is the median. The x-shaped symbol is the mean.
Scores Above Which Programs
Almost Always Grant Interviews
Scores Below Which Programs
Generally Does Not Grant Interviews
NRMP Program Director Survey Results, 2012 47

0%
10%
20%
30%
40%
50%
60%
70%
80%
90%
100%
Yes, pass only Yes, target score No
72%
27%
1%
COMLEX-USA Level 1*
N=223
0%
10%
20%
30%
40%
50%
60%
70%
80%
90%
100%
Yes, pass only No
91%
9%
USMLE Step 2 CS
Family Medicine
Percentage of Programs That Use USMLE Step 2 Clinical Skill (CS), Step 3, and
COMLEX-USA Scores* When Considering Which Applicants to Interview
Figure FM-4
0%
10%
20%
30%
40%
50%
60%
70%
80%
90%
100%
Yes, pass only Yes, target score No
66%
27%
7%
COMLEX-USA Level 2-CE*
N=150
0%
10%
20%
30%
40%
50%
60%
70%
80%
90%
100%
Yes, pass only Yes, target score No
25%
7%
67%
USMLE Step 3
0%
10%
20%
30%
40%
50%
60%
70%
80%
90%
100%
Yes, pass only Yes, target score No
29%
7%
64%
COMLEX-USA Level 3*
0%
10%
20%
30%
40%
50%
60%
70%
80%
90%
100%
Yes, pass only Yes, target score No
82%
8% 10%
COMLEX-USA Level 2-PE*
N=223 N=150
N=209 N=205
N=201 N=131
* Osteopathic applicants only
Percentage of Programs That Use USMLE Step 2 CS and Step 3 Scores
Percentage of Programs That Use COMLEX-USA Level 1 and Level 2-CE Scores
Percentage of Programs That Use COMLEX-USA Level 2-PE and Level 3 Scores
NRMP Program Director Survey Results, 2012 48

0%
10%
20%
30%
40%
50%
60%
70%
80%
90%
100% 99%
81%
93%
69%
55%
84%
61%
U.S. Senior U.S. Grad Osteopathic Canadian Fifth Pathway U.S. IMG Non-U.S. IMG
Percentage of Programs that Typically Interview and Rank Each Applicant Groups
Figure FM-5Family Medicine
Program's Interview Activities
0%
10%
20%
30%
40%
50%
60%
70%
80%
90%
100%
0% 1-24% 25-49% 50-74% 75-99% 100%
7%
15% 14%
24%
33%
6%
Percentage of Program's Interview Slots Extended Prior to the November 1st MSPE/Dean's Letter Release Date
0
100
200
300
400
500
600
700
800
900
1,000
Number ofapplications
received
Number ofapplicants
interviewed
Number ofapplicants ranked
Number ofpositions in The
Match
907
72 526
Average Number of Applications Received, ApplicantsInterviewed and Ranked and Positions in The Match
0%
10%
20%
30%
40%
50%
60%
70%
80%
90%
100%
Percentage of applicationsrejected
Percentage of applicantsreceiving an interview
68%
33%
Average Percentage of Applications Rejected andReviewed
N=222
N=226N=226N=235*N=235*N=232N=231
N=230
45% of Family Medicine programs consider all applicants
* Data from the NRMP database
NRMP Program Director Survey Results, 2012 49

General Surgery (N=164)
NRMP Program Director Survey Results, 2012 50

Figure GS-1General Surgery
Percentage of Programs Citing Each Factor in Selecting Applicants to Interview
0% 20% 40% 60% 80% 100%
USMLE/COMLEX Step 1 score
Letters of recommendation in the specialty
Personal Statement
Grades in required clerkships
USMLE/COMLEX Step 2 score
Grades in clerkship in desired specialty
Graduate of U.S. allopathic medical school
Medical Student Performance Evaluation(MSPE/Dean's Letter)
Class ranking/quartile
Gaps in medical education
Personal prior knowledge of the applicant
Perceived commitment to specialty
Honors in clinical clerkships
Applicant was flagged with Match violation by theNRMP
Volunteer/extracurricular experiences
Other life experience
Honors in clerkship in desired specialty
Consistency of grades
Audition elective/rotation within your department
84%
89%
74%
78%
73%
75%
71%
63%
66%
69%
65%
56%
64%
59%
65%
64%
69%
64%
59%
N=140
NRMP Program Director Survey Results, 2012 51

Figure GS-1General Surgery
Percentage of Programs Citing Each Factor in Selecting Applicants to Interview
(continued)
0% 20% 40% 60% 80% 100%
Evidence of professionalism and ethics
Interpersonal skills
Perceived interest in program
Graduate of highly regarded U.S. medical school
Leadership qualities
Alpha Omega Alpha (AOA) membership
Demonstrated involvement and interest in research
Feedback from current residents
Visa status*
Honors in basic sciences
Fluency in language spoken by your patient population
Interest in academic career
Away rotation in your specialty at another institution
USMLE/COMLEX Step 3 score*
Other post-interview contact
Gold Society membership
47%
51%
49%
54%
52%
60%
56%
54%
56%
49%
26%
43%
21%
24%
22%
22%
N=140
* International Medical Graduates only
NRMP Program Director Survey Results, 2012 52

General Surgery
Mean Importance Ratings* of Factors in Ranking Applicants
Figure GS-2
0 1 2 3 4 5
Applicant was flagged with Match violation by theNRMP
Interactions with faculty during interview and visit
Interpersonal skills
Interactions with housestaff during interview andvisit
Feedback from current residents
Evidence of professionalism and ethics
Grades in clerkship in desired specialty
Perceived commitment to specialty
Letters of recommendation in the specialty
Graduate of U.S. allopathic medical school
USMLE/COMLEX Step 1 score
Leadership qualities
Honors in clerkship in desired specialty
Gaps in medical education
Grades in required clerkships
USMLE/COMLEX Step 2 score
Honors in clinical clerkships
Class ranking/quartile
Medical Student Performance Evaluation(MSPE/Dean's Letter)
Personal prior knowledge of the applicant
4.7
4.7
4.5
4.6
4.6
4.3
4.3
4.1
4.5
4.2
4.3
4.1
4.3
4.1
4.0
4.1
4.1
3.9
3.5
3.7
N=140
*Ratings on a scale from 1 (not at all important) to 5 (very important).
NRMP Program Director Survey Results, 2012 53

Figure GS-2General Surgery
Mean Importance Ratings* of Factors in Ranking Applicants
(continued)
0 1 2 3 4 5
Consistency of grades
Perceived interest in program
Visa status**
Audition elective/rotation within your department
Graduate of highly regarded U.S. medical school
Alpha Omega Alpha (AOA) membership
Fluency in language spoken by your patientpopulation
Personal Statement
Other life experience
Demonstrated involvement and interest inresearch
Honors in basic sciences
Volunteer/extracurricular experiences
USMLE/COMLEX Step 3 score**
Other post-interview contact
Interest in academic career
Gold Society membership
Second interview/visit
Away rotation in your specialty at anotherinstitution
3.8
3.6
4.0
3.4
3.6
3.6
2.8
3.1
3.3
3.3
3.3
3.0
2.9
2.7
3.0
2.6
2.4
2.1
N=140
*Ratings on a scale from 1 (not at all important) to 5 (very important).
** International Medical Graduates only
NRMP Program Director Survey Results, 2012 54

100
120
140
160
180
200
220
240
260
280
General Surgery
Programs That Use USMLE Step 1 and Step 2 Clinical Knowledge (CK) Scores When
Considering Which Applicants to Interview
Figure GS-3
Percentage of Programs That Use USMLE Step 2 (CK) Score
0%
10%
20%
30%
40%
50%
60%
70%
80%
90%
100%
Never Seldom Often
38%
59%
3%
Would your program consider applicants who failtheir exam on the 1st attempt?
0%
10%
20%
30%
40%
50%
60%
70%
80%
90%
100%
Never Seldom often
50% 48%
2%
Would your program consider applicants who failtheir exam on the 1st attempt?
0%
10%
20%
30%
40%
50%
60%
70%
80%
90%
100%
Yes, pass only Yes, target score No
17%
83%
0%
Scores required?
0%
10%
20%
30%
40%
50%
60%
70%
80%
90%
100%
Yes, pass only Yes, target score No
21%
65%
14%
Scores required?
N=157
N=128
N=150 N=112
N=93N=122 N=93 N=72
Average USMLE Step 1 and Step 2 CK Scores Programs
Consider When Granting Interviews
Percentage of Programs That Use USMLE Step 1 Score
100
120
140
160
180
200
220
240
260
280
USMLE Step 2 CKUSMLE Step 1 USMLE Step 1 USMLE Step 2 CK
The boxes in the boxplots above represent the interquartile range (or IQR, which is the range between the 25th and 75th
percentiles) and the line in the box is the median. The x-shaped symbol is the mean.
Scores Above Which Programs
Almost Always Grant Interviews
Scores Below Which Programs
Generally Does Not Grant Interviews
NRMP Program Director Survey Results, 2012 55

0%
10%
20%
30%
40%
50%
60%
70%
80%
90%
100%
Yes, pass only Yes, target score No
16%
40%44%
COMLEX-USA Level 1*
N=141
0%
10%
20%
30%
40%
50%
60%
70%
80%
90%
100%
Yes, pass only No
79%
21%
USMLE Step 2 CS
General Surgery
Percentage of Programs That Use USMLE Step 2 Clinical Skill (CS), Step 3, and
COMLEX-USA Scores* When Considering Which Applicants to Interview
Figure GS-4
0%
10%
20%
30%
40%
50%
60%
70%
80%
90%
100%
Yes, pass only Yes, target score No
17%
37%
46%
COMLEX-USA Level 2-CE*
N=79
0%
10%
20%
30%
40%
50%
60%
70%
80%
90%
100%
Yes, pass only Yes, target score No
11%8%
81%
USMLE Step 3
0%
10%
20%
30%
40%
50%
60%
70%
80%
90%
100%
Yes, pass only Yes, target score No
15%
2%
84%
COMLEX-USA Level 3*
0%
10%
20%
30%
40%
50%
60%
70%
80%
90%
100%
Yes, pass only Yes, target score No
46%
3%
51%
COMLEX-USA Level 2-PE*
N=141 N=79
N=77 N=76
N=72 N=55
* Osteopathic applicants only
Percentage of Programs That Use USMLE Step 2 CS and Step 3 Scores
Percentage of Programs That Use COMLEX-USA Level 1 and Level 2-CE Scores
Percentage of Programs That Use COMLEX-USA Level 2-PE and Level 3 Scores
NRMP Program Director Survey Results, 2012 56

0%
10%
20%
30%
40%
50%
60%
70%
80%
90%
100%99%
73%
53% 50%
35%
56%
41%
U.S. Senior U.S. Grad Osteopathic Canadian Fifth Pathway U.S. IMG Non-U.S. IMG
Percentage of Programs that Typically Interview and Rank Each Applicant Groups
Figure GS-5General Surgery
Program's Interview Activities
0%
10%
20%
30%
40%
50%
60%
70%
80%
90%
100%
0% 1-24% 25-49% 50-74% 75-99% 100%
31%
6% 6%
18%
27%
13%
Percentage of Program's Interview Slots Extended Prior to the November 1st MSPE/Dean's Letter Release Date
0
100
200
300
400
500
600
700
800
900
1,000
Number ofapplications
received
Number ofapplicants
interviewed
Number ofapplicants ranked
Number ofpositions in The
Match
623
6842
5
Average Number of Applications Received, ApplicantsInterviewed and Ranked and Positions in The Match
0%
10%
20%
30%
40%
50%
60%
70%
80%
90%
100%
Percentage of applicationsrejected
Percentage of applicantsreceiving an interview
62%
37%
Average Percentage of Applications Rejected andReviewed
N=158
N=162N=160N=164*N=164*N=159N=162
N=160
31% of General Surgery programs consider all applicants
* Data from the NRMP database
NRMP Program Director Survey Results, 2012 57

Internal Medicine (N=296)
NRMP Program Director Survey Results, 2012 58

Figure IM-1Internal Medicine
Percentage of Programs Citing Each Factor in Selecting Applicants to Interview
0% 20% 40% 60% 80% 100%
USMLE/COMLEX Step 1 score
Letters of recommendation in the specialty
Personal Statement
Grades in required clerkships
USMLE/COMLEX Step 2 score
Grades in clerkship in desired specialty
Graduate of U.S. allopathic medical school
Medical Student Performance Evaluation(MSPE/Dean's Letter)
Class ranking/quartile
Gaps in medical education
Personal prior knowledge of the applicant
Perceived commitment to specialty
Honors in clinical clerkships
Applicant was flagged with Match violation by theNRMP
Volunteer/extracurricular experiences
Other life experience
Honors in clerkship in desired specialty
Consistency of grades
Audition elective/rotation within your department
82%
72%
65%
72%
76%
66%
67%
78%
74%
65%
62%
47%
60%
62%
48%
52%
57%
56%
50%
N=258
NRMP Program Director Survey Results, 2012 59

Figure IM-1Internal Medicine
Percentage of Programs Citing Each Factor in Selecting Applicants to Interview
(continued)
0% 20% 40% 60% 80% 100%
Evidence of professionalism and ethics
Interpersonal skills
Perceived interest in program
Graduate of highly regarded U.S. medical school
Leadership qualities
Alpha Omega Alpha (AOA) membership
Demonstrated involvement and interest in research
Feedback from current residents
Visa status*
Honors in basic sciences
Fluency in language spoken by your patient population
Interest in academic career
Away rotation in your specialty at another institution
USMLE/COMLEX Step 3 score*
Other post-interview contact
Gold Society membership
47%
50%
45%
55%
43%
51%
41%
42%
43%
40%
41%
30%
16%
29%
20%
28%
N=258
* International Medical Graduates only
NRMP Program Director Survey Results, 2012 60

Internal Medicine
Mean Importance Ratings* of Factors in Ranking Applicants
Figure IM-2
0 1 2 3 4 5
Applicant was flagged with Match violation by theNRMP
Interactions with faculty during interview and visit
Interpersonal skills
Interactions with housestaff during interview andvisit
Feedback from current residents
Evidence of professionalism and ethics
Grades in clerkship in desired specialty
Perceived commitment to specialty
Letters of recommendation in the specialty
Graduate of U.S. allopathic medical school
USMLE/COMLEX Step 1 score
Leadership qualities
Honors in clerkship in desired specialty
Gaps in medical education
Grades in required clerkships
USMLE/COMLEX Step 2 score
Honors in clinical clerkships
Class ranking/quartile
Medical Student Performance Evaluation(MSPE/Dean's Letter)
Personal prior knowledge of the applicant
4.7
4.5
4.6
4.3
4.2
4.5
4.2
3.7
3.8
4.1
4.0
3.9
4.1
4.1
4.1
4.1
4.0
4.1
4.2
3.7
N=258
*Ratings on a scale from 1 (not at all important) to 5 (very important).
NRMP Program Director Survey Results, 2012 61

Figure IM-2Internal Medicine
Mean Importance Ratings* of Factors in Ranking Applicants
(continued)
0 1 2 3 4 5
Consistency of grades
Perceived interest in program
Visa status**
Audition elective/rotation within your department
Graduate of highly regarded U.S. medical school
Alpha Omega Alpha (AOA) membership
Fluency in language spoken by your patientpopulation
Personal Statement
Other life experience
Demonstrated involvement and interest inresearch
Honors in basic sciences
Volunteer/extracurricular experiences
USMLE/COMLEX Step 3 score**
Other post-interview contact
Interest in academic career
Gold Society membership
Second interview/visit
Away rotation in your specialty at anotherinstitution
3.8
3.4
3.3
3.3
3.7
3.6
3.5
2.7
2.8
2.7
2.9
2.7
2.9
2.4
2.5
3.0
2.2
1.9
N=258
*Ratings on a scale from 1 (not at all important) to 5 (very important).
** International Medical Graduates only
NRMP Program Director Survey Results, 2012 62

100
120
140
160
180
200
220
240
260
280
Internal Medicine
Programs That Use USMLE Step 1 and Step 2 Clinical Knowledge (CK) Scores When
Considering Which Applicants to Interview
Figure IM-3
Percentage of Programs That Use USMLE Step 2 (CK) Score
0%
10%
20%
30%
40%
50%
60%
70%
80%
90%
100%
Never Seldom Often
22%
69%
9%
Would your program consider applicants who failtheir exam on the 1st attempt?
0%
10%
20%
30%
40%
50%
60%
70%
80%
90%
100%
Never Seldom often
33%
62%
5%
Would your program consider applicants who failtheir exam on the 1st attempt?
0%
10%
20%
30%
40%
50%
60%
70%
80%
90%
100%
Yes, pass only Yes, target score No
34%
65%
1%
Scores required?
0%
10%
20%
30%
40%
50%
60%
70%
80%
90%
100%
Yes, pass only Yes, target score No
28%
58%
14%
Scores required?
N=280
N=245
N=272 N=225
N=141N=162 N=119 N=101
Average USMLE Step 1 and Step 2 CK Scores Programs
Consider When Granting Interviews
Percentage of Programs That Use USMLE Step 1 Score
100
120
140
160
180
200
220
240
260
280
USMLE Step 2 CKUSMLE Step 1 USMLE Step 1 USMLE Step 2 CK
The boxes in the boxplots above represent the interquartile range (or IQR, which is the range between the 25th and 75th
percentiles) and the line in the box is the median. The x-shaped symbol is the mean.
Scores Above Which Programs
Almost Always Grant Interviews
Scores Below Which Programs
Generally Does Not Grant Interviews
NRMP Program Director Survey Results, 2012 63

0%
10%
20%
30%
40%
50%
60%
70%
80%
90%
100%
Yes, pass only Yes, target score No
39%
48%
13%
COMLEX-USA Level 1*
N=256
0%
10%
20%
30%
40%
50%
60%
70%
80%
90%
100%
Yes, pass only No
85%
15%
USMLE Step 2 CS
Internal Medicine
Percentage of Programs That Use USMLE Step 2 Clinical Skill (CS), Step 3, and
COMLEX-USA Scores* When Considering Which Applicants to Interview
Figure IM-4
0%
10%
20%
30%
40%
50%
60%
70%
80%
90%
100%
Yes, pass only Yes, target score No
35%
44%
21%
COMLEX-USA Level 2-CE*
N=160
0%
10%
20%
30%
40%
50%
60%
70%
80%
90%
100%
Yes, pass only Yes, target score No
23%
11%
66%
USMLE Step 3
0%
10%
20%
30%
40%
50%
60%
70%
80%
90%
100%
Yes, pass only Yes, target score No
20%
11%
69%
COMLEX-USA Level 3*
0%
10%
20%
30%
40%
50%
60%
70%
80%
90%
100%
Yes, pass only Yes, target score No
65%
13%
22%
COMLEX-USA Level 2-PE*
N=256 N=160
N=194 N=186
N=178 N=122
* Osteopathic applicants only
Percentage of Programs That Use USMLE Step 2 CS and Step 3 Scores
Percentage of Programs That Use COMLEX-USA Level 1 and Level 2-CE Scores
Percentage of Programs That Use COMLEX-USA Level 2-PE and Level 3 Scores
NRMP Program Director Survey Results, 2012 64

0%
10%
20%
30%
40%
50%
60%
70%
80%
90%
100% 98%
72%79%
63%
48%
77%72%
U.S. Senior U.S. Grad Osteopathic Canadian Fifth Pathway U.S. IMG Non-U.S. IMG
Percentage of Programs that Typically Interview and Rank Each Applicant Groups
Figure IM-5Internal Medicine
Program's Interview Activities
0%
10%
20%
30%
40%
50%
60%
70%
80%
90%
100%
0% 1-24% 25-49% 50-74% 75-99% 100%
22%
13% 14% 17%
29%
4%
Percentage of Program's Interview Slots Extended Prior to the November 1st MSPE/Dean's Letter Release Date
0
100
200
300
400
500
600
700
800
900
1,000
Number ofapplications
received
Number ofapplicants
interviewed
Number ofapplicants ranked
Number ofpositions in The
Match
1,908
172
106
10
Average Number of Applications Received, ApplicantsInterviewed and Ranked and Positions in The Match
0%
10%
20%
30%
40%
50%
60%
70%
80%
90%
100%
Percentage of applicationsrejected
Percentage of applicantsreceiving an interview
62%
36%
Average Percentage of Applications Rejected andReviewed
N=283
N=278N=279N=296*N=296*N=283N=284
N=286
43% of Internal Medicine programs consider all applicants
* Data from the NRMP database
NRMP Program Director Survey Results, 2012 65

Internal Medicine/Pediatrics (N=35)
NRMP Program Director Survey Results, 2012 66

Figure IMP-1Internal Medicine/Pediatrics
Percentage of Programs Citing Each Factor in Selecting Applicants to Interview
0% 20% 40% 60% 80% 100%
USMLE/COMLEX Step 1 score
Letters of recommendation in the specialty
Personal Statement
Grades in required clerkships
USMLE/COMLEX Step 2 score
Grades in clerkship in desired specialty
Graduate of U.S. allopathic medical school
Medical Student Performance Evaluation(MSPE/Dean's Letter)
Class ranking/quartile
Gaps in medical education
Personal prior knowledge of the applicant
Perceived commitment to specialty
Honors in clinical clerkships
Applicant was flagged with Match violation by theNRMP
Volunteer/extracurricular experiences
Other life experience
Honors in clerkship in desired specialty
Consistency of grades
Audition elective/rotation within your department
90%
71%
68%
81%
74%
77%
68%
39%
48%
58%
71%
58%
71%
58%
58%
58%
68%
55%
45%
N=31
NRMP Program Director Survey Results, 2012 67

Figure IMP-1Internal Medicine/Pediatrics
Percentage of Programs Citing Each Factor in Selecting Applicants to Interview
(continued)
0% 20% 40% 60% 80% 100%
Evidence of professionalism and ethics
Interpersonal skills
Perceived interest in program
Graduate of highly regarded U.S. medical school
Leadership qualities
Alpha Omega Alpha (AOA) membership
Demonstrated involvement and interest in research
Feedback from current residents
Visa status*
Honors in basic sciences
Fluency in language spoken by your patient population
Interest in academic career
Away rotation in your specialty at another institution
USMLE/COMLEX Step 3 score*
Other post-interview contact
Gold Society membership
61%
48%
29%
52%
52%
52%
32%
16%
35%
39%
29%
6%
16%
26%
10%
39%
N=31
* International Medical Graduates only
NRMP Program Director Survey Results, 2012 68

Internal Medicine/Pediatrics
Mean Importance Ratings* of Factors in Ranking Applicants
Figure IMP-2
0 1 2 3 4 5
Applicant was flagged with Match violation by theNRMP
Interactions with faculty during interview and visit
Interpersonal skills
Interactions with housestaff during interview andvisit
Feedback from current residents
Evidence of professionalism and ethics
Grades in clerkship in desired specialty
Perceived commitment to specialty
Letters of recommendation in the specialty
Graduate of U.S. allopathic medical school
USMLE/COMLEX Step 1 score
Leadership qualities
Honors in clerkship in desired specialty
Gaps in medical education
Grades in required clerkships
USMLE/COMLEX Step 2 score
Honors in clinical clerkships
Class ranking/quartile
Medical Student Performance Evaluation(MSPE/Dean's Letter)
Personal prior knowledge of the applicant
5.0
4.8
4.6
4.6
4.6
4.6
4.3
4.3
3.8
4.4
4.1
4.1
4.1
3.9
4.2
4.1
4.1
4.2
3.9
3.7
N=31
*Ratings on a scale from 1 (not at all important) to 5 (very important).
NRMP Program Director Survey Results, 2012 69

Figure IMP-2Internal Medicine/Pediatrics
Mean Importance Ratings* of Factors in Ranking Applicants
(continued)
0 1 2 3 4 5
Consistency of grades
Perceived interest in program
Visa status**
Audition elective/rotation within your department
Graduate of highly regarded U.S. medical school
Alpha Omega Alpha (AOA) membership
Fluency in language spoken by your patientpopulation
Personal Statement
Other life experience
Demonstrated involvement and interest inresearch
Honors in basic sciences
Volunteer/extracurricular experiences
USMLE/COMLEX Step 3 score**
Other post-interview contact
Interest in academic career
Gold Society membership
Second interview/visit
Away rotation in your specialty at anotherinstitution
3.7
3.8
3.6
3.5
3.4
3.8
3.2
3.0
3.4
2.7
3.0
3.3
2.6
2.8
2.4
3.8
2.4
1.9
N=31
*Ratings on a scale from 1 (not at all important) to 5 (very important).
** International Medical Graduates only
NRMP Program Director Survey Results, 2012 70

100
120
140
160
180
200
220
240
260
280
Internal Medicine/Pediatrics
Programs That Use USMLE Step 1 and Step 2 Clinical Knowledge (CK) Scores When
Considering Which Applicants to Interview
Figure IMP-3
Percentage of Programs That Use USMLE Step 2 (CK) Score
0%
10%
20%
30%
40%
50%
60%
70%
80%
90%
100%
Never Seldom Often
12%
88%
0%
Would your program consider applicants who failtheir exam on the 1st attempt?
0%
10%
20%
30%
40%
50%
60%
70%
80%
90%
100%
Never Seldom often
42%
58%
0%
Would your program consider applicants who failtheir exam on the 1st attempt?
0%
10%
20%
30%
40%
50%
60%
70%
80%
90%
100%
Yes, pass only Yes, target score No
40%
60%
0%
Scores required?
0%
10%
20%
30%
40%
50%
60%
70%
80%
90%
100%
Yes, pass only Yes, target score No
26%
43%
31%
Scores required?
N=35
N=25
N=35 N=24
N=11N=18 N=14 N=10
Average USMLE Step 1 and Step 2 CK Scores Programs
Consider When Granting Interviews
Percentage of Programs That Use USMLE Step 1 Score
100
120
140
160
180
200
220
240
260
280
USMLE Step 2 CKUSMLE Step 1 USMLE Step 1 USMLE Step 2 CK
The boxes in the boxplots above represent the interquartile range (or IQR, which is the range between the 25th and 75th
percentiles) and the line in the box is the median. The x-shaped symbol is the mean.
Scores Above Which Programs
Almost Always Grant Interviews
Scores Below Which Programs
Generally Does Not Grant Interviews
NRMP Program Director Survey Results, 2012 71

0%
10%
20%
30%
40%
50%
60%
70%
80%
90%
100%
Yes, pass only Yes, target score No
33%
43%
23%
COMLEX-USA Level 1*
N=33
0%
10%
20%
30%
40%
50%
60%
70%
80%
90%
100%
Yes, pass only No
64%
36%
USMLE Step 2 CS
Internal Medicine/Pediatrics
Percentage of Programs That Use USMLE Step 2 Clinical Skill (CS), Step 3, and
COMLEX-USA Scores* When Considering Which Applicants to Interview
Figure IMP-4
0%
10%
20%
30%
40%
50%
60%
70%
80%
90%
100%
Yes, pass only Yes, target score No
24%
34%41%
COMLEX-USA Level 2-CE*
N=24
0%
10%
20%
30%
40%
50%
60%
70%
80%
90%
100%
Yes, pass only Yes, target score No
8% 8%
83%
USMLE Step 3
0%
10%
20%
30%
40%
50%
60%
70%
80%
90%
100%
Yes, pass only Yes, target score No
14%
5%
81%
COMLEX-USA Level 3*
0%
10%
20%
30%
40%
50%
60%
70%
80%
90%
100%
Yes, pass only Yes, target score No
41%
7%
52%
COMLEX-USA Level 2-PE*
N=33 N=24
N=30 N=29
N=27 N=21
* Osteopathic applicants only
Percentage of Programs That Use USMLE Step 2 CS and Step 3 Scores
Percentage of Programs That Use COMLEX-USA Level 1 and Level 2-CE Scores
Percentage of Programs That Use COMLEX-USA Level 2-PE and Level 3 Scores
NRMP Program Director Survey Results, 2012 72

0%
10%
20%
30%
40%
50%
60%
70%
80%
90%
100%100%
43%
77%
34%
26%
54%
26%
U.S. Senior U.S. Grad Osteopathic Canadian Fifth Pathway U.S. IMG Non-U.S. IMG
Percentage of Programs that Typically Interview and Rank Each Applicant Groups
Figure IMP-5Internal Medicine/Pediatrics
Program's Interview Activities
0%
10%
20%
30%
40%
50%
60%
70%
80%
90%
100%
0% 1-24% 25-49% 50-74% 75-99% 100%
21%
3%9% 9%
50%
9%
Percentage of Program's Interview Slots Extended Prior to the November 1st MSPE/Dean's Letter Release Date
0
100
200
300
400
500
600
700
800
900
1,000
Number ofapplications
received
Number ofapplicants
interviewed
Number ofapplicants ranked
Number ofpositions in The
Match
204
50 455
Average Number of Applications Received, ApplicantsInterviewed and Ranked and Positions in The Match
0%
10%
20%
30%
40%
50%
60%
70%
80%
90%
100%
Percentage of applicationsrejected
Percentage of applicantsreceiving an interview
48%52%
Average Percentage of Applications Rejected andReviewed
N=34
N=33N=33N=35*N=35*N=35N=32
N=35
17% of Internal Medicine/Pediatrics programs consider all applicants
* Data from the NRMP database
NRMP Program Director Survey Results, 2012 73

Neurological Surgery (N=42)
NRMP Program Director Survey Results, 2012 74

Figure NS-1Neurological Surgery
Percentage of Programs Citing Each Factor in Selecting Applicants to Interview
0% 20% 40% 60% 80% 100%
USMLE/COMLEX Step 1 score
Letters of recommendation in the specialty
Personal Statement
Grades in required clerkships
USMLE/COMLEX Step 2 score
Grades in clerkship in desired specialty
Graduate of U.S. allopathic medical school
Medical Student Performance Evaluation(MSPE/Dean's Letter)
Class ranking/quartile
Gaps in medical education
Personal prior knowledge of the applicant
Perceived commitment to specialty
Honors in clinical clerkships
Applicant was flagged with Match violation by theNRMP
Volunteer/extracurricular experiences
Other life experience
Honors in clerkship in desired specialty
Consistency of grades
Audition elective/rotation within your department
81%
92%
73%
70%
59%
76%
68%
57%
62%
54%
65%
70%
70%
43%
70%
68%
73%
68%
76%
N=37
NRMP Program Director Survey Results, 2012 75
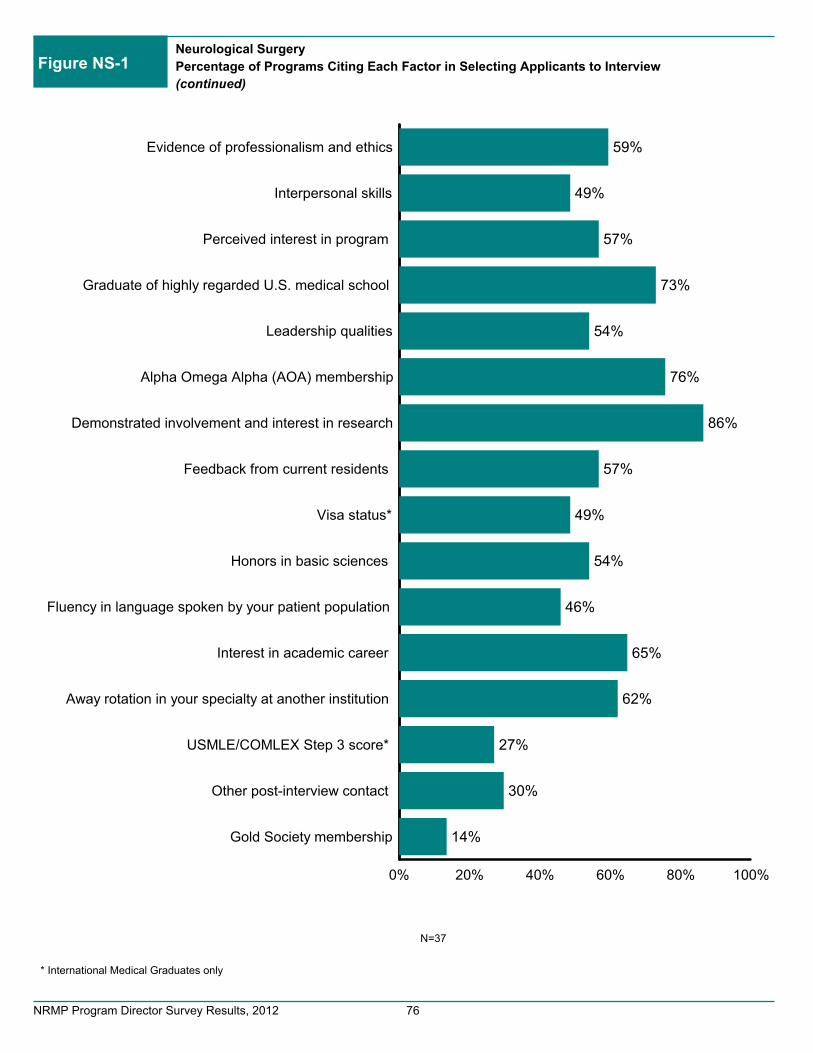
Figure NS-1Neurological Surgery
Percentage of Programs Citing Each Factor in Selecting Applicants to Interview
(continued)
0% 20% 40% 60% 80% 100%
Evidence of professionalism and ethics
Interpersonal skills
Perceived interest in program
Graduate of highly regarded U.S. medical school
Leadership qualities
Alpha Omega Alpha (AOA) membership
Demonstrated involvement and interest in research
Feedback from current residents
Visa status*
Honors in basic sciences
Fluency in language spoken by your patient population
Interest in academic career
Away rotation in your specialty at another institution
USMLE/COMLEX Step 3 score*
Other post-interview contact
Gold Society membership
59%
49%
57%
73%
54%
76%
86%
57%
49%
54%
46%
65%
62%
27%
30%
14%
N=37
* International Medical Graduates only
NRMP Program Director Survey Results, 2012 76

Neurological Surgery
Mean Importance Ratings* of Factors in Ranking Applicants
Figure NS-2
0 1 2 3 4 5
Applicant was flagged with Match violation by theNRMP
Interactions with faculty during interview and visit
Interpersonal skills
Interactions with housestaff during interview andvisit
Feedback from current residents
Evidence of professionalism and ethics
Grades in clerkship in desired specialty
Perceived commitment to specialty
Letters of recommendation in the specialty
Graduate of U.S. allopathic medical school
USMLE/COMLEX Step 1 score
Leadership qualities
Honors in clerkship in desired specialty
Gaps in medical education
Grades in required clerkships
USMLE/COMLEX Step 2 score
Honors in clinical clerkships
Class ranking/quartile
Medical Student Performance Evaluation(MSPE/Dean's Letter)
Personal prior knowledge of the applicant
4.7
4.9
4.5
4.7
4.7
4.5
4.2
4.5
4.7
4.4
4.3
4.2
4.3
3.9
3.9
3.9
4.1
3.8
3.5
4.3
N=37
*Ratings on a scale from 1 (not at all important) to 5 (very important).
NRMP Program Director Survey Results, 2012 77

Figure NS-2Neurological Surgery
Mean Importance Ratings* of Factors in Ranking Applicants
(continued)
0 1 2 3 4 5
Consistency of grades
Perceived interest in program
Visa status**
Audition elective/rotation within your department
Graduate of highly regarded U.S. medical school
Alpha Omega Alpha (AOA) membership
Fluency in language spoken by your patientpopulation
Personal Statement
Other life experience
Demonstrated involvement and interest inresearch
Honors in basic sciences
Volunteer/extracurricular experiences
USMLE/COMLEX Step 3 score**
Other post-interview contact
Interest in academic career
Gold Society membership
Second interview/visit
Away rotation in your specialty at anotherinstitution
3.9
4.1
4.3
4.1
3.8
3.7
3.5
3.4
3.5
4.2
3.6
3.5
3.4
3.1
3.8
2.7
3.1
3.7
N=37
*Ratings on a scale from 1 (not at all important) to 5 (very important).
** International Medical Graduates only
NRMP Program Director Survey Results, 2012 78

100
120
140
160
180
200
220
240
260
280
Neurological Surgery
Programs That Use USMLE Step 1 and Step 2 Clinical Knowledge (CK) Scores When
Considering Which Applicants to Interview
Figure NS-3
Percentage of Programs That Use USMLE Step 2 (CK) Score
0%
10%
20%
30%
40%
50%
60%
70%
80%
90%
100%
Never Seldom Often
55%
33%
12%
Would your program consider applicants who failtheir exam on the 1st attempt?
0%
10%
20%
30%
40%
50%
60%
70%
80%
90%
100%
Never Seldom often
44%48%
8%
Would your program consider applicants who failtheir exam on the 1st attempt?
0%
10%
20%
30%
40%
50%
60%
70%
80%
90%
100%
Yes, pass only Yes, target score No
15%
85%
0%
Scores required?
0%
10%
20%
30%
40%
50%
60%
70%
80%
90%
100%
Yes, pass only Yes, target score No
27%
46%
27%
Scores required?
N=40
N=33
N=37 N=25
N=9N=26 N=22 N=8
Average USMLE Step 1 and Step 2 CK Scores Programs
Consider When Granting Interviews
Percentage of Programs That Use USMLE Step 1 Score
100
120
140
160
180
200
220
240
260
280
USMLE Step 2 CKUSMLE Step 1 USMLE Step 1 USMLE Step 2 CK
The boxes in the boxplots above represent the interquartile range (or IQR, which is the range between the 25th and 75th
percentiles) and the line in the box is the median. The x-shaped symbol is the mean.
Scores Above Which Programs
Almost Always Grant Interviews
Scores Below Which Programs
Generally Does Not Grant Interviews
NRMP Program Director Survey Results, 2012 79

0%
10%
20%
30%
40%
50%
60%
70%
80%
90%
100%
Yes, pass only Yes, target score No
29%
7%
64%
COMLEX-USA Level 1*
N=37
0%
10%
20%
30%
40%
50%
60%
70%
80%
90%
100%
Yes, pass only No
73%
27%
USMLE Step 2 CS
Neurological Surgery
Percentage of Programs That Use USMLE Step 2 Clinical Skill (CS), Step 3, and
COMLEX-USA Scores* When Considering Which Applicants to Interview
Figure NS-4
0%
10%
20%
30%
40%
50%
60%
70%
80%
90%
100%
Yes, pass only Yes, target score No
29%
7%
64%
COMLEX-USA Level 2-CE*
N=23
0%
10%
20%
30%
40%
50%
60%
70%
80%
90%
100%
Yes, pass only Yes, target score No
30%
22%
48%
USMLE Step 3
0%
10%
20%
30%
40%
50%
60%
70%
80%
90%
100%
Yes, pass only Yes, target score No
23%
8%
69%
COMLEX-USA Level 3*
0%
10%
20%
30%
40%
50%
60%
70%
80%
90%
100%
Yes, pass only Yes, target score No
33%
8%
58%
COMLEX-USA Level 2-PE*
N=37 N=23
N=14 N=14
N=12 N=13
* Osteopathic applicants only
Percentage of Programs That Use USMLE Step 2 CS and Step 3 Scores
Percentage of Programs That Use COMLEX-USA Level 1 and Level 2-CE Scores
Percentage of Programs That Use COMLEX-USA Level 2-PE and Level 3 Scores
NRMP Program Director Survey Results, 2012 80

0%
10%
20%
30%
40%
50%
60%
70%
80%
90%
100% 98%
63%
38%33%
28%
50% 50%
U.S. Senior U.S. Grad Osteopathic Canadian Fifth Pathway U.S. IMG Non-U.S. IMG
Percentage of Programs that Typically Interview and Rank Each Applicant Groups
Figure NS-5Neurological Surgery
Program's Interview Activities
0%
10%
20%
30%
40%
50%
60%
70%
80%
90%
100%
0% 1-24% 25-49% 50-74% 75-99% 100%
21%
5%10% 8%
23%
33%
Percentage of Program's Interview Slots Extended Prior to the November 1st MSPE/Dean's Letter Release Date
0
100
200
300
400
500
600
700
800
900
1,000
Number ofapplications
received
Number ofapplicants
interviewed
Number ofapplicants ranked
Number ofpositions in The
Match
188
35 24 2
Average Number of Applications Received, ApplicantsInterviewed and Ranked and Positions in The Match
0%
10%
20%
30%
40%
50%
60%
70%
80%
90%
100%
Percentage of applicationsrejected
Percentage of applicantsreceiving an interview
44%49%
Average Percentage of Applications Rejected andReviewed
N=39
N=41N=41N=42*N=42*N=42N=41
N=40
28% of Neurological Surgery programs consider all applicants
* Data from the NRMP database
NRMP Program Director Survey Results, 2012 81

Neurology (N=59)
NRMP Program Director Survey Results, 2012 82

Figure N-1Neurology
Percentage of Programs Citing Each Factor in Selecting Applicants to Interview
0% 20% 40% 60% 80% 100%
USMLE/COMLEX Step 1 score
Letters of recommendation in the specialty
Personal Statement
Grades in required clerkships
USMLE/COMLEX Step 2 score
Grades in clerkship in desired specialty
Graduate of U.S. allopathic medical school
Medical Student Performance Evaluation(MSPE/Dean's Letter)
Class ranking/quartile
Gaps in medical education
Personal prior knowledge of the applicant
Perceived commitment to specialty
Honors in clinical clerkships
Applicant was flagged with Match violation by theNRMP
Volunteer/extracurricular experiences
Other life experience
Honors in clerkship in desired specialty
Consistency of grades
Audition elective/rotation within your department
85%
93%
75%
69%
73%
73%
67%
62%
73%
58%
65%
67%
58%
56%
55%
64%
51%
53%
51%
N=55
NRMP Program Director Survey Results, 2012 83

Figure N-1Neurology
Percentage of Programs Citing Each Factor in Selecting Applicants to Interview
(continued)
0% 20% 40% 60% 80% 100%
Evidence of professionalism and ethics
Interpersonal skills
Perceived interest in program
Graduate of highly regarded U.S. medical school
Leadership qualities
Alpha Omega Alpha (AOA) membership
Demonstrated involvement and interest in research
Feedback from current residents
Visa status*
Honors in basic sciences
Fluency in language spoken by your patient population
Interest in academic career
Away rotation in your specialty at another institution
USMLE/COMLEX Step 3 score*
Other post-interview contact
Gold Society membership
40%
45%
47%
56%
40%
45%
62%
33%
44%
38%
33%
40%
22%
31%
18%
20%
N=55
* International Medical Graduates only
NRMP Program Director Survey Results, 2012 84

Neurology
Mean Importance Ratings* of Factors in Ranking Applicants
Figure N-2
0 1 2 3 4 5
Applicant was flagged with Match violation by theNRMP
Interactions with faculty during interview and visit
Interpersonal skills
Interactions with housestaff during interview andvisit
Feedback from current residents
Evidence of professionalism and ethics
Grades in clerkship in desired specialty
Perceived commitment to specialty
Letters of recommendation in the specialty
Graduate of U.S. allopathic medical school
USMLE/COMLEX Step 1 score
Leadership qualities
Honors in clerkship in desired specialty
Gaps in medical education
Grades in required clerkships
USMLE/COMLEX Step 2 score
Honors in clinical clerkships
Class ranking/quartile
Medical Student Performance Evaluation(MSPE/Dean's Letter)
Personal prior knowledge of the applicant
4.7
4.7
4.8
4.6
4.5
4.6
4.2
4.3
4.5
3.9
4.2
4.0
4.1
4.3
3.8
4.1
3.7
4.0
4.1
3.9
N=55
*Ratings on a scale from 1 (not at all important) to 5 (very important).
NRMP Program Director Survey Results, 2012 85

Figure N-2Neurology
Mean Importance Ratings* of Factors in Ranking Applicants
(continued)
0 1 2 3 4 5
Consistency of grades
Perceived interest in program
Visa status**
Audition elective/rotation within your department
Graduate of highly regarded U.S. medical school
Alpha Omega Alpha (AOA) membership
Fluency in language spoken by your patientpopulation
Personal Statement
Other life experience
Demonstrated involvement and interest inresearch
Honors in basic sciences
Volunteer/extracurricular experiences
USMLE/COMLEX Step 3 score**
Other post-interview contact
Interest in academic career
Gold Society membership
Second interview/visit
Away rotation in your specialty at anotherinstitution
3.8
3.8
3.3
3.4
3.9
3.4
3.6
3.3
3.1
3.6
3.1
2.9
3.4
3.0
3.3
2.8
2.8
2.7
N=55
*Ratings on a scale from 1 (not at all important) to 5 (very important).
** International Medical Graduates only
NRMP Program Director Survey Results, 2012 86

100
120
140
160
180
200
220
240
260
280
Neurology
Programs That Use USMLE Step 1 and Step 2 Clinical Knowledge (CK) Scores When
Considering Which Applicants to Interview
Figure N-3
Percentage of Programs That Use USMLE Step 2 (CK) Score
0%
10%
20%
30%
40%
50%
60%
70%
80%
90%
100%
Never Seldom Often
18%
80%
2%
Would your program consider applicants who failtheir exam on the 1st attempt?
0%
10%
20%
30%
40%
50%
60%
70%
80%
90%
100%
Never Seldom often
17%
80%
2%
Would your program consider applicants who failtheir exam on the 1st attempt?
0%
10%
20%
30%
40%
50%
60%
70%
80%
90%
100%
Yes, pass only Yes, target score No
29%
69%
2%
Scores required?
0%
10%
20%
30%
40%
50%
60%
70%
80%
90%
100%
Yes, pass only Yes, target score No
30%
56%
14%
Scores required?
N=58
N=49
N=57 N=46
N=23N=28 N=21 N=18
Average USMLE Step 1 and Step 2 CK Scores Programs
Consider When Granting Interviews
Percentage of Programs That Use USMLE Step 1 Score
100
120
140
160
180
200
220
240
260
280
USMLE Step 2 CKUSMLE Step 1 USMLE Step 1 USMLE Step 2 CK
The boxes in the boxplots above represent the interquartile range (or IQR, which is the range between the 25th and 75th
percentiles) and the line in the box is the median. The x-shaped symbol is the mean.
Scores Above Which Programs
Almost Always Grant Interviews
Scores Below Which Programs
Generally Does Not Grant Interviews
NRMP Program Director Survey Results, 2012 87

0%
10%
20%
30%
40%
50%
60%
70%
80%
90%
100%
Yes, pass only Yes, target score No
36%
45%
18%
COMLEX-USA Level 1*
N=53
0%
10%
20%
30%
40%
50%
60%
70%
80%
90%
100%
Yes, pass only No
85%
15%
USMLE Step 2 CS
Neurology
Percentage of Programs That Use USMLE Step 2 Clinical Skill (CS), Step 3, and
COMLEX-USA Scores* When Considering Which Applicants to Interview
Figure N-4
0%
10%
20%
30%
40%
50%
60%
70%
80%
90%
100%
Yes, pass only Yes, target score No
40%
30% 30%
COMLEX-USA Level 2-CE*
N=40
0%
10%
20%
30%
40%
50%
60%
70%
80%
90%
100%
Yes, pass only Yes, target score No
28%
13%
60%
USMLE Step 3
0%
10%
20%
30%
40%
50%
60%
70%
80%
90%
100%
Yes, pass only Yes, target score No
27%
18%
55%
COMLEX-USA Level 3*
0%
10%
20%
30%
40%
50%
60%
70%
80%
90%
100%
Yes, pass only Yes, target score No
57%
15%
28%
COMLEX-USA Level 2-PE*
N=53 N=40
N=44 N=40
N=40 N=33
* Osteopathic applicants only
Percentage of Programs That Use USMLE Step 2 CS and Step 3 Scores
Percentage of Programs That Use COMLEX-USA Level 1 and Level 2-CE Scores
Percentage of Programs That Use COMLEX-USA Level 2-PE and Level 3 Scores
NRMP Program Director Survey Results, 2012 88

0%
10%
20%
30%
40%
50%
60%
70%
80%
90%
100% 98%
84%81%
74%
60%
82%79%
U.S. Senior U.S. Grad Osteopathic Canadian Fifth Pathway U.S. IMG Non-U.S. IMG
Percentage of Programs that Typically Interview and Rank Each Applicant Groups
Figure N-5Neurology
Program's Interview Activities
0%
10%
20%
30%
40%
50%
60%
70%
80%
90%
100%
0% 1-24% 25-49% 50-74% 75-99% 100%
11%16%
9%
20%
33%
11%
Percentage of Program's Interview Slots Extended Prior to the November 1st MSPE/Dean's Letter Release Date
0
100
200
300
400
500
600
700
800
900
1,000
Number ofapplications
received
Number ofapplicants
interviewed
Number ofapplicants ranked
Number ofpositions in The
Match
374
55 465
Average Number of Applications Received, ApplicantsInterviewed and Ranked and Positions in The Match
0%
10%
20%
30%
40%
50%
60%
70%
80%
90%
100%
Percentage of applicationsrejected
Percentage of applicantsreceiving an interview
57%
43%
Average Percentage of Applications Rejected andReviewed
N=55
N=55N=55N=59*N=59*N=56N=57
N=57
58% of Neurology programs consider all applicants
* Data from the NRMP database
NRMP Program Director Survey Results, 2012 89

Obstetrics and Gynecology (N=113)
NRMP Program Director Survey Results, 2012 90

Figure OG-1Obstetrics and Gynecology
Percentage of Programs Citing Each Factor in Selecting Applicants to Interview
0% 20% 40% 60% 80% 100%
USMLE/COMLEX Step 1 score
Letters of recommendation in the specialty
Personal Statement
Grades in required clerkships
USMLE/COMLEX Step 2 score
Grades in clerkship in desired specialty
Graduate of U.S. allopathic medical school
Medical Student Performance Evaluation(MSPE/Dean's Letter)
Class ranking/quartile
Gaps in medical education
Personal prior knowledge of the applicant
Perceived commitment to specialty
Honors in clinical clerkships
Applicant was flagged with Match violation by theNRMP
Volunteer/extracurricular experiences
Other life experience
Honors in clerkship in desired specialty
Consistency of grades
Audition elective/rotation within your department
81%
79%
74%
75%
76%
73%
74%
58%
67%
69%
59%
56%
67%
67%
58%
56%
65%
59%
58%
N=97
NRMP Program Director Survey Results, 2012 91

Figure OG-1Obstetrics and Gynecology
Percentage of Programs Citing Each Factor in Selecting Applicants to Interview
(continued)
0% 20% 40% 60% 80% 100%
Evidence of professionalism and ethics
Interpersonal skills
Perceived interest in program
Graduate of highly regarded U.S. medical school
Leadership qualities
Alpha Omega Alpha (AOA) membership
Demonstrated involvement and interest in research
Feedback from current residents
Visa status*
Honors in basic sciences
Fluency in language spoken by your patient population
Interest in academic career
Away rotation in your specialty at another institution
USMLE/COMLEX Step 3 score*
Other post-interview contact
Gold Society membership
60%
55%
59%
51%
56%
47%
54%
53%
47%
43%
36%
29%
29%
30%
26%
26%
N=97
* International Medical Graduates only
NRMP Program Director Survey Results, 2012 92

Obstetrics and Gynecology
Mean Importance Ratings* of Factors in Ranking Applicants
Figure OG-2
0 1 2 3 4 5
Applicant was flagged with Match violation by theNRMP
Interactions with faculty during interview and visit
Interpersonal skills
Interactions with housestaff during interview andvisit
Feedback from current residents
Evidence of professionalism and ethics
Grades in clerkship in desired specialty
Perceived commitment to specialty
Letters of recommendation in the specialty
Graduate of U.S. allopathic medical school
USMLE/COMLEX Step 1 score
Leadership qualities
Honors in clerkship in desired specialty
Gaps in medical education
Grades in required clerkships
USMLE/COMLEX Step 2 score
Honors in clinical clerkships
Class ranking/quartile
Medical Student Performance Evaluation(MSPE/Dean's Letter)
Personal prior knowledge of the applicant
4.8
4.7
4.7
4.7
4.7
4.6
4.4
4.2
4.1
4.2
4.1
4.3
4.2
4.1
4.1
4.0
4.0
3.8
3.6
3.6
N=97
*Ratings on a scale from 1 (not at all important) to 5 (very important).
NRMP Program Director Survey Results, 2012 93

Figure OG-2Obstetrics and Gynecology
Mean Importance Ratings* of Factors in Ranking Applicants
(continued)
0 1 2 3 4 5
Consistency of grades
Perceived interest in program
Visa status**
Audition elective/rotation within your department
Graduate of highly regarded U.S. medical school
Alpha Omega Alpha (AOA) membership
Fluency in language spoken by your patientpopulation
Personal Statement
Other life experience
Demonstrated involvement and interest inresearch
Honors in basic sciences
Volunteer/extracurricular experiences
USMLE/COMLEX Step 3 score**
Other post-interview contact
Interest in academic career
Gold Society membership
Second interview/visit
Away rotation in your specialty at anotherinstitution
4.0
3.9
3.9
3.4
3.5
3.3
3.0
3.3
3.3
3.0
2.9
3.0
3.3
3.0
2.6
3.0
2.8
2.1
N=97
*Ratings on a scale from 1 (not at all important) to 5 (very important).
** International Medical Graduates only
NRMP Program Director Survey Results, 2012 94

100
120
140
160
180
200
220
240
260
280
Obstetrics and Gynecology
Programs That Use USMLE Step 1 and Step 2 Clinical Knowledge (CK) Scores When
Considering Which Applicants to Interview
Figure OG-3
Percentage of Programs That Use USMLE Step 2 (CK) Score
0%
10%
20%
30%
40%
50%
60%
70%
80%
90%
100%
Never Seldom Often
22%
66%
13%
Would your program consider applicants who failtheir exam on the 1st attempt?
0%
10%
20%
30%
40%
50%
60%
70%
80%
90%
100%
Never Seldom often
34%
60%
6%
Would your program consider applicants who failtheir exam on the 1st attempt?
0%
10%
20%
30%
40%
50%
60%
70%
80%
90%
100%
Yes, pass only Yes, target score No
36%
64%
0%
Scores required?
0%
10%
20%
30%
40%
50%
60%
70%
80%
90%
100%
Yes, pass only Yes, target score No
38%
54%
8%
Scores required?
N=111
N=88
N=109 N=82
N=52N=63 N=45 N=38
Average USMLE Step 1 and Step 2 CK Scores Programs
Consider When Granting Interviews
Percentage of Programs That Use USMLE Step 1 Score
100
120
140
160
180
200
220
240
260
280
USMLE Step 2 CKUSMLE Step 1 USMLE Step 1 USMLE Step 2 CK
The boxes in the boxplots above represent the interquartile range (or IQR, which is the range between the 25th and 75th
percentiles) and the line in the box is the median. The x-shaped symbol is the mean.
Scores Above Which Programs
Almost Always Grant Interviews
Scores Below Which Programs
Generally Does Not Grant Interviews
NRMP Program Director Survey Results, 2012 95

0%
10%
20%
30%
40%
50%
60%
70%
80%
90%
100%
Yes, pass only Yes, target score No
39% 39%
21%
COMLEX-USA Level 1*
N=107
0%
10%
20%
30%
40%
50%
60%
70%
80%
90%
100%
Yes, pass only No
86%
14%
USMLE Step 2 CS
Obstetrics and Gynecology
Percentage of Programs That Use USMLE Step 2 Clinical Skill (CS), Step 3, and
COMLEX-USA Scores* When Considering Which Applicants to Interview
Figure OG-4
0%
10%
20%
30%
40%
50%
60%
70%
80%
90%
100%
Yes, pass only Yes, target score No
40%
33%28%
COMLEX-USA Level 2-CE*
N=59
0%
10%
20%
30%
40%
50%
60%
70%
80%
90%
100%
Yes, pass only Yes, target score No
25%
14%
61%
USMLE Step 3
0%
10%
20%
30%
40%
50%
60%
70%
80%
90%
100%
Yes, pass only Yes, target score No
29%
11%
60%
COMLEX-USA Level 3*
0%
10%
20%
30%
40%
50%
60%
70%
80%
90%
100%
Yes, pass only Yes, target score No
55%
13%
32%
COMLEX-USA Level 2-PE*
N=107 N=59
N=84 N=80
N=77 N=55
* Osteopathic applicants only
Percentage of Programs That Use USMLE Step 2 CS and Step 3 Scores
Percentage of Programs That Use COMLEX-USA Level 1 and Level 2-CE Scores
Percentage of Programs That Use COMLEX-USA Level 2-PE and Level 3 Scores
NRMP Program Director Survey Results, 2012 96

0%
10%
20%
30%
40%
50%
60%
70%
80%
90%
100%100%
63%
77%
45%
33%
55%
43%
U.S. Senior U.S. Grad Osteopathic Canadian Fifth Pathway U.S. IMG Non-U.S. IMG
Percentage of Programs that Typically Interview and Rank Each Applicant Groups
Figure OG-5Obstetrics and Gynecology
Program's Interview Activities
0%
10%
20%
30%
40%
50%
60%
70%
80%
90%
100%
0% 1-24% 25-49% 50-74% 75-99% 100%
16%11% 12%
15%
29%
17%
Percentage of Program's Interview Slots Extended Prior to the November 1st MSPE/Dean's Letter Release Date
0
100
200
300
400
500
600
700
800
900
1,000
Number ofapplications
received
Number ofapplicants
interviewed
Number ofapplicants ranked
Number ofpositions in The
Match
370
66 565
Average Number of Applications Received, ApplicantsInterviewed and Ranked and Positions in The Match
0%
10%
20%
30%
40%
50%
60%
70%
80%
90%
100%
Percentage of applicationsrejected
Percentage of applicantsreceiving an interview
55%
45%
Average Percentage of Applications Rejected andReviewed
N=112
N=109N=108N=113*N=113*N=112N=112
N=112
29% of Obstetrics and Gynecology programs consider all applicants
* Data from the NRMP database
NRMP Program Director Survey Results, 2012 97

Orthopedic Surgery (N=87)
NRMP Program Director Survey Results, 2012 98

Figure OS-1Orthopedic Surgery
Percentage of Programs Citing Each Factor in Selecting Applicants to Interview
0% 20% 40% 60% 80% 100%
USMLE/COMLEX Step 1 score
Letters of recommendation in the specialty
Personal Statement
Grades in required clerkships
USMLE/COMLEX Step 2 score
Grades in clerkship in desired specialty
Graduate of U.S. allopathic medical school
Medical Student Performance Evaluation(MSPE/Dean's Letter)
Class ranking/quartile
Gaps in medical education
Personal prior knowledge of the applicant
Perceived commitment to specialty
Honors in clinical clerkships
Applicant was flagged with Match violation by theNRMP
Volunteer/extracurricular experiences
Other life experience
Honors in clerkship in desired specialty
Consistency of grades
Audition elective/rotation within your department
69%
85%
85%
78%
49%
76%
77%
83%
73%
60%
69%
64%
79%
50%
77%
76%
78%
68%
78%
N=78
NRMP Program Director Survey Results, 2012 99

Figure OS-1Orthopedic Surgery
Percentage of Programs Citing Each Factor in Selecting Applicants to Interview
(continued)
0% 20% 40% 60% 80% 100%
Evidence of professionalism and ethics
Interpersonal skills
Perceived interest in program
Graduate of highly regarded U.S. medical school
Leadership qualities
Alpha Omega Alpha (AOA) membership
Demonstrated involvement and interest in research
Feedback from current residents
Visa status*
Honors in basic sciences
Fluency in language spoken by your patient population
Interest in academic career
Away rotation in your specialty at another institution
USMLE/COMLEX Step 3 score*
Other post-interview contact
Gold Society membership
62%
62%
60%
55%
67%
68%
71%
65%
37%
56%
23%
31%
42%
14%
19%
18%
N=78
* International Medical Graduates only
NRMP Program Director Survey Results, 2012 100

Orthopedic Surgery
Mean Importance Ratings* of Factors in Ranking Applicants
Figure OS-2
0 1 2 3 4 5
Applicant was flagged with Match violation by theNRMP
Interactions with faculty during interview and visit
Interpersonal skills
Interactions with housestaff during interview andvisit
Feedback from current residents
Evidence of professionalism and ethics
Grades in clerkship in desired specialty
Perceived commitment to specialty
Letters of recommendation in the specialty
Graduate of U.S. allopathic medical school
USMLE/COMLEX Step 1 score
Leadership qualities
Honors in clerkship in desired specialty
Gaps in medical education
Grades in required clerkships
USMLE/COMLEX Step 2 score
Honors in clinical clerkships
Class ranking/quartile
Medical Student Performance Evaluation(MSPE/Dean's Letter)
Personal prior knowledge of the applicant
4.9
4.7
4.6
4.8
4.7
4.6
4.3
4.0
4.3
4.5
4.5
4.3
4.4
3.9
4.3
3.7
4.4
4.2
3.4
4.3
N=78
*Ratings on a scale from 1 (not at all important) to 5 (very important).
NRMP Program Director Survey Results, 2012 101

Figure OS-2Orthopedic Surgery
Mean Importance Ratings* of Factors in Ranking Applicants
(continued)
0 1 2 3 4 5
Consistency of grades
Perceived interest in program
Visa status**
Audition elective/rotation within your department
Graduate of highly regarded U.S. medical school
Alpha Omega Alpha (AOA) membership
Fluency in language spoken by your patientpopulation
Personal Statement
Other life experience
Demonstrated involvement and interest inresearch
Honors in basic sciences
Volunteer/extracurricular experiences
USMLE/COMLEX Step 3 score**
Other post-interview contact
Interest in academic career
Gold Society membership
Second interview/visit
Away rotation in your specialty at anotherinstitution
4.1
3.8
3.9
4.3
3.6
3.8
2.5
3.2
3.3
3.7
3.6
3.2
2.7
2.6
2.9
2.7
2.8
2.7
N=78
*Ratings on a scale from 1 (not at all important) to 5 (very important).
** International Medical Graduates only
NRMP Program Director Survey Results, 2012 102

100
120
140
160
180
200
220
240
260
280
Orthopedic Surgery
Programs That Use USMLE Step 1 and Step 2 Clinical Knowledge (CK) Scores When
Considering Which Applicants to Interview
Figure OS-3
Percentage of Programs That Use USMLE Step 2 (CK) Score
0%
10%
20%
30%
40%
50%
60%
70%
80%
90%
100%
Never Seldom Often
59%
40%
1%
Would your program consider applicants who failtheir exam on the 1st attempt?
0%
10%
20%
30%
40%
50%
60%
70%
80%
90%
100%
Never Seldom often
69%
31%
0%
Would your program consider applicants who failtheir exam on the 1st attempt?
0%
10%
20%
30%
40%
50%
60%
70%
80%
90%
100%
Yes, pass only Yes, target score No
11%
88%
1%
Scores required?
0%
10%
20%
30%
40%
50%
60%
70%
80%
90%
100%
Yes, pass only Yes, target score No
17%
44%39%
Scores required?
N=84
N=68
N=72 N=49
N=32N=67 N=38 N=19
Average USMLE Step 1 and Step 2 CK Scores Programs
Consider When Granting Interviews
Percentage of Programs That Use USMLE Step 1 Score
100
120
140
160
180
200
220
240
260
280
USMLE Step 2 CKUSMLE Step 1 USMLE Step 1 USMLE Step 2 CK
The boxes in the boxplots above represent the interquartile range (or IQR, which is the range between the 25th and 75th
percentiles) and the line in the box is the median. The x-shaped symbol is the mean.
Scores Above Which Programs
Almost Always Grant Interviews
Scores Below Which Programs
Generally Does Not Grant Interviews
NRMP Program Director Survey Results, 2012 103

0%
10%
20%
30%
40%
50%
60%
70%
80%
90%
100%
Yes, pass only Yes, target score No
13%8%
79%
COMLEX-USA Level 1*
N=72
0%
10%
20%
30%
40%
50%
60%
70%
80%
90%
100%
Yes, pass only No
57%
43%
USMLE Step 2 CS
Orthopedic Surgery
Percentage of Programs That Use USMLE Step 2 Clinical Skill (CS), Step 3, and
COMLEX-USA Scores* When Considering Which Applicants to Interview
Figure OS-4
0%
10%
20%
30%
40%
50%
60%
70%
80%
90%
100%
Yes, pass only Yes, target score No
8% 5%
86%
COMLEX-USA Level 2-CE*
N=45
0%
10%
20%
30%
40%
50%
60%
70%
80%
90%
100%
Yes, pass only Yes, target score No
11%4%
84%
USMLE Step 3
0%
10%
20%
30%
40%
50%
60%
70%
80%
90%
100%
Yes, pass only Yes, target score No
8%3%
89%
COMLEX-USA Level 3*
0%
10%
20%
30%
40%
50%
60%
70%
80%
90%
100%
Yes, pass only Yes, target score No
8%3%
89%
COMLEX-USA Level 2-PE*
N=72 N=45
N=38 N=37
N=37 N=36
* Osteopathic applicants only
Percentage of Programs That Use USMLE Step 2 CS and Step 3 Scores
Percentage of Programs That Use COMLEX-USA Level 1 and Level 2-CE Scores
Percentage of Programs That Use COMLEX-USA Level 2-PE and Level 3 Scores
NRMP Program Director Survey Results, 2012 104

0%
10%
20%
30%
40%
50%
60%
70%
80%
90%
100%99%
67%
30%27%
16%
24%17%
U.S. Senior U.S. Grad Osteopathic Canadian Fifth Pathway U.S. IMG Non-U.S. IMG
Percentage of Programs that Typically Interview and Rank Each Applicant Groups
Figure OS-5Orthopedic Surgery
Program's Interview Activities
0%
10%
20%
30%
40%
50%
60%
70%
80%
90%
100%
0% 1-24% 25-49% 50-74% 75-99% 100%
67%
1%7% 5% 6%
13%
Percentage of Program's Interview Slots Extended Prior to the November 1st MSPE/Dean's Letter Release Date
0
100
200
300
400
500
600
700
800
900
1,000
Number ofapplications
received
Number ofapplicants
interviewed
Number ofapplicants ranked
Number ofpositions in The
Match
530
62 515
Average Number of Applications Received, ApplicantsInterviewed and Ranked and Positions in The Match
0%
10%
20%
30%
40%
50%
60%
70%
80%
90%
100%
Percentage of applicationsrejected
Percentage of applicantsreceiving an interview
47%
56%
Average Percentage of Applications Rejected andReviewed
N=83
N=84N=84N=87*N=87*N=83N=85
N=83
14% of Orthopedic Surgery programs consider all applicants
* Data from the NRMP database
NRMP Program Director Survey Results, 2012 105

Otolaryngology (N=51)
NRMP Program Director Survey Results, 2012 106

Figure O-1Otolaryngology
Percentage of Programs Citing Each Factor in Selecting Applicants to Interview
0% 20% 40% 60% 80% 100%
USMLE/COMLEX Step 1 score
Letters of recommendation in the specialty
Personal Statement
Grades in required clerkships
USMLE/COMLEX Step 2 score
Grades in clerkship in desired specialty
Graduate of U.S. allopathic medical school
Medical Student Performance Evaluation(MSPE/Dean's Letter)
Class ranking/quartile
Gaps in medical education
Personal prior knowledge of the applicant
Perceived commitment to specialty
Honors in clinical clerkships
Applicant was flagged with Match violation by theNRMP
Volunteer/extracurricular experiences
Other life experience
Honors in clerkship in desired specialty
Consistency of grades
Audition elective/rotation within your department
84%
93%
87%
73%
56%
80%
80%
58%
71%
58%
71%
67%
80%
60%
82%
69%
80%
67%
73%
N=45
NRMP Program Director Survey Results, 2012 107

Figure O-1Otolaryngology
Percentage of Programs Citing Each Factor in Selecting Applicants to Interview
(continued)
0% 20% 40% 60% 80% 100%
Evidence of professionalism and ethics
Interpersonal skills
Perceived interest in program
Graduate of highly regarded U.S. medical school
Leadership qualities
Alpha Omega Alpha (AOA) membership
Demonstrated involvement and interest in research
Feedback from current residents
Visa status*
Honors in basic sciences
Fluency in language spoken by your patient population
Interest in academic career
Away rotation in your specialty at another institution
USMLE/COMLEX Step 3 score*
Other post-interview contact
Gold Society membership
64%
69%
62%
60%
71%
76%
82%
67%
51%
53%
20%
40%
44%
13%
13%
18%
N=45
* International Medical Graduates only
NRMP Program Director Survey Results, 2012 108

Otolaryngology
Mean Importance Ratings* of Factors in Ranking Applicants
Figure O-2
0 1 2 3 4 5
Applicant was flagged with Match violation by theNRMP
Interactions with faculty during interview and visit
Interpersonal skills
Interactions with housestaff during interview andvisit
Feedback from current residents
Evidence of professionalism and ethics
Grades in clerkship in desired specialty
Perceived commitment to specialty
Letters of recommendation in the specialty
Graduate of U.S. allopathic medical school
USMLE/COMLEX Step 1 score
Leadership qualities
Honors in clerkship in desired specialty
Gaps in medical education
Grades in required clerkships
USMLE/COMLEX Step 2 score
Honors in clinical clerkships
Class ranking/quartile
Medical Student Performance Evaluation(MSPE/Dean's Letter)
Personal prior knowledge of the applicant
4.9
4.8
4.7
4.7
4.6
4.5
4.3
4.0
4.4
4.5
4.1
4.3
4.3
3.4
3.9
3.3
4.0
4.0
2.7
4.1
N=45
*Ratings on a scale from 1 (not at all important) to 5 (very important).
NRMP Program Director Survey Results, 2012 109

Figure O-2Otolaryngology
Mean Importance Ratings* of Factors in Ranking Applicants
(continued)
0 1 2 3 4 5
Consistency of grades
Perceived interest in program
Visa status**
Audition elective/rotation within your department
Graduate of highly regarded U.S. medical school
Alpha Omega Alpha (AOA) membership
Fluency in language spoken by your patientpopulation
Personal Statement
Other life experience
Demonstrated involvement and interest inresearch
Honors in basic sciences
Volunteer/extracurricular experiences
USMLE/COMLEX Step 3 score**
Other post-interview contact
Interest in academic career
Gold Society membership
Second interview/visit
Away rotation in your specialty at anotherinstitution
3.9
3.8
3.5
4.0
3.2
3.9
2.4
3.3
3.2
4.0
3.4
3.2
2.1
2.4
3.0
2.2
2.1
2.6
N=45
*Ratings on a scale from 1 (not at all important) to 5 (very important).
** International Medical Graduates only
NRMP Program Director Survey Results, 2012 110

100
120
140
160
180
200
220
240
260
280
Otolaryngology
Programs That Use USMLE Step 1 and Step 2 Clinical Knowledge (CK) Scores When
Considering Which Applicants to Interview
Figure O-3
Percentage of Programs That Use USMLE Step 2 (CK) Score
0%
10%
20%
30%
40%
50%
60%
70%
80%
90%
100%
Never Seldom Often
57%
38%
5%
Would your program consider applicants who failtheir exam on the 1st attempt?
0%
10%
20%
30%
40%
50%
60%
70%
80%
90%
100%
Never Seldom often
57%
35%
9%
Would your program consider applicants who failtheir exam on the 1st attempt?
0%
10%
20%
30%
40%
50%
60%
70%
80%
90%
100%
Yes, pass only Yes, target score No
16%
84%
0%
Scores required?
0%
10%
20%
30%
40%
50%
60%
70%
80%
90%
100%
Yes, pass only Yes, target score No
20%
33%
47%
Scores required?
N=50
N=42
N=45 N=23
N=11N=37 N=19 N=6
Average USMLE Step 1 and Step 2 CK Scores Programs
Consider When Granting Interviews
Percentage of Programs That Use USMLE Step 1 Score
100
120
140
160
180
200
220
240
260
280
USMLE Step 2 CKUSMLE Step 1 USMLE Step 1 USMLE Step 2 CK
The boxes in the boxplots above represent the interquartile range (or IQR, which is the range between the 25th and 75th
percentiles) and the line in the box is the median. The x-shaped symbol is the mean.
Scores Above Which Programs
Almost Always Grant Interviews
Scores Below Which Programs
Generally Does Not Grant Interviews
NRMP Program Director Survey Results, 2012 111

0%
10%
20%
30%
40%
50%
60%
70%
80%
90%
100%
Yes, pass only Yes, target score No
5%
14%
81%
COMLEX-USA Level 1*
N=44
0%
10%
20%
30%
40%
50%
60%
70%
80%
90%
100%
Yes, pass only No
50% 50%
USMLE Step 2 CS
Otolaryngology
Percentage of Programs That Use USMLE Step 2 Clinical Skill (CS), Step 3, and
COMLEX-USA Scores* When Considering Which Applicants to Interview
Figure O-4
0%
10%
20%
30%
40%
50%
60%
70%
80%
90%
100%
Yes, pass only Yes, target score No
5% 5%
89%
COMLEX-USA Level 2-CE*
N=28
0%
10%
20%
30%
40%
50%
60%
70%
80%
90%
100%
Yes, pass only Yes, target score No
7% 7%
86%
USMLE Step 3
0%
10%
20%
30%
40%
50%
60%
70%
80%
90%
100%
Yes, pass only Yes, target score No
0%5%
95%
COMLEX-USA Level 3*
0%
10%
20%
30%
40%
50%
60%
70%
80%
90%
100%
Yes, pass only Yes, target score No
5% 5%
89%
COMLEX-USA Level 2-PE*
N=44 N=28
N=21 N=19
N=19 N=19
* Osteopathic applicants only
Percentage of Programs That Use USMLE Step 2 CS and Step 3 Scores
Percentage of Programs That Use COMLEX-USA Level 1 and Level 2-CE Scores
Percentage of Programs That Use COMLEX-USA Level 2-PE and Level 3 Scores
NRMP Program Director Survey Results, 2012 112

0%
10%
20%
30%
40%
50%
60%
70%
80%
90%
100%100%
54%
28%32%
20%24% 22%
U.S. Senior U.S. Grad Osteopathic Canadian Fifth Pathway U.S. IMG Non-U.S. IMG
Percentage of Programs that Typically Interview and Rank Each Applicant Groups
Figure O-5Otolaryngology
Program's Interview Activities
0%
10%
20%
30%
40%
50%
60%
70%
80%
90%
100%
0% 1-24% 25-49% 50-74% 75-99% 100%
41%
4% 4% 2%
12%
37%
Percentage of Program's Interview Slots Extended Prior to the November 1st MSPE/Dean's Letter Release Date
0
100
200
300
400
500
600
700
800
900
1,000
Number ofapplications
received
Number ofapplicants
interviewed
Number ofapplicants ranked
Number ofpositions in The
Match
251
38 323
Average Number of Applications Received, ApplicantsInterviewed and Ranked and Positions in The Match
0%
10%
20%
30%
40%
50%
60%
70%
80%
90%
100%
Percentage of applicationsrejected
Percentage of applicantsreceiving an interview
32%
64%
Average Percentage of Applications Rejected andReviewed
N=51
N=51N=51N=51*N=51*N=51N=51
N=50
18% of Otolaryngology programs consider all applicants
* Data from the NRMP database
NRMP Program Director Survey Results, 2012 113
Pathology (N=78)
NRMP Program Director Survey Results, 2012 114

Figure PAC-1Pathology
Percentage of Programs Citing Each Factor in Selecting Applicants to Interview
0% 20% 40% 60% 80% 100%
USMLE/COMLEX Step 1 score
Letters of recommendation in the specialty
Personal Statement
Grades in required clerkships
USMLE/COMLEX Step 2 score
Grades in clerkship in desired specialty
Graduate of U.S. allopathic medical school
Medical Student Performance Evaluation(MSPE/Dean's Letter)
Class ranking/quartile
Gaps in medical education
Personal prior knowledge of the applicant
Perceived commitment to specialty
Honors in clinical clerkships
Applicant was flagged with Match violation by theNRMP
Volunteer/extracurricular experiences
Other life experience
Honors in clerkship in desired specialty
Consistency of grades
Audition elective/rotation within your department
80%
93%
89%
64%
70%
77%
67%
56%
56%
74%
59%
79%
57%
66%
54%
57%
59%
59%
61%
N=70
NRMP Program Director Survey Results, 2012 115

Figure PAC-1Pathology
Percentage of Programs Citing Each Factor in Selecting Applicants to Interview
(continued)
0% 20% 40% 60% 80% 100%
Evidence of professionalism and ethics
Interpersonal skills
Perceived interest in program
Graduate of highly regarded U.S. medical school
Leadership qualities
Alpha Omega Alpha (AOA) membership
Demonstrated involvement and interest in research
Feedback from current residents
Visa status*
Honors in basic sciences
Fluency in language spoken by your patient population
Interest in academic career
Away rotation in your specialty at another institution
USMLE/COMLEX Step 3 score*
Other post-interview contact
Gold Society membership
59%
61%
64%
61%
54%
40%
66%
57%
50%
51%
43%
51%
36%
36%
27%
14%
N=70
* International Medical Graduates only
NRMP Program Director Survey Results, 2012 116

Pathology
Mean Importance Ratings* of Factors in Ranking Applicants
Figure PAC-2
0 1 2 3 4 5
Applicant was flagged with Match violation by theNRMP
Interactions with faculty during interview and visit
Interpersonal skills
Interactions with housestaff during interview andvisit
Feedback from current residents
Evidence of professionalism and ethics
Grades in clerkship in desired specialty
Perceived commitment to specialty
Letters of recommendation in the specialty
Graduate of U.S. allopathic medical school
USMLE/COMLEX Step 1 score
Leadership qualities
Honors in clerkship in desired specialty
Gaps in medical education
Grades in required clerkships
USMLE/COMLEX Step 2 score
Honors in clinical clerkships
Class ranking/quartile
Medical Student Performance Evaluation(MSPE/Dean's Letter)
Personal prior knowledge of the applicant
4.9
4.8
4.7
4.7
4.6
4.4
4.2
4.6
4.7
4.0
4.4
3.9
3.9
4.3
3.7
4.3
3.5
3.7
3.7
3.6
N=70
*Ratings on a scale from 1 (not at all important) to 5 (very important).
NRMP Program Director Survey Results, 2012 117

Figure PAC-2Pathology
Mean Importance Ratings* of Factors in Ranking Applicants
(continued)
0 1 2 3 4 5
Consistency of grades
Perceived interest in program
Visa status**
Audition elective/rotation within your department
Graduate of highly regarded U.S. medical school
Alpha Omega Alpha (AOA) membership
Fluency in language spoken by your patientpopulation
Personal Statement
Other life experience
Demonstrated involvement and interest inresearch
Honors in basic sciences
Volunteer/extracurricular experiences
USMLE/COMLEX Step 3 score**
Other post-interview contact
Interest in academic career
Gold Society membership
Second interview/visit
Away rotation in your specialty at anotherinstitution
4.0
4.0
3.8
3.9
3.8
3.2
3.8
3.5
2.8
3.4
3.5
2.6
3.4
3.4
3.4
2.2
2.8
2.9
N=70
*Ratings on a scale from 1 (not at all important) to 5 (very important).
** International Medical Graduates only
NRMP Program Director Survey Results, 2012 118

100
120
140
160
180
200
220
240
260
280
Pathology
Programs That Use USMLE Step 1 and Step 2 Clinical Knowledge (CK) Scores When
Considering Which Applicants to Interview
Figure PAC-3
Percentage of Programs That Use USMLE Step 2 (CK) Score
0%
10%
20%
30%
40%
50%
60%
70%
80%
90%
100%
Never Seldom Often
16%
72%
12%
Would your program consider applicants who failtheir exam on the 1st attempt?
0%
10%
20%
30%
40%
50%
60%
70%
80%
90%
100%
Never Seldom often
17%
71%
12%
Would your program consider applicants who failtheir exam on the 1st attempt?
0%
10%
20%
30%
40%
50%
60%
70%
80%
90%
100%
Yes, pass only Yes, target score No
31%
69%
0%
Scores required?
0%
10%
20%
30%
40%
50%
60%
70%
80%
90%
100%
Yes, pass only Yes, target score No
25%
63%
13%
Scores required?
N=75
N=58
N=72 N=52
N=35N=44 N=30 N=21
Average USMLE Step 1 and Step 2 CK Scores Programs
Consider When Granting Interviews
Percentage of Programs That Use USMLE Step 1 Score
100
120
140
160
180
200
220
240
260
280
USMLE Step 2 CKUSMLE Step 1 USMLE Step 1 USMLE Step 2 CK
The boxes in the boxplots above represent the interquartile range (or IQR, which is the range between the 25th and 75th
percentiles) and the line in the box is the median. The x-shaped symbol is the mean.
Scores Above Which Programs
Almost Always Grant Interviews
Scores Below Which Programs
Generally Does Not Grant Interviews
NRMP Program Director Survey Results, 2012 119

0%
10%
20%
30%
40%
50%
60%
70%
80%
90%
100%
Yes, pass only Yes, target score No
35%
56%
10%
COMLEX-USA Level 1*
N=67
0%
10%
20%
30%
40%
50%
60%
70%
80%
90%
100%
Yes, pass only No
82%
18%
USMLE Step 2 CS
Pathology
Percentage of Programs That Use USMLE Step 2 Clinical Skill (CS), Step 3, and
COMLEX-USA Scores* When Considering Which Applicants to Interview
Figure PAC-4
0%
10%
20%
30%
40%
50%
60%
70%
80%
90%
100%
Yes, pass only Yes, target score No
29%
49%
22%
COMLEX-USA Level 2-CE*
N=55
0%
10%
20%
30%
40%
50%
60%
70%
80%
90%
100%
Yes, pass only Yes, target score No
29%
16%
55%
USMLE Step 3
0%
10%
20%
30%
40%
50%
60%
70%
80%
90%
100%
Yes, pass only Yes, target score No
33%
8%
59%
COMLEX-USA Level 3*
0%
10%
20%
30%
40%
50%
60%
70%
80%
90%
100%
Yes, pass only Yes, target score No
56%
21% 23%
COMLEX-USA Level 2-PE*
N=67 N=55
N=52 N=51
N=52 N=39
* Osteopathic applicants only
Percentage of Programs That Use USMLE Step 2 CS and Step 3 Scores
Percentage of Programs That Use COMLEX-USA Level 1 and Level 2-CE Scores
Percentage of Programs That Use COMLEX-USA Level 2-PE and Level 3 Scores
NRMP Program Director Survey Results, 2012 120

0%
10%
20%
30%
40%
50%
60%
70%
80%
90%
100% 97%91% 91%
73%
65%
85% 83%
U.S. Senior U.S. Grad Osteopathic Canadian Fifth Pathway U.S. IMG Non-U.S. IMG
Percentage of Programs that Typically Interview and Rank Each Applicant Groups
Figure PAC-5Pathology
Program's Interview Activities
0%
10%
20%
30%
40%
50%
60%
70%
80%
90%
100%
0% 1-24% 25-49% 50-74% 75-99% 100%
15%19%
15% 12%
25%
15%
Percentage of Program's Interview Slots Extended Prior to the November 1st MSPE/Dean's Letter Release Date
0
100
200
300
400
500
600
700
800
900
1,000
Number ofapplications
received
Number ofapplicants
interviewed
Number ofapplicants ranked
Number ofpositions in The
Match
362
40 27 4
Average Number of Applications Received, ApplicantsInterviewed and Ranked and Positions in The Match
0%
10%
20%
30%
40%
50%
60%
70%
80%
90%
100%
Percentage of applicationsrejected
Percentage of applicantsreceiving an interview
54%
44%
Average Percentage of Applications Rejected andReviewed
N=75
N=77N=76N=78*N=78*N=77N=77
N=75
63% of Pathology programs consider all applicants
* Data from the NRMP database
NRMP Program Director Survey Results, 2012 121

Pediatrics (N=131)
NRMP Program Director Survey Results, 2012 122

Figure P-1Pediatrics
Percentage of Programs Citing Each Factor in Selecting Applicants to Interview
0% 20% 40% 60% 80% 100%
USMLE/COMLEX Step 1 score
Letters of recommendation in the specialty
Personal Statement
Grades in required clerkships
USMLE/COMLEX Step 2 score
Grades in clerkship in desired specialty
Graduate of U.S. allopathic medical school
Medical Student Performance Evaluation(MSPE/Dean's Letter)
Class ranking/quartile
Gaps in medical education
Personal prior knowledge of the applicant
Perceived commitment to specialty
Honors in clinical clerkships
Applicant was flagged with Match violation by theNRMP
Volunteer/extracurricular experiences
Other life experience
Honors in clerkship in desired specialty
Consistency of grades
Audition elective/rotation within your department
91%
71%
72%
74%
75%
66%
71%
66%
68%
71%
60%
52%
57%
56%
56%
50%
54%
58%
50%
N=109
NRMP Program Director Survey Results, 2012 123

Figure P-1Pediatrics
Percentage of Programs Citing Each Factor in Selecting Applicants to Interview
(continued)
0% 20% 40% 60% 80% 100%
Evidence of professionalism and ethics
Interpersonal skills
Perceived interest in program
Graduate of highly regarded U.S. medical school
Leadership qualities
Alpha Omega Alpha (AOA) membership
Demonstrated involvement and interest in research
Feedback from current residents
Visa status*
Honors in basic sciences
Fluency in language spoken by your patient population
Interest in academic career
Away rotation in your specialty at another institution
USMLE/COMLEX Step 3 score*
Other post-interview contact
Gold Society membership
54%
50%
39%
50%
51%
55%
38%
50%
46%
37%
32%
27%
20%
18%
17%
34%
N=109
* International Medical Graduates only
NRMP Program Director Survey Results, 2012 124

Pediatrics
Mean Importance Ratings* of Factors in Ranking Applicants
Figure P-2
0 1 2 3 4 5
Applicant was flagged with Match violation by theNRMP
Interactions with faculty during interview and visit
Interpersonal skills
Interactions with housestaff during interview andvisit
Feedback from current residents
Evidence of professionalism and ethics
Grades in clerkship in desired specialty
Perceived commitment to specialty
Letters of recommendation in the specialty
Graduate of U.S. allopathic medical school
USMLE/COMLEX Step 1 score
Leadership qualities
Honors in clerkship in desired specialty
Gaps in medical education
Grades in required clerkships
USMLE/COMLEX Step 2 score
Honors in clinical clerkships
Class ranking/quartile
Medical Student Performance Evaluation(MSPE/Dean's Letter)
Personal prior knowledge of the applicant
4.9
4.7
4.7
4.6
4.6
4.5
4.2
4.0
3.9
4.0
4.0
4.1
4.1
4.1
4.2
3.9
4.0
4.2
4.1
3.9
N=109
*Ratings on a scale from 1 (not at all important) to 5 (very important).
NRMP Program Director Survey Results, 2012 125

Figure P-2Pediatrics
Mean Importance Ratings* of Factors in Ranking Applicants
(continued)
0 1 2 3 4 5
Consistency of grades
Perceived interest in program
Visa status**
Audition elective/rotation within your department
Graduate of highly regarded U.S. medical school
Alpha Omega Alpha (AOA) membership
Fluency in language spoken by your patientpopulation
Personal Statement
Other life experience
Demonstrated involvement and interest inresearch
Honors in basic sciences
Volunteer/extracurricular experiences
USMLE/COMLEX Step 3 score**
Other post-interview contact
Interest in academic career
Gold Society membership
Second interview/visit
Away rotation in your specialty at anotherinstitution
3.8
3.4
3.5
3.6
3.5
3.5
3.4
3.1
3.3
2.8
2.8
3.2
2.6
2.6
2.7
3.2
2.2
2.2
N=109
*Ratings on a scale from 1 (not at all important) to 5 (very important).
** International Medical Graduates only
NRMP Program Director Survey Results, 2012 126

100
120
140
160
180
200
220
240
260
280
Pediatrics
Programs That Use USMLE Step 1 and Step 2 Clinical Knowledge (CK) Scores When
Considering Which Applicants to Interview
Figure P-3
Percentage of Programs That Use USMLE Step 2 (CK) Score
0%
10%
20%
30%
40%
50%
60%
70%
80%
90%
100%
Never Seldom Often
3%
78%
19%
Would your program consider applicants who failtheir exam on the 1st attempt?
0%
10%
20%
30%
40%
50%
60%
70%
80%
90%
100%
Never Seldom often
14%
73%
13%
Would your program consider applicants who failtheir exam on the 1st attempt?
0%
10%
20%
30%
40%
50%
60%
70%
80%
90%
100%
Yes, pass only Yes, target score No
56%
43%
2%
Scores required?
0%
10%
20%
30%
40%
50%
60%
70%
80%
90%
100%
Yes, pass only Yes, target score No
48%
40%
13%
Scores required?
N=126
N=98
N=124 N=94
N=37N=43 N=35 N=29
Average USMLE Step 1 and Step 2 CK Scores Programs
Consider When Granting Interviews
Percentage of Programs That Use USMLE Step 1 Score
100
120
140
160
180
200
220
240
260
280
USMLE Step 2 CKUSMLE Step 1 USMLE Step 1 USMLE Step 2 CK
The boxes in the boxplots above represent the interquartile range (or IQR, which is the range between the 25th and 75th
percentiles) and the line in the box is the median. The x-shaped symbol is the mean.
Scores Above Which Programs
Almost Always Grant Interviews
Scores Below Which Programs
Generally Does Not Grant Interviews
NRMP Program Director Survey Results, 2012 127

0%
10%
20%
30%
40%
50%
60%
70%
80%
90%
100%
Yes, pass only Yes, target score No
55%
33%
12%
COMLEX-USA Level 1*
N=121
0%
10%
20%
30%
40%
50%
60%
70%
80%
90%
100%
Yes, pass only No
82%
18%
USMLE Step 2 CS
Pediatrics
Percentage of Programs That Use USMLE Step 2 Clinical Skill (CS), Step 3, and
COMLEX-USA Scores* When Considering Which Applicants to Interview
Figure P-4
0%
10%
20%
30%
40%
50%
60%
70%
80%
90%
100%
Yes, pass only Yes, target score No
50%
27% 24%
COMLEX-USA Level 2-CE*
N=76
0%
10%
20%
30%
40%
50%
60%
70%
80%
90%
100%
Yes, pass only Yes, target score No
14%
4%
82%
USMLE Step 3
0%
10%
20%
30%
40%
50%
60%
70%
80%
90%
100%
Yes, pass only Yes, target score No
13%
4%
82%
COMLEX-USA Level 3*
0%
10%
20%
30%
40%
50%
60%
70%
80%
90%
100%
Yes, pass only Yes, target score No
64%
7%
29%
COMLEX-USA Level 2-PE*
N=121 N=76
N=110 N=105
N=96 N=68
* Osteopathic applicants only
Percentage of Programs That Use USMLE Step 2 CS and Step 3 Scores
Percentage of Programs That Use COMLEX-USA Level 1 and Level 2-CE Scores
Percentage of Programs That Use COMLEX-USA Level 2-PE and Level 3 Scores
NRMP Program Director Survey Results, 2012 128

0%
10%
20%
30%
40%
50%
60%
70%
80%
90%
100% 97%
67%
87%
63%
45%
76%
63%
U.S. Senior U.S. Grad Osteopathic Canadian Fifth Pathway U.S. IMG Non-U.S. IMG
Percentage of Programs that Typically Interview and Rank Each Applicant Groups
Figure P-5Pediatrics
Program's Interview Activities
0%
10%
20%
30%
40%
50%
60%
70%
80%
90%
100%
0% 1-24% 25-49% 50-74% 75-99% 100%
13%
21%
9%
17%
33%
9%
Percentage of Program's Interview Slots Extended Prior to the November 1st MSPE/Dean's Letter Release Date
0
100
200
300
400
500
600
700
800
900
1,000
Number ofapplications
received
Number ofapplicants
interviewed
Number ofapplicants ranked
Number ofpositions in The
Match
965
160127
13
Average Number of Applications Received, ApplicantsInterviewed and Ranked and Positions in The Match
0%
10%
20%
30%
40%
50%
60%
70%
80%
90%
100%
Percentage of applicationsrejected
Percentage of applicantsreceiving an interview
54%
45%
Average Percentage of Applications Rejected andReviewed
N=126
N=131N=131N=131*N=131*N=129N=131
N=128
40% of Pediatrics programs consider all applicants
* Data from the NRMP database
NRMP Program Director Survey Results, 2012 129

Physical Medicine and Rehabilitation (N=37)
NRMP Program Director Survey Results, 2012 130

Figure PMR-1Physical Medicine and Rehabilitation
Percentage of Programs Citing Each Factor in Selecting Applicants to Interview
0% 10% 20% 30% 40% 50% 60% 70% 80% 90%
USMLE/COMLEX Step 1 score
Letters of recommendation in the specialty
Personal Statement
Grades in required clerkships
USMLE/COMLEX Step 2 score
Grades in clerkship in desired specialty
Graduate of U.S. allopathic medical school
Medical Student Performance Evaluation(MSPE/Dean's Letter)
Class ranking/quartile
Gaps in medical education
Personal prior knowledge of the applicant
Perceived commitment to specialty
Honors in clinical clerkships
Applicant was flagged with Match violation by theNRMP
Volunteer/extracurricular experiences
Other life experience
Honors in clerkship in desired specialty
Consistency of grades
Audition elective/rotation within your department
81%
71%
74%
52%
77%
45%
39%
61%
52%
45%
58%
58%
32%
52%
52%
42%
32%
48%
48%
N=31
NRMP Program Director Survey Results, 2012 131

Figure PMR-1Physical Medicine and Rehabilitation
Percentage of Programs Citing Each Factor in Selecting Applicants to Interview
(continued)
0% 20% 40% 60% 80% 100%
Evidence of professionalism and ethics
Interpersonal skills
Perceived interest in program
Graduate of highly regarded U.S. medical school
Leadership qualities
Alpha Omega Alpha (AOA) membership
Demonstrated involvement and interest in research
Feedback from current residents
Visa status*
Honors in basic sciences
Fluency in language spoken by your patient population
Interest in academic career
Away rotation in your specialty at another institution
USMLE/COMLEX Step 3 score*
Other post-interview contact
Gold Society membership
45%
42%
48%
35%
45%
26%
35%
39%
35%
32%
26%
16%
39%
23%
19%
3%
N=31
* International Medical Graduates only
NRMP Program Director Survey Results, 2012 132

Physical Medicine and Rehabilitation
Mean Importance Ratings* of Factors in Ranking Applicants
Figure PMR-2
0 1 2 3 4 5
Applicant was flagged with Match violation by theNRMP
Interactions with faculty during interview and visit
Interpersonal skills
Interactions with housestaff during interview andvisit
Feedback from current residents
Evidence of professionalism and ethics
Grades in clerkship in desired specialty
Perceived commitment to specialty
Letters of recommendation in the specialty
Graduate of U.S. allopathic medical school
USMLE/COMLEX Step 1 score
Leadership qualities
Honors in clerkship in desired specialty
Gaps in medical education
Grades in required clerkships
USMLE/COMLEX Step 2 score
Honors in clinical clerkships
Class ranking/quartile
Medical Student Performance Evaluation(MSPE/Dean's Letter)
Personal prior knowledge of the applicant
4.9
4.6
4.7
4.6
4.5
4.6
4.2
4.4
4.2
3.1
4.1
4.1
3.7
3.4
3.8
3.9
3.5
3.6
3.7
3.8
N=31
*Ratings on a scale from 1 (not at all important) to 5 (very important).
NRMP Program Director Survey Results, 2012 133

Figure PMR-2Physical Medicine and Rehabilitation
Mean Importance Ratings* of Factors in Ranking Applicants
(continued)
0 1 2 3 4 5
Consistency of grades
Perceived interest in program
Visa status**
Audition elective/rotation within your department
Graduate of highly regarded U.S. medical school
Alpha Omega Alpha (AOA) membership
Fluency in language spoken by your patientpopulation
Personal Statement
Other life experience
Demonstrated involvement and interest inresearch
Honors in basic sciences
Volunteer/extracurricular experiences
USMLE/COMLEX Step 3 score**
Other post-interview contact
Interest in academic career
Gold Society membership
Second interview/visit
Away rotation in your specialty at anotherinstitution
3.8
3.7
3.8
4.1
2.9
2.7
2.8
3.7
3.3
3.2
3.0
3.3
2.9
2.5
2.6
2.1
2.5
2.9
N=31
*Ratings on a scale from 1 (not at all important) to 5 (very important).
** International Medical Graduates only
NRMP Program Director Survey Results, 2012 134
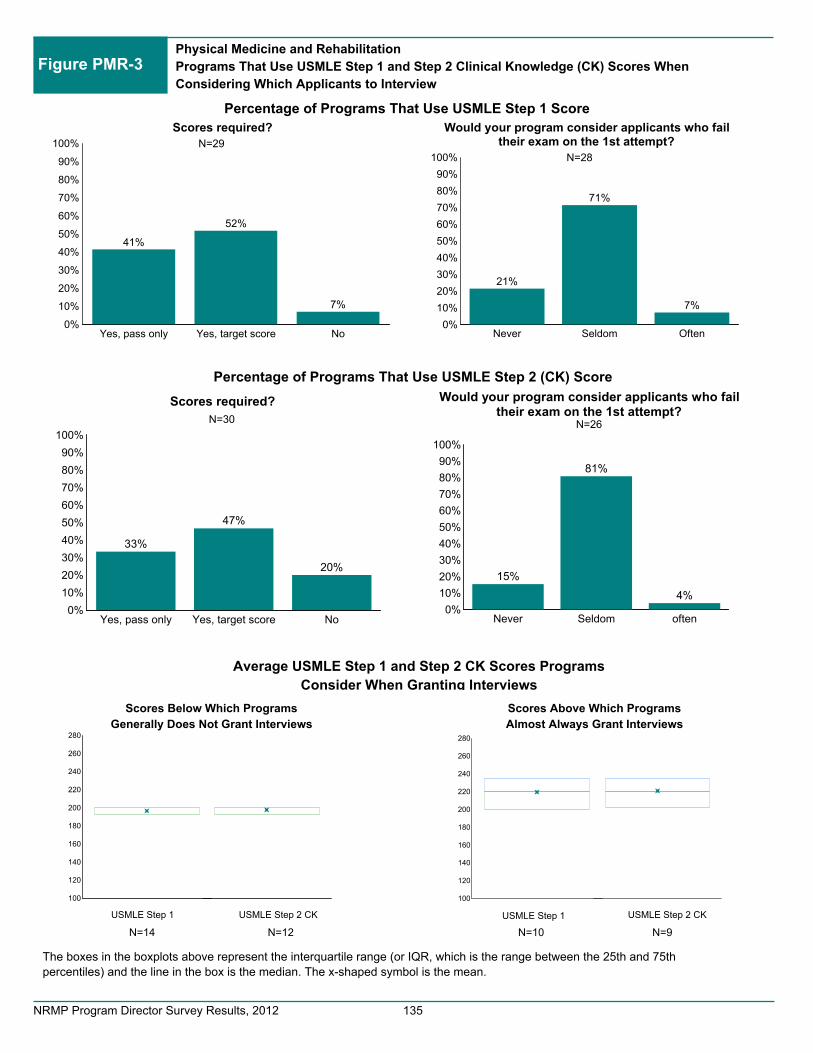
100
120
140
160
180
200
220
240
260
280
Physical Medicine and Rehabilitation
Programs That Use USMLE Step 1 and Step 2 Clinical Knowledge (CK) Scores When
Considering Which Applicants to Interview
Figure PMR-3
Percentage of Programs That Use USMLE Step 2 (CK) Score
0%
10%
20%
30%
40%
50%
60%
70%
80%
90%
100%
Never Seldom Often
21%
71%
7%
Would your program consider applicants who failtheir exam on the 1st attempt?
0%
10%
20%
30%
40%
50%
60%
70%
80%
90%
100%
Never Seldom often
15%
81%
4%
Would your program consider applicants who failtheir exam on the 1st attempt?
0%
10%
20%
30%
40%
50%
60%
70%
80%
90%
100%
Yes, pass only Yes, target score No
41%
52%
7%
Scores required?
0%
10%
20%
30%
40%
50%
60%
70%
80%
90%
100%
Yes, pass only Yes, target score No
33%
47%
20%
Scores required?
N=29
N=28
N=30 N=26
N=12N=14 N=10 N=9
Average USMLE Step 1 and Step 2 CK Scores Programs
Consider When Granting Interviews
Percentage of Programs That Use USMLE Step 1 Score
100
120
140
160
180
200
220
240
260
280
USMLE Step 2 CKUSMLE Step 1 USMLE Step 1 USMLE Step 2 CK
The boxes in the boxplots above represent the interquartile range (or IQR, which is the range between the 25th and 75th
percentiles) and the line in the box is the median. The x-shaped symbol is the mean.
Scores Above Which Programs
Almost Always Grant Interviews
Scores Below Which Programs
Generally Does Not Grant Interviews
NRMP Program Director Survey Results, 2012 135

0%
10%
20%
30%
40%
50%
60%
70%
80%
90%
100%
Yes, pass only Yes, target score No
55%
34%
10%
COMLEX-USA Level 1*
N=29
0%
10%
20%
30%
40%
50%
60%
70%
80%
90%
100%
Yes, pass only No
83%
17%
USMLE Step 2 CS
Physical Medicine and Rehabilitation
Percentage of Programs That Use USMLE Step 2 Clinical Skill (CS), Step 3, and
COMLEX-USA Scores* When Considering Which Applicants to Interview
Figure PMR-4
0%
10%
20%
30%
40%
50%
60%
70%
80%
90%
100%
Yes, pass only Yes, target score No
53%
30%
17%
COMLEX-USA Level 2-CE*
N=20
0%
10%
20%
30%
40%
50%
60%
70%
80%
90%
100%
Yes, pass only Yes, target score No
25%
10%
65%
USMLE Step 3
0%
10%
20%
30%
40%
50%
60%
70%
80%
90%
100%
Yes, pass only Yes, target score No
28%
17%
56%
COMLEX-USA Level 3*
0%
10%
20%
30%
40%
50%
60%
70%
80%
90%
100%
Yes, pass only Yes, target score No
71%
11%18%
COMLEX-USA Level 2-PE*
N=29 N=20
N=29 N=30
N=28 N=18
* Osteopathic applicants only
Percentage of Programs That Use USMLE Step 2 CS and Step 3 Scores
Percentage of Programs That Use COMLEX-USA Level 1 and Level 2-CE Scores
Percentage of Programs That Use COMLEX-USA Level 2-PE and Level 3 Scores
NRMP Program Director Survey Results, 2012 136

0%
10%
20%
30%
40%
50%
60%
70%
80%
90%
100% 97%
67%
97%
45%42%
70%
48%
U.S. Senior U.S. Grad Osteopathic Canadian Fifth Pathway U.S. IMG Non-U.S. IMG
Percentage of Programs that Typically Interview and Rank Each Applicant Groups
Figure PMR-5Physical Medicine and Rehabilitation
Program's Interview Activities
0%
10%
20%
30%
40%
50%
60%
70%
80%
90%
100%
0% 1-24% 25-49% 50-74% 75-99% 100%
25%
16% 16%
6%
31%
6%
Percentage of Program's Interview Slots Extended Prior to the November 1st MSPE/Dean's Letter Release Date
0
100
200
300
400
500
600
700
800
900
1,000
Number ofapplications
received
Number ofapplicants
interviewed
Number ofapplicants ranked
Number ofpositions in The
Match
300
59 444
Average Number of Applications Received, ApplicantsInterviewed and Ranked and Positions in The Match
0%
10%
20%
30%
40%
50%
60%
70%
80%
90%
100%
Percentage of applicationsrejected
Percentage of applicantsreceiving an interview
45%50%
Average Percentage of Applications Rejected andReviewed
N=32
N=33N=36N=37*N=37*N=34N=37
N=33
30% of Physical Medicine and Rehabilitation programs consider all applicants
* Data from the NRMP database
NRMP Program Director Survey Results, 2012 137

Plastic Surgery (N=27)
NRMP Program Director Survey Results, 2012 138

Figure PS-1Plastic Surgery
Percentage of Programs Citing Each Factor in Selecting Applicants to Interview
0% 20% 40% 60% 80% 100%
USMLE/COMLEX Step 1 score
Letters of recommendation in the specialty
Personal Statement
Grades in required clerkships
USMLE/COMLEX Step 2 score
Grades in clerkship in desired specialty
Graduate of U.S. allopathic medical school
Medical Student Performance Evaluation(MSPE/Dean's Letter)
Class ranking/quartile
Gaps in medical education
Personal prior knowledge of the applicant
Perceived commitment to specialty
Honors in clinical clerkships
Applicant was flagged with Match violation by theNRMP
Volunteer/extracurricular experiences
Other life experience
Honors in clerkship in desired specialty
Consistency of grades
Audition elective/rotation within your department
79%
96%
88%
63%
54%
63%
71%
75%
75%
58%
54%
71%
58%
54%
75%
75%
75%
63%
50%
N=24
NRMP Program Director Survey Results, 2012 139

Figure PS-1Plastic Surgery
Percentage of Programs Citing Each Factor in Selecting Applicants to Interview
(continued)
0% 20% 40% 60% 80% 100%
Evidence of professionalism and ethics
Interpersonal skills
Perceived interest in program
Graduate of highly regarded U.S. medical school
Leadership qualities
Alpha Omega Alpha (AOA) membership
Demonstrated involvement and interest in research
Feedback from current residents
Visa status*
Honors in basic sciences
Fluency in language spoken by your patient population
Interest in academic career
Away rotation in your specialty at another institution
USMLE/COMLEX Step 3 score*
Other post-interview contact
Gold Society membership
63%
71%
50%
71%
79%
75%
88%
67%
46%
46%
25%
58%
50%
42%
0%
4%
N=24
* International Medical Graduates only
NRMP Program Director Survey Results, 2012 140

Plastic Surgery
Mean Importance Ratings* of Factors in Ranking Applicants
Figure PS-2
0 1 2 3 4 5
Applicant was flagged with Match violation by theNRMP
Interactions with faculty during interview and visit
Interpersonal skills
Interactions with housestaff during interview andvisit
Feedback from current residents
Evidence of professionalism and ethics
Grades in clerkship in desired specialty
Perceived commitment to specialty
Letters of recommendation in the specialty
Graduate of U.S. allopathic medical school
USMLE/COMLEX Step 1 score
Leadership qualities
Honors in clerkship in desired specialty
Gaps in medical education
Grades in required clerkships
USMLE/COMLEX Step 2 score
Honors in clinical clerkships
Class ranking/quartile
Medical Student Performance Evaluation(MSPE/Dean's Letter)
Personal prior knowledge of the applicant
4.7
4.7
4.6
4.5
4.4
4.5
3.9
4.2
4.7
4.0
3.9
4.2
3.8
3.4
3.8
3.4
3.8
4.0
3.3
4.3
N=24
*Ratings on a scale from 1 (not at all important) to 5 (very important).
NRMP Program Director Survey Results, 2012 141

Figure PS-2Plastic Surgery
Mean Importance Ratings* of Factors in Ranking Applicants
(continued)
0 1 2 3 4 5
Consistency of grades
Perceived interest in program
Visa status**
Audition elective/rotation within your department
Graduate of highly regarded U.S. medical school
Alpha Omega Alpha (AOA) membership
Fluency in language spoken by your patientpopulation
Personal Statement
Other life experience
Demonstrated involvement and interest inresearch
Honors in basic sciences
Volunteer/extracurricular experiences
USMLE/COMLEX Step 3 score**
Other post-interview contact
Interest in academic career
Gold Society membership
Second interview/visit
Away rotation in your specialty at anotherinstitution
3.7
3.8
3.9
3.9
3.7
3.7
2.9
3.7
3.0
3.8
3.2
2.9
2.8
1.0
3.5
2.4
1.0
3.2
N=24
*Ratings on a scale from 1 (not at all important) to 5 (very important).
** International Medical Graduates only
NRMP Program Director Survey Results, 2012 142
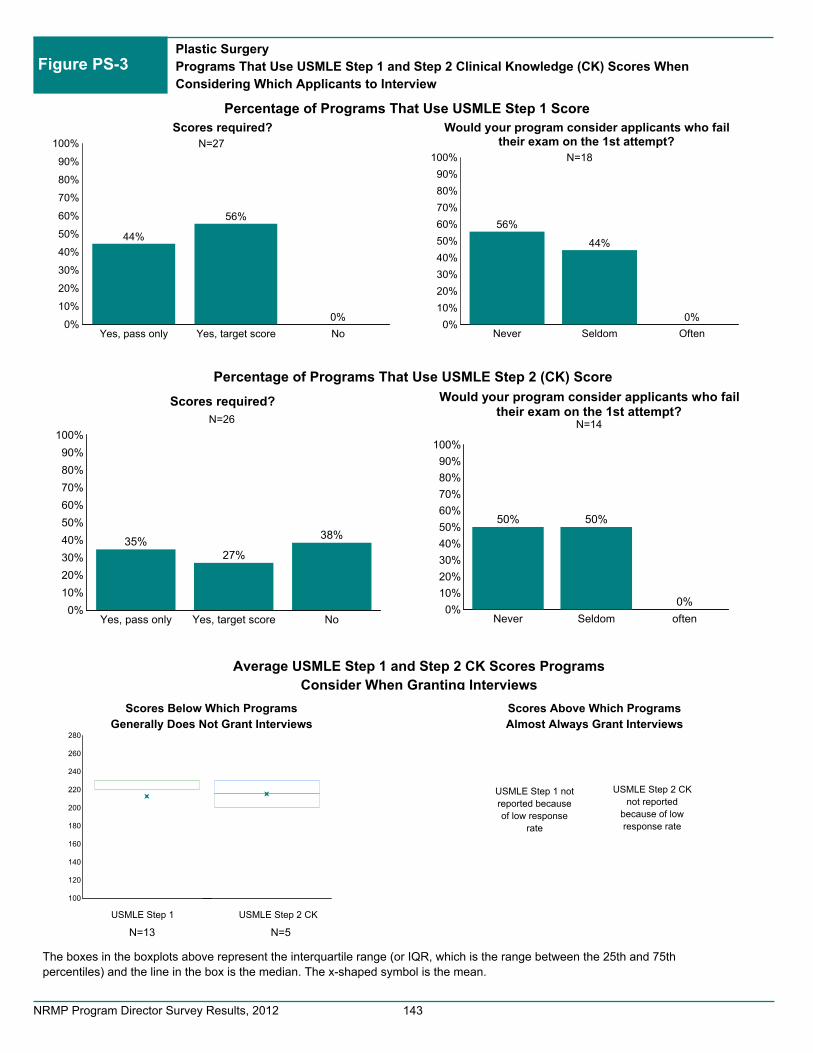
Plastic Surgery
Programs That Use USMLE Step 1 and Step 2 Clinical Knowledge (CK) Scores When
Considering Which Applicants to Interview
Figure PS-3
Percentage of Programs That Use USMLE Step 2 (CK) Score
0%
10%
20%
30%
40%
50%
60%
70%
80%
90%
100%
Never Seldom Often
56%
44%
0%
Would your program consider applicants who failtheir exam on the 1st attempt?
0%
10%
20%
30%
40%
50%
60%
70%
80%
90%
100%
Never Seldom often
50% 50%
0%
Would your program consider applicants who failtheir exam on the 1st attempt?
0%
10%
20%
30%
40%
50%
60%
70%
80%
90%
100%
Yes, pass only Yes, target score No
44%
56%
0%
Scores required?
0%
10%
20%
30%
40%
50%
60%
70%
80%
90%
100%
Yes, pass only Yes, target score No
35%27%
38%
Scores required?
N=27
N=18
N=26 N=14
N=5N=13
Average USMLE Step 1 and Step 2 CK Scores Programs
Consider When Granting Interviews
Percentage of Programs That Use USMLE Step 1 Score
100
120
140
160
180
200
220
240
260
280
USMLE Step 2 CKUSMLE Step 1
The boxes in the boxplots above represent the interquartile range (or IQR, which is the range between the 25th and 75th
percentiles) and the line in the box is the median. The x-shaped symbol is the mean.
Scores Above Which Programs
Almost Always Grant Interviews
Scores Below Which Programs
Generally Does Not Grant Interviews
USMLE Step 1 not
reported because
of low response
rate
USMLE Step 2 CK
not reported
because of low
response rate
NRMP Program Director Survey Results, 2012 143

0%
10%
20%
30%
40%
50%
60%
70%
80%
90%
100%
Yes, pass only Yes, target score No
46%
8%
46%
COMLEX-USA Level 1*
N=25
0%
10%
20%
30%
40%
50%
60%
70%
80%
90%
100%
Yes, pass only No
60%
40%
USMLE Step 2 CS
Plastic Surgery
Percentage of Programs That Use USMLE Step 2 Clinical Skill (CS), Step 3, and
COMLEX-USA Scores* When Considering Which Applicants to Interview
Figure PS-4
0%
10%
20%
30%
40%
50%
60%
70%
80%
90%
100%
Yes, pass only Yes, target score No
36%
0%
64%
COMLEX-USA Level 2-CE*
N=22
0%
10%
20%
30%
40%
50%
60%
70%
80%
90%
100%
Yes, pass only Yes, target score No
27%
9%
64%
USMLE Step 3
0%
10%
20%
30%
40%
50%
60%
70%
80%
90%
100%
Yes, pass only Yes, target score No
30%
10%
60%
COMLEX-USA Level 3*
0%
10%
20%
30%
40%
50%
60%
70%
80%
90%
100%
Yes, pass only Yes, target score No
36%
9%
55%
COMLEX-USA Level 2-PE*
N=25 N=22
N=13 N=11
N=11 N=10
* Osteopathic applicants only
Percentage of Programs That Use USMLE Step 2 CS and Step 3 Scores
Percentage of Programs That Use COMLEX-USA Level 1 and Level 2-CE Scores
Percentage of Programs That Use COMLEX-USA Level 2-PE and Level 3 Scores
NRMP Program Director Survey Results, 2012 144

0%
10%
20%
30%
40%
50%
60%
70%
80%
90%
100% 96%
65%
50%
58%
42%46%
42%
U.S. Senior U.S. Grad Osteopathic Canadian Fifth Pathway U.S. IMG Non-U.S. IMG
Percentage of Programs that Typically Interview and Rank Each Applicant Groups
Figure PS-5Plastic Surgery
Program's Interview Activities
0%
10%
20%
30%
40%
50%
60%
70%
80%
90%
100%
0% 1-24% 25-49% 50-74% 75-99% 100%
93%
0%4%
0% 0%4%
Percentage of Program's Interview Slots Extended Prior to the November 1st MSPE/Dean's Letter Release Date
0
100
200
300
400
500
600
700
800
900
1,000
Number ofapplications
received
Number ofapplicants
interviewed
Number ofapplicants ranked
Number ofpositions in The
Match
172
29 22 2
Average Number of Applications Received, ApplicantsInterviewed and Ranked and Positions in The Match
0%
10%
20%
30%
40%
50%
60%
70%
80%
90%
100%
Percentage of applicationsrejected
Percentage of applicantsreceiving an interview
30%
71%
Average Percentage of Applications Rejected andReviewed
N=27
N=25N=25N=27*N=27*N=27N=26
N=26
38% of Plastic Surgery programs consider all applicants
* Data from the NRMP database
NRMP Program Director Survey Results, 2012 145

Psychiatry (N=88)
NRMP Program Director Survey Results, 2012 146

Figure PSY-1Psychiatry
Percentage of Programs Citing Each Factor in Selecting Applicants to Interview
0% 20% 40% 60% 80% 100%
USMLE/COMLEX Step 1 score
Letters of recommendation in the specialty
Personal Statement
Grades in required clerkships
USMLE/COMLEX Step 2 score
Grades in clerkship in desired specialty
Graduate of U.S. allopathic medical school
Medical Student Performance Evaluation(MSPE/Dean's Letter)
Class ranking/quartile
Gaps in medical education
Personal prior knowledge of the applicant
Perceived commitment to specialty
Honors in clinical clerkships
Applicant was flagged with Match violation by theNRMP
Volunteer/extracurricular experiences
Other life experience
Honors in clerkship in desired specialty
Consistency of grades
Audition elective/rotation within your department
85%
81%
86%
69%
78%
62%
65%
69%
53%
81%
72%
84%
54%
84%
64%
70%
57%
65%
55%
N=74
NRMP Program Director Survey Results, 2012 147

Figure PSY-1Psychiatry
Percentage of Programs Citing Each Factor in Selecting Applicants to Interview
(continued)
0% 20% 40% 60% 80% 100%
Evidence of professionalism and ethics
Interpersonal skills
Perceived interest in program
Graduate of highly regarded U.S. medical school
Leadership qualities
Alpha Omega Alpha (AOA) membership
Demonstrated involvement and interest in research
Feedback from current residents
Visa status*
Honors in basic sciences
Fluency in language spoken by your patient population
Interest in academic career
Away rotation in your specialty at another institution
USMLE/COMLEX Step 3 score*
Other post-interview contact
Gold Society membership
72%
62%
65%
58%
58%
38%
53%
55%
66%
47%
66%
41%
27%
49%
27%
27%
N=74
* International Medical Graduates only
NRMP Program Director Survey Results, 2012 148

Psychiatry
Mean Importance Ratings* of Factors in Ranking Applicants
Figure PSY-2
0 1 2 3 4 5
Applicant was flagged with Match violation by theNRMP
Interactions with faculty during interview and visit
Interpersonal skills
Interactions with housestaff during interview andvisit
Feedback from current residents
Evidence of professionalism and ethics
Grades in clerkship in desired specialty
Perceived commitment to specialty
Letters of recommendation in the specialty
Graduate of U.S. allopathic medical school
USMLE/COMLEX Step 1 score
Leadership qualities
Honors in clerkship in desired specialty
Gaps in medical education
Grades in required clerkships
USMLE/COMLEX Step 2 score
Honors in clinical clerkships
Class ranking/quartile
Medical Student Performance Evaluation(MSPE/Dean's Letter)
Personal prior knowledge of the applicant
4.9
4.9
4.9
4.8
4.7
4.8
4.1
4.5
4.0
3.8
3.8
4.1
4.0
4.3
3.8
3.8
3.7
3.4
4.3
3.6
N=74
*Ratings on a scale from 1 (not at all important) to 5 (very important).
NRMP Program Director Survey Results, 2012 149

Figure PSY-2Psychiatry
Mean Importance Ratings* of Factors in Ranking Applicants
(continued)
0 1 2 3 4 5
Consistency of grades
Perceived interest in program
Visa status**
Audition elective/rotation within your department
Graduate of highly regarded U.S. medical school
Alpha Omega Alpha (AOA) membership
Fluency in language spoken by your patientpopulation
Personal Statement
Other life experience
Demonstrated involvement and interest inresearch
Honors in basic sciences
Volunteer/extracurricular experiences
USMLE/COMLEX Step 3 score**
Other post-interview contact
Interest in academic career
Gold Society membership
Second interview/visit
Away rotation in your specialty at anotherinstitution
3.6
3.8
3.8
3.5
3.6
3.1
4.2
3.8
3.5
3.0
2.9
3.1
3.3
3.1
2.9
2.9
2.9
2.2
N=74
*Ratings on a scale from 1 (not at all important) to 5 (very important).
** International Medical Graduates only
NRMP Program Director Survey Results, 2012 150

100
120
140
160
180
200
220
240
260
280
Psychiatry
Programs That Use USMLE Step 1 and Step 2 Clinical Knowledge (CK) Scores When
Considering Which Applicants to Interview
Figure PSY-3
Percentage of Programs That Use USMLE Step 2 (CK) Score
0%
10%
20%
30%
40%
50%
60%
70%
80%
90%
100%
Never Seldom Often
5%
56%
39%
Would your program consider applicants who failtheir exam on the 1st attempt?
0%
10%
20%
30%
40%
50%
60%
70%
80%
90%
100%
Never Seldom often
5%
67%
29%
Would your program consider applicants who failtheir exam on the 1st attempt?
0%
10%
20%
30%
40%
50%
60%
70%
80%
90%
100%
Yes, pass only Yes, target score No
65%
34%
1%
Scores required?
0%
10%
20%
30%
40%
50%
60%
70%
80%
90%
100%
Yes, pass only Yes, target score No
56%
33%
11%
Scores required?
N=82
N=64
N=82 N=63
N=22N=22 N=20 N=20
Average USMLE Step 1 and Step 2 CK Scores Programs
Consider When Granting Interviews
Percentage of Programs That Use USMLE Step 1 Score
100
120
140
160
180
200
220
240
260
280
USMLE Step 2 CKUSMLE Step 1 USMLE Step 1 USMLE Step 2 CK
The boxes in the boxplots above represent the interquartile range (or IQR, which is the range between the 25th and 75th
percentiles) and the line in the box is the median. The x-shaped symbol is the mean.
Scores Above Which Programs
Almost Always Grant Interviews
Scores Below Which Programs
Generally Does Not Grant Interviews
NRMP Program Director Survey Results, 2012 151

0%
10%
20%
30%
40%
50%
60%
70%
80%
90%
100%
Yes, pass only Yes, target score No
63%
34%
3%
COMLEX-USA Level 1*
N=80
0%
10%
20%
30%
40%
50%
60%
70%
80%
90%
100%
Yes, pass only No
84%
16%
USMLE Step 2 CS
Psychiatry
Percentage of Programs That Use USMLE Step 2 Clinical Skill (CS), Step 3, and
COMLEX-USA Scores* When Considering Which Applicants to Interview
Figure PSY-4
0%
10%
20%
30%
40%
50%
60%
70%
80%
90%
100%
Yes, pass only Yes, target score No
61%
28%
12%
COMLEX-USA Level 2-CE*
N=59
0%
10%
20%
30%
40%
50%
60%
70%
80%
90%
100%
Yes, pass only Yes, target score No
32%
19%
49%
USMLE Step 3
0%
10%
20%
30%
40%
50%
60%
70%
80%
90%
100%
Yes, pass only Yes, target score No
30%
15%
54%
COMLEX-USA Level 3*
0%
10%
20%
30%
40%
50%
60%
70%
80%
90%
100%
Yes, pass only Yes, target score No
74%
10%16%
COMLEX-USA Level 2-PE*
N=80 N=59
N=70 N=69
N=68 N=46
* Osteopathic applicants only
Percentage of Programs That Use USMLE Step 2 CS and Step 3 Scores
Percentage of Programs That Use COMLEX-USA Level 1 and Level 2-CE Scores
Percentage of Programs That Use COMLEX-USA Level 2-PE and Level 3 Scores
NRMP Program Director Survey Results, 2012 152

0%
10%
20%
30%
40%
50%
60%
70%
80%
90%
100% 97%
81%
94%
71%
63%
90%
76%
U.S. Senior U.S. Grad Osteopathic Canadian Fifth Pathway U.S. IMG Non-U.S. IMG
Percentage of Programs that Typically Interview and Rank Each Applicant Groups
Figure PSY-5Psychiatry
Program's Interview Activities
0%
10%
20%
30%
40%
50%
60%
70%
80%
90%
100%
0% 1-24% 25-49% 50-74% 75-99% 100%
10%
19% 18% 20%28%
5%
Percentage of Program's Interview Slots Extended Prior to the November 1st MSPE/Dean's Letter Release Date
0
100
200
300
400
500
600
700
800
900
1,000
Number ofapplications
received
Number ofapplicants
interviewed
Number ofapplicants ranked
Number ofpositions in The
Match
664
68 506
Average Number of Applications Received, ApplicantsInterviewed and Ranked and Positions in The Match
0%
10%
20%
30%
40%
50%
60%
70%
80%
90%
100%
Percentage of applicationsrejected
Percentage of applicantsreceiving an interview
55%
42%
Average Percentage of Applications Rejected andReviewed
N=83
N=83N=83N=88*N=88*N=85N=86
N=86
58% of Psychiatry programs consider all applicants
* Data from the NRMP database
NRMP Program Director Survey Results, 2012 153

Radiation Oncology (N=45)
NRMP Program Director Survey Results, 2012 154

Figure RO-1Radiation Oncology
Percentage of Programs Citing Each Factor in Selecting Applicants to Interview
0% 20% 40% 60% 80% 100%
USMLE/COMLEX Step 1 score
Letters of recommendation in the specialty
Personal Statement
Grades in required clerkships
USMLE/COMLEX Step 2 score
Grades in clerkship in desired specialty
Graduate of U.S. allopathic medical school
Medical Student Performance Evaluation(MSPE/Dean's Letter)
Class ranking/quartile
Gaps in medical education
Personal prior knowledge of the applicant
Perceived commitment to specialty
Honors in clinical clerkships
Applicant was flagged with Match violation by theNRMP
Volunteer/extracurricular experiences
Other life experience
Honors in clerkship in desired specialty
Consistency of grades
Audition elective/rotation within your department
92%
97%
92%
81%
64%
81%
69%
81%
83%
58%
67%
89%
75%
64%
64%
64%
72%
64%
86%
N=36
NRMP Program Director Survey Results, 2012 155

Figure RO-1Radiation Oncology
Percentage of Programs Citing Each Factor in Selecting Applicants to Interview
(continued)
0% 20% 40% 60% 80% 100%
Evidence of professionalism and ethics
Interpersonal skills
Perceived interest in program
Graduate of highly regarded U.S. medical school
Leadership qualities
Alpha Omega Alpha (AOA) membership
Demonstrated involvement and interest in research
Feedback from current residents
Visa status*
Honors in basic sciences
Fluency in language spoken by your patient population
Interest in academic career
Away rotation in your specialty at another institution
USMLE/COMLEX Step 3 score*
Other post-interview contact
Gold Society membership
58%
72%
86%
69%
56%
61%
89%
64%
47%
50%
44%
67%
69%
25%
11%
14%
N=36
* International Medical Graduates only
NRMP Program Director Survey Results, 2012 156

Radiation Oncology
Mean Importance Ratings* of Factors in Ranking Applicants
Figure RO-2
0 1 2 3 4 5
Applicant was flagged with Match violation by theNRMP
Interactions with faculty during interview and visit
Interpersonal skills
Interactions with housestaff during interview andvisit
Feedback from current residents
Evidence of professionalism and ethics
Grades in clerkship in desired specialty
Perceived commitment to specialty
Letters of recommendation in the specialty
Graduate of U.S. allopathic medical school
USMLE/COMLEX Step 1 score
Leadership qualities
Honors in clerkship in desired specialty
Gaps in medical education
Grades in required clerkships
USMLE/COMLEX Step 2 score
Honors in clinical clerkships
Class ranking/quartile
Medical Student Performance Evaluation(MSPE/Dean's Letter)
Personal prior knowledge of the applicant
4.6
4.8
4.7
4.5
4.5
4.4
4.5
4.6
4.5
4.5
4.3
4.1
4.3
3.6
4.1
3.7
4.1
4.1
3.7
4.4
N=36
*Ratings on a scale from 1 (not at all important) to 5 (very important).
NRMP Program Director Survey Results, 2012 157

Figure RO-2Radiation Oncology
Mean Importance Ratings* of Factors in Ranking Applicants
(continued)
0 1 2 3 4 5
Consistency of grades
Perceived interest in program
Visa status**
Audition elective/rotation within your department
Graduate of highly regarded U.S. medical school
Alpha Omega Alpha (AOA) membership
Fluency in language spoken by your patientpopulation
Personal Statement
Other life experience
Demonstrated involvement and interest inresearch
Honors in basic sciences
Volunteer/extracurricular experiences
USMLE/COMLEX Step 3 score**
Other post-interview contact
Interest in academic career
Gold Society membership
Second interview/visit
Away rotation in your specialty at anotherinstitution
3.9
4.3
3.8
4.3
3.9
3.5
3.3
3.1
3.1
4.5
3.4
3.0
3.0
3.0
3.8
2.7
2.3
3.9
N=36
*Ratings on a scale from 1 (not at all important) to 5 (very important).
** International Medical Graduates only
NRMP Program Director Survey Results, 2012 158

100
120
140
160
180
200
220
240
260
280
Radiation Oncology
Programs That Use USMLE Step 1 and Step 2 Clinical Knowledge (CK) Scores When
Considering Which Applicants to Interview
Figure RO-3
Percentage of Programs That Use USMLE Step 2 (CK) Score
0%
10%
20%
30%
40%
50%
60%
70%
80%
90%
100%
Never Seldom Often
59%
38%
3%
Would your program consider applicants who failtheir exam on the 1st attempt?
0%
10%
20%
30%
40%
50%
60%
70%
80%
90%
100%
Never Seldom often
65%
26%
9%
Would your program consider applicants who failtheir exam on the 1st attempt?
0%
10%
20%
30%
40%
50%
60%
70%
80%
90%
100%
Yes, pass only Yes, target score No
21%
79%
0%
Scores required?
0%
10%
20%
30%
40%
50%
60%
70%
80%
90%
100%
Yes, pass only Yes, target score No
24%
45%
32%
Scores required?
N=42
N=34
N=38 N=23
N=12N=25 N=17 N=7
Average USMLE Step 1 and Step 2 CK Scores Programs
Consider When Granting Interviews
Percentage of Programs That Use USMLE Step 1 Score
100
120
140
160
180
200
220
240
260
280
USMLE Step 2 CKUSMLE Step 1 USMLE Step 1 USMLE Step 2 CK
The boxes in the boxplots above represent the interquartile range (or IQR, which is the range between the 25th and 75th
percentiles) and the line in the box is the median. The x-shaped symbol is the mean.
Scores Above Which Programs
Almost Always Grant Interviews
Scores Below Which Programs
Generally Does Not Grant Interviews
NRMP Program Director Survey Results, 2012 159

0%
10%
20%
30%
40%
50%
60%
70%
80%
90%
100%
Yes, pass only Yes, target score No
20%
10%
70%
COMLEX-USA Level 1*
N=37
0%
10%
20%
30%
40%
50%
60%
70%
80%
90%
100%
Yes, pass only No
70%
30%
USMLE Step 2 CS
Radiation Oncology
Percentage of Programs That Use USMLE Step 2 Clinical Skill (CS), Step 3, and
COMLEX-USA Scores* When Considering Which Applicants to Interview
Figure RO-4
0%
10%
20%
30%
40%
50%
60%
70%
80%
90%
100%
Yes, pass only Yes, target score No
11%5%
84%
COMLEX-USA Level 2-CE*
N=30
0%
10%
20%
30%
40%
50%
60%
70%
80%
90%
100%
Yes, pass only Yes, target score No
30%
0%
70%
USMLE Step 3
0%
10%
20%
30%
40%
50%
60%
70%
80%
90%
100%
Yes, pass only Yes, target score No
16%
0%
84%
COMLEX-USA Level 3*
0%
10%
20%
30%
40%
50%
60%
70%
80%
90%
100%
Yes, pass only Yes, target score No
16%
0%
84%
COMLEX-USA Level 2-PE*
N=37 N=30
N=20 N=19
N=19 N=19
* Osteopathic applicants only
Percentage of Programs That Use USMLE Step 2 CS and Step 3 Scores
Percentage of Programs That Use COMLEX-USA Level 1 and Level 2-CE Scores
Percentage of Programs That Use COMLEX-USA Level 2-PE and Level 3 Scores
NRMP Program Director Survey Results, 2012 160

0%
10%
20%
30%
40%
50%
60%
70%
80%
90%
100% 98%
67%63%
37%33% 33% 33%
U.S. Senior U.S. Grad Osteopathic Canadian Fifth Pathway U.S. IMG Non-U.S. IMG
Percentage of Programs that Typically Interview and Rank Each Applicant Groups
Figure RO-5Radiation Oncology
Program's Interview Activities
0%
10%
20%
30%
40%
50%
60%
70%
80%
90%
100%
0% 1-24% 25-49% 50-74% 75-99% 100%
69%
5% 5%10%
2%10%
Percentage of Program's Interview Slots Extended Prior to the November 1st MSPE/Dean's Letter Release Date
0
100
200
300
400
500
600
700
800
900
1,000
Number ofapplications
received
Number ofapplicants
interviewed
Number ofapplicants ranked
Number ofpositions in The
Match
183
28 24 2
Average Number of Applications Received, ApplicantsInterviewed and Ranked and Positions in The Match
0%
10%
20%
30%
40%
50%
60%
70%
80%
90%
100%
Percentage of applicationsrejected
Percentage of applicantsreceiving an interview
30%
67%
Average Percentage of Applications Rejected andReviewed
N=42
N=45N=44N=45*N=45*N=44N=45
N=43
30% of Radiation Oncology programs consider all applicants
* Data from the NRMP database
NRMP Program Director Survey Results, 2012 161

Radiology (N=88)
NRMP Program Director Survey Results, 2012 162

Figure RD-1Radiology
Percentage of Programs Citing Each Factor in Selecting Applicants to Interview
0% 20% 40% 60% 80% 100%
USMLE/COMLEX Step 1 score
Letters of recommendation in the specialty
Personal Statement
Grades in required clerkships
USMLE/COMLEX Step 2 score
Grades in clerkship in desired specialty
Graduate of U.S. allopathic medical school
Medical Student Performance Evaluation(MSPE/Dean's Letter)
Class ranking/quartile
Gaps in medical education
Personal prior knowledge of the applicant
Perceived commitment to specialty
Honors in clinical clerkships
Applicant was flagged with Match violation by theNRMP
Volunteer/extracurricular experiences
Other life experience
Honors in clerkship in desired specialty
Consistency of grades
Audition elective/rotation within your department
75%
76%
86%
76%
51%
66%
74%
74%
79%
73%
64%
60%
66%
70%
63%
69%
59%
71%
66%
N=80
NRMP Program Director Survey Results, 2012 163

Figure RD-1Radiology
Percentage of Programs Citing Each Factor in Selecting Applicants to Interview
(continued)
0% 20% 40% 60% 80% 100%
Evidence of professionalism and ethics
Interpersonal skills
Perceived interest in program
Graduate of highly regarded U.S. medical school
Leadership qualities
Alpha Omega Alpha (AOA) membership
Demonstrated involvement and interest in research
Feedback from current residents
Visa status*
Honors in basic sciences
Fluency in language spoken by your patient population
Interest in academic career
Away rotation in your specialty at another institution
USMLE/COMLEX Step 3 score*
Other post-interview contact
Gold Society membership
61%
56%
63%
49%
59%
66%
66%
51%
59%
54%
28%
34%
25%
15%
23%
19%
N=80
* International Medical Graduates only
NRMP Program Director Survey Results, 2012 164

Radiology
Mean Importance Ratings* of Factors in Ranking Applicants
Figure RD-2
0 1 2 3 4 5
Applicant was flagged with Match violation by theNRMP
Interactions with faculty during interview and visit
Interpersonal skills
Interactions with housestaff during interview andvisit
Feedback from current residents
Evidence of professionalism and ethics
Grades in clerkship in desired specialty
Perceived commitment to specialty
Letters of recommendation in the specialty
Graduate of U.S. allopathic medical school
USMLE/COMLEX Step 1 score
Leadership qualities
Honors in clerkship in desired specialty
Gaps in medical education
Grades in required clerkships
USMLE/COMLEX Step 2 score
Honors in clinical clerkships
Class ranking/quartile
Medical Student Performance Evaluation(MSPE/Dean's Letter)
Personal prior knowledge of the applicant
4.8
4.8
4.7
4.8
4.6
4.5
3.8
4.2
3.7
4.2
4.2
4.0
3.8
3.9
4.2
3.5
4.3
4.2
4.2
3.7
N=80
*Ratings on a scale from 1 (not at all important) to 5 (very important).
NRMP Program Director Survey Results, 2012 165

Figure RD-2Radiology
Mean Importance Ratings* of Factors in Ranking Applicants
(continued)
0 1 2 3 4 5
Consistency of grades
Perceived interest in program
Visa status**
Audition elective/rotation within your department
Graduate of highly regarded U.S. medical school
Alpha Omega Alpha (AOA) membership
Fluency in language spoken by your patientpopulation
Personal Statement
Other life experience
Demonstrated involvement and interest inresearch
Honors in basic sciences
Volunteer/extracurricular experiences
USMLE/COMLEX Step 3 score**
Other post-interview contact
Interest in academic career
Gold Society membership
Second interview/visit
Away rotation in your specialty at anotherinstitution
4.0
3.8
4.0
3.5
3.7
3.8
2.8
3.3
3.2
3.4
3.4
2.8
2.5
2.7
2.9
2.8
2.4
2.0
N=80
*Ratings on a scale from 1 (not at all important) to 5 (very important).
** International Medical Graduates only
NRMP Program Director Survey Results, 2012 166

100
120
140
160
180
200
220
240
260
280
Radiology
Programs That Use USMLE Step 1 and Step 2 Clinical Knowledge (CK) Scores When
Considering Which Applicants to Interview
Figure RD-3
Percentage of Programs That Use USMLE Step 2 (CK) Score
0%
10%
20%
30%
40%
50%
60%
70%
80%
90%
100%
Never Seldom Often
59%
41%
0%
Would your program consider applicants who failtheir exam on the 1st attempt?
0%
10%
20%
30%
40%
50%
60%
70%
80%
90%
100%
Never Seldom often
60%
40%
0%
Would your program consider applicants who failtheir exam on the 1st attempt?
0%
10%
20%
30%
40%
50%
60%
70%
80%
90%
100%
Yes, pass only Yes, target score No
13%
87%
0%
Scores required?
0%
10%
20%
30%
40%
50%
60%
70%
80%
90%
100%
Yes, pass only Yes, target score No
18%
35%
47%
Scores required?
N=83
N=74
N=79 N=50
N=25N=62 N=39 N=19
Average USMLE Step 1 and Step 2 CK Scores Programs
Consider When Granting Interviews
Percentage of Programs That Use USMLE Step 1 Score
100
120
140
160
180
200
220
240
260
280
USMLE Step 2 CKUSMLE Step 1 USMLE Step 1 USMLE Step 2 CK
The boxes in the boxplots above represent the interquartile range (or IQR, which is the range between the 25th and 75th
percentiles) and the line in the box is the median. The x-shaped symbol is the mean.
Scores Above Which Programs
Almost Always Grant Interviews
Scores Below Which Programs
Generally Does Not Grant Interviews
NRMP Program Director Survey Results, 2012 167

0%
10%
20%
30%
40%
50%
60%
70%
80%
90%
100%
Yes, pass only Yes, target score No
13%
36%
51%
COMLEX-USA Level 1*
N=78
0%
10%
20%
30%
40%
50%
60%
70%
80%
90%
100%
Yes, pass only No
47%53%
USMLE Step 2 CS
Radiology
Percentage of Programs That Use USMLE Step 2 Clinical Skill (CS), Step 3, and
COMLEX-USA Scores* When Considering Which Applicants to Interview
Figure RD-4
0%
10%
20%
30%
40%
50%
60%
70%
80%
90%
100%
Yes, pass only Yes, target score No
16%20%
64%
COMLEX-USA Level 2-CE*
N=56
0%
10%
20%
30%
40%
50%
60%
70%
80%
90%
100%
Yes, pass only Yes, target score No
16%
5%
79%
USMLE Step 3
0%
10%
20%
30%
40%
50%
60%
70%
80%
90%
100%
Yes, pass only Yes, target score No
12%7%
80%
COMLEX-USA Level 3*
0%
10%
20%
30%
40%
50%
60%
70%
80%
90%
100%
Yes, pass only Yes, target score No
16%9%
74%
COMLEX-USA Level 2-PE*
N=78 N=56
N=45 N=44
N=43 N=41
* Osteopathic applicants only
Percentage of Programs That Use USMLE Step 2 CS and Step 3 Scores
Percentage of Programs That Use COMLEX-USA Level 1 and Level 2-CE Scores
Percentage of Programs That Use COMLEX-USA Level 2-PE and Level 3 Scores
NRMP Program Director Survey Results, 2012 168

0%
10%
20%
30%
40%
50%
60%
70%
80%
90%
100%99%
79%
69%
52%
34%
52%
42%
U.S. Senior U.S. Grad Osteopathic Canadian Fifth Pathway U.S. IMG Non-U.S. IMG
Percentage of Programs that Typically Interview and Rank Each Applicant Groups
Figure RD-5Radiology
Program's Interview Activities
0%
10%
20%
30%
40%
50%
60%
70%
80%
90%
100%
0% 1-24% 25-49% 50-74% 75-99% 100%
40%
9%5%
10%
23%
13%
Percentage of Program's Interview Slots Extended Prior to the November 1st MSPE/Dean's Letter Release Date
0
100
200
300
400
500
600
700
800
900
1,000
Number ofapplications
received
Number ofapplicants
interviewed
Number ofapplicants ranked
Number ofpositions in The
Match
458
77 646
Average Number of Applications Received, ApplicantsInterviewed and Ranked and Positions in The Match
0%
10%
20%
30%
40%
50%
60%
70%
80%
90%
100%
Percentage of applicationsrejected
Percentage of applicantsreceiving an interview
40%
57%
Average Percentage of Applications Rejected andReviewed
N=82
N=82N=82N=88*N=88*N=83N=84
N=86
33% of Radiology programs consider all applicants
* Data from the NRMP database
NRMP Program Director Survey Results, 2012 169

Vascular Surgery (N=13)
NRMP Program Director Survey Results, 2012 170

Figure VS-1Vascular Surgery
Percentage of Programs Citing Each Factor in Selecting Applicants to Interview
0% 20% 40% 60% 80% 100%
USMLE/COMLEX Step 1 score
Letters of recommendation in the specialty
Personal Statement
Grades in required clerkships
USMLE/COMLEX Step 2 score
Grades in clerkship in desired specialty
Graduate of U.S. allopathic medical school
Medical Student Performance Evaluation(MSPE/Dean's Letter)
Class ranking/quartile
Gaps in medical education
Personal prior knowledge of the applicant
Perceived commitment to specialty
Honors in clinical clerkships
Applicant was flagged with Match violation by theNRMP
Volunteer/extracurricular experiences
Other life experience
Honors in clerkship in desired specialty
Consistency of grades
Audition elective/rotation within your department
100%
100%
100%
71%
71%
86%
86%
100%
86%
100%
100%
100%
100%
57%
100%
86%
100%
86%
100%
N=7
NRMP Program Director Survey Results, 2012 171

Figure VS-1Vascular Surgery
Percentage of Programs Citing Each Factor in Selecting Applicants to Interview
(continued)
0% 20% 40% 60% 80% 100%
Evidence of professionalism and ethics
Interpersonal skills
Perceived interest in program
Graduate of highly regarded U.S. medical school
Leadership qualities
Alpha Omega Alpha (AOA) membership
Demonstrated involvement and interest in research
Feedback from current residents
Visa status*
Honors in basic sciences
Fluency in language spoken by your patient population
Interest in academic career
Away rotation in your specialty at another institution
USMLE/COMLEX Step 3 score*
Other post-interview contact
Gold Society membership
86%
86%
100%
100%
71%
100%
100%
86%
100%
86%
57%
100%
57%
71%
43%
14%
N=7
* International Medical Graduates only
NRMP Program Director Survey Results, 2012 172

Vascular Surgery
Mean Importance Ratings* of Factors in Ranking Applicants
Figure VS-2
0 1 2 3 4 5
Applicant was flagged with Match violation by theNRMP
Interactions with faculty during interview and visit
Interpersonal skills
Interactions with housestaff during interview andvisit
Feedback from current residents
Evidence of professionalism and ethics
Grades in clerkship in desired specialty
Perceived commitment to specialty
Letters of recommendation in the specialty
Graduate of U.S. allopathic medical school
USMLE/COMLEX Step 1 score
Leadership qualities
Honors in clerkship in desired specialty
Gaps in medical education
Grades in required clerkships
USMLE/COMLEX Step 2 score
Honors in clinical clerkships
Class ranking/quartile
Medical Student Performance Evaluation(MSPE/Dean's Letter)
Personal prior knowledge of the applicant
4.9
4.9
4.6
4.7
4.4
4.8
4.4
4.5
4.8
4.1
4.3
4.3
4.4
3.2
3.8
3.9
4.0
3.9
3.5
3.9
N=7
*Ratings on a scale from 1 (not at all important) to 5 (very important).
NRMP Program Director Survey Results, 2012 173
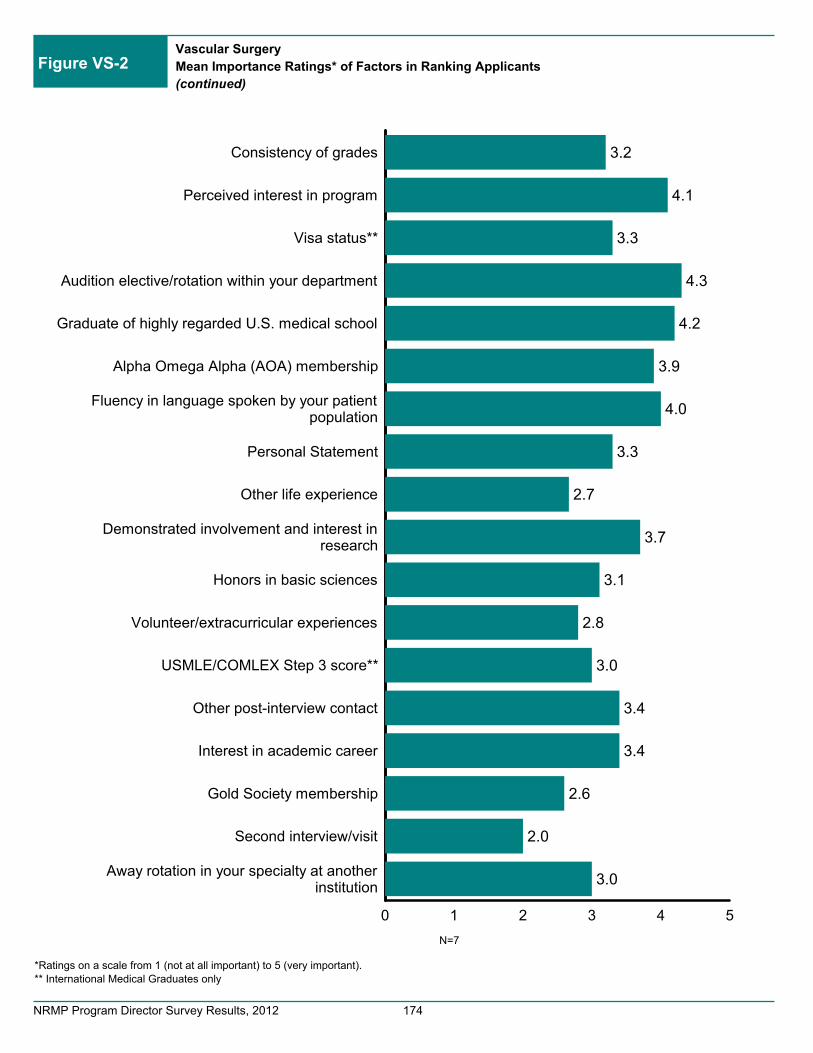
Figure VS-2Vascular Surgery
Mean Importance Ratings* of Factors in Ranking Applicants
(continued)
0 1 2 3 4 5
Consistency of grades
Perceived interest in program
Visa status**
Audition elective/rotation within your department
Graduate of highly regarded U.S. medical school
Alpha Omega Alpha (AOA) membership
Fluency in language spoken by your patientpopulation
Personal Statement
Other life experience
Demonstrated involvement and interest inresearch
Honors in basic sciences
Volunteer/extracurricular experiences
USMLE/COMLEX Step 3 score**
Other post-interview contact
Interest in academic career
Gold Society membership
Second interview/visit
Away rotation in your specialty at anotherinstitution
3.2
4.1
3.3
4.3
4.2
3.9
4.0
3.3
2.7
3.7
3.1
2.8
3.0
3.4
3.4
2.6
2.0
3.0
N=7
*Ratings on a scale from 1 (not at all important) to 5 (very important).
** International Medical Graduates only
NRMP Program Director Survey Results, 2012 174

100
120
140
160
180
200
220
240
260
280
Vascular Surgery
Programs That Use USMLE Step 1 and Step 2 Clinical Knowledge (CK) Scores When
Considering Which Applicants to Interview
Figure VS-3
Percentage of Programs That Use USMLE Step 2 (CK) Score
0%
10%
20%
30%
40%
50%
60%
70%
80%
90%
100%
Never Seldom Often
13%
88%
0%
Would your program consider applicants who failtheir exam on the 1st attempt?
0%
10%
20%
30%
40%
50%
60%
70%
80%
90%
100%
0%
100%
0%
Never Seldom often
Would your program consider applicants who failtheir exam on the 1st attempt?
0%
10%
20%
30%
40%
50%
60%
70%
80%
90%
100%
Yes, pass only Yes, target score No
18%
82%
0%
Scores required?
0%
10%
20%
30%
40%
50%
60%
70%
80%
90%
100%
Yes, pass only Yes, target score No
27%
55%
18%
Scores required?
N=11
N=8
N=11 N=5
N=7 N=7
Average USMLE Step 1 and Step 2 CK Scores Programs
Consider When Granting Interviews
Percentage of Programs That Use USMLE Step 1 Score
100
120
140
160
180
200
220
240
260
280
USMLE Step 1 USMLE Step 1
The boxes in the boxplots above represent the interquartile range (or IQR, which is the range between the 25th and 75th
percentiles) and the line in the box is the median. The x-shaped symbol is the mean.
Scores Above Which Programs
Almost Always Grant Interviews
Scores Below Which Programs
Generally Does Not Grant Interviews
USMLE Step 2 CK
not reported
because of low
response rate
USMLE Step 2 CK
not reported
because of low
response rate
NRMP Program Director Survey Results, 2012 175

N=11
0%
10%
20%
30%
40%
50%
60%
70%
80%
90%
100%
Yes, pass only No
73%
27%
USMLE Step 2 CS
Vascular Surgery
Percentage of Programs That Use USMLE Step 2 Clinical Skill (CS), Step 3, and
COMLEX-USA Scores* When Considering Which Applicants to Interview
Figure VS-4
N=8
0%
10%
20%
30%
40%
50%
60%
70%
80%
90%
100%
Yes, pass only Yes, target score No
25%
38% 38%
USMLE Step 3N=11 N=8
* Osteopathic applicants only
Percentage of Programs That Use USMLE Step 2 CS and Step 3 Scores
Percentage of Programs That Use COMLEX-USA Level 1 and Level 2-CE Scores
Percentage of Programs That Use COMLEX-USA Level 2-PE and Level 3 Scores
Not reported because
of low response rate
Not reported because
of low response rate
Not reported because
of low response rate
Not reported because
of low response rate
NRMP Program Director Survey Results, 2012 176

0%
10%
20%
30%
40%
50%
60%
70%
80%
90%
100%100%
75%
50%
42%
25%
50%
42%
U.S. Senior U.S. Grad Osteopathic Canadian Fifth Pathway U.S. IMG Non-U.S. IMG
Percentage of Programs that Typically Interview and Rank Each Applicant Groups
Figure VS-5Vascular Surgery
Program's Interview Activities
0%
10%
20%
30%
40%
50%
60%
70%
80%
90%
100%
0% 1-24% 25-49% 50-74% 75-99% 100%
83%
0% 0% 0%
8% 8%
Percentage of Program's Interview Slots Extended Prior to the November 1st MSPE/Dean's Letter Release Date
0
100
200
300
400
500
600
700
800
900
1,000
Number ofapplications
received
Number ofapplicants
interviewed
Number ofapplicants ranked
Number ofpositions in The
Match
7921 18 1
Average Number of Applications Received, ApplicantsInterviewed and Ranked and Positions in The Match
0%
10%
20%
30%
40%
50%
60%
70%
80%
90%
100%
Percentage of applicationsrejected
Percentage of applicantsreceiving an interview
37%
62%
Average Percentage of Applications Rejected andReviewed
N=12
N=12N=12N=13*N=13*N=12N=12
N=12
25% of Vascular Surgery programs consider all applicants
* Data from the NRMP database
NRMP Program Director Survey Results, 2012 177

Transitional Year (N=49)
NRMP Program Director Survey Results, 2012 178

Figure TY-1Transitional Year
Percentage of Programs Citing Each Factor in Selecting Applicants to Interview
0% 10% 20% 30% 40% 50% 60% 70% 80%
USMLE/COMLEX Step 1 score
Letters of recommendation in the specialty
Personal Statement
Grades in required clerkships
USMLE/COMLEX Step 2 score
Grades in clerkship in desired specialty
Graduate of U.S. allopathic medical school
Medical Student Performance Evaluation(MSPE/Dean's Letter)
Class ranking/quartile
Gaps in medical education
Personal prior knowledge of the applicant
Perceived commitment to specialty
Honors in clinical clerkships
Applicant was flagged with Match violation by theNRMP
Volunteer/extracurricular experiences
Other life experience
Honors in clerkship in desired specialty
Consistency of grades
Audition elective/rotation within your department
64%
64%
72%
64%
62%
46%
67%
77%
59%
59%
59%
49%
56%
64%
67%
67%
38%
56%
36%
N=39
NRMP Program Director Survey Results, 2012 179

Figure TY-1Transitional Year
Percentage of Programs Citing Each Factor in Selecting Applicants to Interview
(continued)
0% 20% 40% 60% 80% 100%
Evidence of professionalism and ethics
Interpersonal skills
Perceived interest in program
Graduate of highly regarded U.S. medical school
Leadership qualities
Alpha Omega Alpha (AOA) membership
Demonstrated involvement and interest in research
Feedback from current residents
Visa status*
Honors in basic sciences
Fluency in language spoken by your patient population
Interest in academic career
Away rotation in your specialty at another institution
USMLE/COMLEX Step 3 score*
Other post-interview contact
Gold Society membership
62%
62%
64%
46%
54%
41%
44%
54%
51%
41%
28%
18%
15%
21%
36%
26%
N=39
* International Medical Graduates only
NRMP Program Director Survey Results, 2012 180

Transitional Year
Mean Importance Ratings* of Factors in Ranking Applicants
Figure TY-2
0 1 2 3 4 5
Applicant was flagged with Match violation by theNRMP
Interactions with faculty during interview and visit
Interpersonal skills
Interactions with housestaff during interview andvisit
Feedback from current residents
Evidence of professionalism and ethics
Grades in clerkship in desired specialty
Perceived commitment to specialty
Letters of recommendation in the specialty
Graduate of U.S. allopathic medical school
USMLE/COMLEX Step 1 score
Leadership qualities
Honors in clerkship in desired specialty
Gaps in medical education
Grades in required clerkships
USMLE/COMLEX Step 2 score
Honors in clinical clerkships
Class ranking/quartile
Medical Student Performance Evaluation(MSPE/Dean's Letter)
Personal prior knowledge of the applicant
4.7
4.6
4.5
4.3
4.2
4.4
3.3
3.8
3.6
4.2
3.9
3.9
3.2
4.2
4.1
3.9
3.9
3.9
4.1
3.7
N=39
*Ratings on a scale from 1 (not at all important) to 5 (very important).
NRMP Program Director Survey Results, 2012 181
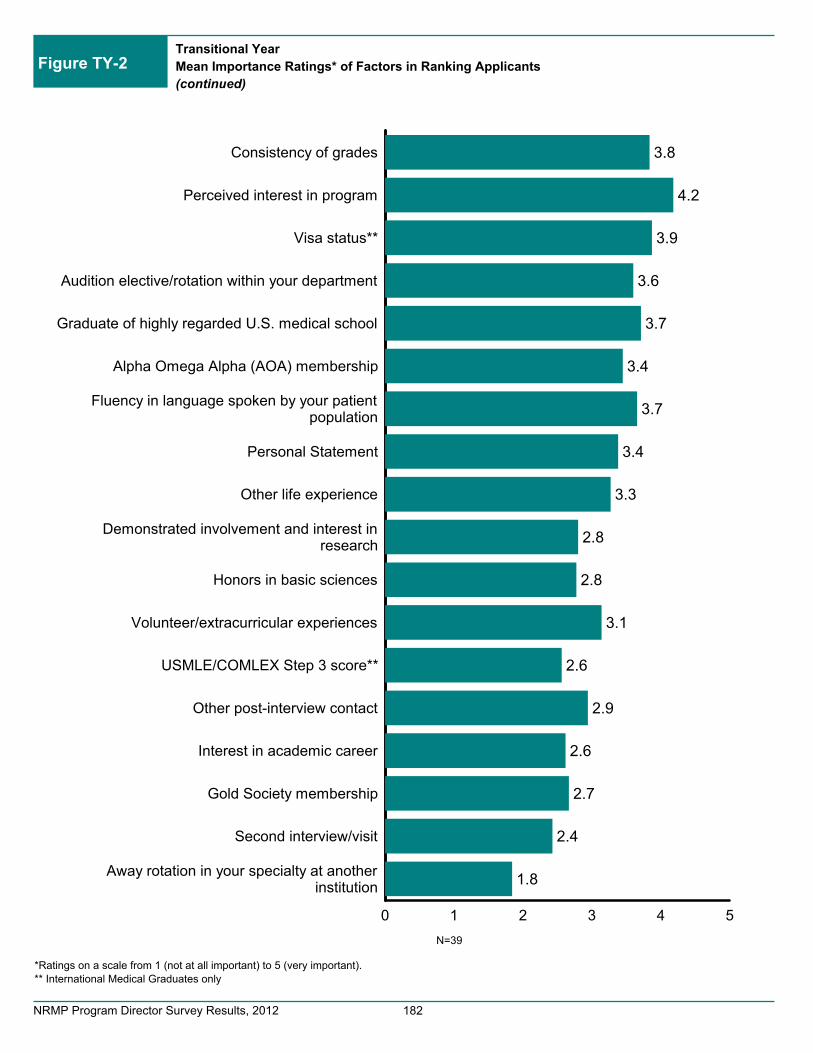
Figure TY-2Transitional Year
Mean Importance Ratings* of Factors in Ranking Applicants
(continued)
0 1 2 3 4 5
Consistency of grades
Perceived interest in program
Visa status**
Audition elective/rotation within your department
Graduate of highly regarded U.S. medical school
Alpha Omega Alpha (AOA) membership
Fluency in language spoken by your patientpopulation
Personal Statement
Other life experience
Demonstrated involvement and interest inresearch
Honors in basic sciences
Volunteer/extracurricular experiences
USMLE/COMLEX Step 3 score**
Other post-interview contact
Interest in academic career
Gold Society membership
Second interview/visit
Away rotation in your specialty at anotherinstitution
3.8
4.2
3.9
3.6
3.7
3.4
3.7
3.4
3.3
2.8
2.8
3.1
2.6
2.9
2.6
2.7
2.4
1.8
N=39
*Ratings on a scale from 1 (not at all important) to 5 (very important).
** International Medical Graduates only
NRMP Program Director Survey Results, 2012 182

100
120
140
160
180
200
220
240
260
280
Transitional Year
Programs That Use USMLE Step 1 and Step 2 Clinical Knowledge (CK) Scores When
Considering Which Applicants to Interview
Figure TY-3
Percentage of Programs That Use USMLE Step 2 (CK) Score
0%
10%
20%
30%
40%
50%
60%
70%
80%
90%
100%
Never Seldom Often
29%
63%
9%
Would your program consider applicants who failtheir exam on the 1st attempt?
0%
10%
20%
30%
40%
50%
60%
70%
80%
90%
100%
Never Seldom often
34%
56%
9%
Would your program consider applicants who failtheir exam on the 1st attempt?
0%
10%
20%
30%
40%
50%
60%
70%
80%
90%
100%
Yes, pass only Yes, target score No
38%
62%
0%
Scores required?
0%
10%
20%
30%
40%
50%
60%
70%
80%
90%
100%
Yes, pass only Yes, target score No
28%
57%
15%
Scores required?
N=47
N=35
N=46 N=32
N=19N=21 N=10 N=9
Average USMLE Step 1 and Step 2 CK Scores Programs
Consider When Granting Interviews
Percentage of Programs That Use USMLE Step 1 Score
100
120
140
160
180
200
220
240
260
280
USMLE Step 2 CKUSMLE Step 1 USMLE Step 1 USMLE Step 2 CK
The boxes in the boxplots above represent the interquartile range (or IQR, which is the range between the 25th and 75th
percentiles) and the line in the box is the median. The x-shaped symbol is the mean.
Scores Above Which Programs
Almost Always Grant Interviews
Scores Below Which Programs
Generally Does Not Grant Interviews
NRMP Program Director Survey Results, 2012 183

0%
10%
20%
30%
40%
50%
60%
70%
80%
90%
100%
Yes, pass only Yes, target score No
40%37%
23%
COMLEX-USA Level 1*
N=46
0%
10%
20%
30%
40%
50%
60%
70%
80%
90%
100%
Yes, pass only No
87%
13%
USMLE Step 2 CS
Transitional Year
Percentage of Programs That Use USMLE Step 2 Clinical Skill (CS), Step 3, and
COMLEX-USA Scores* When Considering Which Applicants to Interview
Figure TY-4
0%
10%
20%
30%
40%
50%
60%
70%
80%
90%
100%
Yes, pass only Yes, target score No
31% 31%38%
COMLEX-USA Level 2-CE*
N=23
0%
10%
20%
30%
40%
50%
60%
70%
80%
90%
100%
Yes, pass only Yes, target score No
22%
13%
65%
USMLE Step 3
0%
10%
20%
30%
40%
50%
60%
70%
80%
90%
100%
Yes, pass only Yes, target score No
26%
11%
63%
COMLEX-USA Level 3*
0%
10%
20%
30%
40%
50%
60%
70%
80%
90%
100%
Yes, pass only Yes, target score No
57%
10%
33%
COMLEX-USA Level 2-PE*
N=46 N=23
N=30 N=29
N=30 N=19
* Osteopathic applicants only
Percentage of Programs That Use USMLE Step 2 CS and Step 3 Scores
Percentage of Programs That Use COMLEX-USA Level 1 and Level 2-CE Scores
Percentage of Programs That Use COMLEX-USA Level 2-PE and Level 3 Scores
NRMP Program Director Survey Results, 2012 184

0%
10%
20%
30%
40%
50%
60%
70%
80%
90%
100%100%
57%
68%
38%
26%
34% 32%
U.S. Senior U.S. Grad Osteopathic Canadian Fifth Pathway U.S. IMG Non-U.S. IMG
Percentage of Programs that Typically Interview and Rank Each Applicant Groups
Figure TY-5Transitional Year
Program's Interview Activities
0%
10%
20%
30%
40%
50%
60%
70%
80%
90%
100%
0% 1-24% 25-49% 50-74% 75-99% 100%
24%
13% 11%15%
28%
9%
Percentage of Program's Interview Slots Extended Prior to the November 1st MSPE/Dean's Letter Release Date
0
100
200
300
400
500
600
700
800
900
1,000
Number ofapplications
received
Number ofapplicants
interviewed
Number ofapplicants ranked
Number ofpositions in The
Match
508
81 76
10
Average Number of Applications Received, ApplicantsInterviewed and Ranked and Positions in The Match
0%
10%
20%
30%
40%
50%
60%
70%
80%
90%
100%
Percentage of applicationsrejected
Percentage of applicantsreceiving an interview
52%
42%
Average Percentage of Applications Rejected andReviewed
N=46
N=46N=45N=49*N=49*N=47N=48
N=47
23% of Transitional Year programs consider all applicants
* Data from the NRMP database
NRMP Program Director Survey Results, 2012 185