results presentation analyst briefing - listed...
TRANSCRIPT


Results Presentation Analyst Briefing
1st Half Year of FY2013
Financial Strength for Business Excellence
Financial Performance : Bumpy ride in 1H 2013
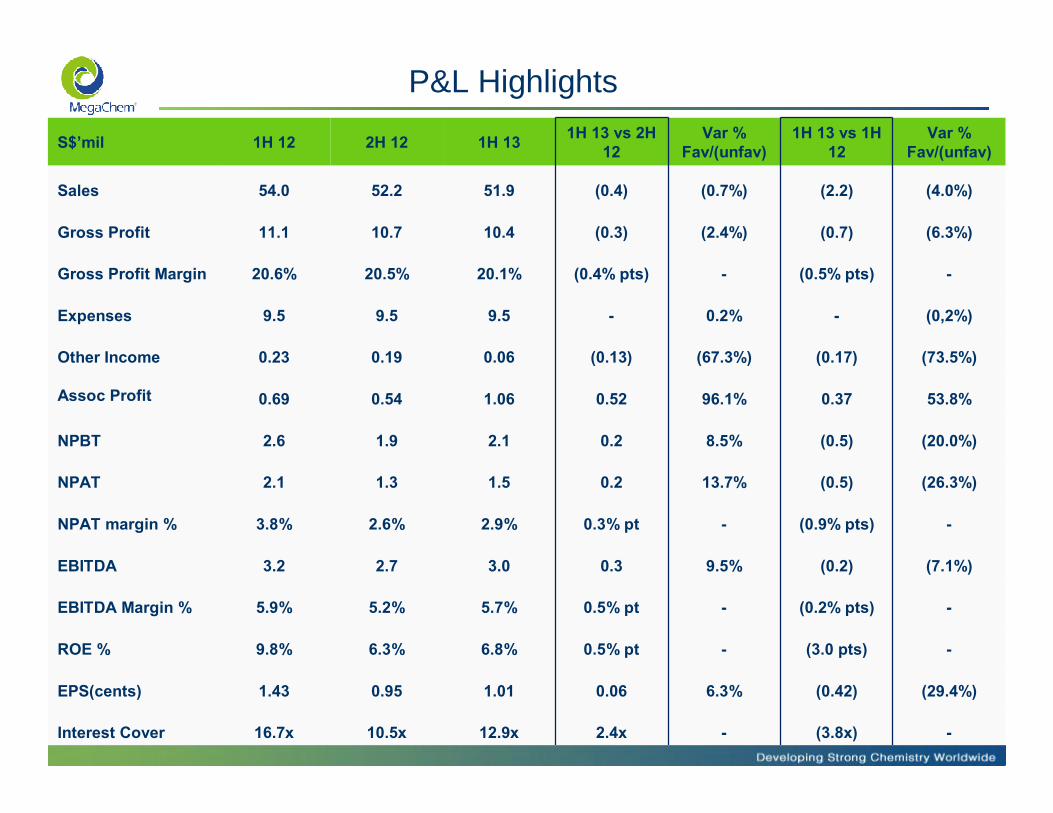
P&L Highlights
S$’mil 1H 12 2H 12 1H 13 1H 13 vs 2H 12
Var % Fav/(unfav)
1H 13 vs 1H 12
Var % Fav/(unfav)
Sales 54.0 52.2 51.9 (0.4) (0.7%) (2.2) (4.0%)
Gross Profit 11.1 10.7 10.4 (0.3) (2.4%) (0.7) (6.3%)
Gross Profit Margin 20.6% 20.5% 20.1% (0.4% pts) - (0.5% pts) -
Expenses 9.5 9.5 9.5 - 0.2% - (0,2%)
Other Income 0.23 0.19 0.06 (0.13) (67.3%) (0.17) (73.5%)
Assoc Profit 0.69 0.54 1.06 0.52 96.1% 0.37 53.8%
NPBT 2.6 1.9 2.1 0.2 8.5% (0.5) (20.0%)
NPAT 2.1 1.3 1.5 0.2 13.7% (0.5) (26.3%)
NPAT margin % 3.8% 2.6% 2.9% 0.3% pt - (0.9% pts) -
EBITDA 3.2 2.7 3.0 0.3 9.5% (0.2) (7.1%)
EBITDA Margin % 5.9% 5.2% 5.7% 0.5% pt - (0.2% pts) -
ROE % 9.8% 6.3% 6.8% 0.5% pt - (3.0 pts) -
EPS(cents) 1.43 0.95 1.01 0.06 6.3% (0.42) (29.4%)
Interest Cover 16.7x 10.5x 12.9x 2.4x - (3.8x) -
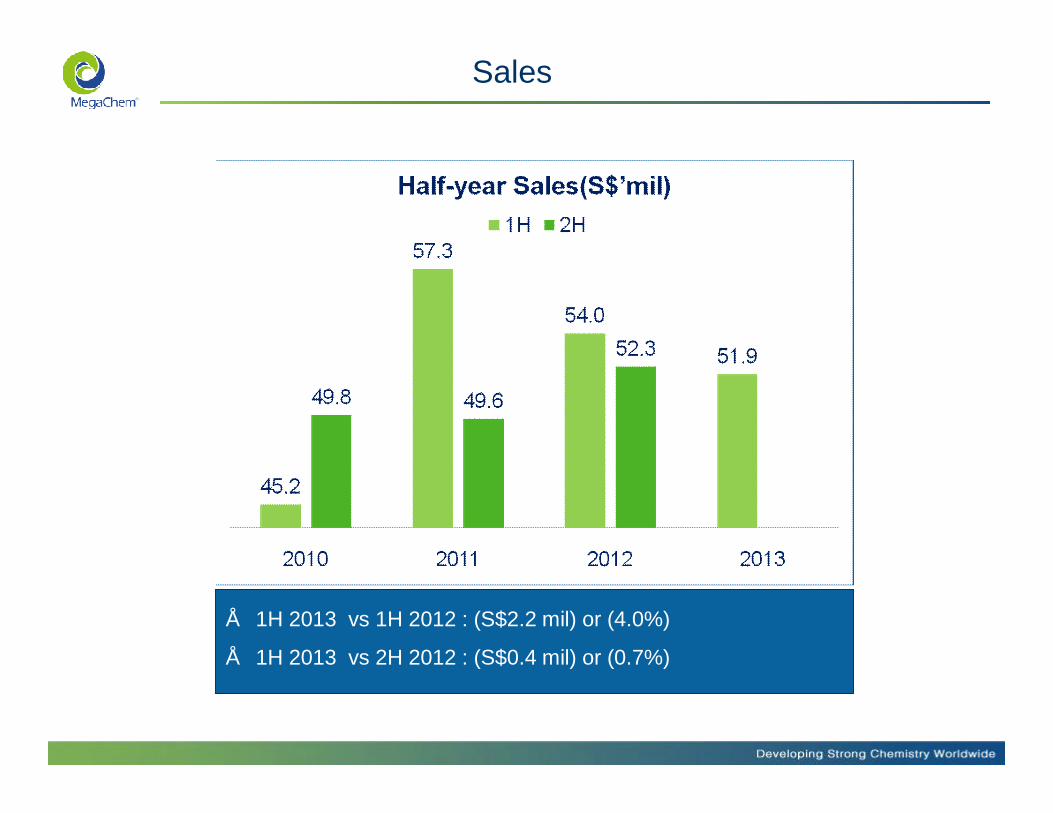
Sales
• 1H 2013 vs 1H 2012 : (S$2.2 mil) or (4.0%)
• 1H 2013 vs 2H 2012 : (S$0.4 mil) or (0.7%)
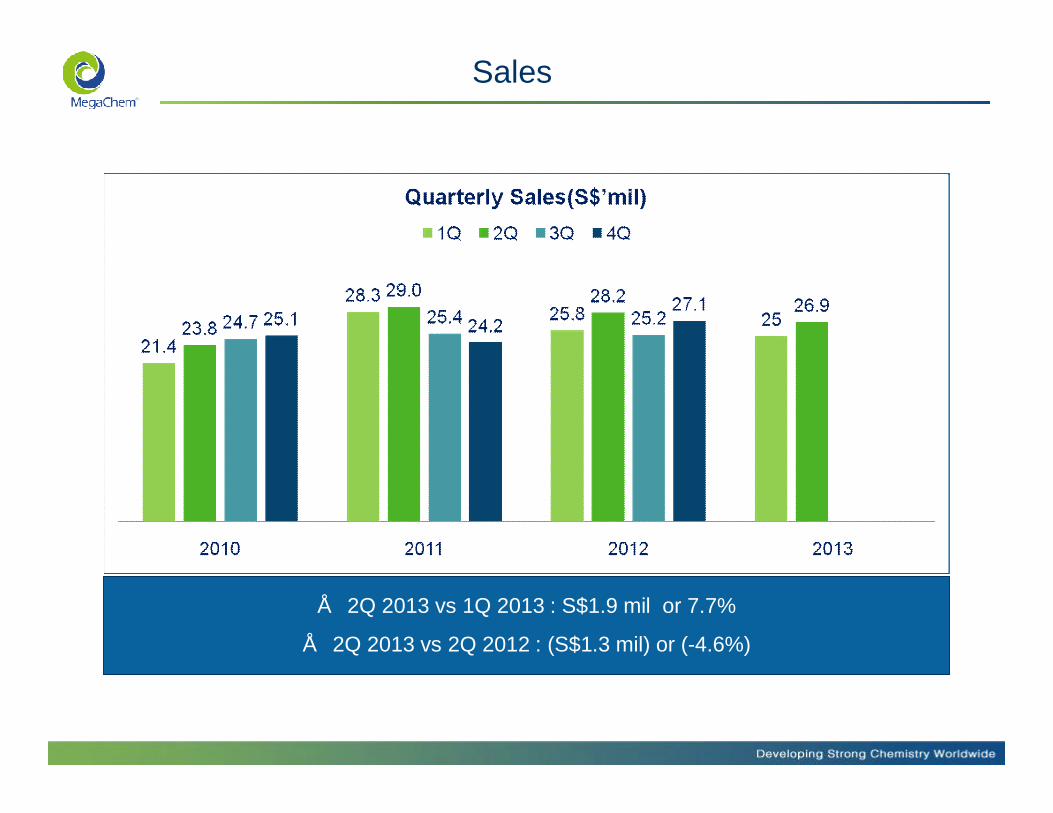
Sales
• 2Q 2013 vs 1Q 2013 : S$1.9 mil or 7.7%
• 2Q 2013 vs 2Q 2012 : (S$1.3 mil) or (-4.6%)
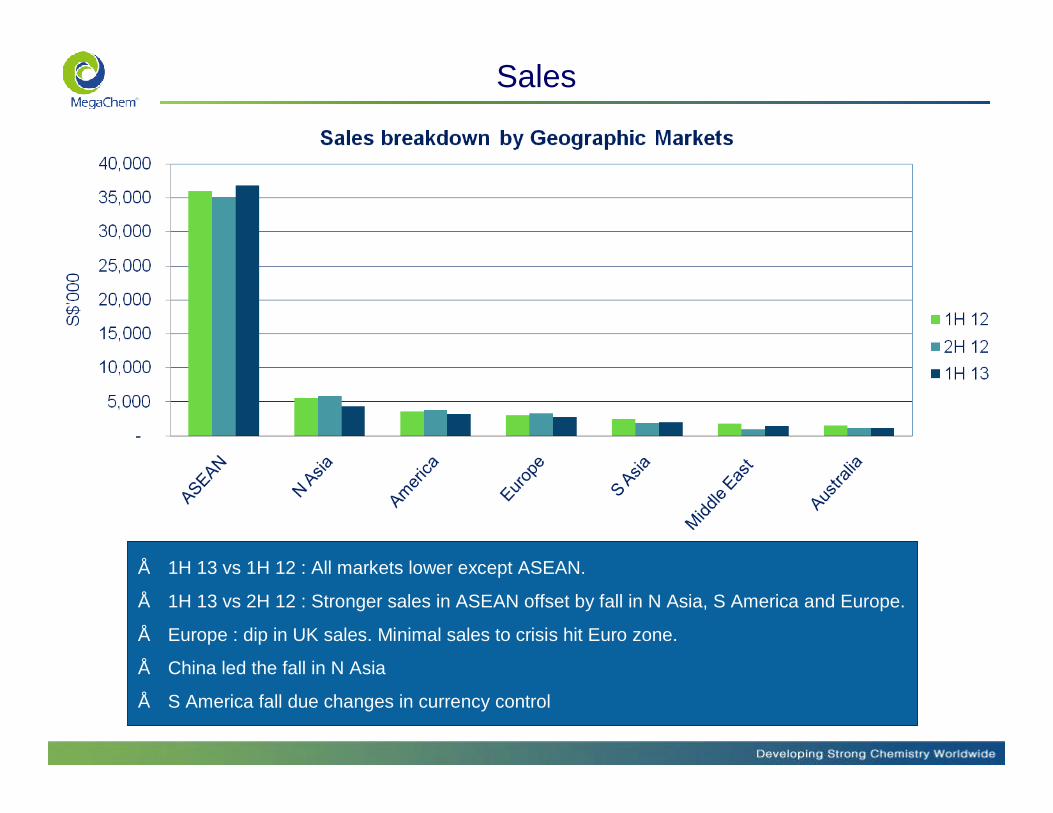
Sales
• 1H 13 vs 1H 12 : All markets lower except ASEAN.
• 1H 13 vs 2H 12 : Stronger sales in ASEAN offset by fall in N Asia, S America and Europe.
• Europe : dip in UK sales. Minimal sales to crisis hit Euro zone.
• China led the fall in N Asia
• S America fall due changes in currency control
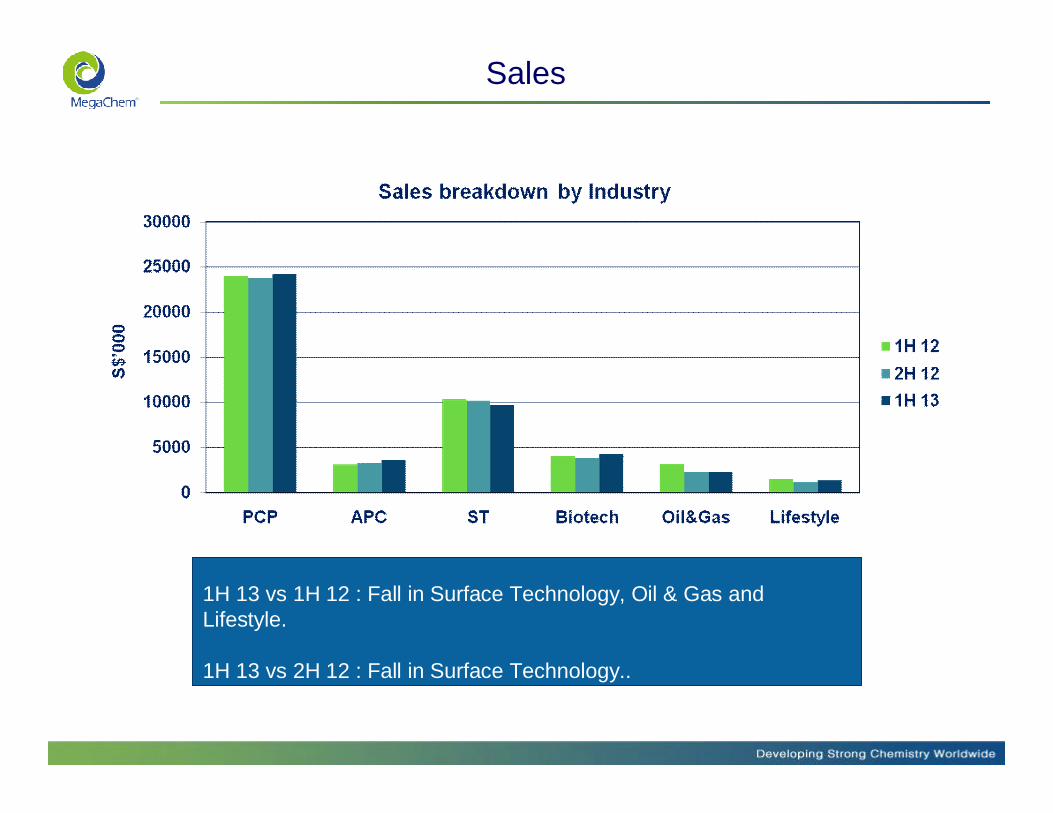
Sales
1H 13 vs 1H 12 : Fall in Surface Technology, Oil & Gas and Lifestyle.
1H 13 vs 2H 12 : Fall in Surface Technology..
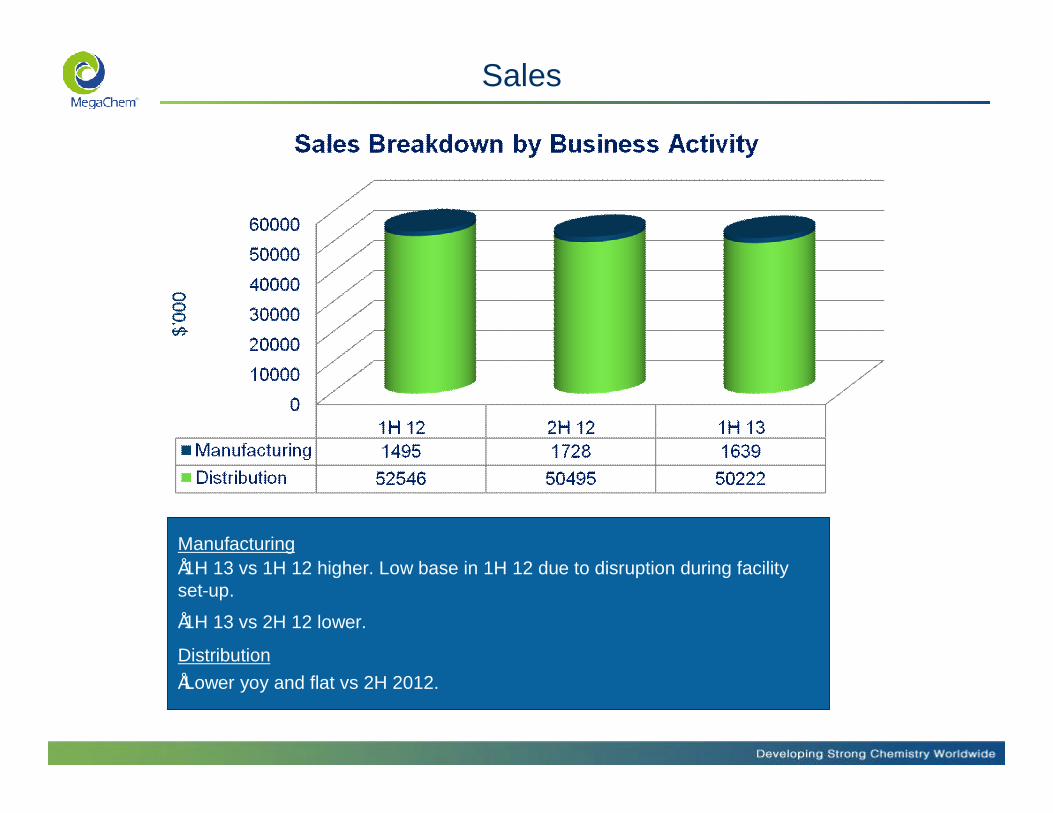
Sales
Manufacturing•1H 13 vs 1H 12 higher. Low base in 1H 12 due to disruption during facility set-up.
•1H 13 vs 2H 12 lower.
Distribution•Lower yoy and flat vs 2H 2012.

Gross Profit
• 1H 13 vs 1H 12 Gross Profit : ($0.7 mil)
• 1H 13 vs 1H 12 GP margin : (0.5% pt) • Drop in GP margin mainly due to depreciation of plant and equipment for the
new facility.

Expenses
S$’000 1H 2012 1H 2013 Var Var %
Staff Cost 5,110 5,418 309 5.7% Salary increment and increase in headcount.
Depreciation 389 459 70 18% New production/office
FX 321 42 (279) (86.9%) Stronger USD. Gain in USD/SGD, USD/GBP. Loss in Rupee/USD.
Professional Fees 333 235 (98) (29.4%) Non-recurring expenses such as tax consultancy, new facility
Impairment of trade receivables 80 79 (1) (1.2%) Only 0.3% of total trade receivables
Rental 883 870 (13) (1.5%)
Finance Cost 164 174 10 5.9% Higher borrowings
• Expenses maintained at about the same level of S$9.5 mil.
• Excluding FX and fair value adjustment, operating expenses increased $292,000 or 3.3%.
• Cost and Productivity Improvement to continue.
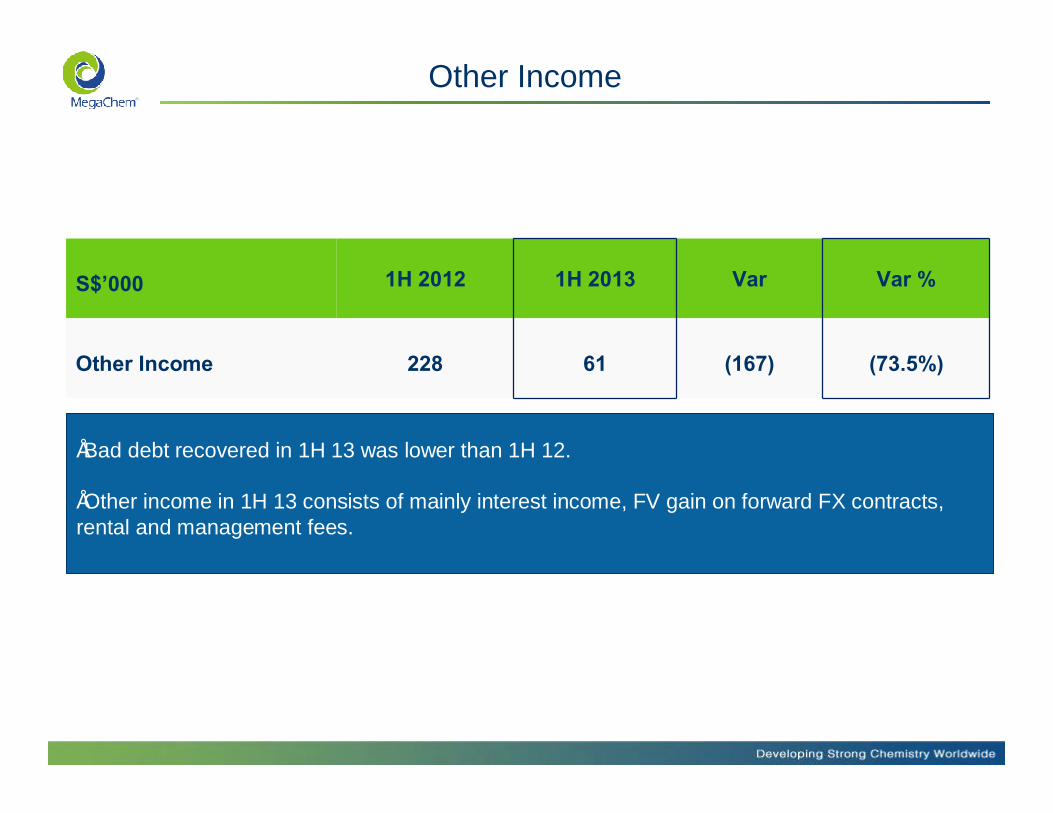
Other Income
S$’000 1H 2012 1H 2013 Var Var %
Other Income 228 61 (167) (73.5%)
•Bad debt recovered in 1H 13 was lower than 1H 12.
•Other income in 1H 13 consists of mainly interest income, FV gain on forward FX contracts, rental and management fees.

Share of Assoc Profit
S$’000 1H 2012 1H 2013 Var Var %
Share of Assoc Profit 692 1,064 372 53.8%
•Strong economic condition in Thailand : increase in investment, manufacturing activities and government infrastructure projects.
•Favourable exchange rates.
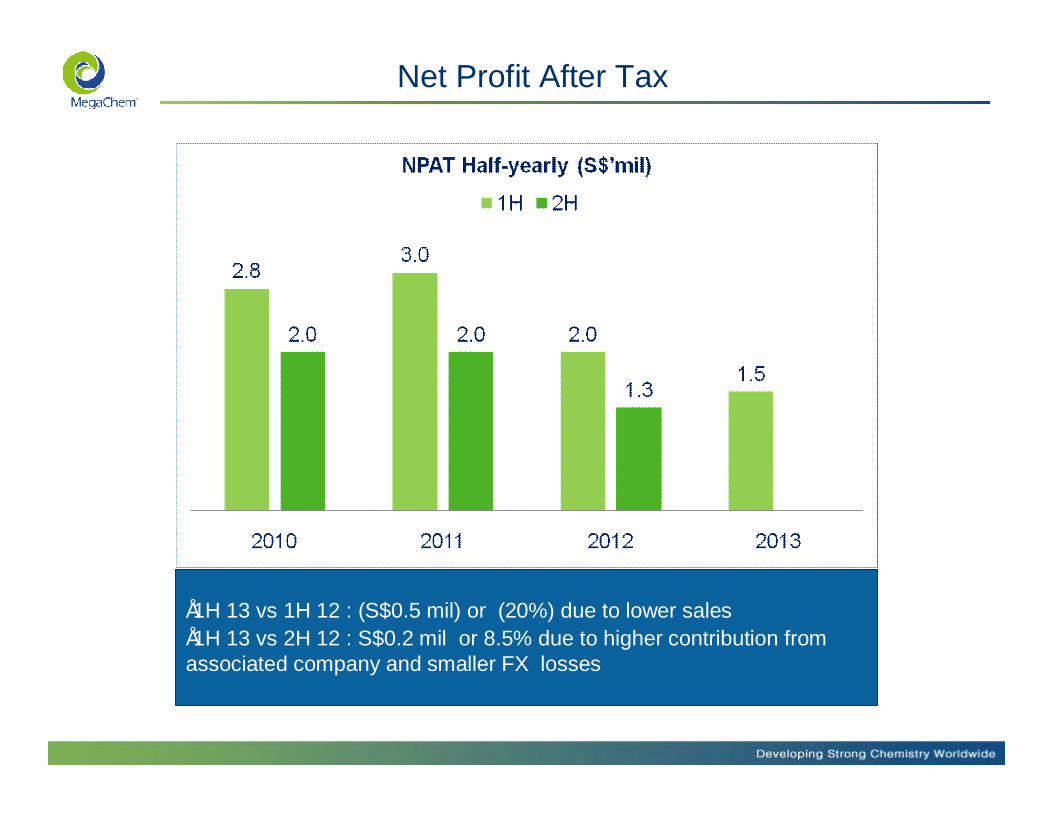
•1H 13 vs 1H 12 : (S$0.5 mil) or (20%) due to lower sales•1H 13 vs 2H 12 : S$0.2 mil or 8.5% due to higher contribution from associated company and smaller FX losses
Net Profit After Tax

•2Q 2013 NPAT adversely affected by FX losses in India.
Net Profit After Tax

NPBT/EBITDA
NPBT declined but stripping off depreciation, EBITDA fell by a smaller %
=> new production facility and office contributed partly to the fall in NPBT.
- 20.0%
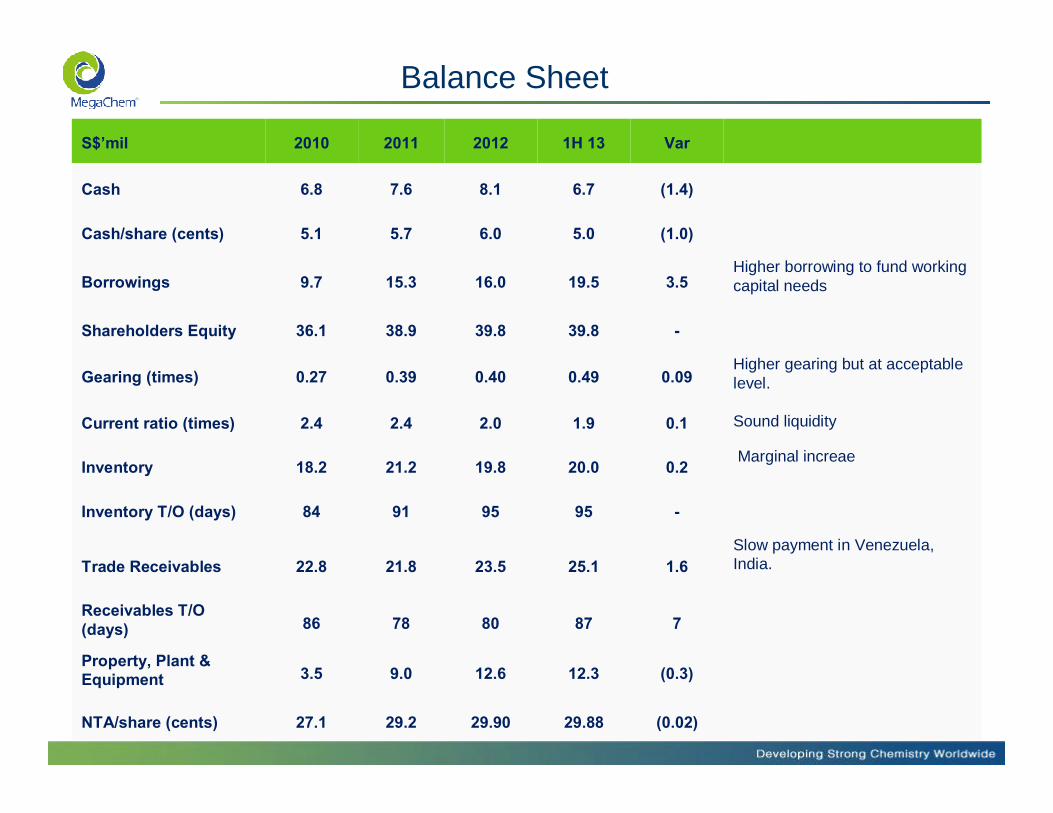
S$’mil 2010 2011 2012 1H 13 Var
Cash 6.8 7.6 8.1 6.7 (1.4)
Cash/share (cents) 5.1 5.7 6.0 5.0 (1.0)
Borrowings 9.7 15.3 16.0 19.5 3.5Higher borrowing to fund working capital needs
Shareholders Equity 36.1 38.9 39.8 39.8 -
Gearing (times) 0.27 0.39 0.40 0.49 0.09Higher gearing but at acceptable level.
Current ratio (times) 2.4 2.4 2.0 1.9 0.1 Sound liquidity
Inventory 18.2 21.2 19.8 20.0 0.2Marginal increae
Inventory T/O (days) 84 91 95 95 -
Trade Receivables 22.8 21.8 23.5 25.1 1.6Slow payment in Venezuela, India.
Receivables T/O (days) 86 78 80 87 7
Property, Plant & Equipment 3.5 9.0 12.6 12.3 (0.3)
NTA/share (cents) 27.1 29.2 29.90 29.88 (0.02)
Balance Sheet
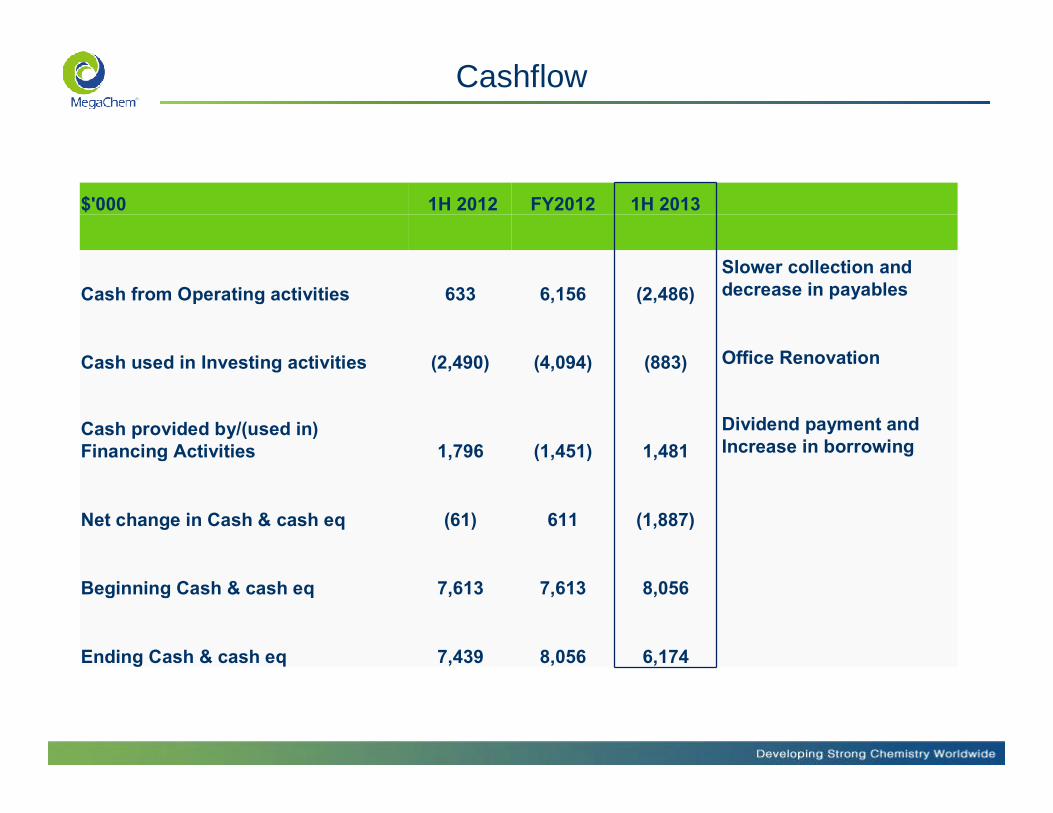
Cashflow
$'000 1H 2012 FY2012 1H 2013
Cash from Operating activities 633 6,156 (2,486)Slower collection and decrease in payables
Cash used in Investing activities (2,490) (4,094) (883) Office Renovation
Cash provided by/(used in) Financing Activities 1,796 (1,451) 1,481
Dividend payment and Increase in borrowing
Net change in Cash & cash eq (61) 611 (1,887)
Beginning Cash & cash eq 7,613 7,613 8,056
Ending Cash & cash eq 7,439 8,056 6,174
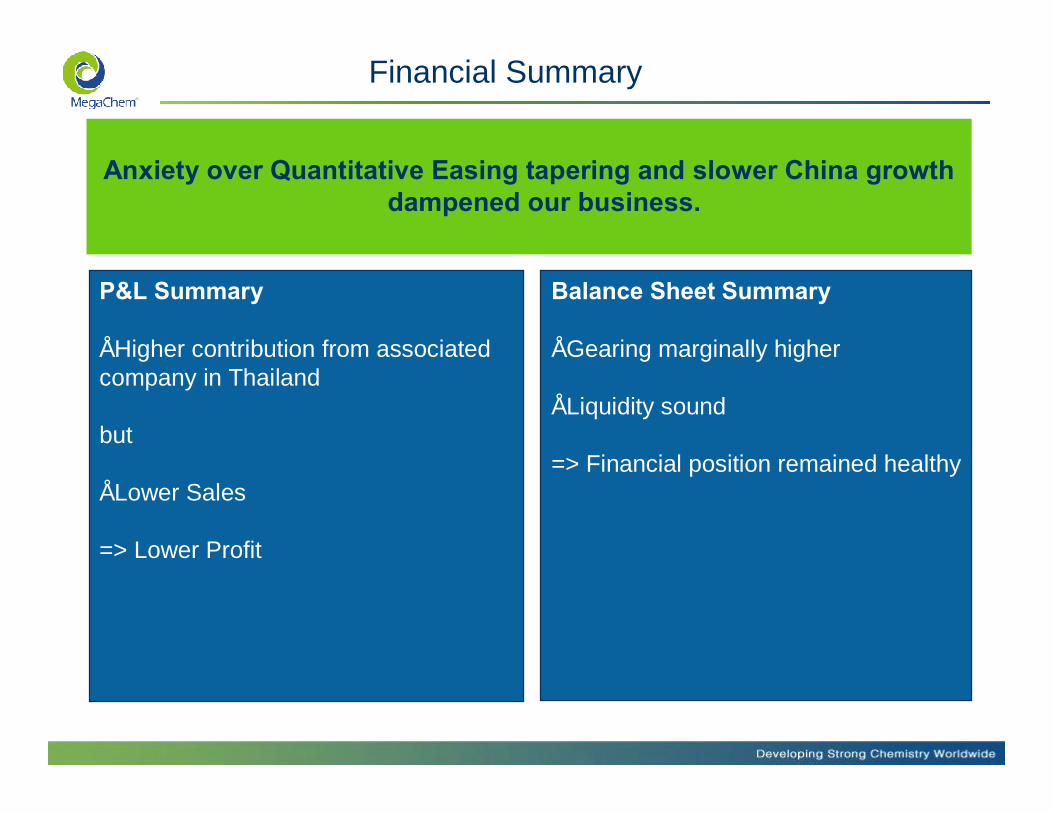
Financial Summary
P&L Summary
• Higher contribution from associated company in Thailand
but
• Lower Sales
=> Lower Profit
Balance Sheet Summary
• Gearing marginally higher
• Liquidity sound
=> Financial position remained healthy
Anxiety over Quantitative Easing tapering and slower China growth dampened our business.

Outlook 2H 2013 : Uncertainty persists
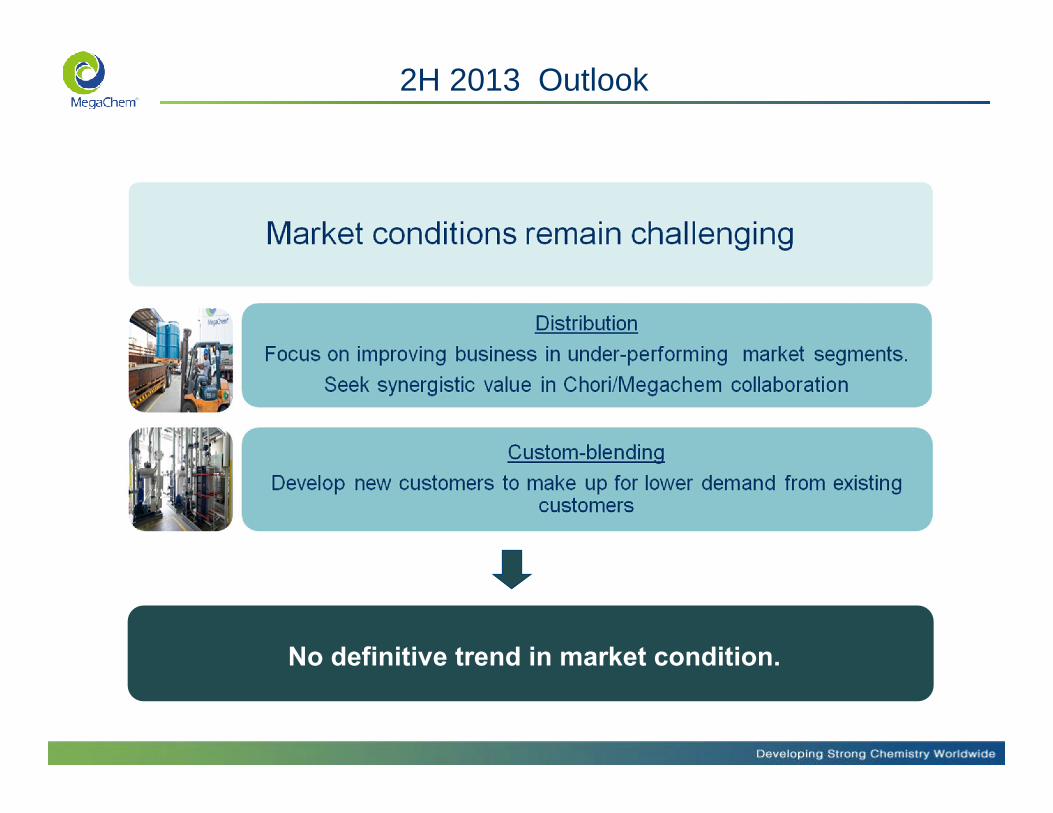
No definitive trend in market condition.
2H 2013 Outlook

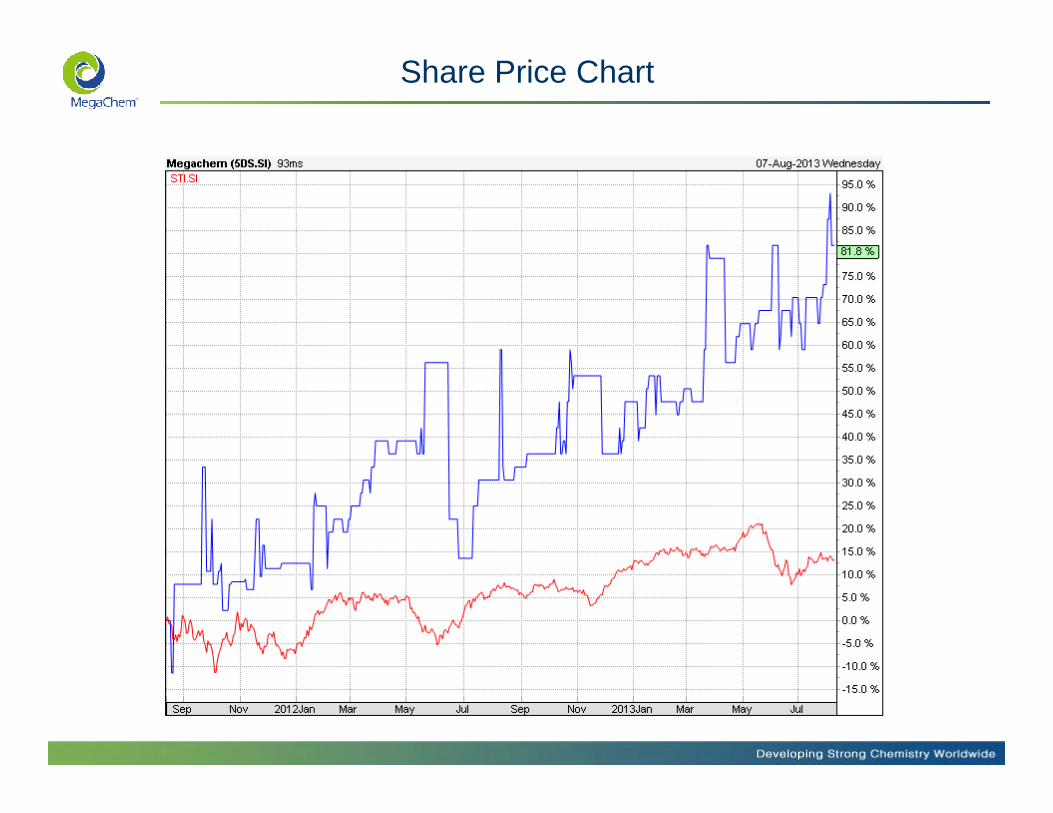
Share Performance : Enhancing Shareholders Long Term Value
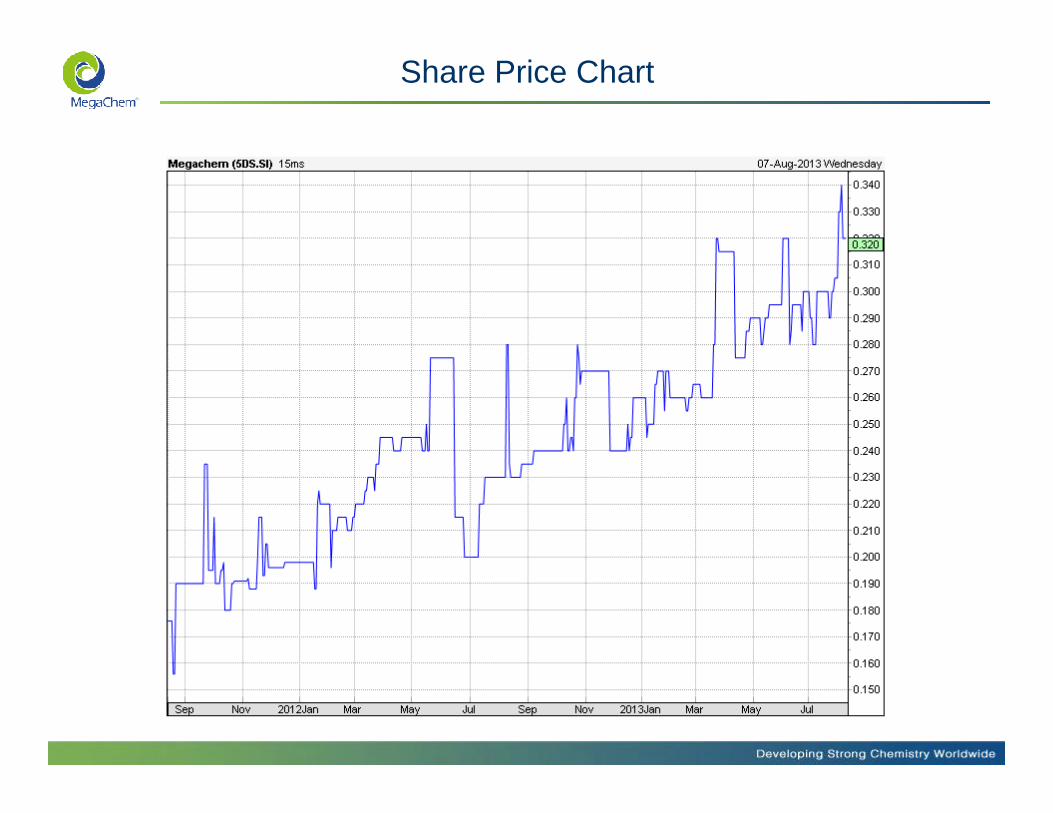
Share Price Chart

Share Price Chart
Share Price Chart
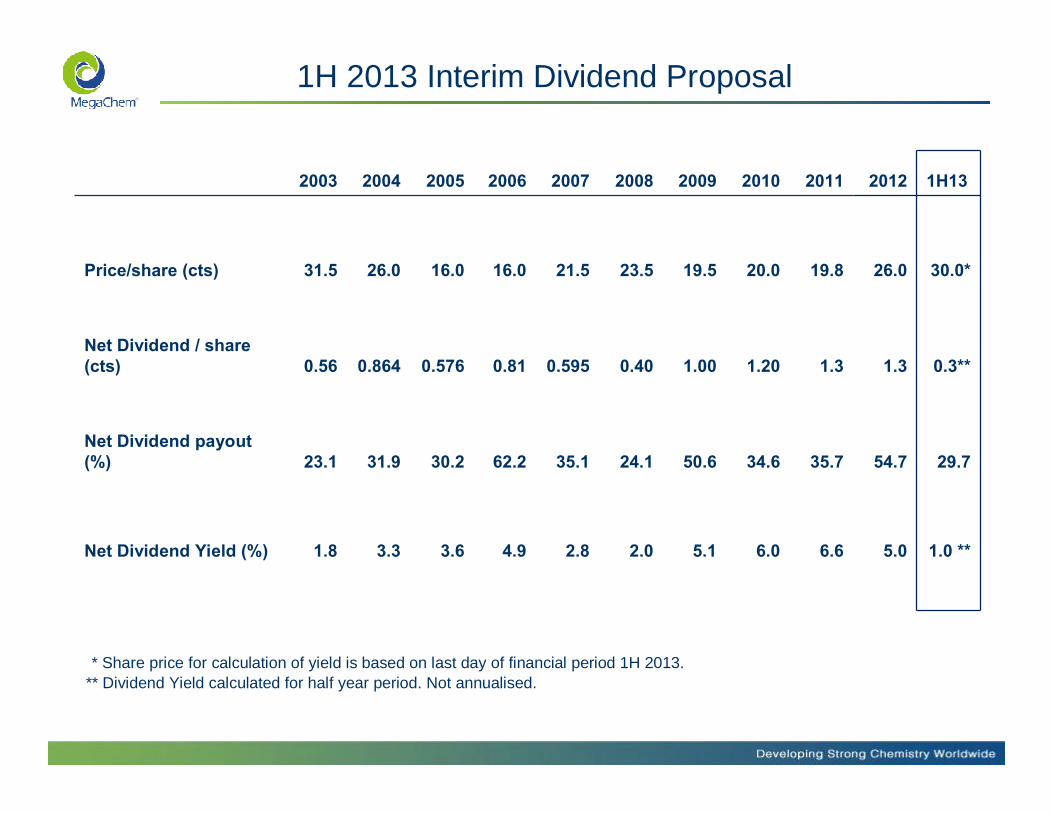
2003 2004 2005 2006 2007 2008 2009 2010 2011 2012 1H13
Price/share (cts) 31.5 26.0 16.0 16.0 21.5 23.5 19.5 20.0 19.8 26.0 30.0*
Net Dividend / share (cts) 0.56 0.864 0.576 0.81 0.595 0.40 1.00 1.20 1.3 1.3 0.3**
Net Dividend payout (%) 23.1 31.9 30.2 62.2 35.1 24.1 50.6 34.6 35.7 54.7 29.7
Net Dividend Yield (%) 1.8 3.3 3.6 4.9 2.8 2.0 5.1 6.0 6.6 5.0 1.0 **
* Share price for calculation of yield is based on last day of financial period 1H 2013.** Dividend Yield calculated for half year period. Not annualised.
1H 2013 Interim Dividend Proposal

Total Shareholder’s Return
%
Dividend Yield 1.0%
Capital Gain * 15.4%
Total Shareholders Return 16.4%
• Capital gain is calculated using ending(ie 30 cents/share) and beginning price(26 cents/share) of 1H 2013.
• Interim Dividend yield calculation is not annualised.
This document has been prepared by the Company and the contents have been reviewed by the Company’s Sponsor, SAC Capital Private Limited, for compliance with the relevant rules of theSingapore Exchange Securities Trading Limited (“Exchange"). The Company’s Sponsor has not independently verified the contents of this document.
This document has not been examined or approved by the Exchange and the Exchange assumes noresponsibility for the contents of this document, including the correctness of any of the statements oropinions made or reports contained in this document.
The contact person for the Sponsor is Ms Alicia Kwan (Tel : 65 6221 5590) at 1 Robinson Road #21-02 AIA Tower Singapore 048542.
Thank You
The presentation is provided without any guarantees or representations of any kind (express or implied) or any liability. Megachem shall not be liable for any damages that have been caused by or in connection with the use of information in this presentation and shall not be responsible for and disclaims any liability for any indirect, incidental, consequential and special damages, that have been caused by or in connection with the use of information in this presentation.
Copying or reproduction of information, in parts or in full, in this presentation is strictly prohibited.