results presentation - frasers logistics trust ...a$’000) 1qfy18 1qfy17(1) change (%) contributing...
TRANSCRIPT

For the Quarter ended 31 December 2017 (1QFY18)
Frasers Logistics & Industrial TrustRESULTS PRESENTATION

This presentation is for information purposes only and does not constitute or form part of an offer, solicitation, recommendation or invitation for the sale or purchase or
subscription of securities, including units in Frasers Logistics & Industrial Trust (“FLT”, and the units in FLT, the “Units”) or any other securities of FLT. No part of it nor
the fact of its presentation shall form the basis of or be relied upon in connection with any investment decision, contract or commitment whatsoever. The past
performance of FLT and Frasers Logistics & Industrial Asset Management Pte. Ltd., as the manager of FLT (the “Manager”), is not necessarily indicative of the future
performance of FLT and the Manager.
This presentation contains “forward-looking statements”, including forward–looking financial information, that involve assumptions, known and unknown risks,
uncertainties and other factors which may cause the actual results, performance, outcomes or achievements of FLT or the Manager, or industry results, to be materially
different from those expressed in such forward-looking statements and financial information. Such forward-looking statements and financial information are based on
certain assumptions and expectations of future events regarding FLT's present and future business strategies and the environment in which FLT will operate. The
Manager does not guarantee that these assumptions and expectations are accurate or will be realised. You are cautioned not to place undue reliance on these forward-
looking statements, which are based on the Manager’s current view of future events. The Manager does not assume any responsibility to amend, modify or revise any
forward-looking statements, on the basis of any subsequent developments, information or events, or otherwise, subject to compliance with all applicable laws and
regulations and/or the rules of the Singapore Exchange Securities Trading Limited (“SGX-ST”) and/or any other regulatory or supervisory body or agency.
The information and opinions in this presentation are subject to change without notice, its accuracy is not guaranteed and it may not contain all material information
concerning FLT. None of Frasers Centrepoint Limited, FLT, the Manager, Perpetual (Asia) Limited, in its capacity as trustee of FLT, or any of their respective holding
companies, subsidiaries, affiliates, associated undertakings or controlling persons, or any of their respective directors, officers, partners, employees, agents,
representatives, advisers or legal advisers makes any representation or warranty, express or implied, as to the accuracy, completeness or correctness of the information
contained in this presentation or otherwise made available or as to the reasonableness of any assumption contained herein or therein, and any liability whatsoever (in
negligence or otherwise) for any loss howsoever arising, whether directly or indirectly, from any use, reliance or distribution of this presentation or its contents or
otherwise arising in connection with this presentation is expressly disclaimed. Further, nothing in this presentation should be construed as constituting legal, business,
tax or financial advice.
The value of Units and the income derived from them, if any, may fall or rise. Units are not obligations of, deposits in, or guaranteed by, the Manager or any of its
affiliates. An investment in the Units is subject to investment risks, including the possible loss of the principal amount invested. Investors should note that they have no
right to request the Manager to redeem their Units while the Units are listed. It is intended that holders of Units may only deal in their Units through trading on the SGX-
ST. Listing of the Units on the SGX-ST does not guarantee a liquid market for the Units.
Nothing in this presentation constitutes or forms a part of any offer to sell or solicitation of any offer to purchase or subscribe for securities for sale in Singapore, the
United States or any other jurisdiction in which such offer, solicitation or sale would be unlawful prior to registration or qualification under the securities laws of any such
jurisdiction.
Important Notice
1

Contents
─ Overview
─ Financial Review
─ Portfolio Review
─ Strategy and Outlook
2

OVERVIEW
20 – 22 Butler Boulevard, Adelaide Airport

1QFY18 Performance Snapshot
(1) Distributions will be made on a semi-annual basis for the six-month periods ending 31 March and 30 September
(2) 1QFY18 DPU is calculated based on 78.1%% (1QFY17: 100%) of management fees to be taken in the form of units and after taking into consideration the forward foreign
currency exchange contracts entered to hedge the currency risk for distribution to Unitholders at A$1.00:S$1.0583 (1QFY17 A$1.00:S$1.00)
(3) As at 30 September 2017
(4) Asset Enhancement Initiative
DPU(1)(2)
1.80Singapore cents
3.4% increase from 1.74 Singapore cents in 1QFY17
Completed
TWODevelopment
Properties
+45,072 sq m to Portfolio GLA
Completed
FIRST AEI(4)
Ahead of schedulein December 2017
Lease renewals
66,737 sq m
WALE extended to 6.79 years from
6.75 years(3)
4

Portfolio Metrics
61
Properties In Australia
1,332,957sq m
Portfolio GLA
95.7%
Tenant Retention Rate(1)
A$1.93 billion
Portfolio Value
As at 31 December 2017
3.1%per annum
Average Fixed Rent Increases(1)
7.1years
Average Portfolio Age
99.4%
Portfolio Occupancy
6.79 years
WALE(2)
(1) For all leasing transactions since FLT’s listing
(2) Weighted Average Lease Expiry
5

1QFY18 Portfolio Update
(1) For all leasing transactions since FLT’s listing
Leasing Activities
Three lease renewals with a total GLA of 66,737 sq m
Representing approximately 5.0% of portfolio GLA
Tenant retention rate: 95.7%(1)
Development Properties
Practical completion for the Beaulieu facility (166 Pearson Road, Yatala, Queensland) on 13 October
2017
Practical completion for the Stanley Black & Decker facility (29 Indian Drive, Keysborough, Victoria) on 17
November 2017
Remaining development property, the Clifford Hallam facility (17 Hudson Court, Keysborough, Victoria),
targeted for completion by May 2018
Asset Enhancement
1,219 sq m expansion works at the Stramit facility (57-71 Platinum Street, Crestmead, Queensland)
completed on 19 December 2017
Upgrade works included the installation of a 773 sq m awning, building upgrades and sustainability
initiatives including a 125kW solar PV system
6

FINANCIAL REVIEW
43 Efficient Drive, Truganina, Victoria

(A$’000) 1QFY18 1QFY17(1) Change (%)
Contributing factors
Gross revenue 42,430 39,678 6.9 The four completed properties of the Acquisition
Transaction(3) and the Beaulieu and Stanley Black & Decker
facilities which achieved practical completion on 13 October
2017 and 17 November 2017 respectively contributed
Adjusted NPI of A$1.9 million.
Full quarter’s contribution from the Martin Brower call option
property which was acquired on 30 November 2016.
Adjusted net
property income(2) 33,391 30,666 8.9
Finance costs (4,770) (4,098) (16.4)
Due to higher borrowings of A$75 million drawn to finance
the Acquisition transaction. Weighted average cost of
borrowings for 1QFY18 and 1QFY17 was unchanged at 2.8%
excluding upfront debt related expenses.
Distributable
income to
Unitholders
25,854 24,877 3.9
Higher Adjusted Net Property Income;
Coupon interest income from the three development
properties of the Acquisition Transaction;
which were partially offset by:
Higher finance costs; and
Higher withholding tax paid on interest income and higher
distributable income
DPU
(Australian cents)1.70 1.74 (2.3)
Higher distributable income;
Higher hedged exchange rate of A$1.00:S$1.0583 (1QFY17:
A$1.00:S$1.00);
which were partially offset by:
Higher number of units in issue compared to 1QFY17(4); and
The Manager electing to receive 78.1% (1QFY17: 100%) of
management fees in the form of units (For illustration and
comparison purposes only, assuming 100% of management
fees had been taken in the form of units, 1QFY18 DPU would
have been 1.75 Australian cents (1QFY17: 1.74 Australian
cents)).
DPU
(Singapore cents)1.80 1.74 3.4
(1) The comparative figures are for the quarter from 1 October 2016 to 31 December 2016. These figures are extracted from Paragraph 1 of FLT's Financial Statements
Announcement dated 3 February 2017
(2) Net property income excluding straight lining adjustments for rental income and after adding back straight lining adjustments for ground leases
(3) On 6 June 2017, FLT announced its first portfolio acquisition of seven industrial properties located in Australia comprising four completed properties and three development
properties for an aggregate consideration of approximately A$169.3 million (the “Acquisition Transaction”)
(4) Due to the issuance of management fee units and the placement units for the Acquisition Transaction
Financial Performance (Quarter ended 31 December 2017)
8

(1) Based on FLT’s closing unit price of S$1.160 as at 31 December 2017.
Distribution
For 1QFY18
DPU of 1.80 Singapore cents translates into an annualised yield of approximately 6.2%(1)
9
1.74 1.74 1.75 1.75 1.77 1.80
0.10
20 Jun - 30 Sep 2016 1QFY17 2QFY17 3QFY17 4QFY17 1QFY18
DPU History
(Singapore cents)
Distribution Policy
FLT’s distribution policy was to distribute 100% of FLT’s Distributable Income for the period from 20 June 2016 (the
“Listing Date”) to 30 September 2017. From FY2018, FLT will distribute at least 90.0% of its Distributable Income
Distributions will be made on a semi-annual basis for the six-month periods ending 31 March and 30 September. The
actual level of distribution above 90% is to be determined at the REIT Manager’s discretion
1.84For the period
from 20 Jun to
30 Jun 16

(A$’000) As at 31 Dec 2017 As at 30 Sep 2017
Investment properties 1,927,405 1,910,975
Other non-current assets 2,346 3,077
Current assets 57,330 62,272
Total assets 1,987,081 1,976,324
Non-current liabilities 628,903 592,797
Current liabilities 18,442 46,011
Total liabilities 647,345 638,808
Net asset value per Unit (A$) 0.88 0.88
Net asset value per Unit (S$) 0.91 0.94
Value of investment properties increased 0.9% from A$1.91 billion as at 30 September 2017 to
A$1.93 billion as at 31 December 2017, due mainly to:
Completion of the Beaulieu facility on 13 October 2017 and Stanley Black & Decker facility on 17
November 2017; and
Completion of enhancement works to the Stramit facility on 19 December 2017
Balance Sheet
10(1) Based on exchange rate of A$1.00:S$1.0364
(2) Based on exchange rate of A$1.00:S$1.0636
(1) (2)

$170 $160
$285
FY2018 FY2019 FY2020 FY2021
No debt
expiry in
FY2018
68% of borrowings are at fixed interest rates, which mitigates volatility from potential fluctuations in
borrowing costs
Available debt headroom of A$508 million to reach 45.0% aggregate regulatory leverage limit
Debt Maturity Profile
(A$’m)
(1) Excluding upfront debt related expenses
Capital Management
As at 31 December 2017
Aggregate LeverageTotal Gross Borrowings
30.9% A$615 million
Weighted Average Cost of Borrowings(1)
Interest Coverage Ratio
2.8% 7.8 times
Average Weighted Debt Maturity: 2.7 years
11

PORTFOLIO REVIEW
51 Stradbroke Street, Heathwood, Queensland

Consumer sector tenants Logistics sector tenants
Well-diversified Tenant Base
Consumer 42.6%
Logistics 33.3%
Manufacturing 17.3%
Others 6.8%
Breakdown of Tenants By TradeTop 10 Tenants(% of Gross Rental Income (“GRI”) contribution(1)) (by GRI(1))
% of GRI
WALE
(Years)
Coles 13.4 10.8
CEVA Logistics 4.9 7.4
Schenker 4.3 6.9
Toll Holdings 3.1 1.9
TTI 3.1 4.6
Martin Brower 2.9 18.7
Mazda 2.8 6.2
H.J. Heinz 2.6 9.0
Unilever 2.3 5.4
Inchcape 2.1 3.2
(1) For the month of December 2017. Excludes the development property at 17 Hudson Court, Keysborough, Victoria and straight lining rental adjustment 13

FLT Portfolio Metrics
(1) Valuation as at 30 September 2017
NSW, 30.0%
QLD, 28.2%
VIC, 39.2%
SA, 1.8%
WA, 0.9%
Value
Geographical Breakdown by GLA and Value
90.7% of FLT’s portfolio (by
value) comprised freehold
and long leasehold land
tenure assets
74.0% of FLT’s portfolio (by
GLA) is less than 10 years
old with lower capital
expenditure requirements
Freehold59.8%
> 80 Year Leasehold
30.9%
Other Leasehold
9.3%
Land Tenure by Value(1) Portfolio Age by GLA
<2 Yrs17.7%
2-5 Yrs19.9%
5-10 Yrs36.5%
> 10 Yrs26.0%
NSW, 30.4%
QLD, 18.7%VIC,
46.9%
SA, 2.5%
WA, 1.5%
GLA
Diversified portfolio across
five states in Australia
Focus on Australia’s three
largest capital cities of
Sydney, Melbourne and
Brisbane
14

(1) As at 31 December 2017. Excludes the development property at 17 Hudson Court, Keysborough, Victoria and straight lining rental adjustments
Portfolio Lease Expiry Profile
Only 2.4% lease expiries to end FY2018
No concentration risk of lease expiry (no single financial year has more than 16% lease expiries up to 30
September 2026)
Provides stability of cash flows
2.4%
10.3%
4.7%
11.7%
16.0%
6.3%
8.7%
4.8%
9.7%
25.3%
3.9%
14.9%
10.7% 10.5%
14.8%
3.9%
8.6%
5.2%
8.5%
18.7%
Sep 2018 Sep 2019 Sep 2020 Sep 2021 Sep 2022 Sep 2023 Sep 2024 Sep 2025 Sep 2026 Sep 2027and beyond
Lease Expiry by Gross Rental Income(1)
Dec-17 Dec-16
15

Leasing Updates
Three forward lease extensions further extending FLT’s lease expiry profile
Average reversion of -5.1% for 1QFY18
20-22 Butler Boulevard, Burbridge
Business Park, South Australia
5,590 sq m, 5-year lease extension
with Agility Logistics from August
2019
• New Expiry Date: August 2024
• Annual Rent Increment: 3.00%
38-52 Sky Road East, Melbourne
Airport, Victoria
46,231 sq m, 3-year lease extension
signed with Unilever from 1 June
2020
• New Expiry Date: May 2023
• Annual Rent Increment: 3.25%
51 Stradbroke Street, Heathwood,
Queensland
14,916 sq m, 10-year lease signed
with B&R Enclosures from 15 August
2020
• New Expiry Date: August 2030
• Annual Rent Increment: 3.00%
• Includes the installation of new
LED lighting and a 200kW solar
PV system
16
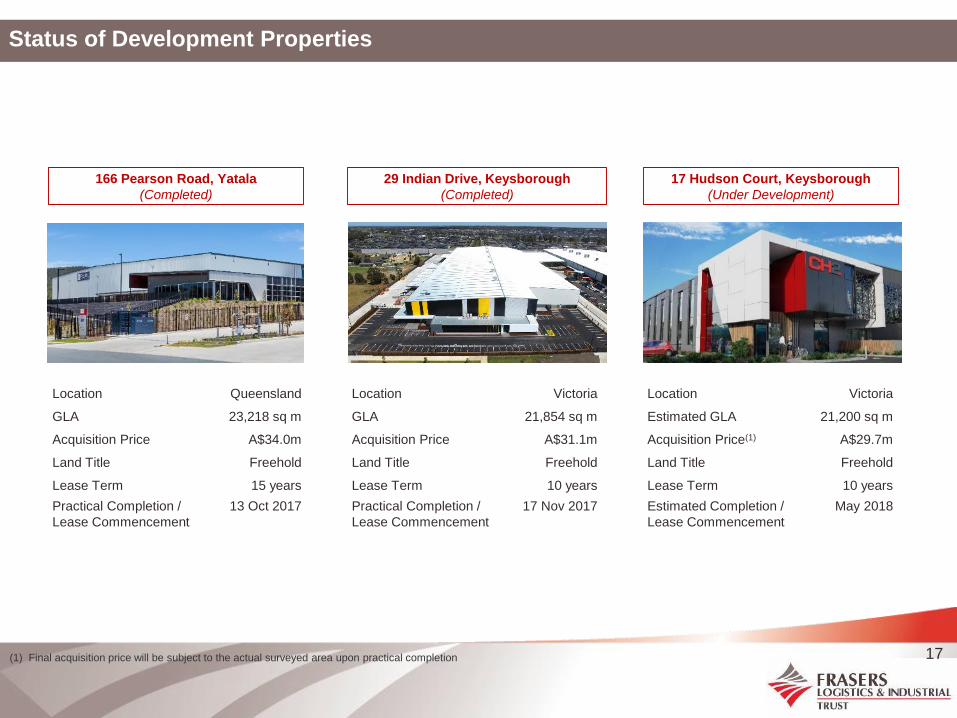
Status of Development Properties
166 Pearson Road, Yatala
(Completed)
Location Queensland
GLA 23,218 sq m
Acquisition Price A$34.0m
Land Title Freehold
Lease Term 15 years
Practical Completion /
Lease Commencement
13 Oct 2017
29 Indian Drive, Keysborough
(Completed)
Location Victoria
GLA 21,854 sq m
Acquisition Price A$31.1m
Land Title Freehold
Lease Term 10 years
Practical Completion /
Lease Commencement
17 Nov 2017
17 Hudson Court, Keysborough
(Under Development)
Location Victoria
Estimated GLA 21,200 sq m
Acquisition Price(1) A$29.7m
Land Title Freehold
Lease Term 10 years
Estimated Completion /
Lease Commencement
May 2018
(1) Final acquisition price will be subject to the actual surveyed area upon practical completion 17

Update on Asset Enhancement Works
Expansion works to the property at 57-71 Platinum Street, Crestmead, Queensland
Completed on 19 December 2017, ahead of schedule
1,219 sq m expansion to the warehouse, installation of a 773 sq m awning, building upgrades and
sustainability initiatives including a 125kW solar PV system
Return on cost of approximately 10%
18

STRATEGY AND OUTLOOK
Lot 1, 2 Burilda Close, Wetherill Park, New South Wales

Investment Strategy and Objectives
(1) Asset Enhancement Initiative
(2) Only completed income-producing real estate assets which are used for logistics or industrial purposes are included in the ROFR
(3) Includes the United Kingdom
To invest globally in a diversified portfolio of logistics and industrial assets
Deliver stable and regular distributions to unitholders
Achieve long term growth in DPU
Active Asset Management Selective Development Acquisition GrowthCapital & Risk
Management
• Proactive leasing:
Maintain high
occupancy rate, long
WALE and well-
diversified tenant base
• Asset Enhancement:
Assess and undertake
AEIs(1) on the FLT
portfolio to unlock
further value
• Selectively undertake
development activities
of properties
complementary to the
FLT portfolio
• Re-development of
existing assets
• Sponsor’s development
pipeline(2)
• Pursue strategic
acquisition opportunities
of quality industrial
properties
- Sponsor’s ROFR:
16 assets in Australia
(~ 407,000 sq m)
25 assets in Europe(3)
(~ 970,000 sq m)
- Third-party acquisitions
• Optimise capital mix and
prudent capital
management
20

Sources: Reserve Bank of Australia – Australian Economy Snapshot (Update of 5 December 2017), http://www.rba.gov.au/snapshots/economy-snapshot/; Reserve
Bank of Australia – Capital Market Yields – Government Bonds – Daily (Last accessed on 28 December 2017),
https://www.quandl.com/data/RBA/F02_FCMYGBAG10D-Capital-Market-Yields-Government-Bonds-Daily-Australian-Government-10-year-bond-Units-Per-cent-per-
annum-Series-ID-FCMYGBAG10D, Australia Bureau of Statistics – Labour Force, Australia Dec 2017 (Release of 18 January 2018),
www.abs.gov.au/ausstats/[email protected]/0/F756C48F25016833CA25753E00135FD9?Opendocument
Economic Growth
• Australian economy has improved over 2017 with year-
on-year GDP growth of 2.8%, consistent with the RBA’s
expectation that growth in the Australian economy will
gradually pick up over the coming year.
• The outlook for non-mining investment has improved
further and reported business conditions are high.
• Increased public infrastructure investment has supported
the economy, together with the continuing growth in
exports to China.
• Population growth exceeded FY17 forecasts at 1.6%,
underpinned by steady growth in net overseas migration.
Official Interest Rates
• The RBA maintained the cash rate at 1.5%.
• Australian government 10 year bond yields at 2.67%.
Unemployment Rate
• Low unemployment rate of 5.5% with workforce
participation rate increasing to 65.7%
• Wage growth is expected to pick up gradually as the
labour market strengthens.
Australian Economy Snapshot
0
1
2
3
4
3Q2015 4Q2015 1Q2016 2Q2016 3Q2016 4Q2016 1Q2017 2Q2017 3Q2017
(%)
Australian GDP Annual Growth Rates
0
1
2
3
4
5
2010 2011 2012 2013 2014 2015 2016 2017
(%)
Australian Cash Rate
21

• Australian industrial supply is above the long term average with robust additions recorded in 4Q17.
Construction activity is predominantly concentrated in eastern seaboard cities, accounting for 1.5 million
sqm or 93% of total development.
• Occupier demand has been strong in both pre-commitment and existing vacancies with year-to-date take-
up levels totalling 2.4 million sqm (17% above the 10-year average).
• Australian investment volume remains below the 5-year average which reflects fewer assets available on
the market. Given limited access to assets, portfolio sales have been highly sought after by institutional
investors in order to gain scale.
• The positive spillover effects from infrastructure investment have been observed throughout 2017. Land
value uplift has been realised across several markets, especially in Sydney’s Outer West.
Australian Industrial Market
22
0
400
800
1,200
1,600
2,000
2,400
Q42008
Q42009
Q42010
Q42011
Q42012
Q42013
Q42014
Q42015
Q42016
Q42017
SQM ('000s)
Annualised As at Q4 2017
Australian Total Industrial Supply
Completed 10 year annual average
Sources: JLL Real Estate Intelligence Service – Industrial Market Snapshot 4Q 2017; Jones Lang LaSalle Real Estate Data Solution – Industrial
Occupier Moves from 4Q07 to 4Q17; Jones Lang LaSalle Real Estate Data Solution – Industrial Sales Transactions from 4Q07 to 4Q17

Melbourne Industrial Market
Supply: Supply levels throughout 2017 are 36% above the 10-year average with uptick in pre-commitment
levels in the West.
Demand: Leasing activity was subdued in 4Q17 however, annual gross take-up levels exceed the long term
average and have been largely driven by demand for existing facilities in the West and the South East.
Rents: Prime face rents have recorded growth over the year across all precincts (except for City Fringe).
Vacancy: Net absorption remains positive as a result of good levels of tenant take-up in existing facilities,
together with high levels of pre-commitment for new stock.
23
0
100
200
300
400
500
600
700
800
900
Q42008
Q42009
Q42010
Q42011
Q42012
Q42013
Q42014
Q42015
Q42016
Q42017
SQM ('000s)
Annualised As at Q4 2017
Melbourne Industrial Total Supply
Completed 10 year annual average
$84 $86 $83 $84 $84 $87 $88 $89 $89 $90 $92
50
75
100
125
150
Q42007
Q42008
Q42009
Q42010
Q42011
Q42012
Q42013
Q42014
Q42015
Q42016
Q42017
Pri
me g
rad
e n
et
fact
ren
t $p
sm
p.a
.
Melbourne Industrial Prime Grade Net Face Rents
Sources: Jones Lang LaSalle Real Estate Intelligence Service – Melbourne Industrial Final Data 4Q17; Jones Lang LaSalle Real Estate Intelligence Service – Melbourne
Industrial Snapshot 4Q17; Jones Lang LaSalle Real Estate Data Solution – Melbourne Construction Projects from 4Q07 to 4Q17

Supply: Above-average supply is forecast to continue in 2018 with a number of projects currently under
construction, including Goodman’s Oakdale Industrial Estate at Eastern Creek. However, a constrained supply
of serviced land is likely to limit the amount of development activity post 2018.
Demand: Gross take-up has well exceeded the 10-year average, predominantly driven by pre-lease deals as
developer incentivised, tenant relocation options have been more attractive compared to lease renewals of
leases.
Rents: Steady rental growth continues in 4Q17 with a year-on-year growth averaging at 4.9% for all precincts.
Vacancy: Vacancy across the market is recorded at its lowest level.
Sydney Industrial Market
24
0
100
200
300
400
500
600
700
800
900
1,000
Q42008
Q42009
Q42010
Q42011
Q42012
Q42013
Q42014
Q42015
Q42016
Q42017
SQM ('000s)
Annualised As at Q4 2017
Sydney Industrial Total Supply
Completed 10 year annual average
$113$112
$109 $111$114
$117$121 $121 $123 $126
$132
75
100
125
150
175
Q42007
Q42008
Q42009
Q42010
Q42011
Q42012
Q42013
Q42014
Q42015
Q42016
Q42017
Pri
me g
rad
e n
et
fact
ren
t $p
sm
p.a
.
Sydney Industrial Prime Grade Net Face Rents
Sources: Jones Lang LaSalle Real Estate Intelligence Service – Sydney Industrial Final Data 4Q17; Jones Lang LaSalle Real Estate Intelligence Service – Sydney Industrial
Snapshot 4Q17; Jones Lang LaSalle Real Estate Data Solution – Sydney Construction Projects from 4Q07 to 4Q17

Supply: Total supply remains around the 10 year average.
Demand: Third party logistics players are driving the occupier market with majority of space leased in the
Southern precinct. Tenants have continued to take advantage of competitive effective rents offered by
landlords which allows for facility upgrades and expansion.
Rents: Prime face rents have dropped by 5.7% compared to 4Q16 but remain stable on a quarterly change;
secondary rents continue to track sideways, particularly within the Northern precinct.
Vacancy: There has exhibited a sustained improvement in vacancy levels for new stock whilst secondary
grade older facilities remain challenging.
Brisbane Industrial Market
25
0
100
200
300
400
500
600
Q42008
Q42009
Q42010
Q42011
Q42012
Q42013
Q42014
Q42015
Q42016
Q42017
SQM ('000s)
Annualised As at Q4 2017
Brisbane Industrial Total Supply
Completed 10 year annual average
$113$115 $113
$117 $119 $120 $119 $118 $117 $117$110
75
100
125
150
Q42007
Q42008
Q42009
Q42010
Q42011
Q42012
Q42013
Q42014
Q42015
Q42016
Q42017
Pri
me g
rad
e n
et
fact
ren
t $p
sm
p.a
.
Brisbane Industrial Prime Grade Net Face Rents
Sources: Jones Lang LaSalle Real Estate Intelligence Service – Brisbane Industrial Final Data 4Q17; Jones Lang LaSalle Real Estate Intelligence Service – Brisbane Industrial
Snapshot 4Q17; Jones Lang LaSalle Real Estate Data Solution – Brisbane Construction Projects from 4Q07 to 4Q17

Investor relations contact
Mr. Ng Chung Keat
Frasers Logistics & Industrial Asset Management Pte. Ltd.
Email: [email protected]
Website: www.fraserslogisticstrust.com
THANK YOU
166 Pearson Road, Yatala, Queensland