results presentation jan- sep 2015 - isolux corsan€¦ · document contains statements related to...
TRANSCRIPT

Results Presentation
Jan- Sep 2015 November 25th, 2015

November 25th 2015 | 2
225
131
131
196
48
48
178
178
178
234
234
234
243
203
0
235
138
27
129
5
5
Disclaimer
This document has been prepared by Grupo Isolux Corsán, S.A.; therefore no part of it may be published, disclosed or distributed in any form or by any means, nor used by any other person or entity, without the prior written consent of Grupo Isolux Corsán, S.A. This document contains statements related to our future business and financial performance and future events or developments involving us that may constitute forward-looking statements. These statements may be identified by words such as “expects,” “looks forward to,” “anticipates,” “intends,” “plans,” “believes,” “seeks,” “estimates,” “will,” “project” or words of similar meaning. We may also make forward-looking statements in other reports, in presentations, in material delivered to shareholders and in press releases. In addition, our representatives may from time to time make oral forward-looking statements. Such forward-looking statements and information are based on the current expectations and assumptions, and are, therefore, subject to certain risks and uncertainties. A variety of factors, which are beyond our control or may be difficult to predict, affect our operations, performance, business strategy and results and could cause our actual results, performance or achievements to be materially different from any future results, performance or achievements that may be expressed or implied by such forward-looking statements or anticipated on the basis of historical trends. Should one or more risks or uncertainties materialize, or should underlying assumptions prove incorrect, our actual results, performance or achievements may vary materially from those described in the relevant forward-looking statement as being expected, anticipated, intended, planned, believed, sought, estimated or projected. We neither intend, nor assume any obligation, to publicly update or revise these forward-looking statements in light of developments which differ from those anticipated. The information contained in this document has not been verified or revised by the auditors of Grupo Isolux Corsán, S.A. Certain data included in this presentation has been subject to rounding adjustments. Accordingly, in certain instances, the sum of the numbers in a column or a row in tables may not conform exactly to the total figure given for that column or row. This document does not constitute or form part of any offer for sale or subscription of or solicitation or invitation of any offer to buy or subscribe for any securities in any jurisdiction, including in the United States, nor shall it or any part of it form the basis of or be relied on in connection with any contract or commitment whatsoever. Specifically, this presentation does not constitute a “prospectus” within the meaning of the Securities Act.

November 25th 2015 | 3
225
131
131
196
48
48
178
178
178
234
234
234
243
203
0
235
138
27
129
5
5
Results Presentation Q3 2015 | Table of Contents
Table of Contents 1. Key Developments
2. Business and Financial Highlights
i. EPC
ii. Concessions
3. Cash flow and debt overview
4. Appendix
November 25th 2015 | 4
225
131
131
196
48
48
178
178
178
234
234
234
243
203
0
235
138
27
129
5
5
1. Key Developments

November 25th 2015 | 5
225
131
131
196
48
48
178
178
178
234
234
234
243
203
0
235
138
27
129
5
5
Results Presentation Q3 2015 | Key Developments
Group
Financials
Q3 YTD 2015 consolidated Revenues reached €1,580 million.
Q3 YTD 2015 consolidated EBITDA: €115 million. EBITDA includes non-recurring losses coming from Brazil where macro environment led to a significant
slowdown in collections, resulting in project cancellations. This effect represents €34 million of negative EBITDA.
Q3 YTD 2015 Net loss of €20 million vs. a loss of €17 million in the same period last year, driven by a larger share of profit from the equity accounted business which helped offset the decline in EBITDA.
EPC
EPC backlog at €7.0 billion (5% Y-o-Y increase).
New orders in the first nine months of 2015 amounted to €1,798 million.
Main contracts awarded in Q3 2015: Transmission lines between Kenya and Ethiopia in joint venture with Siemens (€170 million). Solar plant in Chile (€124m). Transmission lines and substations in US (€48 million).
Concessions
Two new transmission line concessions awarded in Brazil, in the states of Pará and Rondônia, which are part of the package to be sold.
Japan solar plant already under construction after securing long term financing.

November 25th 2015 | 6
225
131
131
196
48
48
178
178
178
234
234
234
243
203
0
235
138
27
129
5
5
Results Presentation Q3 2015 | Key Developments
Corporate
Isolux Infrastructure (IIN) break up process:
Isolux and PSP entered into an agreement dated March 31, 2015, related to the dissolution of the joint venture (Isolux Infrastructure) by splitting the company's business between them, in such manner that Isolux shall become the sole owner of electric transmission lines and solar photovoltaic assets (Energy Business) excluding WETT transmission line and PSP shall become the sole owner of toll roads and WETT.
An independent third party was appointed to determine, among others, the equity split and the adjustment payment.
Third party expert determination report was received on September 4, 2015, concluding that PSP owes
$197.5 million to Isolux (corresponding from a total amount of $302.5 million of which $105 million have already been paid) to be adjusted with post-effective date leakages.

November 25th 2015 | 7
225
131
131
196
48
48
178
178
178
234
234
234
243
203
0
235
138
27
129
5
5
Results Presentation Q3 2015 | Key Developments
Corporate
Upon break up completion Isolux will become the sole owner of IIN Energy Business (ex WETT).
Different offers to acquire our transmission lines and solar business are under analysis.
CASH: $302.5 million (of which $105 million have already been paid)
88%
IIN Energy Business (Isolux 100%)
100%
50% IENNE – Interligação
100% LXTE - Xingu
100% LMTE – Macapá
CPTE - Cachoeira Paulista 100%
JTE – Jaurú 33%
Brazil
Uttar Pradesh 100%
India
161 MW 51%
Spain
7 MW 51%
Italy
44 MW 51%
Peru
Transmission Lines Solar PV
17 MW 50%
India
LTTE – Taubate 100%
LITE - Itacaiunas 100%
25 MW 100%
US
35 MW 100%
Japan
30 MW 100%
Puerto Rico

November 25th 2015 | 8
225
131
131
196
48
48
178
178
178
234
234
234
243
203
0
235
138
27
129
5
5
Results Presentation Q3 2015 | Key Developments
Isolux Corsán Group Key metrics by segment (in € MM, unless otherwise stated)
Q3 YTD 2014
Q3 YTD 2015
Change
EPC 1,541 1,561 1%
Subtotal (before IFRS 11) 2,009 2,232 11%
Concessions 447 653 46%
Other and corporate 21 18 (15%)
Adjustments due to change in consolidation method(1) (460) (652) -
REVENUES
Total Consolidated 1,549 1,580 2%
Q3 YTD 2014
Q3 YTD 2015
Change
203 148 (27%)
452 491 9%
267 375 40%
(18) (32) -
(266) (376) -
EBITDA
186 115 (38%)
Q3 YTD 2014
13%
23%
60%
n.a.
n.a.
EBITDA Margin
12%
Q3 YTD 2015
9%
22%
58%
n.a.
n.a.
7%
(1) Equity method consolidation of Isolux Infrastructure and the Car park business
One off losses in Brazil, driven by country macro environment, compressed EPC EBITDA margin

November 25th 2015 | 9
225
131
131
196
48
48
178
178
178
234
234
234
243
203
0
235
138
27
129
5
5
Results Presentation Q3 2015 | Key Developments
Isolux Corsán Group Debt breakdown by segment (in € MM, unless otherwise stated)
Sep 30, 2015
Dec 31, 2014
EPC 170 158
Subtotal (before IFRS 11) 1,599 1,548
Concessions 7 8
Corporate and other 1,422 1,382
Adjustments due to change in consolidation method(1) - -
Bank borrowings and Senior Notes
Total Consolidated 1,599 1,548
Sep 30, 2015
Dec 31, 2014
-
3,424
3,263
160
(3,173)
Project Finance(2)
250
Sep 30, 2015
Dec 31, 2014
177 248
480 631
296 339
7 45
(292) (325)
Cash and STFI
188 306
-
3,464
3,308
156
(3,243)
221
(1) Equity method consolidation of Isolux Infrastructure and the Car park business (2) Guarantees given from Grupo Isolux Corsán to Isolux Infrastructure to finance projects amounted to €171M as of December 31, 2014 and €124M as of September 30, 2015.
Estimated adjusted payment inflow ($197.5 million) to be received after Q3 2015

November 25th 2015 | 10
225
131
131
196
48
48
178
178
178
234
234
234
243
203
0
235
138
27
129
5
5
(93)
(57)
(18)
162
(33)
(24)
(49)
123
(-26)
(74) (59)
2013 2014 2015
Q1 Q2 Q3 Q4
Results Presentation Q3 2015 | Key Developments
Cash flow from operating activities: seasonality
Negative cash flow from operations driven by working capital outflow in line with seasonal patterns
*2015 dotted line to illustrate customary seasonal trend
*
November 25th 2015 | 11
225
131
131
196
48
48
178
178
178
234
234
234
243
203
0
235
138
27
129
5
5
Results Presentation Q3 2015 | Key Developments
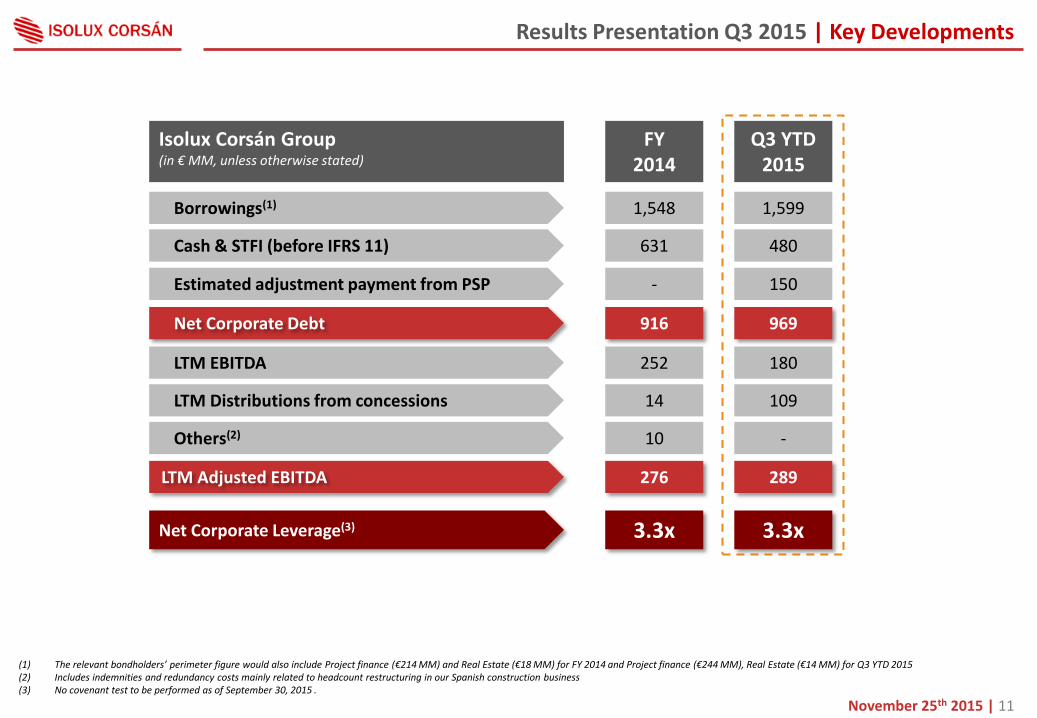
FY 2014
Q3 YTD 2015
Borrowings(1) 1,548 1,599
Cash & STFI (before IFRS 11) 631 480
Net Corporate Debt 916 969
LTM EBITDA 252 180
LTM Distributions from concessions 14 109
LTM Adjusted EBITDA 276 289
Net Corporate Leverage(3) 3.3x 3.3x
(1) The relevant bondholders’ perimeter figure would also include Project finance (€214 MM) and Real Estate (€18 MM) for FY 2014 and Project finance (€244 MM), Real Estate (€14 MM) for Q3 YTD 2015 (2) Includes indemnities and redundancy costs mainly related to headcount restructuring in our Spanish construction business (3) No covenant test to be performed as of September 30, 2015 .
Isolux Corsán Group (in € MM, unless otherwise stated)
Others(2) 10 -
Estimated adjustment payment from PSP - 150

November 25th 2015 | 12
225
131
131
196
48
48
178
178
178
234
234
234
243
203
0
235
138
27
129
5
5
2. Business and Financial Highlights
i. EPC

November 25th 2015 | 13
225
131
131
196
48
48
178
178
178
234
234
234
243
203
0
235
138
27
129
5
5
(1) Defined as New Orders / Revenue (2) From consolidated Cash Flow Statement which is a proxy to EPC & Other business segments.
EPC (in € MM, unless otherwise stated)
Q3 YTD 2014
Q3 YTD 2015
Change
New Orders
Backlog
Backlog for 3rd parties
2,223 1,798 (19%)
6,626 6,969 5%
80% 83% 3 p.p.
Revenue 1,541 1,561 1%
Book to bill ratio(1) 1.4x 1.2x (0.2x)
EBITDA 203 148 (27%)
EBITDA Margin 13% 9% (4 p.p.)
Operating Cash Flow(2) (49) (59) (20%)
Cash Flow from Investments(2) (24) 62 -
Robust backlog represents almost 3 years of activity
Results Presentation Q3 2015 | Business and Financial Highlights

November 25th 2015 | 14
225
131
131
196
48
48
178
178
178
234
234
234
243
203
0
235
138
27
129
5
5
2,223
1,798
9m 2014 9m 2015
EPC - Key Financial Highlights
Key Figures EPC Segment (in € MM) Main developments
Brazil impacted not only EBITDA, but, in terms of revenues, has almost no contribution.
Senegal road: 2 out of 3 segments have been completed and the client has issued provisional acceptance certificate.
New orders awarded in Q3 in the US which is a target market for the Group:
Contract with MidAmerican Energy for several T&D works in high voltage lines and substations in Texas (€30 million).
EPC works on high voltage lines and
substations in Arkansas, South Dakota and Florida (€18 million).
EPC Segment New Orders
y-o-y Backlog
y-o-y Revenue
y-o-y EBITDA
y-o-y
Growth (19%) 5% 2% (27%)
New Orders Backlog Revenue EBITDA
6,626 6,969
9m 2014 9m 2015
1,541 1,561
9m 2014 9m 2015
203
148
9m 2014 9m 2015
Results Presentation Q3 2015 | Business and Financial Highlights

November 25th 2015 | 15
225
131
131
196
48
48
178
178
178
234
234
234
243
203
0
235
138
27
129
5
5
Spain 19%
Latam 53%
Rest of Europe
3%
Middle East and Africa
5%
North America
2% Asia 18%
Spain 15%
Latam 56%
Rest of Europe
2%
Middle East and Africa
11%
North America
3% Asia 13%
Energy 34%
T&D 26%
Infrastructure 40%
Energy 47%
T&D 21%
Infrastructure 32%
EPC Revenue by activity
Q3 YTD 2015
Q3 YTD 2014
EPC Revenue by Geographic Area
Q3 YTD 2015
Q3 YTD 2014
85% International
€1,561 MM
€1,541 MM
81% International
Results Presentation Q3 2015 | Business and Financial Highlights
November 25th 2015 | 16
225
131
131
196
48
48
178
178
178
234
234
234
243
203
0
235
138
27
129
5
5
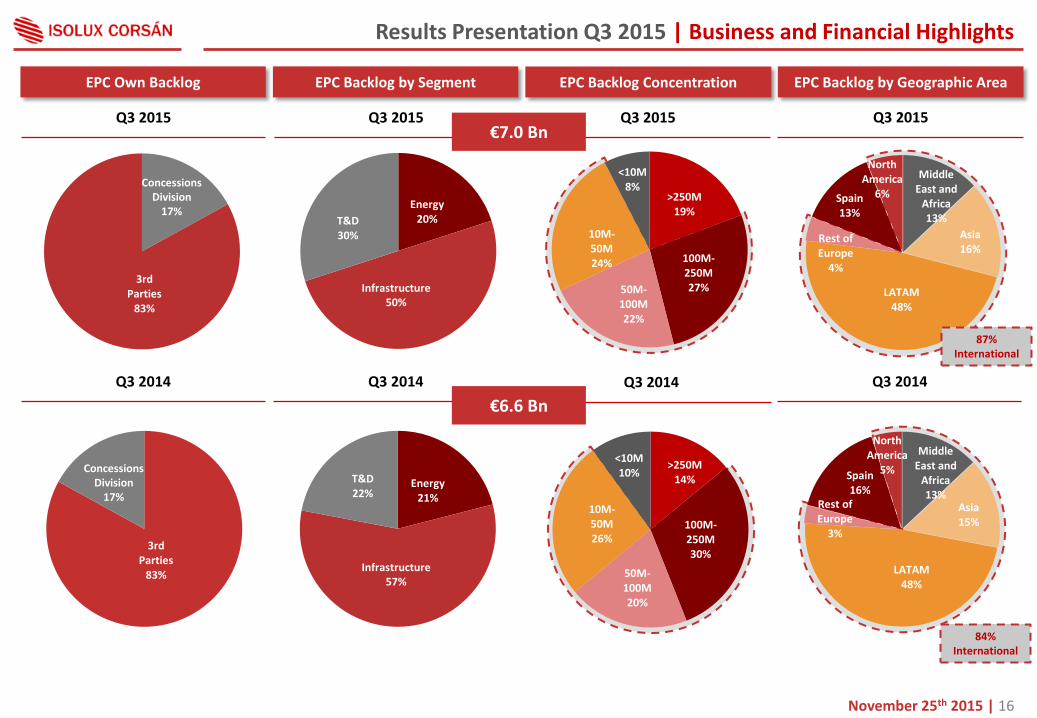
Middle East and
Africa 13%
Asia 16%
LATAM 48%
Rest of Europe
4%
Spain 13%
North America
6%
Middle East and
Africa 13%
Asia 15%
LATAM 48%
Rest of Europe
3%
Spain 16%
North America
5% >250M 14%
100M-250M 30%
50M-100M 20%
10M-50M 26%
<10M 10%
>250M 19%
100M-250M 27% 50M-
100M 22%
10M-50M 24%
<10M 8%
Q3 2014
Energy 20% T&D
30%
Infrastructure 50%
3rd Parties
83%
Concessions Division
17%
Energy 21%
T&D 22%
Infrastructure 57%
Q3 2015
EPC Backlog by Segment EPC Backlog by Geographic Area
Q3 2015
Q3 2014
EPC Backlog Concentration
Q3 2015
Q3 2014
87% International
84% International
EPC Own Backlog
Q3 2015
Q3 2014
€7.0 Bn
€6.6 Bn
3rd Parties
83%
Concessions Division
17%
Results Presentation Q3 2015 | Business and Financial Highlights

November 25th 2015 | 17
225
131
131
196
48
48
178
178
178
234
234
234
243
203
0
235
138
27
129
5
5
2. Business and Financial Highlights
ii. Concessions

November 25th 2015 | 18
225
131
131
196
48
48
178
178
178
234
234
234
243
203
0
235
138
27
129
5
5
447
653
Q3 YTD 2014 Q3 YTD 2015
Concessions - Key Financial Highlights
Key Figures Concessions (in € MM) Main developments
Revenue growth includes the impact related to the tariff review of the transmission lines in Brazil (already detailed in our H1 2015 presentation).
Transmission lines operating EBITDA increased by 12%.
Toll roads EBITDA has grown by 24% driven by the opening of NH6 and NH8 to traffic.
Isolux Infrastructure and car parks accounted by the equity method
(1) Construction Revenue not included
Revenue Q3 YTD 2015 (1) Revenue Q3 YTD 2014 (1)
Revenue EBITDA
267
375
Q3 YTD 2014 Q3 YTD 2015
47%
31%
19%
3% Transmission lines
Toll roads
Solar
Car parks
+46% +40%
54% 28%
15%
3%
Results Presentation Q3 2015 | Business and Financial Highlights

November 25th 2015 | 19
225
131
131
196
48
48
178
178
178
234
234
234
243
203
0
235
138
27
129
5
5
Concessions Key financial metrics (in € MM, unless otherwise stated)
Q3 YTD 2014
Q3 YTD 2015
Change
Transmission lines 172 262 52%
Isolux Infrastructure 354 468 32%
Toll roads 114 136 19%
Solar photovoltaic 67 70 4%
Revenues
Total Concessions 447 653 46%
Q3 YTD 2014
Q3 YTD 2015
Change
140 226 62%
266 370 39%
71 88 24%
55 56 2%
EBITDA
267 375 40%
Q3 YTD 2014
81%
75%
62%
82%
EBITDA Margin
60%
Q3 YTD 2015
86%
79%
65%
80%
58%
Car Parks 10 15 47% 3 8 136% 31% 53%
Toll roads
97%
3%
Total kilometres: 1,644
89%
11%
100%
Total MW: 286 Total spaces: 27,329
In operation Under construction
Other( inc. Construction revenue) 83 170 - (2) (3) - n.a. n.a.
Solar PV Car Parks Transmission lines
61%
39%
Total kilometres: 5,959
Results Presentation Q3 2015 | Business and Financial Highlights
Of which, operating 87 93 7% 70 78 12% 80% 84%

November 25th 2015 | 20
225
131
131
196
48
48
178
178
178
234
234
234
243
203
0
235
138
27
129
5
5
Location Asset Stake (1)
(%) Years to Maturity
Demand Risk
Revenue Mechanism(2)
Equity Invested(5) Net Debt(6)
LXTE 100% Availability Payment €122m €225m
LMTE 100% Availability Payment €133m €207m
CPTE 100% Availability Payment €15m €40m
IENNE 50% Availability Payment €37m €23m
JTE 33% Availability Payment €20m €16m
LTTE 100% Availability Payment €43m €46m
LITE 100% Availability Payment €4m €3m
UPTE 100% Availability Payment €114m €301m
WETT 50% Unlimited Availability Payment €152m €272m
BR116 90% Real Toll €103m €170m
NH1 61% Real Toll €47m €405m
NH2 (4) 50% Real Toll €17m €13m
NH6 (4) 50% Real Toll €24m €135m
NH8 (4) 50% Real Toll €28m €80m
CAMS 100% Real Toll €58m €297m
COPEXA 50% Real Toll €71m €242m
Ocaña A4 51% Shadow Toll €14m €44m
I 69 Section 5 51% Availability Payment €6m €62m
T-Solar 88% Unlimited PPA(3)/ Feed in Tariff €239m €711m
Concessions – Isolux Infrastructure’s Assets
Toll
-Ro
ads
Tran
smis
sio
n L
ine
s
(1) Stake held by Isolux Infrastructure (2) Revenues indexed to inflation. (3) PPA stands for Power Purchase agreement. (4) 50% stake owned in partnership with Morgan
Stanley Infrastructure Partners. (5) Isolux Infrastructure proportional Equity Invested
as of September 2015 (6) Isolux Infrastructure Net debt based on
Consolidation stake as of September 2015. Holdco Net debt was €80m So
lar
(Brazil)
(India)
(Mexico)
(Spain)
(USA)
(Brazil)
(India)
(USA)
2013
2004
2013
2013
2007
2009
2012
2013
2010
2009
2010
Operational & under construction
Under construction
Start of operations
2015
23
22
17
23
22
26
28
33
19
9
25
13
12
39
38
11
36
Results Presentation Q3 2015 | Business and Financial Highlights
2015

November 25th 2015 | 21
225
131
131
196
48
48
178
178
178
234
234
234
243
203
0
235
138
27
129
5
5
3. Cash flow and debt overview

November 25th 2015 | 22
225
131
131
196
48
48
178
178
178
234
234
234
243
203
0
235
138
27
129
5
5 250
186
294
(59)
(111)
62
Cash and cash equivalentsSep 2014
Cash and cash equivalentsDec 2014
Operating Cash Flow Q3 YTD2015
Cash Flow from Investingactivities Q3 YTD 2015
Cash Flow from FinancingActivities Q3 YTD 2015
Cash and cash equivalentsSep 2015
Consolidated Cash Flow Bridge December 2014 to September 2015 (in € MM)
Cash Flow Bridge
Results Presentation Q3 2015 | Cash flow and debt overview
Cash from operations(1):
€99M Working capital:
€(159M)
(1) Cash from operations including profit for the year and after taxes paid (2) Cash and cash equivalents as of September 30, 2015, include €8.3 million of Exchange trade differences
(2)

November 25th 2015 | 23
225
131
131
196
48
48
178
178
178
234
234
234
243
203
0
235
138
27
129
5
5
Corporate debt maturities as of September 30, 2015(1): breakdown by type of debt (Total €1,599 MM)
Debt Maturities
Over 83% of our corporate debt maturities are long term
(1) Adjusted for subsequent extensions that have taken place from September 30th until the date of this presentation (2) Senior Notes in accordance with IFRS, at amortized cost
2015 2016 2017 2018 2019 2020 onwards
Results Presentation Q3 2015 | Cash flow and debt overview
121 70
30
197
150 45
27
26
832(2)
3
67
13
2015 2016 2017 2018 2019 2020 and onwards
Term loans Advanced credit debts Senior notes Credit lines Finance lease liabilities
92
216
83
982
18

November 25th 2015 | 24
225
131
131
196
48
48
178
178
178
234
234
234
243
203
0
235
138
27
129
5
5
4. Appendix

November 25th 2015 | 25
225
131
131
196
48
48
178
178
178
234
234
234
243
203
0
235
138
27
129
5
5
Results Presentation Q3 2015 | Appendix
Detailed Financial Statements - Consolidated Balance Sheet by segment
Consolidated Balance Sheet (in million €)
Property, plant and equipment 81 0 31 113 - 113 75 0 31 107 - 107
Investments in associates and joint ventures - (0) - (0) 974 974 - - - - 870 870
Other non-current assets 619 5,048 364 6,030 (4,963) 1,067 660 4,991 312 5,963 (4,871) 1,092
Total non current assets 700 5,048 395 6,143 (3,989) 2,154 735 4,991 343 6,070 (4,001) 2,069
Inventories 135 25 101 261 (7) 253 173 27 103 304 (5) 299
Accounts receivable 2,651 312 (774) 2,189 (341) 1,847 3,007 102 (664) 2,444 (245) 2,199
Derivative financial instruments 2 - 0 2 - 2 0 7 2 9 (7) 2
Financial assets 11 25 3 39 (25) 15 11 16 3 29 (16) 13
Cash and cash equivalents 236 314 41 592 (301) 291 167 280 4 450 (276) 174
Non-current assets held for sale - - 380 380 - 380 - - 353 353 - 353
Total current assets 3,035 676 (249) 3,462 (674) 2,788 3,358 431 (199) 3,590 (548) 3,041
Total assets 3,735 5,724 146 9,605 (4,663) 4,942 4,093 5,422 144 9,660 (4,550) 5,110
Borrowings 158 8 1,382 1,548 - 1,548 170 7 1,422 1,599 - 1,599
Project finance - 3,308 156 3,464 (3,243) 221 - 3,263 160 3,424 (3,173) 250
Liabilities held for sale - - 173 173 - 173 - - 151 151 - 151
Accounts payable 2,505 556 (294) 2,767 (412) 2,355 2,747 373 (233) 2,887 (224) 2,663
Other liabilities 196 915 51 1,162 (882) 280 232 1,060 (27) 1,265 (1,029) 236
Total liabilities 2,859 4,787 1,467 9,113 (4,536) 4,577 3,150 4,704 1,473 9,326 (4,427) 4,899
September 30, 2015
EPC ConcessionsOther and
corporateSub-Total
Change in
consolidation
method
Total
Consolidated
December 31, 2014
Sub-Total
Change in
consolidation
method
Total
ConsolidatedEPC Concessions
Other and
corporate

November 25th 2015 | 26
225
131
131
196
48
48
178
178
178
234
234
234
243
203
0
235
138
27
129
5
5
Detailed Financial Statements - Consolidated Income Statement by segment
Results Presentation Q3 2015 | Appendix
Consolidated Income Statement (in million €)
Segment's ordinary revenue 1,541 447 21 2,009 (460) 1,549 1,561 653 18 2,232 (652) 1,580
Other 12 - 0 13 (8) 4 22 - (1) 22 (7) 14
Total operating income 1,553 447 21 2,021 (468) 1,553 1,584 653 17 2,254 (659) 1,595
Other operating expenses (1,350) (179) (40) (1,569) 202 (1,367) (1,436) (277) (50) (1,763) 283 (1,480)
EBITDA 203 267 (18) 452 (266) 186 148 375 (32) 491 (376) 115
Depreciation, amortization and impairment losses (15) (64) (21) (100) 65 (35) (10) (69) (24) (103) 79 (24)
Change in trade provisions (10) 0 (25) (35) - (35) (9) 0 (12) (21) - (21)
Operating results 178 203 (64) 317 (201) 116 129 306 (69) 367 (297) 70
Net financial results (17) (189) (120) (326) 169 (158) (28) (210) (113) (351) 201 (150)
Equity method - - - - 22 22 - - - - 48 48
Profit before income tax 161 14 (184) (9) (10) (20) 101 96 (181) 16 (48) (32)
Income tax - - (3) (3) 11 8 - - (27) (27) 48 21
Results for the period from continuing operations 161 14 (187) (12) 1 (11) 101 96 (208) (11) 0 (11)
Results for the period from discontinuing operations - - (8) (8) - (8) - - (11) (11) - (11)
Results for the period 161 14 (195) (20) 1 (20) 101 96 (220) (22) 0 (22)
Attributable to:
Owners of the parent - - - (17) - (17) - - - (20) - (20)
Non-controlling interests - - - (3) 1 (3) - - - (2) 0 (2)
Q3 YTD 2014
EPC ConcessionsOther and
corporateSub-Total
Change in
consolidation
method
Total
Consolidated
Q3 YTD 2015
EPC ConcessionsOther and
corporateSub-Total
Change in
consolidation
method
Total
Consolidated
November 25th 2015 | 27
225
131
131
196
48
48
178
178
178
234
234
234
243
203
0
235
138
27
129
5
5
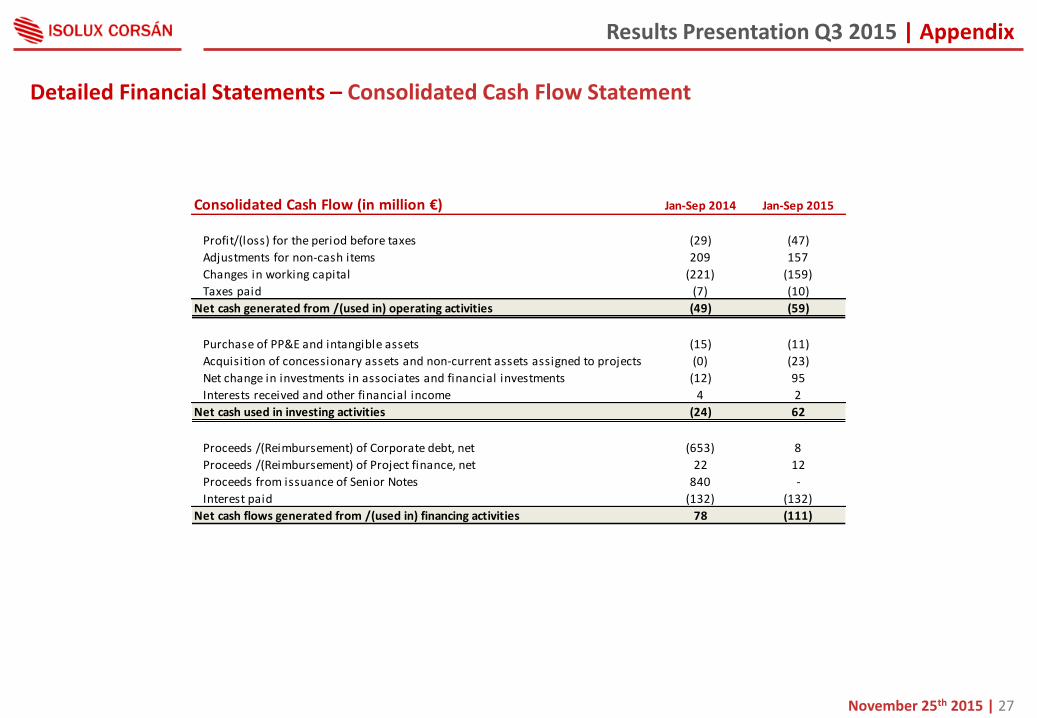
Detailed Financial Statements – Consolidated Cash Flow Statement
Results Presentation Q3 2015 | Appendix
Consolidated Cash Flow (in million €) Jan-Sep 2014 Jan-Sep 2015
Profit/(loss) for the period before taxes (29) (47)
Adjustments for non-cash items 209 157
Changes in working capital (221) (159)
Taxes paid (7) (10)
Net cash generated from /(used in) operating activities (49) (59)
Purchase of PP&E and intangible assets (15) (11)
Acquisition of concessionary assets and non-current assets assigned to projects (0) (23)
Net change in investments in associates and financial investments (12) 95
Interests received and other financial income 4 2
Net cash used in investing activities (24) 62
Proceeds /(Reimbursement) of Corporate debt, net (653) 8
Proceeds /(Reimbursement) of Project finance, net 22 12
Proceeds from issuance of Senior Notes 840 -
Interest paid (132) (132)
Net cash flows generated from /(used in) financing activities 78 (111)

March 5th 2015 | 28
225
131
131
196
48
48
178
178
178
234
234
234
243
203
0
235
138
27
129
5
5
Thank you
© Isolux Corsán 2015
Isolux Corsán Investor Relations [email protected]