results using nsu3d for the first aeroelastic prediction ... · pdf filea weakly coupled...
TRANSCRIPT
Results using NSU3D for the First Aeroelastic
Prediction Workshop
Dimitri J. Mavriplis � Zhi Yang y Michael Long z Jay Sitaraman x
Department of Mechanical Engineering, University of Wyoming, Laramie, WY 82071
This paper details the results obtained with the NSU3D unstructured mesh Reynolds-averaged Navier-Stokes solver for the �rst Aeroelastic Prediction Workshop. Three dif-ferent test cases were computed for the workshop: The Rectangular Supercritical Wing(RSW) case, the Benchmark Supercritical Wing case (BSCW), and the High-ReynoldsNumber Aero-Structural Dynamics (HIRENASD) test case. Results are shown for allthree test cases using di�erent grid sizes, time step sizes and in some cases convergencecriteria. Computational results are compared with experimental data and are also assessedfor grid convergence and temporal convergence.
I. Introduction
The community workshop model for assessing the state-of-the-art in computational methods for aerospaceengineering has gained popularity over the last decade. This has been due largely to the success of theDrag Prediction Workshop (DPW) series, which initiated its �rst workshop in June 2001,1 and recentlycompleted its �fth workshop in June 2012.2 The principal focus of the DPW series has been the predictionof forces and moments for steady-state aircraft cruise conditions. Over the years, this success has beenreplicated in other workshops devoted either to studying more speci�c ow phenomena such as the Shock-Boundary-Layer Workshop,3 or focused on more complex aerodynamic problems, such as the High-LiftPrediction Workshop series.4 The Aeroelastic Prediction Workshop (AePW) represents the latest incarnationof this community workshop model, targeting the assessment of numerical methods for simulating aeroelasticproblems. This represents a substantial increase in complexity compared to previous workshops, due to thefact that aeroelasticity problems are inherently both time-dependent and multidisciplinary. For example,while the DPW series has been able to focus on quantifying spatial discretization error, the AePW series mustalso include the e�ect of temporal disrecretization errors and algebraic errors due to incomplete convergenceat each implicit time step. Additionally, errors in the structural dynamics model and the uid-structurecoupling will certainly play a role in overall simulation accuracy and must be considered as well. In orderto assess these various error sources, a methodical approach to studying their individual e�ects is warrantedbefore moving on to the fully coupled problem. Thus, the �rst AePW was intentionally designed to focuson problems that stress the unsteady aerodynamic prediction component of the overall aeroelastic problemwhile minimizing the importance of the structural dynamics and aeroelastic coupling components. With thisin mind, three aeroelastic benchmark test cases were chosen for the workshop: the �rst two consisting of arigid transonic wing undergoing a prescribed periodic pitching motion, an the third test case consisting ofa weakly coupled aeroelastic transonic wing which could be simulated using linear modal analysis. Thesethree test cases were intended to form a suite of progressively more di�cult simulation benchmarks for whichexperimental data is available for comparison.
The �rst AePW was held in April 2012, prior to the AIAA 53rd Structures, Structural Dynamics andMaterials Conference in Honolulu, HI. The stated objectives of the workshop were to provide an impartialforum for the assessment of the state-of-the-art in Computational Aeroelasticity(CAe) methods as practicaltools for the prediction of static and dynamic aeroelastic phenomena and responses on relevant geometries,�Professor, AIAA Associate Fellow; email: [email protected] Scientist, AIAA member; email: [email protected] Engineer, AIAA member; email:mikelong@scienti�c-sims.comxAssistant Professor, AIAA member; email [email protected]
1 of 17
American Institute of Aeronautics and Astronautics
51st AIAA Aerospace Sciences Meeting including the New Horizons Forum and Aerospace Exposition07 - 10 January 2013, Grapevine (Dallas/Ft. Worth Region), Texas
AIAA 2013-0786
Copyright © 2013 by Dimitri Mavriplis. Published by the American Institute of Aeronautics and Astronautics, Inc., with permission.
Dow
nloa
ded
by D
imitr
i Mav
ripl
is o
n Ja
nuar
y 15
, 201
3 | h
ttp://
arc.
aiaa
.org
| D
OI:
10.
2514
/6.2
013-
786
including identifying gaps in existing aeroelastic databases, identifying errors and uncertainties in compu-tational methods, and providing a roadmap for future research. Overall, 17 analysis teams from 10 nationsprovided a total of 26 analysis datasets. This paper describes the results of one of those analysis teams usingthe NSU3D ow solver applied to all three test cases.
The NSU3D code has been a participant in all �ve DPW workshops since 2001,5{8 as well as the �rstHigh-Lift prediction workshop held in 2010.9 NSU3D has also been involved in various DPW follow-on stud-ies, including comparisons with other solvers,6 sensitivity studies, and extensive grid re�nement studies.10
NSU3D also is currently used as a near-body unstructured mesh solver component within the HELIOS com-prehensive rotorcraft simulation software, where it is used for the simulation of time-dependent aerodynamicand aeroelastic rotorcraft relevant problems.11
The NSU3D solver is described brie y in the next section along with the other software componentsrequired for aeroelastic simulations such as mesh deformation and available structural models. In the subse-quent sections, each AePW test case is �rst described, followed by the results obtained using the aforemen-tioned software. The �nal section provides a summary an outlook of future work.
II. Solver Description
The NSU3D code is an unstructured mesh multigrid Reynolds-averaged Navier-Stokes (RANS) solverfor high-Reynolds number external aerodynamic applications. The NSU3D discretization employs a vertex-based approach, where the unknown uid and turbulence variables are stored at the vertices of the mesh,and uxes are computed on faces delimiting dual control volumes, with each dual face being associated witha mesh edge. This discretization operates on hybrid mixed-element meshes, generally employing prismaticelements in highly stretched boundary layer regions, and tetrahedral elements in isotropic regions of themesh away from the aircraft surfaces. A single edge-based data-structure is used to compute ux balancesacross all types of elements. The convective terms are discretized as central di�erences with added matrixdissipation. Second-order accuracy is achieved by formulating these dissipative terms as an undivided bi-harmonic operator, which is constructed in two passes of a nearest-neighbor Laplacian operator. In the matrixform, this dissipation is similar to that produced by a Riemann solver gradient-based reconstruction scheme,and is obtained by replacing the di�erence in the reconstructed states on each side of the control volumeinterface by the undivided di�erences along mesh edges resulting from the biharmonic operator construction.These di�erences are then multiplied by the characteristic matrix to obtain the �nal dissipation terms. ARoe upwind scheme using least-squares gradient reconstruction is also available in the NSU3D solver.
The baseline NSU3D discretization employs a �nite-di�erence scheme to approximate the thin-layer formof the viscous terms for the Navier-Stokes equations, although this is done in a multidimensional fashion, bycomputing a Laplacian of the velocity �eld.12 The main approximation in this approach is the omission of thecross-derivative viscous terms, and the assumption of a locally constant viscosity. The discretization of thefull Navier-Stokes terms based on a hybrid gradient-of-gradient approach is also available, where the secondderivatives in the directions aligned with the incident mesh edges are computed using a nearest-neighborstencil.
NSU3D incorporates the single equation Spalart-Allmaras turbulence model,13 as well as a standard k�!two-equation turbulence model,14 and the two-equation shear-stress transport (SST) model due to Menter.15
For the workshop simulations, the Spalart-Allmaras turbulence model was used exclusively.Various temporal discretizations are incorporated, including �rst, second and third-order backwards
Euler discretizations (BDF1, BDF2, BDF3) and a suite of diagonally implicit Runge-Kutta schemes. Forthe purposes of the AePW workshop calculations, the BDF2 scheme was used exclusively.
Grid speed terms are implemented in order to handle dynamically deforming mesh cases. These areformulated as control-volume face-integrated values constructed from di�erences in grid coordinates at suc-cessive time instances. The particular formulation satis�es the geometric conservation law exactly for allimplemented time-stepping schemes, thus guaranteeing discrete conservation for dynamic mesh simulations.16
The non-linear system arising at each implicit time step is solved iteratively using a non-linear line-preconditioned agglomeration multigrid algorithm. This solver is formed by invoking the non-linear steady-state multigrid solver in a dual pseudo-time stepping mode. Coarse multigrid levels are formed using a graphalgorithm in a preprocessing stage, and an implicit line solver is used in regions of high mesh stretching (i.e.boundary layer regions) on each multigrid level for faster convergence. A linear line-implicit multigridalgorithm is also available and can be used to solve the linear system within each step in a Newton method
2 of 17
American Institute of Aeronautics and Astronautics
Dow
nloa
ded
by D
imitr
i Mav
ripl
is o
n Ja
nuar
y 15
, 201
3 | h
ttp://
arc.
aiaa
.org
| D
OI:
10.
2514
/6.2
013-
786
applied to the non-linear system arising at each implicit time step.More recently, NSU3D has been extended for use in coupled aeroelastic calculations. In reference,17 a
structural analysis modal model was implemented in conjunction with the NSU3D solver and used to solvethe AGARD 445.6 aeroelastic test case.18 In addition to the implementation of the modal model, a highlyscalable Euler-Bernoulli slender beam model suitable for large aspect ratio structures (e.g. transport aircraftwing, helicopter rotor blades) has been developed and coupled with NSU3D. Computations using this beamstructural model have been documented in references.19{21
Considerable work has focused on the development of a robust and e�cient mesh deformation tech-nique.17,22 The developed approach is based on a linear elasticity model with optimally prescribed meshsti�ness for added robustness. The mesh deformation equations are solved using a line-implicit multigridalgorithm similar to the solver used in the CFD code, resulting in good scalability and rapid convergence ofthe mesh motion equations.
III. Rectangular Supercritical Wing Test Case
1. Test Case Description
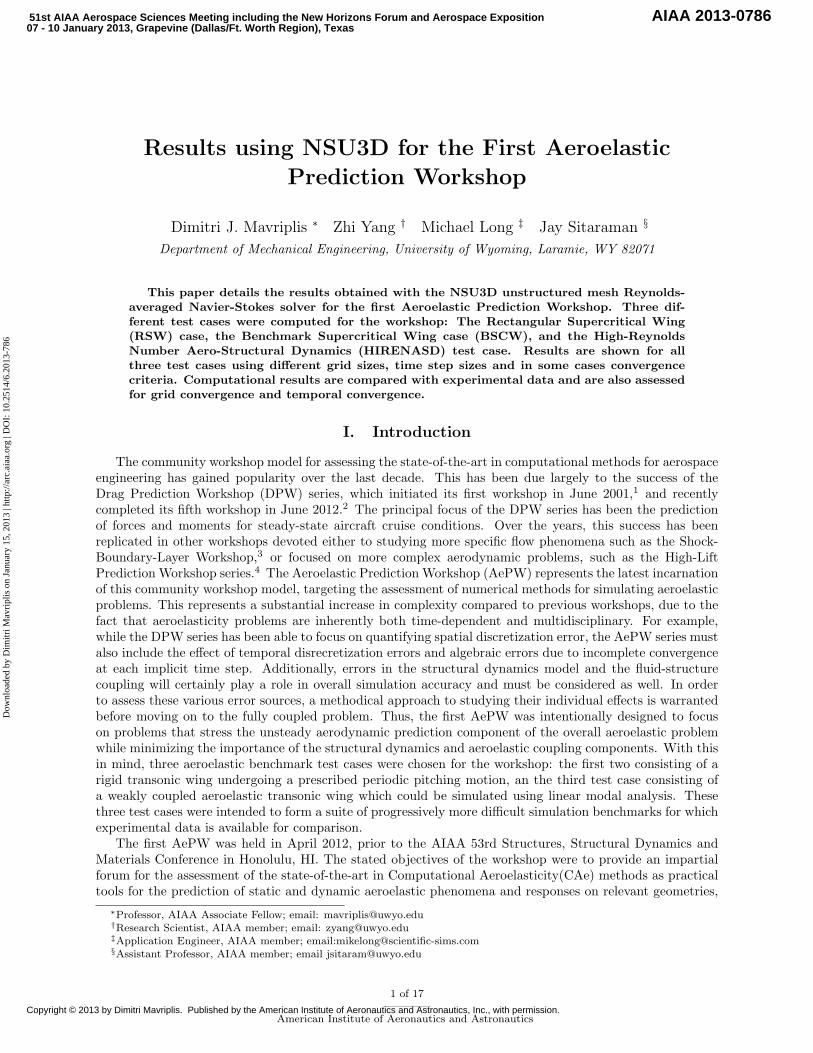
The Rectangular Supercritical Wing (RSW) is a rigid unswept wing of aspect ratio 2 that was tested in theTransonic Dynamics Tunnel (TDT) at NASA Langley in 1983.23 The wing root was mounted on a turntablelocated at the wind tunnel wall in order to enable periodic pitching of the wing about its 45% chord locationas shown in Figure 1(a). Experiments were conducted at pitching frequencies of 0 Hz (i.e. steady), 10 Hzand 20 Hz using heavy gas (R-12) as the test uid medium. Time-dependent pressure measurements weretaken at four span locations (y=b = 0:308; 0:588; 0:809; and 0:951) and were available for comparison withcomputational results. The RSW was conceived as an entry-level unsteady transonic aerodynamic test casesince the geometry and ow conditions were expected to result in relatively benign ow phenomena. In orderto mitigate the e�ects of the wind-tunnel wall boundary layer, the model was mounted on a splitter platewhich provided a 6" o�set from the wind tunnel wall. During the organization of the workshop, preliminarycalculations were performed to assess the impact of the splitter plate.24 It was found that the wind-tunnelwall boundary layer was approximately 12" thick at the model location, and hence the splitter plate wasunintentionally immersed in the boundary layer. Thus the impact of the wind-tunnel wall boundary layercould not be neglected, making this test case considerably more di�cult than intended. However, it wasalso determined that modeling the test geometry as a simple wing extruded to the wall (an additional 6"span) in the absence of the splitter plate produced nearly identical results to modeling the considerably morecomplex complete wing, splitter-plate, wind-tunnel wall con�guration. Thus the simulations performed inthis work employed a 55" span wing attached perpendicularly to a no-slip wall. One di�culty with thiscon�guration is that the no-slip wall could no longer be moved as the wing is pitched, as would be the caseif the entire grid were pitched as a solid body. Thus, a circular patch on the wind tunnel wall was de�nedand enforced to rotate with the pitching wing, while the remaining portion of the wall was held �xed, asshown in Figure 1(b). The computational mesh was then deformed as required during the pitching motionby allowing a small mesh transition region between the moving patch boundary and �xed wind tunnel wallregion. While this setup is inexact, (for example it induces wall velocities on the rotating patch as shown inFigure 1(c)) it represents an approximation to the wind-tunnel wall turntable used to pitch the wing.
2. Computational Results
All simulations were performed using a ratio of speci�c heats ( = 1:132) representative of R-12 heavy gas.It should be noted that this change in from the nominal value for air of 1.4 has a signi�cant e�ect on theresults, for example producing changes of the order of 5% to 10% in CL values at the nominal steady statetransonic conditions. Both steady and time dependent simulations were performed. For all cases, the Machnumber was 0.825 and the Reynolds number was 4.01 million, while the two steady-state cases used angles ofattack of 2o and 4o, and the two time-dependent cases used the same mean incidence of 2o but two di�erentpitching frequencies of 10Hz and 20Hz with an amplitude of 1o.
Three di�erent meshes were used for these cases, a coarse, medium and �ne mesh, containing 2,878,627,7,072,791, and 18,277,610 mesh points, respectively. These meshes correspond to the 55 inch wing spangeometry, where the wing was extended to the wind-tunnel wall in the absence of the splitter plate. Theyare all self-similar hybrid prismatic-tetrahedral unstructured meshes generated using SOLID MESH, sup-
3 of 17
American Institute of Aeronautics and Astronautics
Dow
nloa
ded
by D
imitr
i Mav
ripl
is o
n Ja
nuar
y 15
, 201
3 | h
ttp://
arc.
aiaa
.org
| D
OI:
10.
2514
/6.2
013-
786
(a) Geometry de�nition (b) Coarse mesh (c) Surface velocities
Figure 1. Rectangular Supercritical Wing (RSW) geometry de�nition (a) and grid patching system (b) withinduced surface velocities from pitching motion (c).
plied by the workshop organizing committee and labeled rsw coarse mixed nc, rsw medium mixed nc, andrsw �ne mixed nc, respectively. While all three meshes were used for the steady-state cases, only the coarseand medium meshes were used for the time-dependent cases, due to resource constraints.
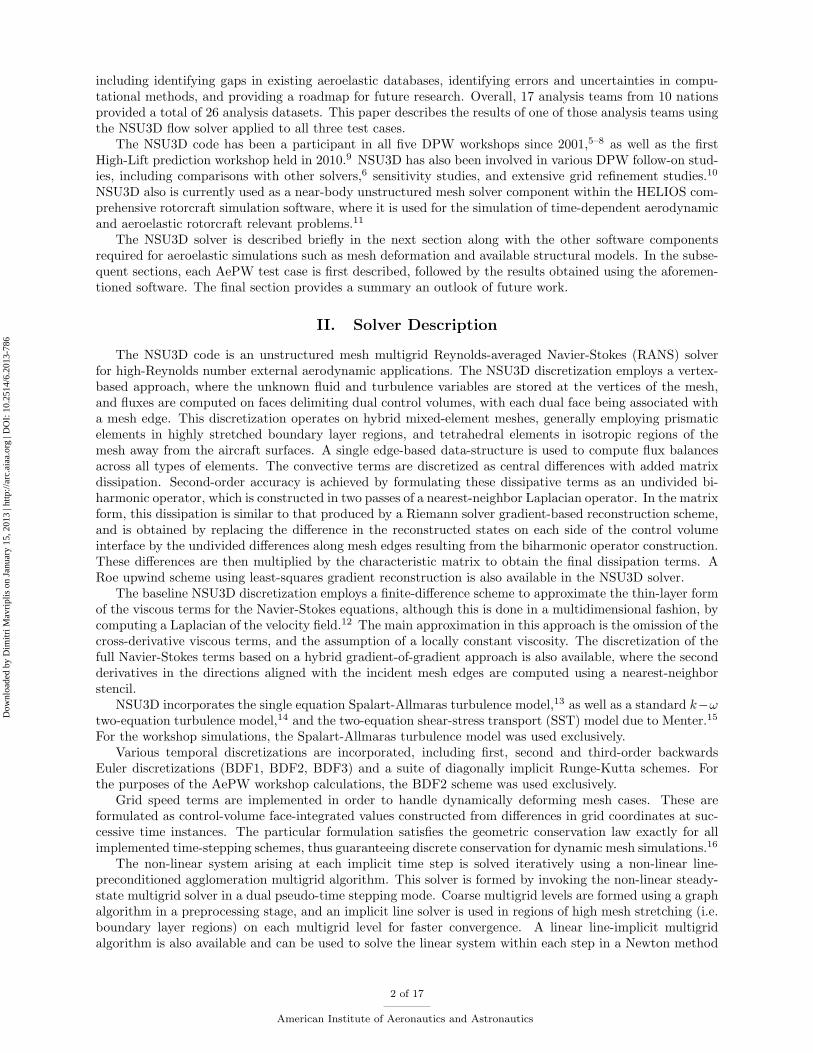
Figure 2. Grid Convergence for steady-state RSW test cases
.
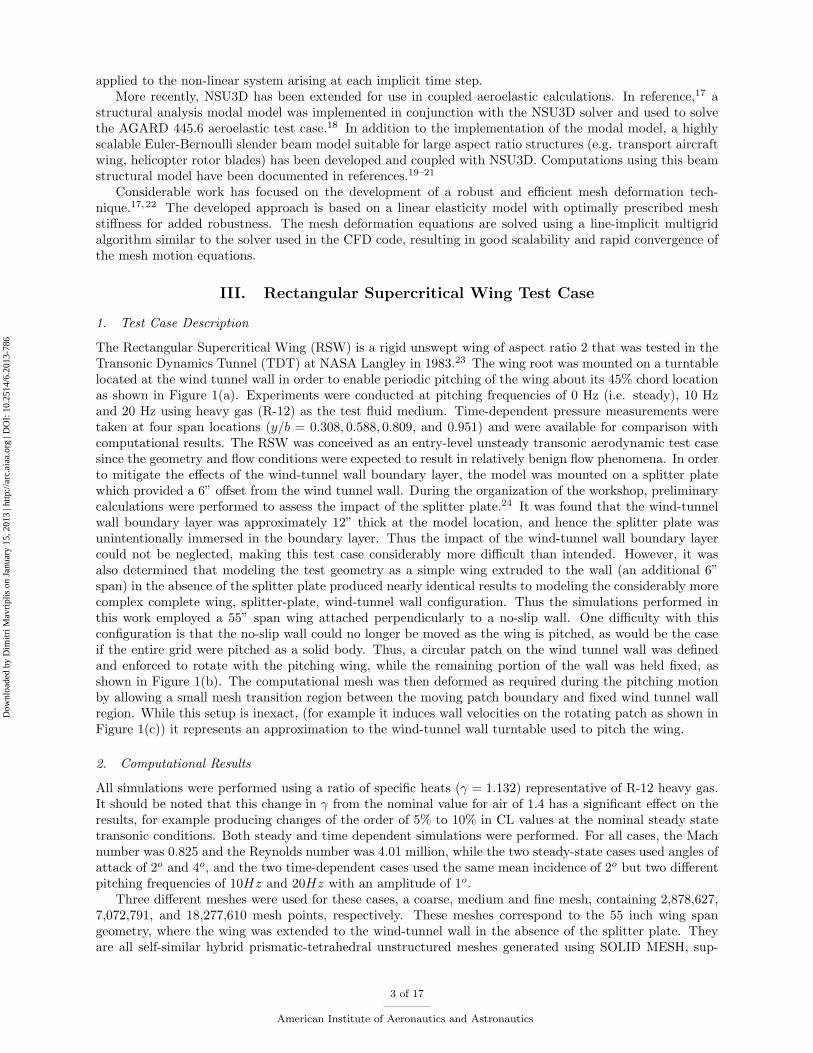
(a) Incidence=2o, y/b=0.309 (b) Incidence=2o, y/b=0.951 (c) Incidence=4o, y/b=0.309 (d) Incidence=4o, y/b=0.951
Figure 3. Comparison of computed and experimental steady surface pressures for RSW case.
Figure 2 depicts the grid convergence of lift, drag and pitching moment for both steady-state casesshowing reasonable grid convergence, although the CL value for the 4o angle of attack case appears to bedropping more rapidly between the medium and �ne grids. Figures 3 illustrate the steady wing surfacepressure distributions at the four span stations. The most notable aspect of these results is the discrepancyin the computed versus experimental shock location at the inboard station which vanishes at the outboardstation. This was noted in the collective workshop results and is attributed to the e�ect of the wind-tunnelwall boundary layer. However, a measurement of the wall boundary layer produced by NSU3D at the samedownstream location as the model is in agreement with that predicted by other codes and experimentally.A possible explanation may be interference e�ects between the wing aerodynamics and the wall velocities
4 of 17
American Institute of Aeronautics and Astronautics
Dow
nloa
ded
by D
imitr
i Mav
ripl
is o
n Ja
nuar
y 15
, 201
3 | h
ttp://
arc.
aiaa
.org
| D
OI:
10.
2514
/6.2
013-
786
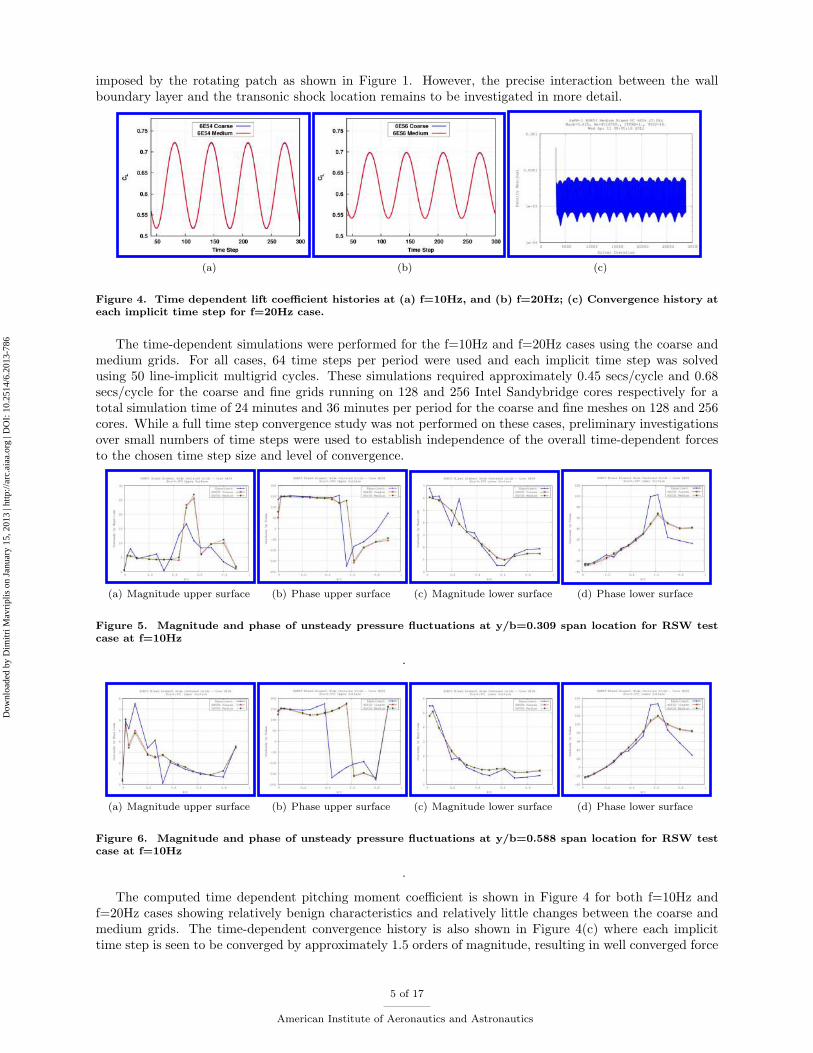
imposed by the rotating patch as shown in Figure 1. However, the precise interaction between the wallboundary layer and the transonic shock location remains to be investigated in more detail.
(a) (b) (c)
Figure 4. Time dependent lift coe�cient histories at (a) f=10Hz, and (b) f=20Hz; (c) Convergence history ateach implicit time step for f=20Hz case.
The time-dependent simulations were performed for the f=10Hz and f=20Hz cases using the coarse andmedium grids. For all cases, 64 time steps per period were used and each implicit time step was solvedusing 50 line-implicit multigrid cycles. These simulations required approximately 0.45 secs/cycle and 0.68secs/cycle for the coarse and �ne grids running on 128 and 256 Intel Sandybridge cores respectively for atotal simulation time of 24 minutes and 36 minutes per period for the coarse and �ne meshes on 128 and 256cores. While a full time step convergence study was not performed on these cases, preliminary investigationsover small numbers of time steps were used to establish independence of the overall time-dependent forcesto the chosen time step size and level of convergence.
(a) Magnitude upper surface (b) Phase upper surface (c) Magnitude lower surface (d) Phase lower surface
Figure 5. Magnitude and phase of unsteady pressure uctuations at y/b=0.309 span location for RSW testcase at f=10Hz
.
(a) Magnitude upper surface (b) Phase upper surface (c) Magnitude lower surface (d) Phase lower surface
Figure 6. Magnitude and phase of unsteady pressure uctuations at y/b=0.588 span location for RSW testcase at f=10Hz
.
The computed time dependent pitching moment coe�cient is shown in Figure 4 for both f=10Hz andf=20Hz cases showing relatively benign characteristics and relatively little changes between the coarse andmedium grids. The time-dependent convergence history is also shown in Figure 4(c) where each implicittime step is seen to be converged by approximately 1.5 orders of magnitude, resulting in well converged force
5 of 17
American Institute of Aeronautics and Astronautics
Dow
nloa
ded
by D
imitr
i Mav
ripl
is o
n Ja
nuar
y 15
, 201
3 | h
ttp://
arc.
aiaa
.org
| D
OI:
10.
2514
/6.2
013-
786
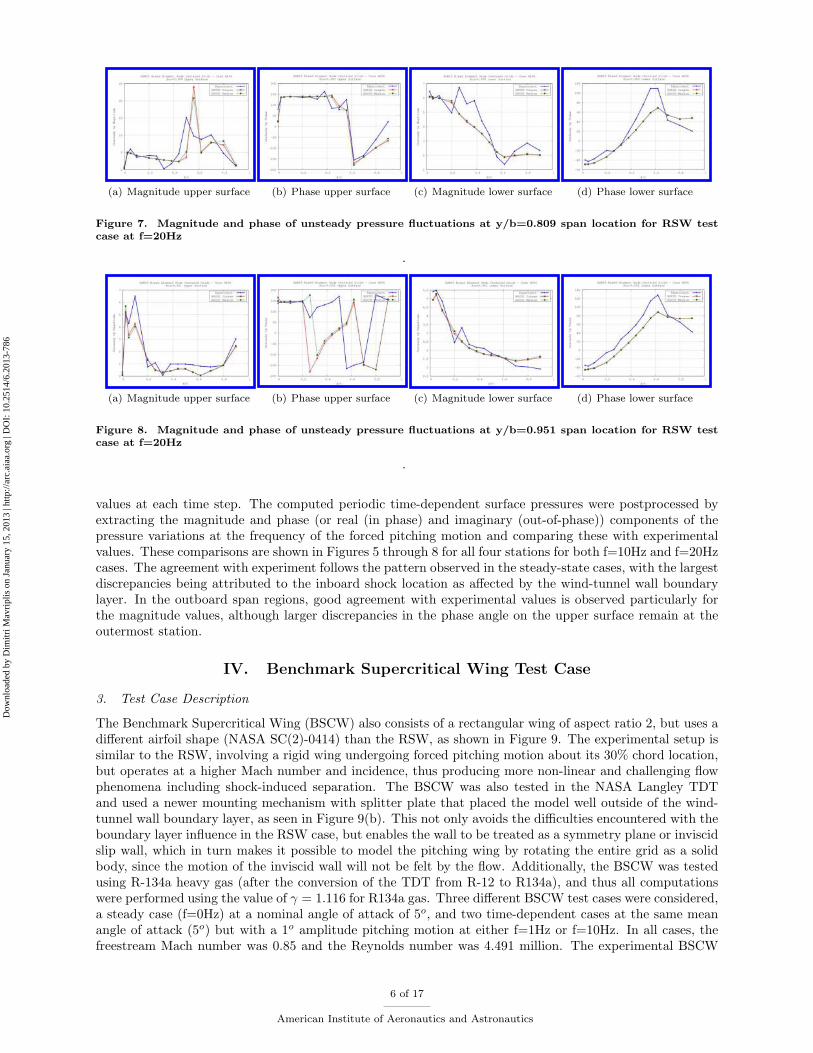
(a) Magnitude upper surface (b) Phase upper surface (c) Magnitude lower surface (d) Phase lower surface
Figure 7. Magnitude and phase of unsteady pressure uctuations at y/b=0.809 span location for RSW testcase at f=20Hz
.
(a) Magnitude upper surface (b) Phase upper surface (c) Magnitude lower surface (d) Phase lower surface
Figure 8. Magnitude and phase of unsteady pressure uctuations at y/b=0.951 span location for RSW testcase at f=20Hz
.
values at each time step. The computed periodic time-dependent surface pressures were postprocessed byextracting the magnitude and phase (or real (in phase) and imaginary (out-of-phase)) components of thepressure variations at the frequency of the forced pitching motion and comparing these with experimentalvalues. These comparisons are shown in Figures 5 through 8 for all four stations for both f=10Hz and f=20Hzcases. The agreement with experiment follows the pattern observed in the steady-state cases, with the largestdiscrepancies being attributed to the inboard shock location as a�ected by the wind-tunnel wall boundarylayer. In the outboard span regions, good agreement with experimental values is observed particularly forthe magnitude values, although larger discrepancies in the phase angle on the upper surface remain at theoutermost station.
IV. Benchmark Supercritical Wing Test Case
3. Test Case Description
The Benchmark Supercritical Wing (BSCW) also consists of a rectangular wing of aspect ratio 2, but uses adi�erent airfoil shape (NASA SC(2)-0414) than the RSW, as shown in Figure 9. The experimental setup issimilar to the RSW, involving a rigid wing undergoing forced pitching motion about its 30% chord location,but operates at a higher Mach number and incidence, thus producing more non-linear and challenging owphenomena including shock-induced separation. The BSCW was also tested in the NASA Langley TDTand used a newer mounting mechanism with splitter plate that placed the model well outside of the wind-tunnel wall boundary layer, as seen in Figure 9(b). This not only avoids the di�culties encountered with theboundary layer in uence in the RSW case, but enables the wall to be treated as a symmetry plane or inviscidslip wall, which in turn makes it possible to model the pitching wing by rotating the entire grid as a solidbody, since the motion of the inviscid wall will not be felt by the ow. Additionally, the BSCW was testedusing R-134a heavy gas (after the conversion of the TDT from R-12 to R134a), and thus all computationswere performed using the value of = 1:116 for R134a gas. Three di�erent BSCW test cases were considered,a steady case (f=0Hz) at a nominal angle of attack of 5o, and two time-dependent cases at the same meanangle of attack (5o) but with a 1o amplitude pitching motion at either f=1Hz or f=10Hz. In all cases, thefreestream Mach number was 0.85 and the Reynolds number was 4.491 million. The experimental BSCW
6 of 17
American Institute of Aeronautics and Astronautics
Dow
nloa
ded
by D
imitr
i Mav
ripl
is o
n Ja
nuar
y 15
, 201
3 | h
ttp://
arc.
aiaa
.org
| D
OI:
10.
2514
/6.2
013-
786

data set contains only a single row of pressure measurements located at the 60% span location.
(a) (b)
Figure 9. Benchmark Supercritical Wing (BSCW) geometry de�nition
4. Computational Results
All cases for the BSCW were run using two meshes, namely the coarse and medium resolution unstructuredhybrid (prismatic-tetrahedral) meshes supplied by the workshop organizing committee labeled bscw coarse mixed ncand bscw medium mixed nc. These meshes were generated using the VGRID software package and con-structed as a family of self-similar meshes suitable for a grid convergence study and contained 2,968,550 and9,005,346 points respectively. Convergence histories for the steady-state case (Mach=0.85, Incidence = 5o)on both grids are shown in Figure 10. Although the coarse mesh converges robustly, the medium mesh failsto converge fully to a steady result with small oscillations remaining in the force histories. Subsequently, themedium mesh case was rerun in time dependent mode and still failed to produce a steady result for a rangeof time step sizes. This behavior is attributed to the onset of unsteady ow phenomena for the BSCW atthese conditions. Interestingly, this behavior persists in the low frequency (f=1Hz) time-dependent periodicpitching case but disappears for the higher frequency (f=10Hz) pitching case as will be seen in the descriptionof these cases below.
For the two time-dependent forced pitching cases, both the coarse and medium meshes were run in orderto provide a rudimentary grid convergence study. In addition, a range of time step sizes were used and anumber of di�erent sub-iterations per time step were employed in order to study the e�ect of temporal errorand algebraic (incomplete convergence) error on the computed results.
(a) Coarse mesh (b) Coarse and �ne mesh CL (c) Coarse and �ne mesh CM
Figure 10. Steady-state convergence histories for coarse and medium meshes for BSCW test case.
Figure 11 depicts the force coe�cient time histories computed for the f=1Hz case using 180, 360 and720 time steps per period, with 20 or 50 multigrid sub-iterations per time step on the coarse grid, and using720 time steps per period with 50 multigrid subiterations per time step on the medium grid. Although thelift coe�cient time history shows only minor variations with time-step, subiteration and mesh size, the dragcoe�cient shows appreciable variations, and the pitching moment coe�cient histories show larger di�erences
7 of 17
American Institute of Aeronautics and Astronautics
Dow
nloa
ded
by D
imitr
i Mav
ripl
is o
n Ja
nuar
y 15
, 201
3 | h
ttp://
arc.
aiaa
.org
| D
OI:
10.
2514
/6.2
013-
786
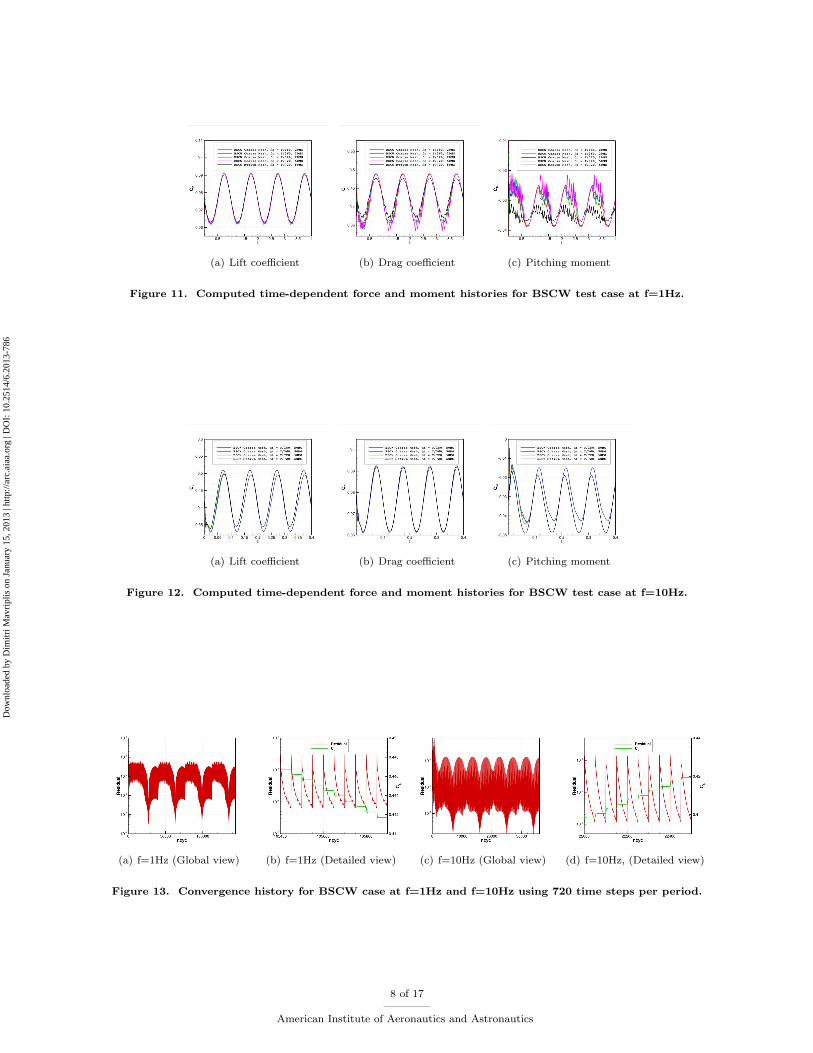
(a) Lift coe�cient (b) Drag coe�cient (c) Pitching moment
Figure 11. Computed time-dependent force and moment histories for BSCW test case at f=1Hz.
(a) Lift coe�cient (b) Drag coe�cient (c) Pitching moment
Figure 12. Computed time-dependent force and moment histories for BSCW test case at f=10Hz.
(a) f=1Hz (Global view) (b) f=1Hz (Detailed view) (c) f=10Hz (Global view) (d) f=10Hz, (Detailed view)
Figure 13. Convergence history for BSCW case at f=1Hz and f=10Hz using 720 time steps per period.
8 of 17
American Institute of Aeronautics and Astronautics
Dow
nloa
ded
by D
imitr
i Mav
ripl
is o
n Ja
nuar
y 15
, 201
3 | h
ttp://
arc.
aiaa
.org
| D
OI:
10.
2514
/6.2
013-
786
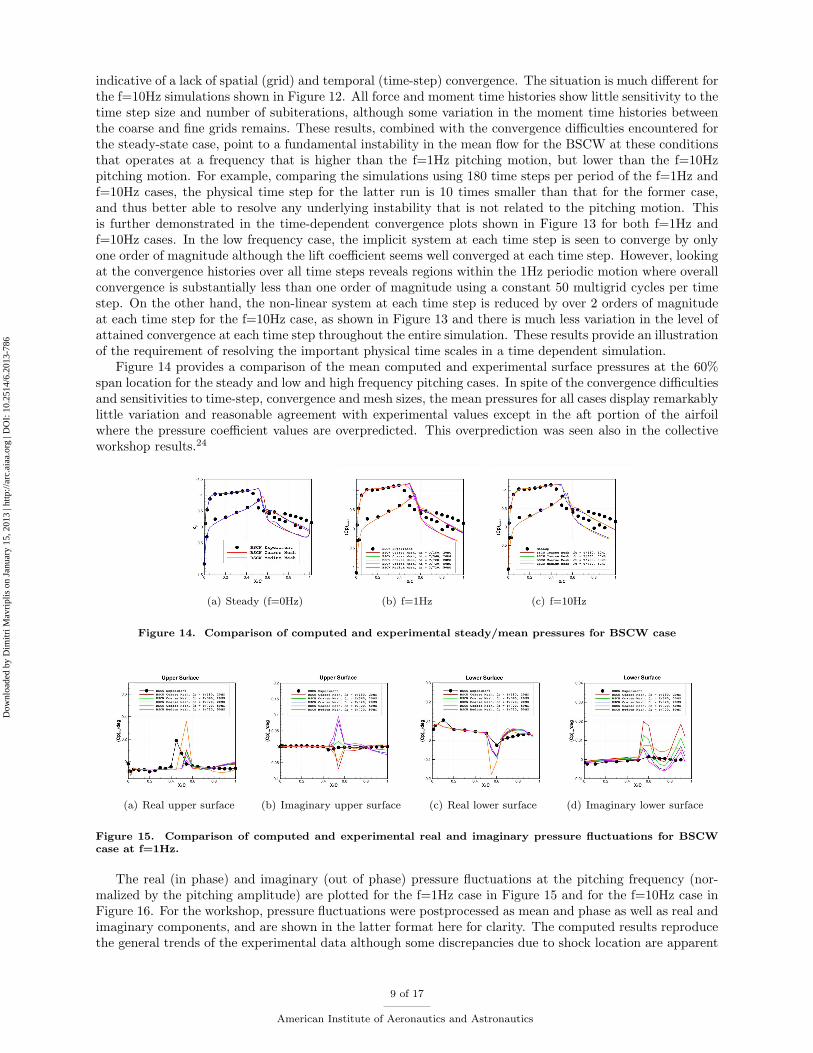
indicative of a lack of spatial (grid) and temporal (time-step) convergence. The situation is much di�erent forthe f=10Hz simulations shown in Figure 12. All force and moment time histories show little sensitivity to thetime step size and number of subiterations, although some variation in the moment time histories betweenthe coarse and �ne grids remains. These results, combined with the convergence di�culties encountered forthe steady-state case, point to a fundamental instability in the mean ow for the BSCW at these conditionsthat operates at a frequency that is higher than the f=1Hz pitching motion, but lower than the f=10Hzpitching motion. For example, comparing the simulations using 180 time steps per period of the f=1Hz andf=10Hz cases, the physical time step for the latter run is 10 times smaller than that for the former case,and thus better able to resolve any underlying instability that is not related to the pitching motion. Thisis further demonstrated in the time-dependent convergence plots shown in Figure 13 for both f=1Hz andf=10Hz cases. In the low frequency case, the implicit system at each time step is seen to converge by onlyone order of magnitude although the lift coe�cient seems well converged at each time step. However, lookingat the convergence histories over all time steps reveals regions within the 1Hz periodic motion where overallconvergence is substantially less than one order of magnitude using a constant 50 multigrid cycles per timestep. On the other hand, the non-linear system at each time step is reduced by over 2 orders of magnitudeat each time step for the f=10Hz case, as shown in Figure 13 and there is much less variation in the level ofattained convergence at each time step throughout the entire simulation. These results provide an illustrationof the requirement of resolving the important physical time scales in a time dependent simulation.
Figure 14 provides a comparison of the mean computed and experimental surface pressures at the 60%span location for the steady and low and high frequency pitching cases. In spite of the convergence di�cultiesand sensitivities to time-step, convergence and mesh sizes, the mean pressures for all cases display remarkablylittle variation and reasonable agreement with experimental values except in the aft portion of the airfoilwhere the pressure coe�cient values are overpredicted. This overprediction was seen also in the collectiveworkshop results.24
(a) Steady (f=0Hz) (b) f=1Hz (c) f=10Hz
Figure 14. Comparison of computed and experimental steady/mean pressures for BSCW case
(a) Real upper surface (b) Imaginary upper surface (c) Real lower surface (d) Imaginary lower surface
Figure 15. Comparison of computed and experimental real and imaginary pressure uctuations for BSCWcase at f=1Hz.
The real (in phase) and imaginary (out of phase) pressure uctuations at the pitching frequency (nor-malized by the pitching amplitude) are plotted for the f=1Hz case in Figure 15 and for the f=10Hz case inFigure 16. For the workshop, pressure uctuations were postprocessed as mean and phase as well as real andimaginary components, and are shown in the latter format here for clarity. The computed results reproducethe general trends of the experimental data although some discrepancies due to shock location are apparent
9 of 17
American Institute of Aeronautics and Astronautics
Dow
nloa
ded
by D
imitr
i Mav
ripl
is o
n Ja
nuar
y 15
, 201
3 | h
ttp://
arc.
aiaa
.org
| D
OI:
10.
2514
/6.2
013-
786
(a) Real upper surface (b) Imaginary upper surface (c) Real lower surface (d) Imaginary lower surface
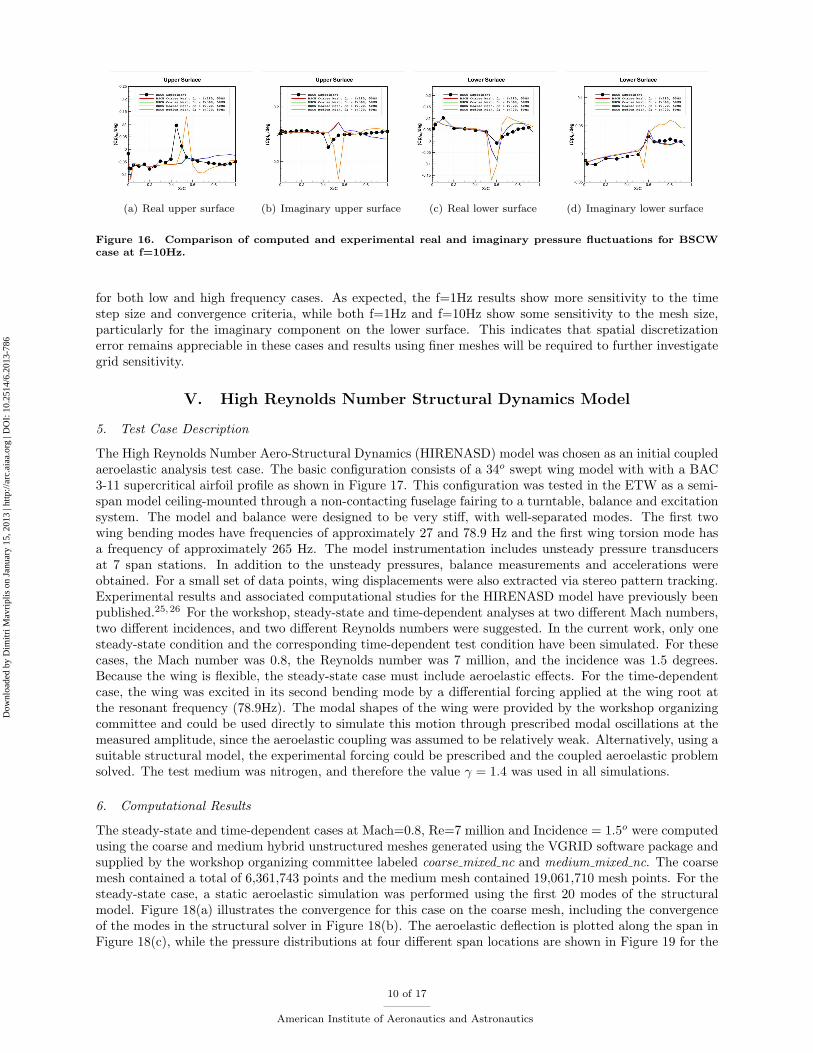
Figure 16. Comparison of computed and experimental real and imaginary pressure uctuations for BSCWcase at f=10Hz.
for both low and high frequency cases. As expected, the f=1Hz results show more sensitivity to the timestep size and convergence criteria, while both f=1Hz and f=10Hz show some sensitivity to the mesh size,particularly for the imaginary component on the lower surface. This indicates that spatial discretizationerror remains appreciable in these cases and results using �ner meshes will be required to further investigategrid sensitivity.
V. High Reynolds Number Structural Dynamics Model
5. Test Case Description
The High Reynolds Number Aero-Structural Dynamics (HIRENASD) model was chosen as an initial coupledaeroelastic analysis test case. The basic con�guration consists of a 34o swept wing model with with a BAC3-11 supercritical airfoil pro�le as shown in Figure 17. This con�guration was tested in the ETW as a semi-span model ceiling-mounted through a non-contacting fuselage fairing to a turntable, balance and excitationsystem. The model and balance were designed to be very sti�, with well-separated modes. The �rst twowing bending modes have frequencies of approximately 27 and 78.9 Hz and the �rst wing torsion mode hasa frequency of approximately 265 Hz. The model instrumentation includes unsteady pressure transducersat 7 span stations. In addition to the unsteady pressures, balance measurements and accelerations wereobtained. For a small set of data points, wing displacements were also extracted via stereo pattern tracking.Experimental results and associated computational studies for the HIRENASD model have previously beenpublished.25,26 For the workshop, steady-state and time-dependent analyses at two di�erent Mach numbers,two di�erent incidences, and two di�erent Reynolds numbers were suggested. In the current work, only onesteady-state condition and the corresponding time-dependent test condition have been simulated. For thesecases, the Mach number was 0.8, the Reynolds number was 7 million, and the incidence was 1.5 degrees.Because the wing is exible, the steady-state case must include aeroelastic e�ects. For the time-dependentcase, the wing was excited in its second bending mode by a di�erential forcing applied at the wing root atthe resonant frequency (78.9Hz). The modal shapes of the wing were provided by the workshop organizingcommittee and could be used directly to simulate this motion through prescribed modal oscillations at themeasured amplitude, since the aeroelastic coupling was assumed to be relatively weak. Alternatively, using asuitable structural model, the experimental forcing could be prescribed and the coupled aeroelastic problemsolved. The test medium was nitrogen, and therefore the value = 1:4 was used in all simulations.
6. Computational Results
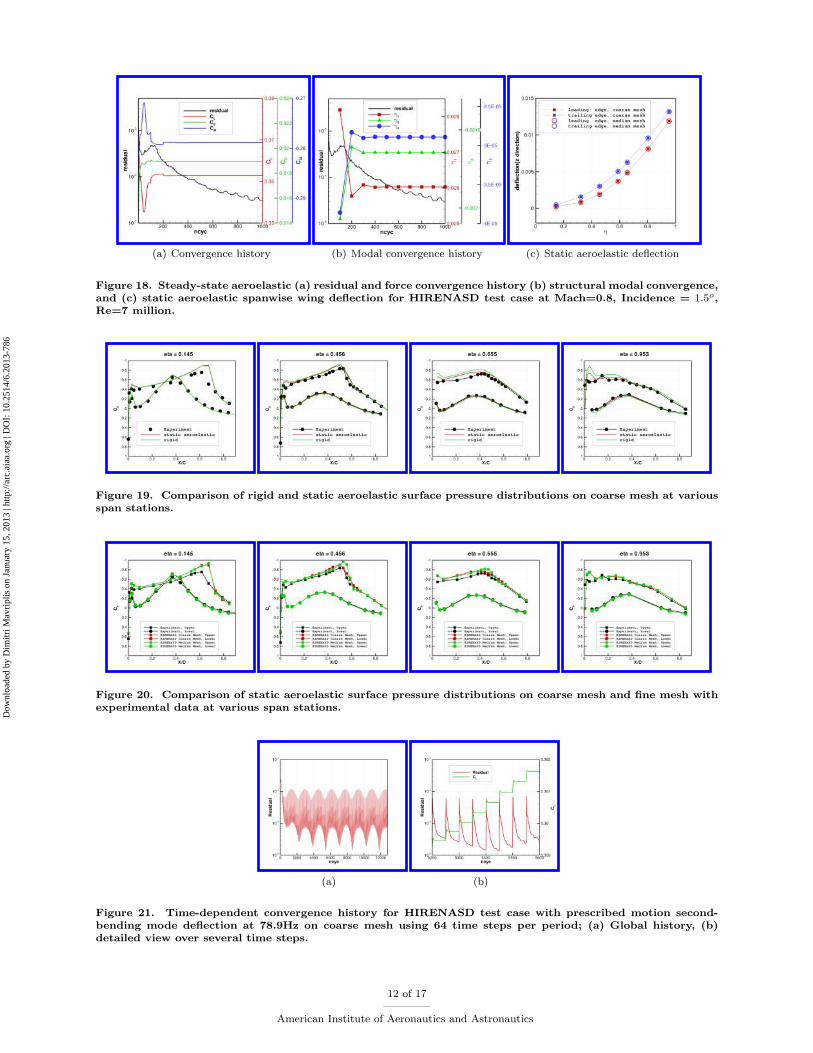
The steady-state and time-dependent cases at Mach=0.8, Re=7 million and Incidence = 1:5o were computedusing the coarse and medium hybrid unstructured meshes generated using the VGRID software package andsupplied by the workshop organizing committee labeled coarse mixed nc and medium mixed nc. The coarsemesh contained a total of 6,361,743 points and the medium mesh contained 19,061,710 mesh points. For thesteady-state case, a static aeroelastic simulation was performed using the �rst 20 modes of the structuralmodel. Figure 18(a) illustrates the convergence for this case on the coarse mesh, including the convergenceof the modes in the structural solver in Figure 18(b). The aeroelastic de ection is plotted along the span inFigure 18(c), while the pressure distributions at four di�erent span locations are shown in Figure 19 for the
10 of 17
American Institute of Aeronautics and Astronautics
Dow
nloa
ded
by D
imitr
i Mav
ripl
is o
n Ja
nuar
y 15
, 201
3 | h
ttp://
arc.
aiaa
.org
| D
OI:
10.
2514
/6.2
013-
786
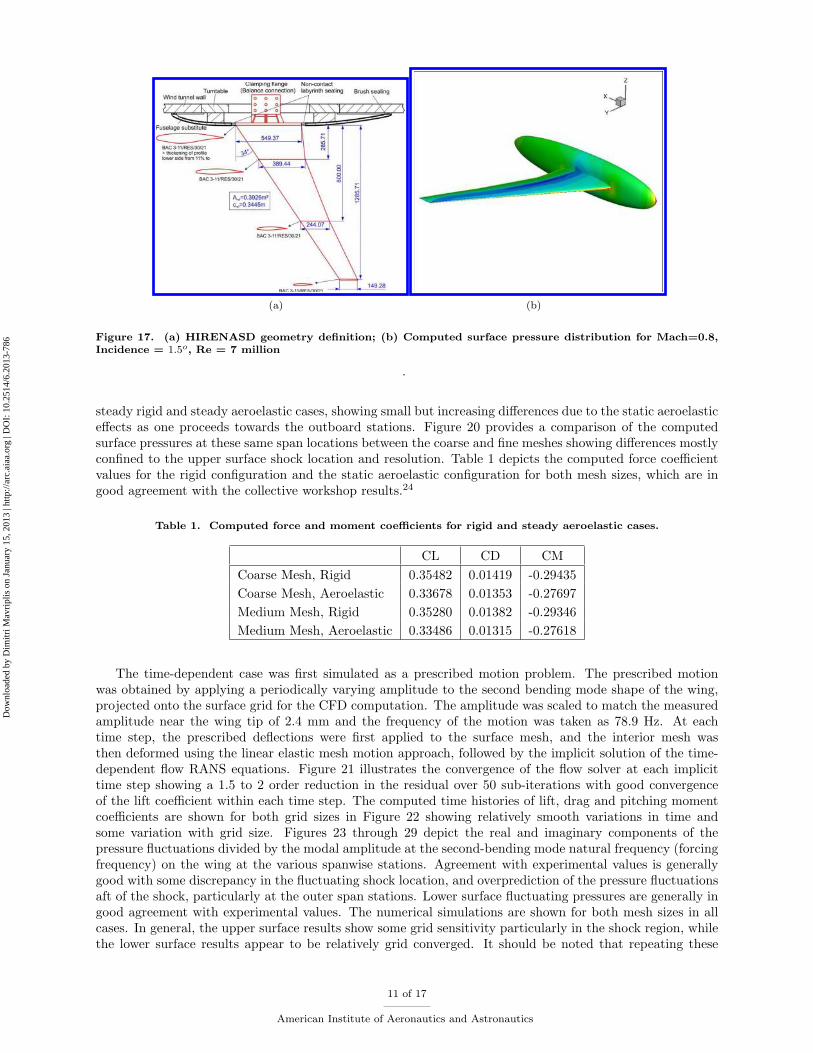
(a) (b)
Figure 17. (a) HIRENASD geometry de�nition; (b) Computed surface pressure distribution for Mach=0.8,Incidence = 1:5o, Re = 7 million
.
steady rigid and steady aeroelastic cases, showing small but increasing di�erences due to the static aeroelastice�ects as one proceeds towards the outboard stations. Figure 20 provides a comparison of the computedsurface pressures at these same span locations between the coarse and �ne meshes showing di�erences mostlycon�ned to the upper surface shock location and resolution. Table 1 depicts the computed force coe�cientvalues for the rigid con�guration and the static aeroelastic con�guration for both mesh sizes, which are ingood agreement with the collective workshop results.24
Table 1. Computed force and moment coe�cients for rigid and steady aeroelastic cases.
CL CD CMCoarse Mesh, Rigid 0.35482 0.01419 -0.29435Coarse Mesh, Aeroelastic 0.33678 0.01353 -0.27697Medium Mesh, Rigid 0.35280 0.01382 -0.29346Medium Mesh, Aeroelastic 0.33486 0.01315 -0.27618
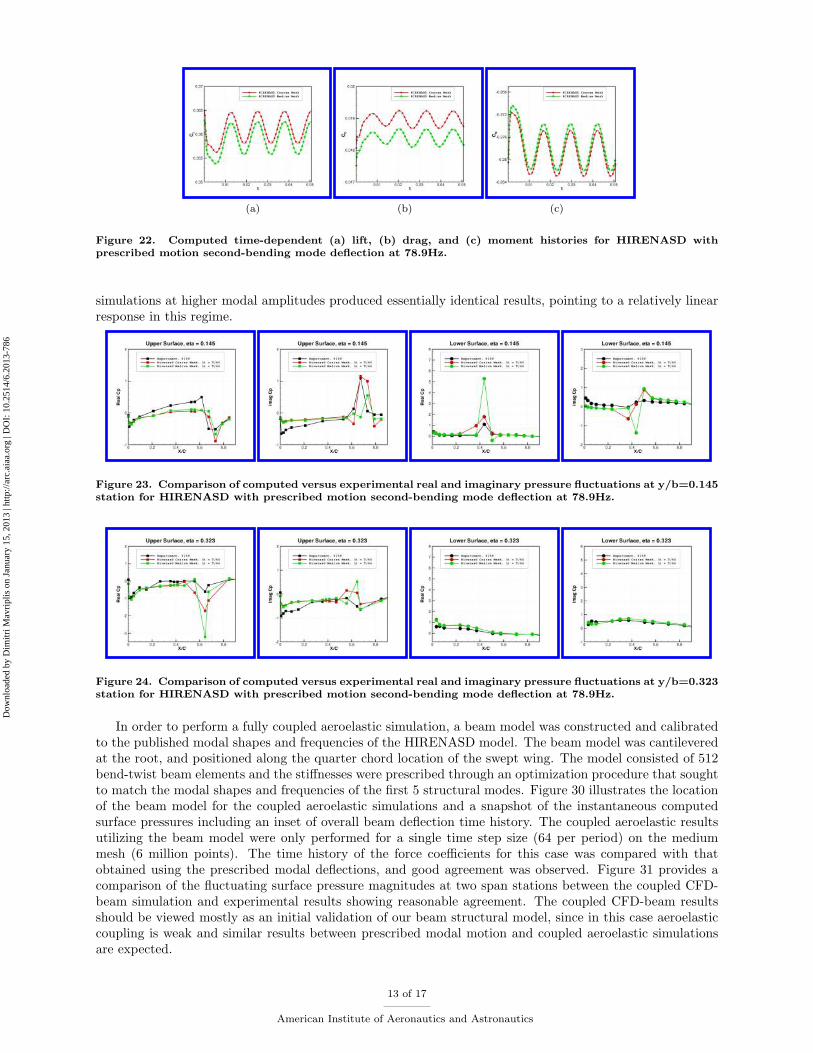
The time-dependent case was �rst simulated as a prescribed motion problem. The prescribed motionwas obtained by applying a periodically varying amplitude to the second bending mode shape of the wing,projected onto the surface grid for the CFD computation. The amplitude was scaled to match the measuredamplitude near the wing tip of 2.4 mm and the frequency of the motion was taken as 78.9 Hz. At eachtime step, the prescribed de ections were �rst applied to the surface mesh, and the interior mesh wasthen deformed using the linear elastic mesh motion approach, followed by the implicit solution of the time-dependent ow RANS equations. Figure 21 illustrates the convergence of the ow solver at each implicittime step showing a 1.5 to 2 order reduction in the residual over 50 sub-iterations with good convergenceof the lift coe�cient within each time step. The computed time histories of lift, drag and pitching momentcoe�cients are shown for both grid sizes in Figure 22 showing relatively smooth variations in time andsome variation with grid size. Figures 23 through 29 depict the real and imaginary components of thepressure uctuations divided by the modal amplitude at the second-bending mode natural frequency (forcingfrequency) on the wing at the various spanwise stations. Agreement with experimental values is generallygood with some discrepancy in the uctuating shock location, and overprediction of the pressure uctuationsaft of the shock, particularly at the outer span stations. Lower surface uctuating pressures are generally ingood agreement with experimental values. The numerical simulations are shown for both mesh sizes in allcases. In general, the upper surface results show some grid sensitivity particularly in the shock region, whilethe lower surface results appear to be relatively grid converged. It should be noted that repeating these
11 of 17
American Institute of Aeronautics and Astronautics
Dow
nloa
ded
by D
imitr
i Mav
ripl
is o
n Ja
nuar
y 15
, 201
3 | h
ttp://
arc.
aiaa
.org
| D
OI:
10.
2514
/6.2
013-
786
(a) Convergence history (b) Modal convergence history (c) Static aeroelastic de ection
Figure 18. Steady-state aeroelastic (a) residual and force convergence history (b) structural modal convergence,and (c) static aeroelastic spanwise wing de ection for HIRENASD test case at Mach=0.8, Incidence = 1:5o,Re=7 million.
Figure 19. Comparison of rigid and static aeroelastic surface pressure distributions on coarse mesh at variousspan stations.
Figure 20. Comparison of static aeroelastic surface pressure distributions on coarse mesh and �ne mesh withexperimental data at various span stations.
(a) (b)
Figure 21. Time-dependent convergence history for HIRENASD test case with prescribed motion second-bending mode de ection at 78.9Hz on coarse mesh using 64 time steps per period; (a) Global history, (b)detailed view over several time steps.
12 of 17
American Institute of Aeronautics and Astronautics
Dow
nloa
ded
by D
imitr
i Mav
ripl
is o
n Ja
nuar
y 15
, 201
3 | h
ttp://
arc.
aiaa
.org
| D
OI:
10.
2514
/6.2
013-
786
(a) (b) (c)
Figure 22. Computed time-dependent (a) lift, (b) drag, and (c) moment histories for HIRENASD withprescribed motion second-bending mode de ection at 78.9Hz.
simulations at higher modal amplitudes produced essentially identical results, pointing to a relatively linearresponse in this regime.
Figure 23. Comparison of computed versus experimental real and imaginary pressure uctuations at y/b=0.145station for HIRENASD with prescribed motion second-bending mode de ection at 78.9Hz.
Figure 24. Comparison of computed versus experimental real and imaginary pressure uctuations at y/b=0.323station for HIRENASD with prescribed motion second-bending mode de ection at 78.9Hz.
In order to perform a fully coupled aeroelastic simulation, a beam model was constructed and calibratedto the published modal shapes and frequencies of the HIRENASD model. The beam model was cantileveredat the root, and positioned along the quarter chord location of the swept wing. The model consisted of 512bend-twist beam elements and the sti�nesses were prescribed through an optimization procedure that soughtto match the modal shapes and frequencies of the �rst 5 structural modes. Figure 30 illustrates the locationof the beam model for the coupled aeroelastic simulations and a snapshot of the instantaneous computedsurface pressures including an inset of overall beam de ection time history. The coupled aeroelastic resultsutilizing the beam model were only performed for a single time step size (64 per period) on the mediummesh (6 million points). The time history of the force coe�cients for this case was compared with thatobtained using the prescribed modal de ections, and good agreement was observed. Figure 31 provides acomparison of the uctuating surface pressure magnitudes at two span stations between the coupled CFD-beam simulation and experimental results showing reasonable agreement. The coupled CFD-beam resultsshould be viewed mostly as an initial validation of our beam structural model, since in this case aeroelasticcoupling is weak and similar results between prescribed modal motion and coupled aeroelastic simulationsare expected.
13 of 17
American Institute of Aeronautics and Astronautics
Dow
nloa
ded
by D
imitr
i Mav
ripl
is o
n Ja
nuar
y 15
, 201
3 | h
ttp://
arc.
aiaa
.org
| D
OI:
10.
2514
/6.2
013-
786
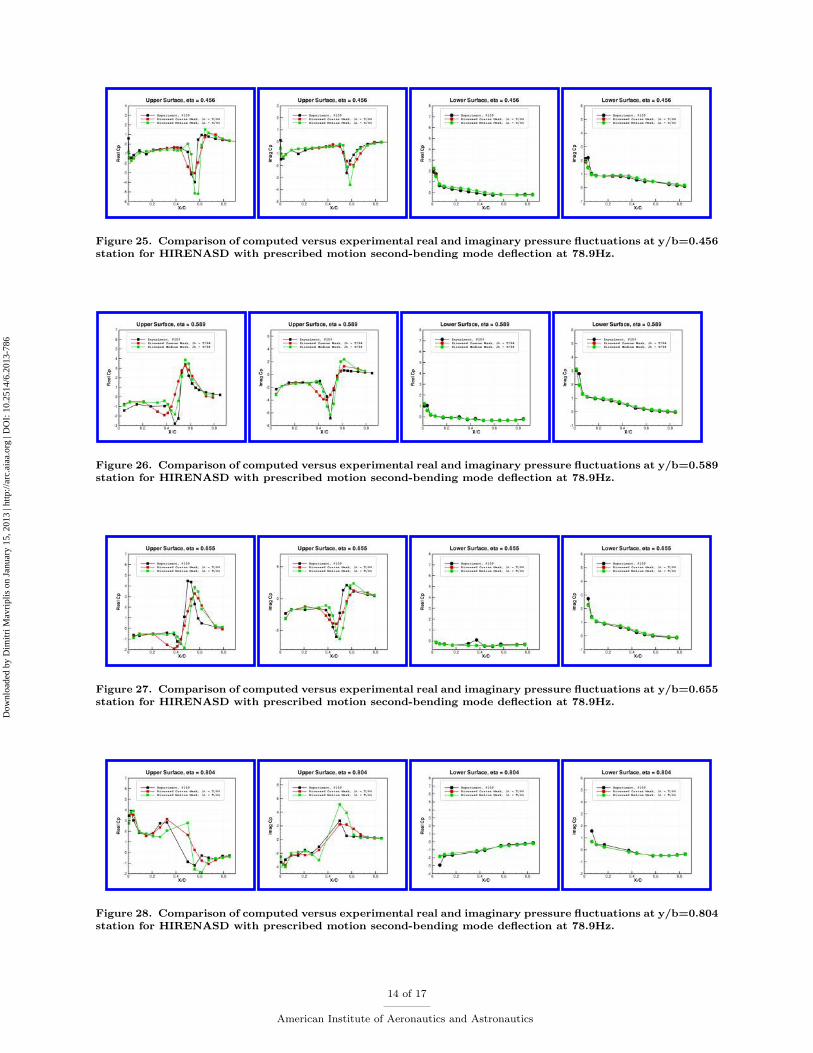
Figure 25. Comparison of computed versus experimental real and imaginary pressure uctuations at y/b=0.456station for HIRENASD with prescribed motion second-bending mode de ection at 78.9Hz.
Figure 26. Comparison of computed versus experimental real and imaginary pressure uctuations at y/b=0.589station for HIRENASD with prescribed motion second-bending mode de ection at 78.9Hz.
Figure 27. Comparison of computed versus experimental real and imaginary pressure uctuations at y/b=0.655station for HIRENASD with prescribed motion second-bending mode de ection at 78.9Hz.
Figure 28. Comparison of computed versus experimental real and imaginary pressure uctuations at y/b=0.804station for HIRENASD with prescribed motion second-bending mode de ection at 78.9Hz.
14 of 17
American Institute of Aeronautics and Astronautics
Dow
nloa
ded
by D
imitr
i Mav
ripl
is o
n Ja
nuar
y 15
, 201
3 | h
ttp://
arc.
aiaa
.org
| D
OI:
10.
2514
/6.2
013-
786
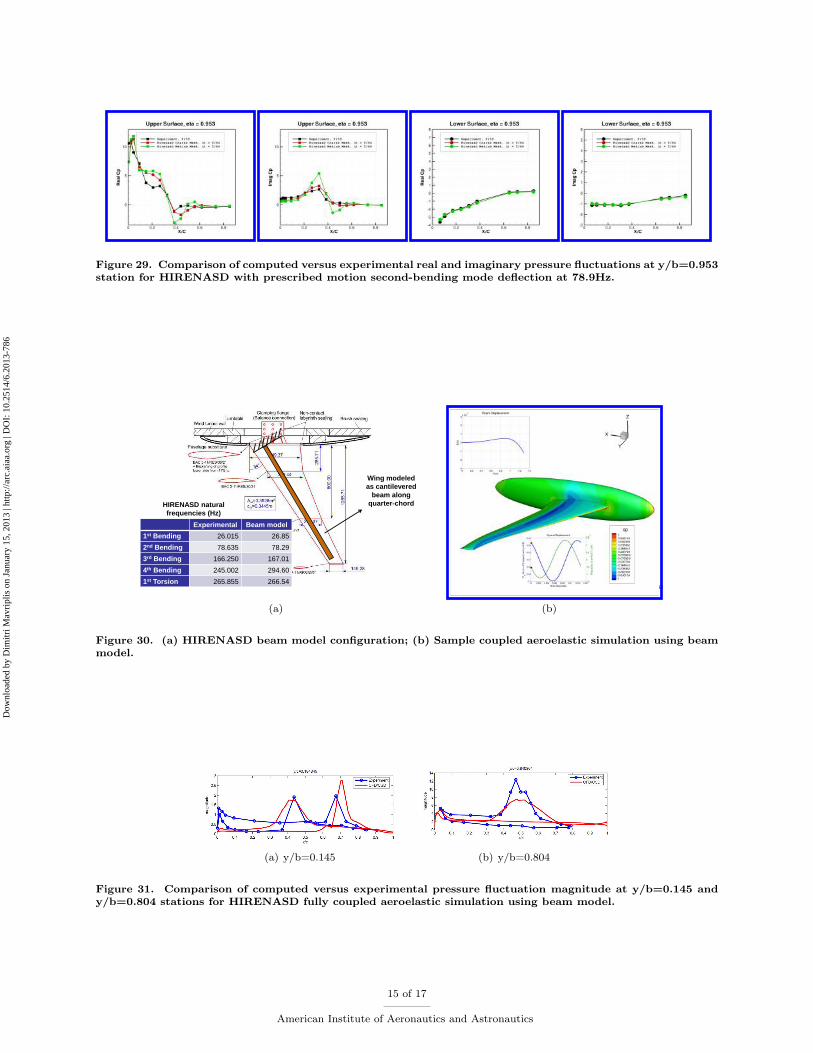
Figure 29. Comparison of computed versus experimental real and imaginary pressure uctuations at y/b=0.953station for HIRENASD with prescribed motion second-bending mode de ection at 78.9Hz.
Wing modeled
as cantilevered
beam along
quarter-chord HIRENASD natural
frequencies (Hz)
Experimental Beam model
1st Bending 26.015 26.85
2nd Bending 78.635 78.29
3rd Bending 166.250 167.01
4th Bending 245.002 294.60
1st Torsion 265.855 266.54
(a)
30
(b)
Figure 30. (a) HIRENASD beam model con�guration; (b) Sample coupled aeroelastic simulation using beammodel.
(a) y/b=0.145 (b) y/b=0.804
Figure 31. Comparison of computed versus experimental pressure uctuation magnitude at y/b=0.145 andy/b=0.804 stations for HIRENASD fully coupled aeroelastic simulation using beam model.
15 of 17
American Institute of Aeronautics and Astronautics
Dow
nloa
ded
by D
imitr
i Mav
ripl
is o
n Ja
nuar
y 15
, 201
3 | h
ttp://
arc.
aiaa
.org
| D
OI:
10.
2514
/6.2
013-
786
VI. Summary and Future Work
Participation in the �rst aeroelastic workshop has provided a valuable exercise for benchmarking bothunsteady aerodynamic and fully aeroelastic simulation capabilities. Such simulations are more complex thansteady-state aerodynamic calculations since multiple disciplines must be linked together and can contributevarious sources of errors.
The workshop results represent a large amount of data, particularly when grid re�nement, time stepre�nement and convergence tolerance e�ects are included. Although the results described in this papercovered all three test cases from the workshop, for each test case, additional grid and time step re�nementstudies are warranted. For the RSW case, it was felt that better agreement with experiment should havebeen expected but that this was mostly due to the unexpected complications due to the interaction of themodel with the wind-tunnel wall boundary layer. One suggestion was a CFD-only comparison of this sametest case using a purely inviscid wall. The BSCW was designed as a challenging test case and will likelyserve as a model for future investigations of strongly non-linear time-dependent ow phenomena which areknown to be at the edge of the capabilities of current RANS solvers. One of the important outcomes of theresults of this work was the demonstration of the need to resolve the important time scales of these owphenomena simply for good implicit time-step convergence. Finally, the HIRENASD case provided a goodentry-level test case for aeroelastic simulations and agreement with experimental data has been shown tobe quite good in most regions of the ow �eld. Follow on work may involve investigating more non-linearaeroelastic responses and more highly coupled aeroelastic problems.
References
1Levy, D. W., Zickuhr, T., Vassberg, J., Agrawal, S., Wahls, R. A., Pirzadeh, S., and Hemsch, M. J., \Data Summaryfrom the First AIAA Computational Fluid Dynamics Drag Prediction Workshop," Journal of Aircraft , Vol. 40, No. 5, 2003,pp. 875{882.
2Levy, D. W., La in, K. R., Vassberg, J. C., Tinoco, E., Mani, M., Rider, B., Brodersen, O., Crippa, S., Rumsey, C. L.,Wahls, R. A., Morrison, J., Mavriplis, D. J., and Murayama, M., \Summary of Data from the Fifth AIAA CFD Drag PredictionWorkshop," AIAA Paper 2013 to be presented at the 51st Aerospace Sciences Meeting, Grapevine TX.
3Benek, J. A., \Lessons learned from the 2010 AIAA Shock Boundary Layer Interaction Prediction Workshop," AIAAPaper 2010-4825.
4Rumsey, C. R., Long, M., Stuever, R. A., and Wayman, T. R., \Summary of the First AIAA High-Lift PredictionWorkshop," AIAA Paper 2011-939 presented at the 49th AIAA Aerospace Sciences Meeting, Orlando FL.
5Mavriplis, D. J. and Levy, D. W., \Transonic Drag Prediction using an Unstructured Multigrid Solver," AIAA Journalof Aircraft , Vol. 42, No. 4, 2003, pp. 887{893.
6Lee-Rausch, E. M., Frink, N. T., Mavriplis, D. J., Rausch, R. D., and Milholen, W. E., \Transonic Drag Predictionon a DLR-F6 Transport Con�guration using Unstructured Grid Solvers," Computers and Fluids, Vol. 38, No. 3, March 2009,pp. 511{532.
7Mavriplis, D. J., \Third Drag Prediction Workshop Results using the NSU3D Unstructured Mesh Solver," AIAA Journalof Aircraft , Vol. 45, No. 3, May 2008, pp. 750{761.
8Mavriplis, D. J. and Long, M., \NSU3D Results from the Fourth AIAA CFD Drag Prediction Workshop," AIAA Paper2010-4364.
9Long, M. and Mavriplis, D. J., \NSU3D Results from the First AIAA CFD High-Lift Prediction Workshop," AIAA Paper2011-863 presented at the 49th AIAA Aerospace Sceinces Meeting.
10Mavriplis, D. J., \Grid Resolution Study of a Drag Prediction Workshop Con�guration Using the NSU3D UnstructuredMesh Solver," AIAA-Paper 2005-4729.
11Sitaraman, J., Wisssink, A., Sankaran, V., Jayaraman, B., Datta, A., Yang, Z., Mavriplis, D., Saberi, H., Potsdam, M.,O’Brien, D., Cheng, R., Hariharan, N., and Strawn, R., \Application of the HELIOS Computational Platform to RotorcraftFlow�elds," AIAA Paper 2010-1230, Presented at the 48th AIAA Aerospace Sciences Meeting, Orlando FL.
12Mavriplis, D. J. and Venkatakrishnan, V., \A Uni�ed Multigrid Solver for the Navier-Stokes Equations on Mixed ElementMeshes," International Journal for Computational Fluid Dynamics, Vol. 8, 1997, pp. 247{263.
13Spalart, P. R. and Allmaras, S. R., \A One-equation Turbulence Model for Aerodynamic Flows," La RechercheA�erospatiale, Vol. 1, 1994, pp. 5{21.
14Wilcox, D. C., \Re-assessment of the scale-determining equation for advanced turbulence models," AIAA Journal , Vol. 26,1988, pp. 1414{1421.
15Menter, F. R., \Two-Equation Eddy-Viscosity Turbulence Models for Engineering Applications," AIAA Journal , Vol. 32,No. 8, 1994, pp. 1598{1605.
16Mavriplis, D. J. and Yang, Z., \Construction of the Discrete Geometric Conservation Law for High-Order Time AccurateSimulations on Dynamic Meshes," Journal of Computational Physics, Vol. 213, No. 1, April 2006, pp. 557{573.
17Yang, Z. and Mavriplis, D. J., \High-Order Time Integration Schemes for Aeroelastic Applications on UnstructuredMeshes," AIAA Journal , Vol. 45, No. 1, 2007, pp. 138{150.
16 of 17
American Institute of Aeronautics and Astronautics
Dow
nloa
ded
by D
imitr
i Mav
ripl
is o
n Ja
nuar
y 15
, 201
3 | h
ttp://
arc.
aiaa
.org
| D
OI:
10.
2514
/6.2
013-
786
18Yates, E. C. J., \AGARD Standard Aeroelastic Con�gurations for Dynamic Response I - Wing 445.6," Tech. Rep. TM100492, NASA, 1987.
19Sitaraman, J., Datta, A., Baeder, J., and Chopra, I., \Coupled CFD/CSD Prediction of Rotor Aerodynamic and Struc-tural Dynamic Loads for Three Critical Flight Conditions," 31st European Rotorcraft Forum, Florence, Italy.
20Datta, A., Sitaraman, J., Baeder, J., and Chopra, I., \CFD/CSD Prediction of Rotor Airloads in High Speed Flight,"Journal of Aircraft , Vol. 43, No. 6, 2006, pp. 1698{1709.
21Sitaraman, J. and Roget, B., \Prediction of Helicopter Maneuver Loads using a Fluid/Structure Analysis," Journal ofAircraft , Vol. 46, No. 5, 2006, pp. 1770{1784.
22Yang, Z. and Mavriplis, D. J., \A Mesh Deformation Strategy Optimized by the Adjoint Method on UnstructuredMeshes," AIAA Journal , Vol. 45, No. 12, 2007, pp. 2885{2896.
23Ricketts, R. H., Sanford, M. C., Seidel, D. A., and Watson, J. J., \Transonic Pressure Distributions on a RectangularSupercritical Wing Oscillating in Pitch," AIAA Journal of Aircraft , Vol. 21, No. 8, 1983, pp. 576{582.
24Schuster, D. M., Chwalowski, P., Heeg, J., and Wieseman, C. D., \Summary of Data and Findings from the FirstAeroelastic Prediction Workshop," Paper ICCFD7-3101, Proceedings of the 7th ICCFD Conference, Mauna Lani Bay Hawaii.
25Ballmann, J., Dafnis, A., Korsch, H., Buxel, C., Reimerdes, H. G., Brakhage, K. H., Olivier, H., Braun, C., Baars, A.,and Boucke, A., \Experimental Analysis of High Reynolds Number Aero-Structural Dynamics in ETW," AIAA Paper 2008-841.
26Reimer, L., Boucke, A., Ballmann, J., and Behr, M., \Computational Analysis of High-Reynolds Number Aero-structuraldynamics HIRENASD," Proc. of the International Forum on Aeroelasticity and Structural Dynamics (IFASD) 2009, PaperIFASD-2009-130.
17 of 17
American Institute of Aeronautics and Astronautics
Dow
nloa
ded
by D
imitr
i Mav
ripl
is o
n Ja
nuar
y 15
, 201
3 | h
ttp://
arc.
aiaa
.org
| D
OI:
10.
2514
/6.2
013-
786