resume - files.eric.ed.gov k. francese, m.s.; and reid t. rerruilds,'ph:d.. the sources of...
TRANSCRIPT

6
AUTHOR.TITLEsINST I Turk' ortspoNs. AGENCY -
REPORT .N0'PuB. PATENCONTRACT'NOTE
AVAILABLE, FROM
PUB' TYPE.
'EDRS PRICE,.DESCRIPTORS
8
RESUME
Richards,. Louise G., Ed.Demographic Trencle-and Drug Abuse, 19801995. NIDAResea;ch,Monograph 35.CSI, Inc., Washington, D.C.National Inst. on.Drug Abuse(DHHS/PHS), Rockville,Md.DHHS-ADM-81-1069May 81NIDA,-271-79-3605_
/ .
107p.p Chart 8,, pages 92-93, and Charts 11-1i/ page's95-97 are"` copyrighted and, therefore not evailable.Supeiintendent of Documents, U.S.,GoVernmentPrintingOfftce, Washington; DC, 20402.epokts-- ResearchAechnical (143)
MF01/FC05 Plus Postage.Annotated Bibliographies; *Demography; *Drug Abuse;Deug,Use; GeographicLocation; Illegal .Drug Use;Marihuana; Narcotics; *P'rediction; Race;/ Sex;*tociocultural Patterns; Trend Anainis; *Young.Adults
CG 017 097
ABSTRACT . .
.research-monogeaph," written for community (
ofLicials and plphners of -drug abuse prevention programs, ptesenfe.straight line projections-On the. possible extent and kinds Ifnonmedical clydg Use-lor;young adults'(18725 years./kd), that can beexpected in .the future-. Projectione are made basedot current youngadult drug ,,abuse and popul'ation trends. The purpo'se o.thettudy andmethodologies are describecl'in,..the introductory ,chapter. Chapter.2comments on"idemographic trends inlamily status,/ education, .incomegeographie'diatYibution, race, ethnic c,ompbsiti "on, total populationsize, and ,age composition: Ikchapter 3., sourges of data on drugabuse are reviewed and evaluated for.their usefulness' in making..future;projectionss AThe remainder of monograph presents theprojeCtions, 411 tgxt and tables, lot marijuana; inhalants,,Isallucinogens, cocaine, heroin, and:other Oi.a_tee. Data are given fortotal numbers and:fOr percentages of 18 to/25 year olds who may beexpected to use theseldrugs/in985, 1990/ and 1995.. Trends arefurther tabUlated bit sex,' raCeif and residence:in metropolitan ornonmetropolitan areas. Numeroustables and anannotated, bibliographyon deMographic trends and forecaSting technigueS supplemftnt the text.(BL)
/. ., e
************4*******************f***t**********,**********************,* Reproductions supplied by EDRS are the best 'that can be made . *
.* from the/Original document. *****************************v****************************** ***********,
I "
.

a
CD
41k
demographic Trends °-and Drug Abuse,'1980-1995
Editor:
.Louise G. RiChards; Ph.D:National Institute orsi.Drug Abuse
NIDA Research Monograph 35
May 1981..
i, A
DEPARTMENT OF HEALTH AND 'HUMAN SERVICES2Public Health. ServiceAlcohol, Drug Abuse, and' Mental. Health Administration
-National Inktitute on Drug AbuseDivision ofRbsearch
*--5600 Fibhers Lane .
Rockville, Maryland 20857
U.S. DEPARTMENT OF EDUCATION`NATIONAL INSTITUTE OF EDUCATION
EDUCATIONAL RESOURCES INFORMATIONCENTER IERICI
! This document has been reproduced asreceived from the person or organizationoriginating it.
SMinor changbs' have been made to improvereproduction quality!
Points of view or opinions stated In this docu-ment do riot necessarily represent off ici5I NIE.
positipn or policy.
For sale by 'the Superintendent of Documents, U.S., Government Printing OfficeWashington. D.C. 20402

The NIDA Reseorch Monograph series is prepared by the prvlsion of Researchof the National Institute on Drug Abuse. Its primary obiecfNe Is to providecritical reviews of research problem areas and techNques, the nt ofstate-of-the-art conferences, Integrciftvp research reviews arSdoriginal research. Its dual publication emphasis Is rodid and targeteddrsseminatIon to the scientific,and professional community. I
Editorial-Advisory Board
A-vram Goldstein; m.p.Addiction Research FoundationPalo Alto. California
.
Jerome Jaffe, M.D.College of Pt-sicians and SurgeonsColumbia University. New Yak
SL
Reese T. Jones, M.D. .
Lapgley Pater Neuropsychiatric InsMuteUniversity of galiforniaSon Francisco. California
Jack Mendelson, MIX. 2
Alcohol and Drug Abuse Research Center.Horvard Medical School,tad.McLean Hospital 00w6'Belmont. Massachusetts
'Helen NpWlis, Ph.D... Office of Diug Education. DHHS
Washington. D C.- ,1
\Lee Robins, Ph.Washington versify School.of MedicineSt. Louis, Mis i
NIDA Research Monodtaph seriesPoIlln,
DIACTOR, NIDAMarvin Snyder, Ph.D.CARECTOR, DIVISION OF. RESEARCH, NIDARobert C. Petersen, Ph.D.EDITOR-IN-CHIEFEleanor. W. WaldropMANAGING EDITOR
Parklcrwn WO Fishers Lane, Rockville. MaYond 20857
3

'Demographic Trendsand Drug AbUse,1980-1g95
a
0

ACKNOWLEDGMENTS
,*.
. ,
CSR, Incorporated, Washington, D.C. 20005, conducted the
study reporfed in this volumeand prepared the monograph ,for publication under Contract Is.b..271-79-:360 with ,the
National. Institute.on Drug Abuse. The authors are -
Sherrie S. Aitken, M.P.A,; Laura P. Bonneville, Ph.D.;P9ter K. Francese, M.S.; and Reid T. Rerruilds,'Ph:D.
.
The sources of peltcentages'in.tables showing yoUng adOrtsidrug use'in 1974,-1976, and 1977 are unpublished detailed:tabulations appended to the NJA National Survey reportsfor those years. ' ,
.
COPYRIGHT STATUS 't
0.00 VIII, on pages 92, and 93, and charts XI, XII, andXIIY, on pages 95-97,.are copyrighted and are reproducedherein with pelae4sion of American Demographics. Theirfurther reprodaktion,without specific permission of thecopyright holder'is prohibited. Chart XIV, on page 98,may be reproduced with a credit line to the Population-a.Reference Bureau, Inc. All othpr material in this volumeis in the public domain;and may be used or reproducedwithout permission from NIDApr the authors. Citation
of the source is appreCiated. , .x ,
.Library of Congress eatalo car number 81-600065
DVHS'publiation number (ADM) 81-10 ,
Printed 1981 .
4'
NIDA Research Monographs are indexed in the index Medicup.
They are selectively included in the coverage of BioSciencee;Information Service, Chemical AbOracts,iCurrentCen,tents,PsycholOgical Abstracts, and Poychopharrhaeology Abstracts.

..
Changes in the composition of tion's population can have pro-rre1rntkiseffects., The "baby boom" of the 1950's and 1960's in the
United States, necessitated adjustments throughout our society.In the 'eyes of some, it exacerbated a multitude of youth-related"problems, those of drug use and abuse among.them,,
In the 19805, a major change alre discernible Will-be a,ecrease' in' the size of the youth po,pulation cause young . -
dul s 18 to 25 years old are the group at greate t risk fOr druguse, this decrease is likely' to have a strong 1 act on futuredru e patterns, with important implications the planning
, of 'prev and treatment progrants. It is ,sle§ira le, 'therefore,to find but as much as possible about the extent and Iiinds oriion-medical drug use we can expect to see at larrous times in ,theoars ahead.
$,
Methocls/ of proaicting the effects or, population change va from, .
inP Atly from'
/ W
'simp)...e. projections of numbers in various..age groups to el,borate"modelting" of a problem, using multiple factors that may affectit. The study conducted Tor the National tnstitUte on Drug Abusepresented in this monograph is a first step into this territory
. and uses the simplest method, straight line projection. One'chap-ter/comments briefly on many aspects 'of demographic trend4, amongthem family status, education, income, geographic distribution,and race and ethnic composition, as well as teal population size
- and age composition. Sources of chkvf-,on drug abuse are then -reviewed and evaluated for .their usefulriessoin projecting notunedi-cal drug use among young Adults.
..
:the greater part of the monograph, however, presents the projec-i,etions themselves in text and tablesi on marijuana, inhalants, hall'lucinogens, cocaine, heroin, and other opiates. 'Data are given
.for total numbers and poicentages of.18- tp 25-year-olds who were'users' of each group of drilgs in the recent past and tolho may be ."'expected( 11) use these, drugs i 19854, 1990, and 1995._ The trends,and also tabulatea''by see(, rack, and residence -in metropolitan
Forew rd
"b
2,

or nonmetropolitan areas. The monograph makes available informa-!,
tion that will be interesting and-useful to many Whose work isconcerned With,drug users now and 0 :Vie future. 'Aitiong these are
community officials, planners, ancrthoOe who design or direct,
drug abuse prevention programs. a 4 .
We hope that furtherwork will be done'e oying additional fa67tors to .delineate'the future shape of nonMedital drug use with
greater precision. Rational predictions of this type will create
a better-basis for our response to the continuing problem of drug.
abuse.
1
-Marvin SnyderDirector, DiVision of Research
,National Institute on Drug Abuse
I,
vti
7

..1 ContentsFOREWORD vCHAPTER 1 a Introduction
1-
CHAPTER 2 A Review of Population Trends'CHAPTER 3 A Review of Drug Abuse Data Bases 15
-Table 1 *Age at Time of Admission to Federally Funded DrugTreatment Programs, 1978 (Regional Drug SituationAnalysis')
4Table 2 Average Number of Drug-Related Deaths per Quarter
by Drug and Region, 1978 (Regional Drug SituationAnalysis)
Table 3 1971 Survey: Critical Questions Asked A6out SpecificDrugs
Table 4' 1972 Survey: Critical Questions Asked About SpecificDrugs
Table 5 1974 Survey: Critical Questions Asked About Specific-Drugs
Tab le, 6 1976 Survey: Critical Questions Asked About DrugsUsed for Nonmedical Purposes
Table 7 l'977 Survey: Critical Questions Asked About SpecificDrugs
CHAPTER 4 Projections of Drug Abuse 43Table: 1 Percent of Young Adults Who Had Used Marijuana:
'1974,, 1976, and 1977 Surveys, with ChangesTable 2 Pralections of Young Adult Populations for 1985, 1990,
and 1995
Table 3 Number of Young Adults Who Had Used Marijuana,1977 Survey, and Projections for 1985, 1990, and 1995
- Table 4 PeNent of Young Adults' 18 to 25 in Vlirious Sub-groups Who Had Used Marijuana; -1976 and 1977 Surveys
Table 5 Nurpber of Young Adults 18 to 25 in Various Sub-group; Who Had Used Marijuana, 1977'Sprvey, andProjections for 1985, 1990, and-1995
Table 6 Percent of Young Adults Using Marijuana Currently:1974, 1976, and 1977 Surveys, WIT Change
Table 7 Projections of Young Adults Using Marijuana Cur-rently, for 1985, 1990, and 1995
Table 8 Percent of Young AdUlts 18 t62In Various Sub-groups Using Marijuana Currently: 1976 and 1977Surveys
Table 9 Number of Young Adults 18 to 25 Using MarijuanaCurrently, 1977 S.loirry., and Projections for 1985, 1990,and 1995
011
f

Tabl4 1.0 Percent of Young Adults Using Marijuana Regularlyor OccasiOnally: 1974, 1976, and 1977 .Surveys,..withChange
Table 11 NUMber of Young Adults Using Marijuana Regularly carOccasionally, 1977 Survey, and Projections for 1985,1990, and 1995
Table 12 Percent of Young Adults 18 to 25 in Various Sub-_ groups Using Marijuana Regularly or OccaSionally: .
. 19.76 and 1977 Survyys
Table 13 Number of Young (A-- is 18 to 25 in Various Sub-groups Using Marijuana ilarly or Occasionally,1977 Survey, and Projections for 1985, 1,990, and, 1995
1.Percent of Young Adults 18 to 25' in Various Sub -\groups Who Had Used Inhalants: 1976 and 1977 Sur,veys
Number of 'Young Adults 18 to 25 in Various Sub-grOups Who Had Used Inhalants, 1977 Survey, andProjections for 1985, 1990, and 1995
Table 16 Percent of Young Adults 18 to 25 Using inhalantsCurrentry: 1976 and 197.7 Surveys
Table 17 Number of Young Adults 18 to 25 in Various Sub-groups Using Inhalants Chirrently, 1977 Survey, andProjections.for,I985, 100, and 1995
Table 18 Percent of Young Adults 18. to 25 in Various Sub-groups Using Inhalants Regularly or Occasionally:1976 and 1977 Surveys
Table 19 Number. of Young Adults 18 to 25 in Various Sub-groups Using Inhalants Regularly or Occasionally,.1977 Survey, and Projections for 1985, 1990, and 1995
Table 20 .Percent of Young Adults 18 to 25 in Various Sub-groups Who Had Used Hallucinogens: 1976 and 1977Surveys
Table 21 Number of Young Adults. 18 to 25 in Various Sub-groups Who Had Used Hallucinogens' 1977 Survey, andProjections for 1985, 1995, and 199
Table 22, Percent of Young Adults. 18 to 25 in Various Sub-groups Who Had Used Ilallucinogens: 1976 and 1977 ,
Surveys,
Table 23 Number of Young Adults 18 to 25 in Various Sub-groups Using Hallucinogens Currenty, 1977 Survey,and Projections for 1985,7990, and 1995
Table 24 Percent of Young Adults 18 to 25 In Various Sub-groups Using Hallucinogsepa Regularly or Occa-sionally: 1974 and 1977 Surveys
Table 14a.
Table 15
Table 25 Number of Young Adults .18 to 25 In Various Sub-groups Using Ilalluclnogens Regularly or Occd-sionally, 1977 Survey, and Projections for 1985, 1990;
sand 1995

.Table 26 Percent of Young Adults 18 to 25 in Various Sub-
groups Who Had Used Cocaine: 1976 and 1977 SurveysTable 27 Number of Young Adults 18 to 25 in Various Sub-
groups Who Had Used Cocaine, 1977 Suriey, and-Projections for 1985, 1990, and 1995
Table 28 Percent of Young Adults 18 to 25 in Various Sub-groups Using Cocaine Currently: 1976 and 1977 Surveys
Table 29 Number of Young Adults 18 to 25 in Various Sob-groups Using Cocaine Currently, 1977 Survey, and ,Projections for 1985, 1990, and 1995
Table 30 Percent of Young Adults 18 to 25 in Various Sub-groups Using Cocaine Regularly or Occasionally: 1976and 1977 Surveys.
Number of 6'oung Adults 18 to.25 in Various Sub-groups Using Cocaine Regularly or,Occasionally, 1977Survey, and Projections for 1985, 1990, and 1995
Table 32 Percent of Young Adults 18 to 25 in. Various Sub-groups Who Had Used Heroin: 1976 and 1977 Surveys
Table 33 t Number of Young Adults18 to 25 in Various Sub-., groups Who Had Used Heroin, 1977 Survey, and
Projections for 198.1-0- 1990, and 1995
Table 31
Table 34 Percent of Young Adults 18 to 25 in Various Sub-groups Using Heroin Currently: 1976 and 1977 SurveysNumber of Young Adults 18 to 25 in Various Sub-groups Using Heroin Currently, 1977 Survey, ,indProjections foT11)13, 1990, and 1995'
Table 36 tilerceni of Young Adults 18 to 25 in Various Sub=groups Using Ileroa Regularly or Occasionally: 1 776and 1977 Surveys
Table 35
Table 37 Number of Young Adults 18 to 25 in Various Sub-groups Using Heroin Regularly or Occasionally, 1977Survey, and Projections for 1985, 1990, and 1995
.Table 38 Percent of Young Adults 18 to 25 in Various Sub-.groups Who IladUsed Other Opiates: 1976 and 1977Surveys
Table 39 Number of Young Adults 18 to 25 In Various Sub-groups Who Had Used Other Opiates, 1977 Survey, andProjections for 145, 1190, and 1913e'Table 40 Percent of Young Adults 13 to 25 In Various Sub.wont Using Other OpiAtrl Currently: 1976 and 197.7Surveys
Table 41 Number c Young Adult, 18 to 25 in Varloua.Sub.groups Using Other ()dates CUriently, 1977 Suoiry,anolNoirction% for 1985;T990, and 1995
r:

Table 42 Percent of Young Adults 18 to 25 in Various Sub-groups Using Other Opiates Regularly or Occa-sionally: 1976 and 1977 Surveys
Table 43 Number of Young Adults 18 to 25 in Various Sub-groups Using Other Opiates Regularly or Occa-sionally, 1977 Survey, and Projections for 1985, 1990,and 1995
CHAPTER 5 Overview of Drug Abtise Trends and Recommendationsfor Additional, Research 67
ANNOTATED BIBLIOGRAPHY of Selected Materials on DemographicTrends and Forecasting Techniques . 70
DRUG ABUSE DATA SOURCES 79
APPENDIX A PO Ulation Projections for Young Adults for 198, an 9 81
APPENDIX 13 Charts and Tables Depicting Various Demo graph cTrends
LIST OF rIDA RESEARCJIMONOGRAPHS .. .. . 100
.1*
Chapter 1
Introduction
Overview of theyeport
The study reported here was undertaken to project drug abuse 1 for youngadultin future yeliirs by examining age trend data in conjunction withdata on the nonmedical use of drugs. Previous research has demonstratedage to be strongly associated with the norimedical,use of drugs, with thegreatest incidence occurring in the 1?-21 age 11:f oup. Since the number ofilf-21 year-olds, or young adults,. will decline Ira the nest 11 years, it canhe hypothesized that the number ofyoung adults abusing drugs will alsodecrease.. This report presents the inimbers of young adults exPrctra tobe abusing drugs at several points In the future as indicated by a simpletechnique. using projec tett trends in population and drug abuse.The report is organized into, five chapters. This chapter outlines thepurposes of the study and reviews the methodology employed for makingprojections of the number of young adult drug abusers. Chapter 2 reviewsthe changing structure of the population. Several drug abuse data setsare reviewed in chapter ), which specifies the data to br used as the hashfor projecting future drug abuse. The fourth chapter presents projectionsof the number of young adult drug abusers in 19A1, I'M, and 199). Theprotected trends in nonmedical drug use by young adults ate summarizedin the final chapter and
recommendations are made for additional tese+titchi.Purpose of the Study
The general Put Polo of this study Is to Predict nonmedical ineptdrugs based on A comparison of twodata Irtu estimates of iftilit AIM"At several ivthitt in Univ., and (2) the projected size of the young adultpopulation at rve_.rol points In the future. :Shoe nonmedical drug for l*cilftently molt frequent among young adults (1$-/1 yearn), and there isevitientie that' the *ire of this age group will be declining, It is quitepossible that the number of youtE 4eitilt% abusing drugs mat. itet:reate.

This possibility hasstrong implications for treatment programs serving.,drug ebtthers, education programs geared to high risk popUlations, anddeplbyrnent of forces to reduce availability. of illicit drugs, 'Only whenarmed With projections of future,drug 'ObUse,can the. National Institute onDrug Abuse iNIDA) make rational plans for future' treatment and,prevention programs targeted on youngadult.
. .
A review of literatire on population crianges and a review of drug abusedata sets will be summarized in cliapte.rs 2 and 3,,respectively,lo that thereader.may hay* a clear understanding of what data were used to makefuture projectidhs of drug. abuse.
- .4. .'a. . .
Methodology- for 'Makintirojeetions of Population Size and Drug Abuse
The decision was made to ptolett the number of young adult drug abusersat three points: 1985,4990, and'19?5. Population projections for the18725 Age group have been taken from the. Cerlsus gureau!sleries IIpublished projections of the total popelatiOn (U.S. BureaU of the Census,1977b) 2 Several precaRtions should be taken in interpreting the Series II
.projeCtions used in thisistudy and presented in appendix A:
o. , Actual fertility.levels might run.slightli below the levelassumedWor the Series II projections.
o Mortality levels for people in the 18-25 year-old category are'increasing. The increases are not so large as to affect theSeries II projections markedly, but they do run counter to theassumptions upon which) the Cens Bureau's projections arebased. ,
o Official estimates of the current number of young adults are -probably below the actual figure built into the Series Hprojections.
Population projections for 18-25 year-olds and for several subgroups of18-25 year-olds come directly from,the Census Bureau Series Hestimates. However, the Population projections for large metropolitan,other metropolitan, and nonmetropolitan areas, presented in appendix A,do not come _from an official source. The Census Bureau does not preparesuch projections by age grouping. Therefore, .a ratio method was used tomake simple projections for these groups. This methodolOgy required twosimplifying assumptions: 0
o That the metropolitan designations used by the NIDA surveysare not substantially different from a current-Census Bureautrichotomy of Standard MetropolitanStatistical Areas (SMSA's)of one million and larger, SMSA's under one million, andnonmetropolitan areas.
o That the proportion of the 18-25 year-old population (NIDAsurvey categories) in the three areas will not differ markedlyfrom the proportions of 18-25 year-olds (Census Bureaucategories) in 1977.
I .
2

.. .-\..-'1-' ......,,
,Once pOpulation projeciloris had been assembfed, the next. step wasp,:develop projectionsbf thebbober of yopng adult nonntediCal drdg users.in 1985, 1990, Kd 1995. Severs `alternative approachis. to Objecting
',future levels of drug abuse were reviewed: . e.: .
Using a level straight-line approich, one could apply the mostcurrent levels of reported drug ghtlse to population projectionsin order to project the.numbers of drug abusers at future pointsin. time.
1o Where trend data are available, one could study the directionar and magnitude of change in the level of drug abuse over time
and assume thatthis same pattern would repeat itself in the'future. This analysis enables one to modify the most recentlyreported.l6e1 of girug abuse, and n-)ultiply the modifiedpercentage by population projections, toproject the number ofdrug abusers in the future.
...
A third approach would be to iden ify a number of demographicand socioeconomic factors which might affect future patterns -of drug abuse. Each factor (e.., tte changing structure offamilies or changing labor market conditions) then could beanalyd and a set of hypotheses developed expressing itsrelationship to drug abuse. 'Statistical equations then could be
l'ci)`' developed to express these relat nships, and the resulting
1,f :1' uations could be used to gener te another set of projectionsdrug abuse. '
The projections of young adult drug abusers presented herein are ,,developed using only the first approach. '1.e second approach canteused with confidence only when data are a ailable for a series orpoints intime. Currently, only data on marijuana use are available, and )comparable figures are available only for threetlifferent points.Predictions based on the third approach wi 1 not be presented here;h)owever, the potential of this approach foil drug use projections will be- discussed in chapter 5.
The straight-line projection technique is based On the assumption thatthe most current rates of drug abuse reported will remain relatively -listable in the future. For this study, the most current data available wasthe National Survey on Drug Abuse conducted in 1977 for the NationalInstitute on Drug Abuse. Using the straight-line projection technique and1977 data will result in conservative estimates because the preliminary
. results of the 1979 National Survey indicate growing rates of drug abuseamong young adults. However, these estimates will be useful insupporting broad planning decisions.
'..
The following chapter discusses .the Changing struqiure of the populationand some related considerations in prbjectingfuture drug abuse for youngadults.

,fr
4 k-
'74 FOOTNOTES
.... -4 A
1 For puE,poses of. this it y, the tbrm "drug abuse" refers to nonmedicaluse of drugs,es used b the National Institute on Drug Abtise in .
conducting its national surveys on drug abuse.i
2 References in cjapters 1 and 2 appear in the Annotated Bibliography ofSelected Materl s on Demographic Trends and Forecasting Techniques,which beg pagb 70. 1-
4
4.1

Chapter 2
A Review of Population Trends
INTRODUCTION
In the recent past the shape of the population in th1/45 country hasundergone several major changes. The postwar "baby boom;' and morerecent "baby bust" are generally well known; however, the importantimplications of these broad fertility swings are not widely appreciated.Lower death rates,, migration to the South and West, and declining growthrates for major cities have all served to distinguish America in the 1970'sfrom previous decades. The challging status orwomen and minorities hasinfluenced trends in educational attainment, economic status, and familylife.
Many of these changes caught observers by surprise, but improvements inthe availability of demographic data and the growing sophistication of;demographic research have enabled demographers to analyze these trendsand assess their impaCt on many aspects of social, political, and economiclife (U.S. House of Representatives, Select Committee on Population,1978)
The overview Of the population changes in the United States is presentedhere to help policy analysts and prOgram planners in the drug abuse fieldto understand past and future demographic trends. First, it reviews thestrengths and weakne of demographic data and discusses demographicforecasting techniqu nd, it reviews past and anticipated trends forseveral demographic es. (Appendix B includes charts and tablesdepicting some of the,t ds discussed in this chapter.)
Included in this chapter are comments on the effects that variousdemographic trends may have on drug abuse patterns; however, the natureof these relationships is not documented.
Quality of Demographic Data and Forecasts
A great deal is known about the size, growth, and composition of the U.S.population because of rather thorough decennial censuses and virtuallycomplete registration of vital eventsi.e., births, deaths, marriages, anddivorces. In comparison with other social and behavioral sciences, thedata of demography are known to be highly valid and reliable. Someaspects of our statistical system are not as strong as others, however.Specifically, a small but significant portion of the population is missed inthe decennial census, and our statistical system does not provide'for theclose monitoring of migration:
o The Census Bureau estimates that the 1,970 Census. missed 2.5percent Of-the total population and that this undernbmerationwas disturbingly high for some groups. For example, almost
5
16

20 percent of All black males aged 25,-to 44 weft missed by the1970 Census (U.S. Census0975b). w
o Estirrrates of the nuMber`of illegal immigrants and the Number'of citizens, resident alieng, and undocumented aliens who leave.the country permanently are..deficient (reely 1977; Siegal 1978).
A thorough assessment of the changing geographic distribution of theppulation--the result of millions of 'Individual Movescan only be madewith data from the decennial census which will, be released at the Stateand subitate level in late 1980. Yet cite as we near the end of anintercensal period demographers are ,abl to estimate the impact ofmigration on population change at the St to and \local level. One datasource is a Census Bureau program which in cooperation with State andlocal governments, analyzes data on scho enrollment, utility hookups,housing starts, and findings from sample surveys to produce annualpopulation estimates for each county. Increasingly refined techniqueshave been developed over the years to estimate future demographictrends. Nevertheless,
overforecasting, like any technique, is
prone to error. It is not the intent of this chapter to: review allforecasting techniques; however,,a few conceptual distinctions will bemade to provide a background for further discussion of the limitations ofthese techniques. Demographers shy away from speaking of predictions,
'because past efforts to forecast the future have seldom proven to beaccurate. Therefore, they speak in terms of estimates, projections, andforecasts (Shryock and Siegal 1975)., An estimate is usually made of anunknown number pertaining to the present or past. For example, drawingon the 1970 Census and other da6 sources, the population of New YorkState in 1979 can be estimated with considerable accuracy.
The technique of population projection, which refers to the future,requires that assumptions be made about future demographic trends.Mathematical formulae are used to apply these assumptions to a cypr'entpopulation count or estimate. This initial population is normallydisaggregated by age and sex. The projection method chosen (severalcomponent methods are currently used) then diminishes the populationaccording to a given age-sex-specific mortality schedule and,augments itaccording to a given fertility schedule. Finally, adjustments\are madeaccording to a net migration schedule (Shryock and Siega1.1975). Forexample, the most frequently cited population projections for the U.S. arethose published periodically by the Census Bureau. The most recent setconsists of three different projection series to the year 2050 for the totalU.S. population disaggregated by sex and fixe7year age groups (U.S.Bureau of the Census 1977b). All three projections assume the Samelevels of net immigration and mortality, but each is based on a differentassumption about future fertility.
By publishing three different projection series, the Census Bureau avoidsmaking an official forecast about thefutute course of population growth.In effect, the Census Bureau is saying: "These are the demographicimplications of three different. plausible assumptions about the 'components of population growth." The reluctance of many demographersto designate particular projection series as their best guess is bAsed onthe fact that demographic patterns are affected by many variables such
6

, ., ,
asteconomic growth whfch are'nbt Incorporated in demographic ,projection models. lly offering a range of projections the analyst mightavoid subsequent embarrassment, but the danger of thli approach is that
chooses a'particular projection as "Pi best" 1
the layperson reviewing a group of pro ectioy is of tentkone whoorecast.a :
Ecpnotnetricians have attempted to bridge the gap between the rigorousbut restricted methodologyef projection and looser forms of crystarballgaz-ing which attempt-to anticipate all )social and cultural trendsaffecting population change. The result is .a new technique referred to asdemographic modeling (Reynolds 1979)'. Using this technique, if aforecaiter believes fertility is affected by family income, an equationexeressing this relationship can be estimated and incorporated into ademographic model. Fertility would then be forecast as a function ofeconomic growth and age structure.
Demographic modeling may also be used to forecast the populations ofsQbnational areas which are strongly influenced by migration flows. Here
'an area's net migration is cast as a function of the growth of employmentopportunities in the local economy. Other processes such as labor forceparticipation and family formation can be incorporated into the model toproduce a forecast of the composition of the population, e.g., the numberof three-person households in a given income category. Forecasts for -specific subgroups such as this normlly are not made using conventionaltechniques of population projection.'.
A demographic forecast produced by complicated techniques'cansometimes but not always produce accurate results. In the short run anational forecast is unlikely to be seriously in error because there is sd`much inertia in demographic trends. But when projections are made for\longer periods or for particular segments of the population, history canoutrun the assumptions on which the forecast is based (Pittenge?. 1979).A good case in point is the Bureau of Labor Statistic'? attempts toforecast labor force participation rates. Each series of projectionsproduced in recent years has become obsolete shortly after publkationbecause women have been entering the labor force at a greater rate thanthat anticipated by any of the projections (Flaim and Fullerton 1978).
Often it is useful to preparet series of projections and consider the rangeof alternafives produced. This approach demonstrates how a variable ofinterest is affected by different assumptions underlying the projections.Thus, population, projections allow one to place reasonable bounds on the,
. magnitude of future trends. For example, if the assumption was madethat the total fertility rate would not go higher than 2.7 or lower than 1.7(the levels used in the Census Bureau's high and low projections) then onecould estimate that the total U.S. population should not be greater than283 million no less than 246 million in the year 2000, assuming themortality and immigration assumptions hold.
The next section reviews past and future demographic trends and, whereplausible, their implications for future drug abuse patterns...
349-353 0 - 81 - 2
1

DemogoallicArehds: Past and Futhre Apt.A compreheriiive treatment of recent past and pear firture,derriogrAphIctrends is peyond the scope of this report] rather this 'retx)r.t will comment
,on trends in the follOwIng areast total population size, fertility,mortality, immigration, age' composition, family status, education,income, geographic c.listilbutiolt, and race and, ethnic composition.
Total population size 'The U.S. poptilatitin has grown from15I 1950 toan estimated222 Million it 1980--a 47.percent Increase in three decades.] Populationgrowth will be slower in the next decade, probably belip.v one percent peryear, but the total population should be between 240 and 25Q million in1990; The principal components of population changefertility,'mortality/ and inunigration1.-give eaCh undergone changes themselves inrecent decades. These changes will have Anportant effects on populationtrends in the future.
,Fertility
American fertility in the early pose-war years was characterized as the"babj, boom," with the crude birth, rate soaring to 25 per 1,000 totalpopulation in 1957. Since then the birth rate has declined, with only slightinterruptions, to approximately IS bitths per 1,000 in 1979.
The level of fertility has a marked impact on population size andcomposition, bin based on the experience of past decades it is difficult toanticipasp changes in this volat4 variable. The current consensus amongdemographers is that low fertility is here to stay. Those who foreseecontinued low fertility argue that the costs of childbearing (thecommitment of money and time on the part of parents), the availabilityof effective birth control, and the changing role of women and thefamily militate against the high levels of fertility seen in the postwarbaby boom (Westoff 1978).
But there are some analysts who disagree,with this view. The mostprominent is Richard Easterlin. In his presidential address to thePopulation Association of America, he argued that improved economic.opportunities for.young families and the demogrgphic echo of the Mayboom will result in a resurgence of fertility in the ,1980's (Easterlin .
19780 Those who foresee continued low fertility in the futureacknOwledge-the potential for a substantial echo effect, but feel th'atother social anVconomic forceS will dampen, if not nullify, Its impact.
easterlin believes that the economic-demographic cycle which producedthe baby boom of the 1950's and the baby bust of the 1970's will have awide rangeof.arrlio'rative effects on American society in the 1980's.Improved economic opportunity for young adults will mean not onlyhigher marriage and fertility rates but lower rates of divorce,unemployment, and crime. A clear implication of Easterlin's theory isthat young adults will be too'absorbed in occupational advancement andfamily life toengage in drug abuse ti) the extent that their older brothersand sisters did in the 1970's.
6
8
19

. , ' , / . ,, `,'ll the labor ,ntarket for young adults does not linpr6ve to he estieht)'.' envisions, orif counteracting social and cultural itands revis14,"14',v;
expectations for the 1980's qould prove to be oVerly.0-plinilit1C.,1,10';regardless of his 'overall thetiry, drug abuse trends should be favgably
affected by the decline In the numbk of young adpIts which Niflq>ecur intithe 1980's,, i,Vil-. .
g .:,One aspect of which has drawn increased attent1tt ,
,.0
recent:years, and which may have a significant rela liiship,to 4r. Abuse, isteenage fertility. In' 1976, births "to teen, pothers con, ituted 18Percent of all live births. Relatively fev.
mothersxtte were married
at the time of conception. Despite,the f that/,,te Vrnothersaccount fora growing proportio 1 all hs tsnd i :illegitimacyof births per 1,000 women 15-191 asrate for teenagers Is increasii* c te e.birt
Ily deb.e.,. the number.roiri 82 in 1950 to
68 in 1970 and 54 in 1976. Theygnaw sex edil >. on and the increasedavailability of birth control may lea ur line in this rate inthe next decade. ,')",,The impact of various ascan be appreciated wheand low population pr5.1 millidn births Ithe lovi project'.,
on the total populations Bureau's,high, medium, .
rojection;there wovld bert; 4:0 million births; andr I ,
Unborn childrfinx toblrug abuse until the endof this century cv niffitsOrate.beArs watching because itimplies differenta4Cify,les" 11 tie High fertiliy rates would suggestthat most yout* 'married and supporting families and,thus, it is speculatedApt4 tOsiould not be prime candidates for drugabuse. Low,. fertility woyftt syggest that larger proportions of young
t adults will itot,be Ill:fren and, thus, may be more prone torisk-taking and experl 4tion.
Mortality Jr-
Death rates hS/vOieclecreasing for all age groups5 so that theexpettaion of lifeit birth reached an all time high of 73 years in 1977.The leadigca'uses744 death among teenagers and young adults areaccidents;VICO;and homicide. Therefore, future mortality levels forthis age range will depend more on social and cultural variables thanadvances iitiredical care. It is difficult to envision any changes inmortality that will have a notable effect on the number of people /reaching the prime ages for drug abuse by the end of this century.Recent declines in mortality rates are more likely to benefit the elderlythan young adults (Rice' 1979).
Immigration
7Net immigration contributed relatively less to population growth in therecent pist than it did in the early part of this century. Nevertheless, netlegal immigration has been averaging around 362,000 in recent years,accounting for a fifth of total population growth. When illegal
2O

iminigrat km Is taken into account, vontribution of imMigrationto population'growth may be substantially highttr
Despite widespread interest In the number of Illegal Immigrants, ao 4
generally accepted estimato,of their 'number exists. Estimates of thenumbers ol.allens living illegally in the' 0.5: range from four to twelVemillion. Estimates of the flow of qegal entrants In a glven year alsovary widely. The 14quent border crossing ; mAny illegal immigrantsfromMeXico Might create the impression of a larger number, thanactually exists. On the otlIN hand there appears to be a Subitantlalnumber of aliens who enter legallyas tourists and sttidentsbut whooverstay the term of their visa and become undocumented residents(Neely 19771 Siegal I978).
The contribution of immigliatio to future population Size is difficult topredict. If immigration were to increase and fertility to remain low,' thecontribution of immigration to overall population growth wouldincrease. Whatever its rate, immigration will probably have a greater .
Impact on the growth of prime' drug .abuSe groups than on .the growth ofthe total population, because immigrants are disproportionately youngand male.
Immigration has become a highly charged issue in recent years.6Aside from its potential contribution to population growth, immigrationmay be related to drug abuse:in other ways. There is no concreteevidence to document the relationship between immigration and drugabuse; however, several factors should be investigated by future researchefforts, e.g.:
A substantial proportion of immigrants come from LatinAmerica, Asia, and the Carribean--important sources ofdrugs. This factor may or may not influence drug traffickingand abuse patterns.
o There are two competing stereotypes of immigrants whichrelate to drug abuse. In one view, immigrants--and especiallyillegal, Hispanic immigrants--are marginal members of societywith a greater than average propensity to illegal and antisocialbehavior. The competing view is-based on the fact thatmigrationlegal and illegal--is selective and that migrants tendto be especially achievement oriented. Furthermore, in aneffort to avoid detection, illegal immigrants are more likelythan others to abstain from illegal behavior such as drUgtrafficking and abuse.
Age composition
Many forms of social behavior are age specific. The age structure of apopulation reflects past trends in fertility, mortality, and immigration.The bulges and troughs in the U.S. age structure (as shown in chart I,appendix B) can be attributed to the wide wings in fertility in previousdecades. The relatively small numbers of children born during theDepression, the large number born in the 1950's, and the fewer births ofrecent years mean that a given age group, such aS young adults, cancontract, expand, and then contract again in the course of a few decades.
10

At the depth of the roression, there were only 1,1 million children born(1933). At the peal; of the baby loom this number reached 4.1 million(1951). The most reventlow was 3,1 million births (191)). The age'structure 01 the tiopulathin in the future years con be forecast withconsiderable accuracy,except for those. In the youngest age groups, whohave not yet been horn. Not only will the baby horn bulge continue topass through the age structure well into the twenty-first century, butsmaller cohorts born in the 1960's and early 1970's will he experienced asa deficit'for years to come. YestefdaN's smaller numbers of school -agedchildren are now confronting military recruiters and college admissionsofficer). In the 1980's, employers and home builders will be seeing thesesmaller cohorts enter the labor force and establish families. Because(frug abuse is most twevMent among teenagers and young adults, theshrinking of these age groups in the near future could result in a decreasein drug abuse independent of other social changes or preventive actions onthe part of authorities.. Thus, in monitoring future wlds, It is Importantto look beyond overall levels of drug abuse to age-specif1c.rates, whichwill give a truer picture Ai change.
Family status
A. variety of demographic data shows that the living arrangements ofAmericans are undergoing important changes and that family structure isneither as unifOrm nor as constant as It once was. Three importantchanges bear mention.
First, fewer people are 'marrying at the young ages common in the1950's. As recently as 1960, 72 percent of all women 20 -24 had enteredtheir first marriage. By 1977 this figure had dropped to 55 percent (Glick1973).
Second, in spite of the high level of teenage fertility and out-of\wedlock',,births, more young people are postponing or foregoing parenthoo4 than did
so in the recent past. A higher proportion of couples are also linkingtheir families to two children. In 1960 only half of all births were first orsecond children; by 1976 this proportion had increased to 75 percerkt.
Third, divorce is more prevalent today. ti the present level of divorcepersistS, it has been estimated that 40 percent Of recent marriages Willend in divorce (Glick 1973).7
srFuture trends for these variables are difficult to predict. Much dependson whether the eiiectIpi the recent sex-role "revolution" have beenlargely absorbed or wh6ther we are in store for additional substantialchanges in what men and women expect from work, marriage, andparenthood. A leading expert in family demography, Paul C. Glick, hassuggested that family demographic trends will change Jess radically in thenear future than they did in the recent past (Glick 1,978).
Education and income
When broadly defined, demography goes beyond an analysis of variablesdirectly related to population change and encompasses compositionalfactors such as education End income. Substantial improvements in

education and if tfOtrie levels during the 1950'4 and I 960's have slaci,erAiIn recent years. gy .19/0, i4 percent of all 18=21 year olds were enrolledIn college, port this figure dropped to )2 percent by 1918, In the last 10year the proportion of young males 20=21 enrolled in college has fallen41,1,0.4 to percentitEe pkiiiit4from 44 percent in 196/ to illW(C011f in ' t
1911.*Whiit, the participation of females increased from 21 percent to29.perc`rilt.
. .
The substantial gams in faintly income which characterized the 19S0's and19(.0's have moderated in recent years. When halation is controlled
"median family income increased 4.2 percent per annum from 1950 to 1910
but by only 0.6 percent per annum since then,
Two important demographic changes should be taken into account wheninterpreting these fhtures. First, the number of earners per (wilily hasincreased in recent years, Had large numbers of wives not entered thelabor force family income would have Adv,ttictql much less. Measures offamily or household income can be misleading, however ('dater 1980),Per capita income levels have risen more rapidly than faintly income asfamily size has declinedby 2.0 percent perannum since 1970.Demographic. trends seem to favor improved income, levels in the 1980'sas the labor force matures, Nevertheless, the rate o increase will bestrongly affected by political and economic factors outside of thepurview. of denioKraphy.
Geographical distribution
The geograplical distribution q' the population has changed continuouslyover the ye' rs as Americans have sought new opportunities. During the20th centoty, the industrialization of the American economy has beenaccovatned by a shift of population from rural areas .(bf ttn communitiesin the South) to the major metropolitan.areas of the, North 4md Midwest.These migration patterns ha-yb now been superseded by new populationshifts 'which will have important implications for the distribution of thepopulation in coming years (MOtrison 1978). The South and West are nowthe most rapidly growing regions, and population is declining in rr66yolder central cities and their immediately surrounding subtiOs (Birch1978; Guest 1979).
Becauso young adults migrate more freq ntly than othecoge groups, itwill be difficult to anticipate..with gre, accuracy the future geographicconcentration of those prone to drug buse. liow.,Ker the continuingredistribution of the American population in cbmiii & ades can bemonitored closely with the aid of demographic analysis.
Blacks and Hispanics
An analysis of drug abtlse trends must consitler.distinctions of race,_ethnicity, and class. Good data exist for analyzing virtually all 4demographic trends separately for blacks and whites, and moreinformation is becoming available for Hispanics.
In recent decades, the black population has grown more rapidly than thewhite due to higher fertility, although fertility levels recently reached an
2 312

.
all tipte for Mac .s. Haut the L:esisissitLtraisiV tstK4iuin tiOtkildtiOitthe Wm. i. 1)01)4101mi StiO4.41%1 roa.:t. 10 1.1-Itt, Of I
tiorcent at the total population. .1hite would tettrii 4 Shot totfe.4ein Ind of the, timid 114ix,141 !oil, estimated at 11.2 per.'entlit 1/79,
,The iitatsive thilt of the OIA414 1101.0141loo horn the twat ubtft to themetropolitan North hal SIOV;ril UI tecent year a,' and black.s it tieguts totoOVr to the auflorbs. Neserfflefras. Nat htOfr con. entrated
, Crilltot cities than o;tlitey..5.3 percent va. 19 petcent m 11170- -andl'ef*allve trsldrnflal 4;3fetallon Is not espe.-ted to diaappear in the near/Wore,
t(IOE:14tion4loPPOrlonitles £01 biar ka Nave iiitproytld niarkeitly in f.cri eta*c..4("ii, fir u4lege virgin-fief-4 tot iteraorts 1141 se-ars old §
rot tot %titles and prti refit tor Mai iis, Itowev et' /ina owe statisticsshoo, that rtiajc,,nee.,:ortontit.'tlisparities rernain Median tAtuily tu,:iutte totwhirrs was $pr,,74U 01-191/ vs, $10,141 tot blacks., tineulilolfrueut Mira.(Of VOii*Itt tack tit.11.rs Ate nowt touitv high, Cor th.sse tes.fl, the f ate w 4a37 percent III 191iru,t)1i.irttially higher thin the 15 percent rate forwhites." 1 or "those the fates were 21 t.tercent and 1 pen rid,respectively. ,,
t:iNetiSpAiite estithatrit at I .'it) WM104116. 147:11.P14% beenittentifie4 as thr artist rapidly growing minority iri the United States. theCensus Oureau does not prepare separate projections for the Hispanicpopulation; Over half are of Mexican origin, and 15 percent are PuertoRit an. Hispanics are disproportiOnately concentrated in the Southwest,FlOrida, and the large metropolitan areas of the North, Twenty-nine. ,percent of .the iftwatlie paptilatiOti is i411 the yiatillit, adult 41r. group M.14),compared with 73 percent of the total population. Median family incomeof Hispanics was $10,300 in 1977, roughly equivalent to that of bloc-los butsubstantially below the level of all families ($16,009).
\ Conclusion
The above review highlights several important demographic trends. In-flany cases future demographic trends can be anticipated with the aid of
pulation projections and other forecasting techniques. Some changes,such as improved mortality levels for the elderly, will probably have littleeffect on patterns of drUg abuse. Others, most notably the decliningnumber of young adults, are likely to have a strong impact on future drugabuse pat terns. A thorough understanding of demographic trends anddemographic forecasting techniques, combined with information ondemographic correlates of drug abuse, should be very useful for thoseconcerned with future trends in this problem.
13
1
S.

3
f%
1
rtkitti&tr't4
t'uifelit4a frefility leatta ate atithtlip the levet ci...24,,Whej 'littaideau'oas, iql teyte*sl esie.1%%.%)t% teiei (Utica II),
retct ktoillia.4%, a 0.ate41 4c(f.,ittati!ef of 11.0 ttatA le* *vitt,Itiad that he cape% la teriklily lit reOle01 toetult Mat aituitte4 titOw Net ir* 11 violet pitt4 it, the 113,.;s'a (tei-%%et its at the r%+uisli,aftttet4rAultt iY t Iti/1612/1).,
lthe eet%aoa tawesao t3uoe4 taublitjt JOaqi tit 010itt11).N. tiuleatt ilt the't_etiaua 11,f1) 6f+4 itaiJoi,e 001e...71100a *III toetAatOitheil lot 1,11, t sL!ioir t.,tte ptijfet ti,00i ate frgulpi It k.4.44islicA tktthe Kit eau ut Lahti StatiatiCt (tialitt OW the
t t".±,f74ttfiri %41144it-4 f*,4=ti.tr:esptokci ta vit bisturvioall) fsaticvit4f t.:etitet toe t4txatioet Ntaliali, i 11!5),.
Citeq.,ili the iet.iaii4$ef ttt nit is Rate beet% tai,ett terot*1Ceria%%a ES.ute.ai4 ao)%4t% ea telleta %%t e( iae ft..)tetf, +.4.0;1 ; 144teceatt ycata ale lett iet the::Statitti.:41 Atilttail,rst the tinitedNtatet ettftc49 .11 ft:..,e Ceti:to i7).4 ate at.aile4reTti fi'Pe 11-7tefiti aif l tit tent la (lt.N tikdraAillt tttt t-rfoui1'4714), t)aia tot ego Ott peli,kt* ate f.te..1 ttt tthe 1.'titc.I'ltates tt S, Itofeatt t!r c t:efitut 1/75a).vforr,. twt%s ate ertset al11- ftIti tit the rotmalaticrti ut thet"tsited fated 1'4,1V ;UV: tt 11 ierau !tie t'ectiv.4t
tits "et tut ettct t` tetc-ts thc fait rise[ the 14.fge vihsh!trt faun ..?...suit the trattv b%.*.irtz ate t,otk teartittit t!.e pt it-he
thtIslIeat4+11C Weata.
tik4-4e 41;z1 brrti a !hell p1;0,% it tt-.41410 cre,,,arrt ar-.1 tAxit.adkA I% sit the last fr,w
'tThe tr( et.tIM cit atilvele 1 Itt,u,irtatioti ant!Pritigre eli'let tee, t4i re. othrt,el.Lt at liftltiUKer Nev. p4)1Wiet c,.st:Id asikr,f1v affc. 1 the tlivoqief :ofitl,ffligt ants it. t tt,ipg yeah,
1114% ttli 1u. cs t4,,th Salt tttaittagrt an.! tr,,attriaget. ttr tat let et to,4,,p;are ;ratite rforlr to di% otce.
25-

Cliaiji0i
A.Itoview i1 Otuo At34.4w3 UAL:* ii4ti4
lei d. ata1,1 ,6'r... al, aF',..it .- tr traizsairt) r,a1, i4i1,-..,artas-,.!. 17x,lI t. 41
4,...inkr, 4 4.c
OK% a:0 tr'rNC r- a. .4 *41/1-ai 1 1 a.. r c C-r .1a4a erzr- tr.!'
1, 41 .4e r a , 3 ..r. ty'4,a .- .\.4f, *at t-;ta..tt ti!ft- ,y if c at
c c f 4.at t cir tett,' kr.c
13 Jzia air 11,kal:..rtrst s*c ,:cl,rtr tri, , at: , ir,: r C',. 4: F. 1 14-; ; ,riI. I4ir r .3,4 Vi c--Y., ,!!rt tat "p-ft.., vf/ir
4.!
art ',tate :..t.c,1 ! r4. .rt f- ,Iretrrt ,;
,14yi afrt1'.r e tr..?1,rf ,
1,4 t'-rta- trat,--4.. it .4 to O'ata !to°- teir4att at at_ t' c !,?-ctiv-,34c1, r.r .-4.4 41 a.
1 144;1 litrf tr, ov- ',.tttt.rate' 14,rff'"i4-'t '14 tvi3+, f, t r.
ff,ctt. att. t''rcc atrF.,,t,rt .4 tt.t4 ral t4 'ac;
I. ffr.3!-crt...,ricctc4 ,!-414 trite!*,1,, v,!7i,41 e,;-10. tt.ISJI!,t ttr: Iialr
tte,sarnr,1 to 42'4r l'!" ;-.,e 44 r tetlt of toors. tyt.rs .'f r..t.r
2

3. Federally sponsored surveys of the general population which are
national in scope.
In order to support comparisons of different data sources, a standard format.was adopted for describirfg each data source, in terms of the followingparameters:
. 1. The purpose, date, aqd sponsor of the data source;
2. Respondents, sample size, and sample design;
3. Type of drug investigated;
4.. Highlights of tbe tesults/findings; and
5. Limitations of the data base in terms of its potential usefulnessfor projecting nonmedical drug use among young adults.
I. TREATMENT-ORIENTED DATA SYSTEMS
Six treatmeqt-oriented data systems were studied:
'1. Drug Abuse Warning Neiwork (DAWN)
Purpose. Project DAWN is a Federal program jointly funded by the DrugEnforcement Administration (DEA) afitAhe National Institute,on DrugAbuse (NIDA). DAWN has been in existence,since 1972 and was establishedto monitor the consequences of drug abuse using two indicators, emergencyrotSm visits and deaths. k
Respondents and Sampling. DAWN collects its information through episode*reports provided by selected hospital emergency rooms, crisis.centers, andmedical examiners. In order to be eligible, emergency rooms must:
o* Be open 24 hours per day;
o Be located in non- Federal short-term general hospitals (specialtyhospitals, hospital units of institutions, and pediatric hospitals areexcluded); and
ro Have at least 1,000 patient visits to the emeegency room per ;ear.
At the end of 1978, over 900 facilities were supplying data to the program.
Reporting facilities are concentrated in 24 Standard Metropolitan StatisticalAreas (SMSA's) which are not randomly seleE'ted but are chosen to accountfor approxirnately°30 percent of the population of the U.S. in geographicallydiverse locations.,
Drugs Investigated. DAWN distinguishes 'between drug "episodes" and drug"mentions." An episode is a-contact with a-facility or a medical examinerfora drug-related emergency. A "mention" represents a drug.involved in anepisode; there may be one or more drugs mentioned for each episode.
27
16 :

DAWN has a vocabulary of approximately 3,000 substances which have beenmentioned in relation to incidents of drug abuse. These substances aregrouped'into 99 therapeutic glasses based on the National Drug andTherapeutic Index.
Information Collected. 'DAWI1 focuses on the drug users and the drugs usedby having a reporter in each participating facility complete a report foreach drug abuse contact.
Data/Results. DAWN results are presented system-wide as well as bySMSA. Highlights from the October-December 1978 quarterly repo?includes
o In the quarter October - December 1978; the frequency ofmentions by therapeutic class was: tranquilizers (22 percent),alcohol in combination (13 percent), nonnarcotic analgesics (10percent), nonbarbiturate sedatives (8 percent), and narcoticanalgesics (8 percent). This order has remained the same sincethe quarter January - March 1978.
o The trend of marijuana mentions peaked in April 1978 and steadilydeclined in the remainderiof 1978 to reach the 1977 level.
o Of the 745 deaths reported, 837peicent were drug-caused. Thefive drugs most often associated with drug deaths were, in order,alcohol in combination, d-propoxyphene, heroin/morphine,diaze'pam, and secobarbital.
o T.ogether,the hallucinogen PCP and PCP combinations eclipsedLSD as the major hallucinogen of mention in the total DAWNsystem, accounting for 73 percent of he mentions in its drugclass.
o Between 1976 and 1978, death reports of abusers in the 20 to 29age range fell by 5 percent, while reports of abuser deaths in the50 and over range increased by 4 percent.
Limitations of Data Base. some limitations of the DAWN data collectionmethodology includep.
o SMSA'ste not randomly selected;
o All facilities in participating SMSA's are npt able or willing toparticipate;
o Only people who seek treatment for drug-ielatZroblerns (orwho die as a result of drug-related causes) are included in DAWN;and.
o The DAWN reporting base (number of days per month, number ofreporting facilities, degree of saturation) changes constantly.
-e
17

2. DrilrfAitch
Description. Drug Watch is a DAWN-related system for monitoring recenttrends in drug-related medical emergencies and deaths. Drug Watch utilizesthese incidents as indicators of the changing extent and nature of drug abuse
Respondents and Sampling. Drug Watch-focuses on reports by a select groof approximately 600 emergency Vooms and 100 medical examiners that d
have participated in DAWN since January 1974 and have reported for atleast 90 percent of reportable days. The panel is not selected to be 11
, geographically representative, but it does have reasonable geographiccoverage. Because Drug.Watch uses a select panel, it is clear that changesin the trends observed are not attributable to changes in the reporting base.
Drugs Investigated. Because interest is usually in charting trends in theactivity of major drug classifications, Drug Watch monitors a limitednumber of broad drug, categories, such as barbiturates or tranquil'
iers. If
there is an interest in a particular drug, more detailed informati on thatdrug will be prepared through Drug Watch.
Information Collected. The Drug Watch coMputer program reviews reportsfor each drug group during a 26-month period. The reports are thendistributed by month, and monthly totals are cpnverted to 3-month movingaverages. The results are then graphed by a high speed line printer. Thesegraphs comprise the bulk of Drug Watch reports.
Data/Results. As previously mentioned, most Drug Watch data arepresented graphically. However, some examples of results presented inDrug Watch, July 1977, include the following:
o Based on reports from emergency rooms from November 1974 toOctober 1976, tranquilizers, were the most frequently mentioneddrug, with 73,340 mentions or 24.3 percent df total mentions.
o Inhalants wete the least mentioned drug in emergency room-reports, with only 1,486 mentions, or 0.49 percent of totalmentions. °
Medical examiner reports mentioned heroin/morphine mostfrequently, with 4,093 'mentions or 19,4 percent of the total.
o Cannabis was least mentioned by medical examiners, with only 14mentions, or 0.07 percent of total mentions:
Limitations of Drug Watch Data Base.
o Only people who seek treatment for drug-relay d problems or whodie as a result of drug-related causes are includes;;
o The use of a select 'panel limits the reporting base so that it maynot be sufficiently broad to accurately reflect trends in drug use;
and
18
29

The panel is not selected to ensure geographicalrepresentativeness.
3. Client Oriented Data Acquisition Process (CODAP)
Description. CODAP is a required reporting process for all drug abuse wiltsreceiving Federal funds for the provision of treatment and rehabilitationservices. CODAP is fuhded by the National Institute on Drug Abuse and isdesigned to collect data on clients admitted to and discharged fromtreatment for drtig abuse.
Respondents and Sampling. CODAP admission and discharge forms areo completed for each client admitted to a discharged from these clinics,
regardless of the source of funding suppor for any particular client.CODAP Client Flow Summary forms are su mitted each month by everyclinic that reports through CODAP.
DruRs'invest igated/Inf ormat ion Collec ODAP reports include:
o General notes and an overview of trends in client drug problems;
o Trends in client demographics and treatment data for all clients;and
o Data on clients reporting use of opiates, marijuana, barbiturates,and amphetamines as the primary drug, presented in relation tosuch client characteristics as geographic region, age at admission,age at first use of primary drug, race/ethnicity, and sex.
Data/Results. Highlights from the Trend Report of January 1975 throughSeptember 1978 include:
Marijuana abusers represented 16.8 percent of all clients in thefirst quarter of 1975, declined to 7.9 percent in the third quarterof 1976, and then rose gradually to 12.9 percent in 1978.
There were great differences in the relative proportion of opiateabusers among the various regions. FOr example, in the thirdquarter of 1978, opiate abusers represented 60.7 percent of allclients in the Middle Atlantic region, while they represented only19.4 percent of all clients in the East South Central region. It isimportant to note, however, that regional differences may be dueto differences in the types of clients from region to region.
o At least 50 percent of all admissions were between 21 and 30years of age.
o CODAP clients were predofninantly male: The relative proportionof males decreased slightly, from 74.3 percent of all admissions inthe first quarter of 1975 to 71.9 percent in the third quarter of1978.
19

Limitations of Data Base. Limitations inherent in CODAP's data collection.methodology include:
o Only persons who seek treatment for drug-related problems at afederally fundecreatment facility are included.
o Developing patterns shown in data are generally of smallmagnitude.
o Changes observed during a single quarter may be misleading andmay not be sustained by subsequent data.
o Each admission reported does not necessarily represent a'different client; to minimize the problem of multiple counts,reports representing the transfers of a client from one clinic toanother are not included in the data.
4. Drug Enforcement Statistical Report
Description. The Drug Enforcement Administration of the U. S. Departmentof Justice publishes the Drug Enforcement Statistical Report. Thispublication is designed to be a reporting vehicle; no attempt is made topredict future trends. Data are presented by both calendar and fiscal year.Calendar years 1975 through the third qua'rter of 1979 are included, as arefiscal years 1976 through 1979.
Information Collected. This document is divided into three sections:Enforcement Activity, Drug Abuse Indicators, and Organization and TrainingData. The first section, Enforcement Activity, present4 data on suchsubjects as domestic drug removals, port and border drug removals,drug-related arrests and defendant, dispositions, and arrests of aliens in theU. S. for drug offenses. The Drug Abuse Indicators section includes data on,for example, national illicit drug retail prices, drug-related deaths andinjuries, and federally funded drug treatment admissions. Much of the datain this section is collected through the DAWN and CODAP systems. Thelast section, Organization and Training Data, presents statistics on thenumber of DEA personnel and field offices, the number of DEA agents andinvestigators, and the number of DEA training facilities and activities.
Data/Results. The data highlighted in the. Drug Enforcement StatisticalReport which covers the period from January 1975 through September 1979includes the following:
o Total DEA domestic drug removals for calendar years 1975through the third quarter of 1979 were highest for stimulants.However, for CY 1978, removals of hallucinogens (4,349,917dosage units) exceeded stimulants removals.
Limitations of the Data Base. The data in this report have a limited use forprojecting nationwide drug use, first, because only cases of drug useidentified as the result of a drug-related legal or medical problem areincluded..In addition, the majority of the data presented here arecategorized'according to the type of drug involved, rather than according to
20

User characteristics. Finally, those data prennted here which are takenfrom DAWN or CODAP data are subject to the limitations already describedthose two systems.
5. Regional Drug Situation Analysis
Description. The Drug Enforcement Administration of the U. S. Departmentof Justice compiles the Regional Drug Situation Analysis on the followingregions: the Northeast, North Central, Southeast, South Central, andWestern regions.
Drugs Investigated/Information Collected. Each regional analysis documentcontains a summary of nationwide data followed by data speCific to theSMSA's in that ,particular region. Each document Includes the following data:o Some significant nationwide and SMSA-specific data (4, numberof deaths, number of injuries, number of treatment admissions)
for the following drugs: heroin, cocaine, hallucinogens, stimulants,and depressants;.
o National and regional drug thefts, by number and volume;
o Retail heroin price and purity index,,poth national and by' region;'o Drug-related injuries and deaths, nationally, by region, and bydrug;
o Lab seizures by drug and by region; and
o Drug mentions by drug type and SMSA.
Data/Results. Examples of data presented in the Regional Drug SituationAnalysis are exhibited in tables 1 and 2 which follow.
Limitations of the Data Base. Many of the data presentid in these regionalanalyses are taken from the DAWN and CODAP systems and thus aresubject to the limitations already described. In addition, there is very littlebreakdown of data by user characteristic in these documents.
6. National Drug Abuse Treatment Utilization Survey (NDATUS)
Description. This data base is composed of statistics similar to thosecollected by CODAP and suffers from many of the limitations inherent inthe CODAP data base.
Unlike CODAP, NDATUS Collects data from all known treatment units inthe U. S., Puerto Rico, and the Virgin Islands, regardless of their fundingsource. The data are collected annually for a point prevalence period (i.e.,for a given point in time). The most recent published data are for April1979. Before 1979, data were collected only for drug treatment facilities;however, in 1979, the data base was expanded to include alcoholismtreatment units as well as drug treatment units.
21
32

Table I
Age at Time of Admission to Federally Funded Drug Treatment
Programs, 1978 (Regional Drug Situation Analysis)
Northeastern North Central Southeastern South Central
Re ion Re ion Re ion '
Nationwide SM91 SMS4 7-4611
U ver 18 11.4% L. 8.4% 5.8% 21.2%
18 - 25 38Z 38.3% 34.5% 39.5%
26 - 44 4)(1% 45.0% 55.4 35.3%
Re ion'
as
SMSA
Western Re ion'
os nge es
SMS4
5.5%' 5,0%
39.5% 36.0%
50.1% 52,8%.
5.0% 6,3%
3 :3

'r
Table 2
Average Number of Druitelated Deaths per Quarter by Drug and
itiegion, 1918 (Regional 1)rug Situation Analysis)
Northeast North Central
Frio!'hoiltheastern
417)17114171/37
South Contiill
a ax Hmvrc
western
to reiS77171Aoston ---16-YorkNat ionw tot , i SMSA 941 ¶M A S4SA `,ASA ' 9491 !KA
Heroin 142 215 20 14 1,5 2 2,0 ,5 41 . 16
Cocaine I 0,8 0 ,25 .25 ,11 ,81
Hallucinogens 20 2 ,5 2,3 ,8 0 0 ' .4 La 1.13v
Stimulants 61 4 6 4.5 1,3 1 3 2.8 240 k 148
Depressants 406 12 a.5,,,,,
* a
Indlcotes fki listing far that drtig type, or no deaths for that drug type,
34

Datafitesyitt. In 1979, 3,590 drug abuse treatment units participated In thesurvey, which represented 94.7 percent of all known drug treatmentfacilities. The data related to the number of drug abusers are summarizedbelow.
o There were 202,6119 clients in treatment as of April 30,1979. Thisrepresented .a utilization rate of 85.4, percent of the budgetedtreatment slots,
Between'1977 and 1978, clients in treatment decreased by 9percent and the utilization rate dropped 2.0 percentage points.Between 1978 and 1979, the utilization rate dropped 3.6percentage points.
Limitations of tire Data Rase. Although these data can provide somegeneral trends, t ey are limited in their usefulness for estimating thenumber of drug users nationally.
As with all treatment data, the numbers reflect a unique subpopulatlon ofdrug abusers--those who seek treatment. From these data, there is no wayto estimate the numbet of users'who have neither elected to nor beenforced to participate in a treatment program. Also, the NDATUS data arenot presented by type of drug problem, a factor which is critical to makingestimates of the number of youthful users and the services they mightreed. Thirdly, the data are not organized according to any demographicfeatures of the clients. Therefore, projections for specific subpopulationsbecome impossible.
II. SURVEY DATA
Because nonmedical drug use is of concern to individuals in many walks oflife, a'host of studies have been conducted to investigate the problem.Often these studies are undertaken by State or local agencies or* schoolsystems. While data gathered by these studies can be extremely useful formonitoring the level of drug use in a particular localeenational estimate,cannot be based on these figures. Therefore, this report will consider onlysurveys of national scope.
The National Institute on Drug. Abuse has sponsored several nationwidesurveys in the past decade.. This section will discuss those surveysconducted by NIDA which have focused on special groups of respondents(e.g., )Tung men or high school students). The series known as the NationalHousehold Surveys will be the topic of the section that follows.
I. Young Men and Drugs=-A Nationwide Survey
Description. A landmark study was Young Men and DrugsA NationwideSurvey_ (O'Donnell et at. 1976). Data on the nonmedical use of psychoactivedrugs was collected in 1974 and 1975 on men aged 20 to 30 years. This Studyhad three characteristics that no previgus study combined:
o The sample was represeritative of the general population ratherthan of clinical or other special populations. ),
.0.
24

o All of the commonly used psyc.lioactive Irogs were studied in astandard framework, to allow comparisons between drugs inpatterns and correlates of use,
o Detailed information on the correlates and consequences of druguse were collected.
Respondents and Sampling. Data for this study were collected from October1974 to May 117i$ by personal interviews with 2,510 men out of an originalsample of ),024. The study was designed so that data would berepresentative of all. men In the general population who were 20 to )0 yomisold, inclusive, in 1174. The survey utilized a multistage stratified randomsample from Selective Service lists maintained by local Selective Servicehoards. By this method, all young men In the If. S. registered with SelectiveServicehad 4 known chance to be seleCted.
Drugs.Invest 'gated. Nine classes of drugs were investigated in this %todyitobacco, alcohol, cannabis, psyclletlelics; stimulants, sedative-hypnotics,heroin, other opiates, and cocaine.
Information Collected. The core of the interviews conducted for this surveyrelated to past and current drug use. The questionnaire included a series ofscreening questions to determine which drugs had been used, and how often.These were followed by detailed questions about drugs used ten times ormore. The interview also covered a variety of demographic characteristics(e.g., education, religion, criminal behavior, occupation).
In addition, there were two brief self-administered questionnaires to obtainfactual data and some indicators of attitudes and values..
Data/Results. The. data from this survey show that:
o Larger proportions of men in the younger cohorts than in the olderused all drugs with the exception of alcohol and tobacco.
o Median age at onset of use was lower in the younger than in theolder cohorts.
o Age is inversely related to drug use.
By the best estimates available,
o More than 1,000,000 men in the 20-30 year age range had usedheroin, over 2,500,000 had need cocaine, and more than 10,000,000had used marijuana.
o Of the men interviewed, 38.2 percent were currently (1974-1975)using marijuana.
o Men were more likely to continue using alcohol and marijuanaonce they began using them than they were the other drugs.
25

AO Of the men interviewed, 49 percent, of those With iii 1114 were
currently (11747117)) using inaripiana, while only 19 percent ofthose born in I14i were currently using marijuana.
$
Limitations of the Data 11asr, this data base is lion rd for a number ofmasons. First, it was intentionally limited to young, men, Second, it waslimited in its use of Selective service listsi it excl., eil piety who enlistedbefore age DI And stayed in the service beyond age 6 (they were notrequired to register), as well as any men who simply`faileil to register, loadditiOn, 4% th0 authors pointe e.; out, much of the analysis of these dataconsisted of comparisons of or part of the sample with another, althoughthere Was hi) basis to assume that all parts of the sample- wererepresentative of the corresponding parts of the popular on because thesample had not been stratified.
2. Drugs and American Youth
Descript This study wai begun in 1966 to exalhihe the i;hangingliiestyles, values and preferences of American youth on a tloolintious basis,A panel of 2,200 young men were followed for 1-1/2 years, trans the tall oftheir tenth grade year to the spring of their first year out Of high school. Asecond phase of the study involved surveys of male high school seniorsbetween 1969 and 1974. Drug questions were included beginning in 1970,Then, in 197% followup surveys were conducted with the entire class for fiveseparate years after graduation,
1,,,1.espLoodentsand Sampling. 1,793 males were tested in 1974. thisrepresented /1 percent of the original sample, which was drawn. to berepresentative of the national population of boys who were starting tenthgrade in public high schools in the continental United States in the fall of1966.
. .
Drugs Investigated. Drugs included in the survey were: alcohol, marijuana(including hashish), amphetamines, barbiturates, heroin, and hallucinogens.
Infor rile ion Collected: For each drug class listed above, the followingquest ions were asked:
o How many of your friends would you estimate use the drug?
o How often have you done this during part or all of the last yearfor other than medical reasons?
o Previous to this past year (that is, before last summer), how oftenhad you done this for other than medical reasons?
Additionally, opinions were gathered on the use of various drugs, and on theavailability of various drugs.
Data/Results. Although 29 percent of the original sample were riotinterviewed in this study, the authors conclude that the "populationestimates of such things as drug use were probably changed very little dueto,panel attrition."
26

Pertinent reasiltif tor the 010 414 ate as folts"St
o Tvierst)01se isefcent h4.$ used nststipian4 Sometiftte in OW
ri Vu other Mugs, usage et sometime in the past rerriteti from 1,1percent for heroin to 1 percirit for hi4litoCittodetili.
o thirty-four ;versant had used M4,110404 iltiflitt the year pot Afterhigh -school graduation.
t) hit other drugs, 1.1petcerst had used heroin in the past year and11,1* percent hail used hallucinogens.
Limitations of the data base, AlthOugli these data appeared to tiecoMpreheitsive, their usefulness for making notional prediction* was lin-iltedin several ways. first, Otero *all the problem of attrition and its relation todrug usage, fly comparing the retti4ltiint sample and the original sample theauthors Cone.tuded this was isot a- problein. Itoshe*er,kthefe WAS evidence 10ftlitiCate that dropouts *CIO tiftifetrePrelenleti In the sample and it wasdifficult to lasoi. how their drug use patterns may have differed front thein-school sample.
The other limitations of the data base have been discussed earlier so onlywill be mentioned here. the age range was limited. Ceographii dispersionwas not assured. Ftnaliy, the drug data were riot available for more thanone year.
1. Diiikt Ise Among, American liter School Students 1975 -19 peLuEs andthe Class of 1114: tehaviorst_Attitudesand Rec.ent tviatiorsai Trends
NaTitiln s /bet School t -ive- ear ationalrends
Description. All three of these reports (Johnston rt al. (977; 3ormiton et al.19794i Johnston et al. 1979b) are products of the protect, Monitoring the 'Future' A Continuing Study of the Lifestyles and Values of Youth. Thisstudy was conducted by the University of Michigan, Institute for SocialResearch. These three reports present data, respectively, on the graduating .
classes of 1975 through 1977; the graduating classes of 1975 through 1978i andthe graduating classes of 1975 through 1979. Each of these reports presentsdata on the following general topics;
o Current prevalence of drug use among high school seniors;
o Trends in drug use since 1975;
o Grade of first use;
o Intensity of use;
o Attitudes and beliefs regarding various types of drug use; and
o Perceptions of certain relevant aspects of the social environment.
-1(
27 /
36

tic t iCA ifc Ii saa.tC pi, 10-e ;A Ii *iidati44i aii,lidtet..14 .4 ti ..2C -44S
a 41i itirt4i 64.2i4 katir tAtAr4et:
ket=;?ai e 4,43 Ii,A1 .i.;-#11.ct ifk4 e it-4A i1
lit),altto,c,,4f )
(c)cl) attic) Iftaii ig4*.:a,,,,c,-,114 at vi CactrrT1 tL
vivh.e.i.pfct C2`C ,A2C4 f..2 411 Ii IC yip a, ala eie .41c, Ic3 ti NitT,rzrrvii.44 i Ike sirt...;:t t4z
V2,1.2, Aidei) 1;1 i,ti-It3iC tit 1.4
.4
i+Ac4 ra,N (c),r):( f,411c1 4:rate * ja tL;i
/A4ii 111g 1,i(ai C3.4% ,a4tv4iiiat#-4 ONiii.1 stcOie
3t J tf.e, ic tt etc444i,,,,t.11,:e ,41(ri ri
c.b urte, be ;xi iFte .!.412n tC,, 1!,11 ie et wt,441 Clui c .at
44:,4 4, 4,4 la,/ trt a z tcic, ti,i) laztil9117,,t 4.41 b IT IC4 ,f l:.!
ravvir tarigritiz Ct C aztiv-,11,e ra, IA iv 1.4 I i.c iI at t-Uf, g; the $.1,ii;C h a in AS
:4t 1,1 'IC 14,r, Vi ,.-!,47,4;11! sgf i+ +.8 4'2 (*.al Fort
tale 14r 4-Cat Airt ar.t.,1
rr 0.'f'-'43 crethit
At.) 0-Ct titt.-..,.1.1,2 21,.1.22;. C2. CI 2.P 1 eti..te%, Cf C
C s,
Mita 'arts', g, 4,1 !Iss, +.111Sc-fre.,tlIf4rC Ii :21 .4,2 :34 e1ei C CtC rtyl,tc: lett-r-x, ot Ic
t r)- r 1.11' I., all f.4,:-2; an1142r1.11-;;CI ,!1"%I.F tilt' it .1121.:VV6C1 rf
(2,41.4. 4, Of C .11'1.0-1,1,
Of .04c. icr...;:qt I I r tr Li thrit al t,.1 1.rf cWZ L.,1 11,3
t, prf rnt a 1.,1 all ill:, ;I(42 prt, rftl 4.,111,';` Vi 411,c-ft 11/5
fw.r ulr..1 041,i) itlattri.arla.
140-4e,`;':y 0,-.^.ird t!'t, rt 14)1 t!l,x;F2t I1I le^t1
i;nj ati ittars):14.1L4 at ..-c:!;:r III! C.

w 8i, bit Li Me &At./ 11Sh 11 tlit4 .7741./reitt crti alt IEitt t latt, 17$, 11 pieta er.i of Mc kto4) tit 1, skikki
tme4t vett kit If t IdaS 4;1 tctiooiltsti tiSe 10i lficli 111ciii+41.
Itch/4i *A* the irf-Kibi iiitic+14c.crAlty u4esi r2Jautjamll f. tAti+.efil Stifre 4.4i4j/1t ii+ flit* a- 1.i tacit ekkt ffe
Ckef
tft geaketal,
t/014,1,..4IiAii kid it,...1ct tItaki feti,Alts tacit iut,eciederci331) hoca*7 e*,t 44,0, ttotteivt, f4r&IS r-qt=44
iitkito,itlikitit kit tt,alt.k fepg/itek, at ttazt Si./4 -C illia iti,se ail 114.4./i Mee. 14E1 leaf,
01:1**tit Vit 100 1 st4 lftefp too} Oitti 4 vik411 tikk-teisi4plutar4 "OW ,,,/zor-4 agigh-C it titsictiNsifia, +with
itrsalrsCr titint viii) I pcts iftic egtt to ittsrtk re =l1 tNyllsicesis 17,"$ a! 14 1'09
pe-tt rot Iftt)*+,.. 4 vett r-st 1,0 ;S iteft. (rat),
t.drtttatiif -a .if tfiet4t4 the taki rtisscht Matta iilArfent in ifds:less: 1,,we t:,ifIN Nt,it.4 Seiii,41 0/.4 fhe
ad!ikif,ittralicii it the eikiettti,tutite iii the glAtattliitek. At lite autt.*IhiM It.c!..5.4.1, aSa Itfa$td klikviLot tO ,,-!Q trft C1111 e4kate t tthof 1) wild abzerttet., I1 it liSett 11,41 tr.oit ittopt.tif t zkikkt altxrrftla sif.i.aacte, frtulifls- at,zei%t *etc ihc,te 1:i.tly lti hr insolvt,O iti dt-ut tosg than theitrOtaii.04.4 Nitti W(Nt...4 14-0,10#1. thivevet, the 4kithOt.t hole thAt thintit4t kkok:Id kp.ikte iteba!d, trtisaJty Lt-,e 13,k,t, !too, )rat to leaf, thkiI matat lel **tea ireful itata. tii at.Y411011, 11 is ifttiCkt1a111 c".1111' 1Itssi IFw
14111;:ete frau-0 the tii.e4hokik!WrItClaftrt Ittr4Q1 t.iat1011.4"0,.e Sete* Ic-41 It4 0,414 1.1:,lic.:11./A.
tkortet, 'atte,1% Weir at sithw-11 t tet,;Ace±a!ettli !;41tt,1441p-t tty!t-. ll.l1 1.4rt,041,4 ti trtN.et!..
III. 111E NA l'IoN AF. St t #11
Thr data !;..aka kkt,ikt AvikrAtt to t,t,Atige the t.l.tti c oxltit1t111 Utt. tt r ,11 tItugeatai,,s kokit.1 40,411 41 thr tOVkal ".01r11- ,,nt.tko,
tIvAlkerft 1-0,% .30-4 rill, iNefe are laic iti..kliet ill this srftra..' **Tt*pe fifsi,f west turtr ct..!/c test It 11.stt.!-/L.S.r4Ni g The t-1,01,1 tr.( eft! Mfrs. carte c 04.0tik Irk' 10( 11144. SAt{t'4411/11lIttite i = =t Oft.r. _Atvwsts. TN' tit(' t%tteNt'l Aft. rt.-lint-I!:
71 Atts t TOtt.Atti (PtItlitNeNt its
19;': 11r t.f.. F All tut!e tanktVrlatet1A'T--Tf -Act, 1ricerill airoil Aisaltt. In 19/i.
1/ 1974 slue); Pu1:1:f I tit! 1.1er:re with rtyt.t,/,:ir tile 4utllaticet.° 11'1,t,11 ttatt$1;-1 1975:1
4 0

°
4) 1976 study: Nonmedical,Use of Psychoactive Substances.(Published in 1976.),
5) , 1977 study: National Survey on Drug Abuse. (Published in 1977.)
These surveys share several critical characteristics-which contribute totheir utility for estimating drug use:
- o Data collection on the "at risle18-25 year age bracket;
o Adequate and consistent sampling methodology;
o Comparability of drugs investigated;
o Comparability of question format's; and
o Accessibility of detailed tabular data.4 .
Ekh,of the five 'studies is discussed below to demonstrate its adequacy as adata base for projecting the number of drug ussers'in the United States infuture years.
Public Attitudes Toward Marijuana
Description. The data from.this.1971 survey were sought to provide a basefrom which policy-relevant information could begathered. The study wasplanned to. cover three aspects of the marijuana issue as well as selectedother substances: (1) attitudes, feelings,and beliefs relative to marijuana andother substanceS, (2) knowledge of marijuana and other substances, and (3)the, relationship between attitudes, beliefs, and behavior and. certainexplanatory variables.
Respondents and Sampling. A nationwide probability sample of youth (age12-17) and adults (18 and older)' was selected for this study and yielded2,405adults and .781 youth. The adult data were further' subdivided into thefollowing age categories for analysis: 18-25, 26-34, 35-49, and.50 and over.Young adults were considered to be Particularly- important for a drug usestudy; therefore, young adults aged 18-34 were oversampled and adults' overage 35 were undersampled. The data were later weighted to compensate forthis oversampling.
Drugs Investigated. Data were collected on the following drugs: alcohol,tobacco, marijuana, specific pills, cocaine, LSD, and heroin. However, the
. emphasis of the study was, on marijuana, not on other drugs.
Information Collected. Three different types of instruments were used inthis study:
o A face-to-face structured interview for adults;
o A self-administered questionnaire for adults to completefollowing the interview; and

o A self-administered questionnaire as the only instrument for theyouth sample. .
The majority of questions in this study concerned, attitudes and beliefs,about marijuana and selected other drugs. However, severalself-administered questions were asked about usage of various drugs. The
f-administered questionnaire also gathered detailed information on thejse ,cumstances surrounding the respondents' initial contact with and/or use
of marijuana. Table 3 depicts certain questions which could provide data onthe prevalence and incidence of drug usage.
,4
Data/Results
o Among adults, age 18 and older, 15 percent reported usingmarijuana at some timeotre comparable figure for youth, age12-17, was 14 percent. Fffle percent of adults,and 6 percent ofthe 12-17 age group classified themselves as present users.
o Highest experience levels: 39 percent of young adults, 18-25; 44percent of college students. There was a rapid falloff in reportedusage after age 25.
2. Drug Experience, Attitudes and Related Behavior Among Adolescentsand Adults
Description. The 1972 survey drew heavily upon the earlier report (PublicAttitudes Toward Marihuana) in forming questions and in providingbackground information about the drug abuse problem. As with the previoussurvey the majority of questions were asked during a personal interview, butsome questions were selfradministered.
Respondents and'Sampling. The sampling strategy' wasthe same 'as'for the *,1971 survey, with the exception that the sample was designed to oversamplethe 18-29 age group. The number-of adults interviewed was 2,411, and thehumber of youth was 880. '
Drugs Investigated. The following drugs were included in the survey:tobacco; alcohol; ethical4 and proprietary5 tranquilizers, stimulants, andsedatives; heroin; cocaine; LSD; marijuana; glue; and methadone (knowledgeonly).
Information Collected. The questions asked-in this survey covered admitteddrug behavior as well as attitudes and knowledge related to drugs. Theusage of pills was covered in the face-to7face interview, while the usage ofother drugs was covered in the self-administered questionnake. Table 4;below, presents those que'tions which are critical to estimating the amountof youthful drug use and the specific drugs for which they were asked. Dataon pills were included only wheri used for nonmedical reasons.
'Data/Results
o Overall reported experience with marijuana was about the sameas in 1971, 16 percent of adults and 14 percent of young peoplehad had experience with it.
31
42

Table 3.
1971 Survey! Critical Questions Asked About, Specific Drugs
CW
2 I/7
41-1 C ,01> a)
0 4-1r 4/ 0
0) 4-) 10 g 0> IA
li
S H
0 in 0' ° Fi ,c0)
, 0 '1> 0P014 ) Ii) .!. 0 .-1 "
1 N14 N (0
1 , 0 01N 4-) VI 4t .
, 0:1 .ri 10, .1..)' W '' . C.)
''. 0 ,-1 01 ri 0 i 7,11 15 F0
0
N
.4.3.-1
U0 1,1 7 W 7 7 4) .-.1 E C 0C.) .0 . 14 0' Jd "1 0. '.1.1 2 4-I 4-1
al 0 0. q, JO LI o w
CO
71+ , , 5 il .,i 8 P, 5'0 14 1-i a . ra 14 ra 4.) 0 , wr m.1 ct 0. 4-) ,0 E I co In E LI i.1 1
Duestiphs
Have you ever used (drug)? X X X X X X X, X XXXDuring the past 30 dayS, on h6
any days did you use (drug)?
How'old were you when you' first
tried (drug)?
On the average,' about how often
do Ou use (drug) at the present
time?
About how many of your:friands
use (drug) at least once in a
while?
Xt

Questions
Table 4
1972 Survey: Critical Questions Asked About Specific Drugs
C
0
0
When was the first time that yoU X X x X
tried (drug)? About how old
'were you?
How often do you use drug) at the X X
present time?
When was the most recent time you
used (drug)?.
About how long ago did you have X
(drug), for the first time?
lEver tried (drug)? XXXI X X X X. X X
During past 7 days did you use
(drug)?
X x x
'Data on pills are included only for nonmedical use.
44

d Four percent eif adults and 4 percent of youth used marijuana atleast once a week.
o Of all respondent characteristics, age was most markedly relatedto marijuana experience. Consumption peaked during ages 18-21.(55 percent of that group had had marijuana experience) anddropped off rapidly after that.
o Trials of other substances were reported as follows%
LSD/otherAdults Youths
Hallucinogen 4.6% 4.8%Glue/inhalants 2.1 % 6.4%Cocaine 3.2% 1.5%Heroin 1.3% .6%
3. Public Experience with Psychoactive Substances
Descri ption. The 1974 survey included some of the same questions asked inthe earlier surveys, and at the same time expanded its coverage of patterns 49.of drug use. As with the previous surveys, a combination ofInterviewer-administered and self-administered questionnaires was
_employed.
Respondents and Sampling. As with the previous surveys, the youth and '.adult respondents were selected on the basis of a nationwide probabilitysample. In this survey, a slightly larger age range (18-34) was oversampledcompared to the oversampling of the 18-29 age range in the 1972 survey.The number of.respondents interviewed in the adult category was 3,071 andthe number of youths was 952.
Drugs Investigated. The-following drugs were incluck in this survey:tobacco; alcohol; ethical and proprietary sedatives, tranquilizers andstimulants; marijuana; hashish; heroin; cocaine; methadone; LSD; and opium.
Information Collected. The data collection covered botlaattitude and drugbehavior items. Sensitive behavioral questions were self-administered toincrease the perceived anonymity of the response. Less, threatening ,questions, including attitudes and some behaviors, were included in thequestionnaire administered by the interviewer.. The self- ministered .id--questions covered the patterns of drug use engaged in b the samplerespondents. Certain of these questions are critical for estimating theamount of drug use occurring during that period. Table 5 presents a list ofcritical questions and the dr4gs about which they were asked. This tableincludes those drugs covered in the self - administered' section as well as theinterviewer-administered section.
Data/Results
o The public had had more experience. with marijuana than with anyof the other psychoactive drugs studied. Nearly one adult in five(19 percent) and more than one young person in five (23 percerit)reported ever having used marijuana. This represented a slight
34
46

Table 3
1974 Survey' Critical Questions Asked About Specific Drugs
cv
t?4
Questions
About how long ago was the first X X X X X
time you tried (drug)?
When was most recent time you X X X
used (drug)?
During the last month, how many X X X
days did you use (drug)?
Previous Month, how many days X, X X
did you use (drug)?
Likely to use (drug) again? X X X X
Ever use (dru.g)?
XXXXX
X
X X X X X
46
X X X ^X
x x
lx
X X X X
, x,
X X

Increase for the adult population, and a marked increase amongthe 12-17 age group.
o Under half of the adults who had tried marijuana were currentusers (7 percent), while 12 percent of youth were current users.
o Aktng the drugs studied, experience with psychotherapeutic.drops was next in incidence to marijuana, with 13 Percent of theads I public and 10 percent of the young people reporting somenonmedical experience with an over-the-counter or prescriptionseoutive, tranquilizer, or stimulant.
o The use/ of marijuana, whether measured in terms of those whohad ever tried it or those who were current users, showed strongage relationships. In each instance, people aged 18-25 formed thehighest use cohort.
4. Nonmedical Use of Psychoactive Substances
Description. The 1976 survey consisted of two parts, a personal interviewand a self-administered questionnaire. The study is sometimes referred toas the 1975-76 study.
Respondents and Sampling. The sampling"procedure'remained the same;however, those individuals in the 18-34 age group were oversampled because .
they were considered to be the most likely to provide drug use data. Thenumber of adults interviewed was 2,590 and the number of youths was 986.An ihcreased emphasis was placed on the 18-25 age grouping and allimportant data were presented for this group individually. Therefore, dataare available on the following groups of individuals:
o Males/females 18-25;
o Whites/nonwhites 18-25;
o Not high school graduate/high school graduate/some college/notcollege graduate/college graduate/college,ttudent 18-25; and.
o Large metropolitan area/other metropolitanarea/nonmetropolitan area 18-25.
Drugs Investigated. The following drugs were inclyded in the survey:tobacco; caffeine; alcohol; proprietary sedatives, stimulants, and .
tranquilizers; barbiturates; sedative's; marijuana; hashish; glue/inhalants;cocaine; LSD/hallucinogens; PCP/Angel Dus9,beroin; methadone; and opium..
Informa Collected. The questions asked in this survey can be groupedinto two categories: factual or attitudinal questions, and behavior questions.
Table 6 presents questions asked about use of specific drugs.
36
47

goestions
Nave you ever used (drug)?
About how long ago was the first
time you took (drug)?
About how long ago was the most
recent time you took (drug)?
Curing past month, on about how
many different days did you use
(drug)?
Previous month?
Are you likely to use (drug) for
nonmedical reasons again?'
When it comes to using (this drug)
do you think of yourself as a
regular user or only an occasional.
user?
Table 6
1976 Survey) Critical Questions Asked About Drugs lisedlar
Nonmedical Purposes
Just roughly, how many times in
your life have you used (drug)?
X XXXXX XXXXXXX X X X X )(XXX X
XXXXXX XXXXXX X X X X X X X X X X X
X X X X X X X XXxXX X X X X X X XXXX
X X X X
48
X
XXXX

Data/Results
o Among youth (12.17) more than one in five (22.4 percent)reported having tixe*Miarijuana, and more than half of these (I2.3percent) reported current use,kneaning In the past month. Faradults (age 18 and over) the pre'Valence rate (21.3 percent everused) was similar to that of youth, but adult current use rate wassubstantially lower at 8.0 percent.
o Among the adult public, young adults between ages 18 and 25 hadsnore experience with marijuana than older adults, age 26 andover. In fact,'more than half the young adults had. usedmarijuana while about one In eight older adults had used it.Those age 1.8 through 25 also had higher current use rates. Fullyone in four in this age group were current users compared.to onein twenty-five older adults.
5.- National Survey on Drug Abuse: 1977
Description: The majority of the questions in the 1977 survey haveremained the same from the previous 'year, to facilitate comparisons.
Respondents and Sampling. In this survey 1,272 youths and 3,322 adultswere selected for the sample. The sampling procedure remained the sameand included an oversampling of 18-25 year-olds.
Drugs Investigated. Alcohol; tobacco ;,proprietary sedatives, stimulants, andtranquilizers; methadone; heroin; opium; marijuana; cocaine; LSD or etherhallucinogens; and glue or other inhalants were all invstigated.
Information Collected. This survey included three types of questions:factual and attitudinal; nominative; and behavioral. The factual andattitudinal questions primarily covered familiaritY with various drugs andopinions about marijuana.
The nominative 4echnique was developed to provide additional Informationabout heroin use. Since the reported levels of heroin use in a population areso small (.5 percent-1.4 percent), it was considered necessary to gather asmuch information relative to heroin use from the sampled groups aspossible. Therefore, in addition to asking the respondent directly about hisor her own heroin use, he or she was asked to report on the heroin use (ifany) of close friends.
As a partial cross-check on the heroin use'data, the respondents were alsotasked to indicate how many of their friends knew for sure that they hadused heroin.
The third type of data collected was behavioral. Table 7 lists thosequestions which provide estimates of the amount of drug use which wasoccurring in the population.
38
4j

TWO1111 $orvoyt Crhlr al 011011i01)4 /AO About Spocitic Nuiti
t
rl,
',4AN. V
4
8 ''''' 't; ..'1.1 13),, : fi, ,,I,:1:1. -t.'t t't'i t.1
'tti 1 q:,?i, , 4, i I 1 T:' l',.. (.1 4 1.4 , . li -i ii - ;
gileiciall .:.....
1100 yOU 0ver used (drug)7
H( ft)(t) (OrIXO diliyi
Al4Xit how Will 4)) 100. th4 first
tImw you WO' (drug)-!
About how long k) was the must
recent time you took (drug) ?'
Durihq the past month, on about
hOw many different days did you
use (drug)?
'Oleo It comes to using this drug)
do you olni or yourself as a
regular user or only an occasional
user, or a non-user?
Just rourply, about how many times
in your life ha4e you used (drug)?
which (drug) tried first, second,
itc,?
X X K X K X K K I X X
X X X X A X X
K X X M X X
K X
(')( x X X x
50
X X X X
X X

Data iltestilts
0
More the one-fourth (214.2 percent) of youth (age 12.17)reported It 1401114114 experience and about one-sixth (16.1 percent)reported current OW (in post month), foi actin* (age la and ova')the lifetime prevalence rate (24.) percent) was somewhat lowerthan that of youth, and current use (A.2 percent) was half of thatreported by 12-17,year. -olds.
It is important to note that marijuana experience was stronglyrelated to age and that the highest prevalence was found in 18-25year-olds. Of this age group, six In ten had used marijuana,compared to fewer than two in,ten adults 26 and over.
0 Young adults also reported,,greater lifetime prevalence In. the useof halluCinogens, with 1948 percent reporting use at some tinteascompared to 2.6 perceni of older adults.
o Use of a drug "stronger" than marijuana (and/or hashish) wasreported by about one in four young adults, one in ten youth, andone in twenty,five older adults.
6. An Index of the Number of Dru. Abusers in States and Major Urban,,reas
Description. This study was conducted in 1971 based on the 1972 datacollected for Drug Experience, Attitudes and Related fAellavior AmongAdolescents and Adults. The purpose of this study was to provide data ondrug abuse for geographic units smaller than the whole U.S. The nationalsurveys discussed earlier provide reasonably good estimates of the.numberof abusers in the total U.S. population; however, the structure ofthesampling plan does not allow for State-by-State estimates with the samelevel of precision. The procedure of the current study involved consideringfactors which were related to drug use (e.g., age, region of the country,education) and 'estimating the number of drug users in each State based onthe number of individuals having had each of the critical characteristics.
Respondents and Sampling. The entire sample of adults (2,411) in the 1972survey were used in this study. In addition, a subsample of 418 youth (12-17years) were selected. This subsample represented all youth who wereinterviewed in a household Where an adult also had been interviewed.
Drugs InVeStigated. Marijuana, cocaine, heroin, hallucinogens, and volatilesubstances were investigated. These drugs were investigated individuallyas well as grouped as follows: one or more illegal substances; nonmedicaluse of ethical sedatives, tranquilizers, or stimulants; nonmedical use of oneor more psychotropic drugs (sedatives, tranquilizers, stimulants); one ormore illegal substances
4kandior medical use of psychotropic drugs.
Two risk factors were also included in this study: ever used and current use(within the past year). .
Data/Results. A regression analysis was conducted to predict usage ofspecific drugs according to certain demographic and locational
40
51

chafitclef Wit M4tikiangi Sii8% the drug tiff which the t-onsteilation ofCharacteristics predicted best. !toughly ;7 percent of the sarlance inrnarituaita tisage fever used) was accounted for by the totIgniing fattat)le44(ageiedderstion4 sex, race/ethnic group, family income, community typesregion, and percent of population in college iturnit tortes), The 6tronor41'predictor Appeared to be whether the individual WO between 1$,Jk yearsold 410 a 4tude#11, 14-lige of do-10 Mho' than "44410:014 w45 predicted inta-tiless successfully,
k)ok r the regression coetttetemy had been calculated, it was a simplematter to Apply then% to specific State data, add tip all of the weightedrifeiliCtiirS, and aditiat for State pi-4)00ton to provide an estimate of statedrug use.
Summary
The foregoing studies were re's/iv-ed Iiidge their adequacy as data basesfor esturiating the itumbs-r of youthful drug users in the population. Severalfactors were considered in 4iietiing each study's pOtentiat inetulnesy formaking projections, including: the resi)ondents selected for study, thesampling mettodology used, the drugs investigated, and the intormation.collected. Nisei) on these factors the following conclusions were derived.
Treatment-oriented data bases have one major advantage: the data atecollected routinely every year. However, these data bases are not adequatefor estimating youthful drug abuse for several (4.410as.
o The respondents are self-selected and represent a uniquesubpopulat ion of drug users.
o Geographical representation is not assured.
o Generally, published data are not reported with the level of detailnecessary for our estimates (e.g., age, race, or sex of user).
Therefore, although some of these data could possibly be used tocorroborate drug use trends, they cannot be the basis from which theestimates will be derived.
Also considered as data sources for the drug use estimates were thosehigh-Arzility surveys which investigated young adults and were national inscope. Those studies described in this review all contained sound samplingmethodologies which made them warrant further attention. However,there were several reasons why, as a group, these studies were not suitablefor prediction purposes:
o Generally, the studies were one-shot endeavors. Therefore, it wasimpossible to use the data tor developing trends.
o The one study that was continued over a period of time did notinvestigate the full age range of interest.
o The drugs investigated and the information coklected were notconsistent from study to study. )
41
52

Dos five national survey* Cut hailt.1 ti* itw Nali.itiai CottonMoo Iftoadt* 0(14 isistil:Jel*1 Institute oit ti.tug Atisibit *hares certaincliarac terittics *Nib fll c Mein *killable 1.4 otetliCiltid future iiiutu*O.
Stru*cyb hard leitiCal fCaitial .)wet if.etPatfiq4 dial they l3*Cr. tttey fiat* 4*C*1 iiiitarif *40404
rheils.itkiliiiit*, drug C1*2-1A*3. arulIttelfstA.1.)1C.Itt u*est hat consitterilly tY,e(eis6 lsours4 cite *filch hasreliable ats4 valid result*, Ala.), the siariipting 'tansy has adequateljt-uvetedthe moot geographical area* of the tNillies1 dates. Art' titer factor whichIna. Sic* theac 4io.liet part i.-.414filf useful is that generally, In the anely**,Mary highlight the age range of knit-feat, 1112S year*.
the id i. + the itii:orisistenc tea from year i.i year niahe II iittproolible1-0 Cillipary *.ii drub, f,TlAb.lbeb ctr AO typ i at lato-fht4Itaki liv OVerY Vc*, LBtrtiiffs a *Ugly it* tiler* weir' ift*i-i 14ottlerfoi. rof.iwr*01. the 1916alai 1122 survells, in par titular, pi..v1.14 a m.ealitl itf data *lift which toc`411ittiale the twit-1*f of 1$43 .tc41.-014 diut1 otatt* ill the fitiote.
The following, chapter preterits proiec %het% of drug exile for your**. adults inPrVla 110, arid 1441,
2
ti.-NottS
Reference% in this t tiapter appear in the list of Mug Ahuse f)ata Source%whit ti tiegins oti page Pi.
A silt!, survey in this series Naas conducted in l9,1. flowerer, the dataAre riot included in this review.
Please twirl while "inat)u.sts.2 it the act epted form of the words thespelling may change in the ((vase of this report in order to preserve thefortis used 1f1 the reference cited.
' drugs require a prescription.
' Proprietary drugs can he purchased totiftWill a pfriatf)f
42

eltdpitlf 4
P1010010fib of DruU AtAJOit
I N 1$/)1)11i.
rttr01 44"..ascairat../ a4, I; is V4C N4t0.4aAt .4.401 tcy 1C,.1 [tel. 1!atid 1, this o:3;=4/ 031; ta4tc. a-a.41,101; .1( Eitr te 16t 01444 c) 3. the fail1.0 Aria ta) Vitt N4ti,ts4; qaa
it,ost kilf°*, 1.14C11 = thr `,,ilaa4;41 1/0141,4(r iu th,46 Itc;
I Isiat vc)-3 Tcpaan 41 0±,,,,t 1,13C..32 r al ..%/: #t of;rifte ov...rtg s,14.14 I^--41- Litt. att. -..S1 114.c la/ oicA'ialtcicasicI jar* sir ii..atc.1 t i.t i1,..117101 01 1'i Pa .4,1 (7 3,4k tr)
' cart ;; 'f.1$; *rt iv0c4;t4.04,3 1K.44ie ar,t ata,,r)u014/ flf 4A0A, {:t1t..1!..Vt1:4
1 .11t1r. lift1.10t, A:1.1 ov,et1.1414 15-214 ;cat aro r 1,4 ail thew 0,,K
the s :111 rall0,31r3 0( 10,.1/11,-Ifk3 It 3t'af ra,ra !fir if 0:c4 La( ..1;),%c fat caroitr.) 4. CT 4- i arr!r. c.! the 1/2 :tit' el
thrtr an! Ira c:at of ,4/ 4q: cfr ax;;Istctrti: a:: 4.41c t'i!/..;40. Pl:7 v.414711 10( .1:t 4.4,c4 1.raq.41 41,4-4,,t4.,4C41 r4
(ct,o.c c
O c1,04, t,r r,*
0 ..14 tc.
..1.4.! !,4 r ,f -"rE41- 44 4.'4't1,. ate iat rtr4Itc vt, 4,4:c 4ac. ioaly ita,or's 10,0;
V. \Kilt ANA:
1. Orli r.
In rill, /-).1 )carlo!..312,r ,.'bast=11,-0 4raiis.iaa .;t 1.741r per,..44 Yie v,rif th-o N:1)e.it ,0 odmittr,l Zo ha% i4(r4;c11141 t!tr I.
tOf .;!...A 1174 catls.) ;Yet{ r,11,vr- t11:1.(` lot (hr thrr y rat: tr;:ay!..1.
3

Table 1Percent of Young Adults Who Had Used Marl uana:
.1974;1976, and 1977 Surveys, with Changes
18-21 Year -Olds 2245,Year-Olds
1974-197 thahge1974-197 Change:1976-1977 ange
C k52.8%
447.2%
50.4% 51.6%56.8% 6013% 7
+4.0%-2.4%+6.4%
+13.1%+4.4%+8.7%
Tab1e2 presents populalron projections for young adults in 1985, 1990, and1995. We uos d. a straight-line approach, based on 1977 reported rates, toproject lifeti e preyalenc arijuana for these age groups., Thestraight-line approach inv Ives mu lying the most recent reportedpreiralence rate (i.e., 40, percent as reported in 1977) by the projectedpopulation for various sub oups in 1985, 1990, and '1995. The,product ofthis arithmetic exercise is et of projection's-e'stimating how many youngadults in various subgroups wi admit to using marijuana in 19850, 1990, and1995;iri other words, we calcu ated the estimates presented in table 3 asfollows: '
.568 (reported prevalenc of marijuana use for 18-21 year-oldsin 1977) x'15,442,000 ( projected population or18-21 year-olds in 19S5)
8,772,000 `(pro, ected number of 18-21 year-olds in 1985 whoWill admitzto sing marijuana).
Using this same approa for 1985, we can estimate that 9,886,800individuals 22-25 year old will admit to some use of marijuana. EStimatesfor 1977 and projec n.s of reported lifetime prevalence for 1985, /1990, and1995 are presente in table 3.
In 976 and 1977 the National Institute on Drug Abuse also measuredlifetime preval ce of marijuana use among several subgroups of youngadults, including females males, whites, nonwhites, and young adults; livingin large metropolitan, ether metropolitan, and nonmetropolitan areas.' .
Table 4 presents the percentage of 'young adults within each krbgroupadmitting to having used marijuana at some point in their lives.
44

Table 2
Projections of Young Adult Populations for 1985,1990, and 1995
Year 18-21 .Year -Olds 22-25 Year-Olds
198519901995
I/ 15,442*14,50612,995
16,56614,491
13,820
:"4.,,,ot,
*Numbers presented are in thousands, and are based on1977 prevalence rates.
Table 3
Number of YoUng AdultsWho Had Used. Marijuana, 1977 Survey,and Projections for 1'985,190, and 1995
YearI
18-21 Year -Olds 22-25 Year-Olds
1977 9,632* 9,2611985. 8,772 9,989 .
1990 8,239 , 8,7381995 . 7,381 , 8,333
*Numbers presented are in thousands, and are based on1977 prevalence rates.
Table 4
it_Percent of Young Adults 18 to 25 in Various Subgroups Who Had
Used Mail'uana: 1976 and 1977 Surveys
Subgroups of Young Adults' 1976 _ 1977
Females 43.6% 54.4%Males 59.8% 64.5%'Whites 53.6% 60:1%Nonwhites 46.3% 54.4%Large Metropolitan Residents 58.1% 62.7%Other Metropolitan Residents 57.5% 63.2%
'141onmetropolitan Residents 36.2% 47.
45
56

Multiplying the 1977 prevalence rates by the population projections of thesesubgroups of young adults (see appendix A), we can project the number ofyoung adults (18-25) in 'Various subgroups who did admit to hoving Usedmarijuana in 1977 and who will admit to its use in 1985, 1991) and 1995.
Table 5Number of Youn Adults 18 to 25 In Various Subgroups Who HadUsed Marruanh, 77 Survey, and Projections for 19.85, 1990,
and 1995
Subgroups of Young Adults 1977 1985 1990 1995
Females 8,845* 8,652 7,833 7,229Males 10,633 10,386 9,416 8,724Whites 16,971 16,090 14,328 13,036Nonwhites 2,633 2,849 2,805 2,786Large Metropolitan Residents 7,947 7,767 7,036 .6,506Other Metropolitan Residents 6,231' 6,089 5,516 5,101Nonmetropolitan Residents 4,881 4,773 4,324 3,999
*Numbers presented are in thousands, and are based on 1977 prevalence rates.
4.,
Use in Past Month
In 1977, 30.4 percent of the 118-21 year-olds and 24.2 percent of the 22-25year-olds reported use of marijuana within the past month. Reportedcurrent use of marijuana for 1974-1977 is presented in table 6.
, Table 6Percent of Young Adults Using.Marijuana Currently: 1974, 1976
and 1977 Surveys, with Change
'Year 18-21 Year-Olds 22 -25 Year -Olds
1974 30.3% 20.4%1976 25.6% 25.7%1977 30.4% 24.2%
197671977 Change +4.8% -1.5%
46
5

Using a level straight-line approach to projecting current use in the 'future,we can estimate that in 1985 approximately 4,694,000 18-21 year-olds and ,
4,009,000 22-25 year-olds will be current marijuana users. Projections ofcurrent use In 1985, 1990, and 1995 are presented in table 7.
Table 7Projections of Young Adults Using Marijuana Currently,
for 1985, 1990, and 1995
Year 18 -21 Year-Olds 22-25 Year-Olds
1985 4,694* 4,0091990 ' 4,410 3,5071995 3,950 3,344
*Numbers presented are in thousands, and are based on1977 prevalence rates.
In 1976 and 1977 the National Institute on Drug Abuse also measuredcurrent use.pf marijuana for various subgroups of young adults (see table.8).
Table 8Percent of Young Adults 18 to 25 in Various Subgroups .
Using Marijuana Currently: .1976 and 1977 Surveys
Subgroups of Young Adults 1976 1977
Females 19.6% 20.8%Males 31.4% 35.1% IlkWhites 26.3 %, 28.4%Nonwhites - 23.8% 24.1%Large Metropolitan Residents, 29.5% 32.0%Other Metropolitan Residents 29.6% 29.5%Nonmetropolitan Residents 15.6% 18.1%
47

Table 9 presents estimates of the number 'of young adults In varioussubgroups who admitted to being current users of marijuana In 1977 andwho will admit to current use In 1985, 1990,.and 1995.
Table,9Number of Young Adults 18 to 25 Using Mari uana Currently,
,1977 Survey, and Projections fOr.198 and 1995
Its#
Subgroups of Young Adults. 1977 1985 1990 1995
Females 3,382* 3,308 2,995 2,766
Males 5,786 5,652 5,124 4,747
Whites 7,925. 7,603 , 6,771 6,160
Nonwhites 1,166 1,262 1,243 1,234
Large Metropolitan Residents 4,056 3,964 3,591 3,321
Other Metropolitan Residents 2,908 2,842 2,575 2,381
Nonmetropolitan Residents 1,848 1,807 1,638 1,514
*Numbers pFesented are in thousands, and are based on1977 prevalence rates.
Type of User
In previous NIDA surveys, respondents described themselves as regularusers, occasional users, or nonusers with respect to marijuana. Table 10identifies the percentage of 18-21 and 22-25 year-olds describingthemselves as regular or occasional users in 1974-1977.
Table 10Percent of Young Adults Using Marijuana Regularly or
Occasionally: 1974, 1976, and 1977 Surveys, with Change
18-21 Year-Old 22-25 Year-Old
Year
RegularUser
OccasionalUser
RegularUser
OccasionalUser
1974 10.8% 27.0% 6.7% 21.6%
1976 6.9% 22.3% 6.5% 27.4%
1977 13.0% 23.7% 10.7% 22.6%
1976-1977 Change +6.1% +1.4% +4.2% -4.8%
48
59.

Using a level straight-line approach to projecting type of use in the future,wcan.estimate that in 1985 approximately 2,008,000 individuals 18-21years old and 1,754,000 individuals 22-25 years old will describe themselvesas regular marijuana users. Estimates for 1977 and projections tar 1985,1990, and 1995 are presented in table l 1.
Table 11 (Number of Young Adults Using Marijuana Regularly orOccasionally, 1977 Survey, and Projections for
1985, 1990, and 1995
Year
18-21 Year-Olds ( 22-25 Year- Olds.-Regular Occasional Regular Occasional
User User User User
1977 2,204* 4,578 1,029 3,3171985 2,007 3,660 1,773 3,7441990 1,886 3,438 1,551 3,2751995 1,689 3,080 1,479 3,123
*Numbers presented are in thousands, and are based on1977 prevalence rates.
In 1976 and 1977 the National Institute on Drug Abuse also estimated the7, percentage of young adults in various subgroups who were regular ?i
occasional users of marijuana (see table 12).
Table 12Percent of Young Adults 18 to 25 in Various Subgroups UsingMari'uana Regularly or Occasionally: 1976 and 1977 Surveys
Subgroup1976 . 1977
Regular Occasional Regular Occasional
Females 4.4% 20.2% /.0% 21.3%Males 8.9% 29.2% 17.1% 25.8%Whites 6.5% 26.2% 12.2% 23.7%Nonwhites,, 6.5% 20.2% 10.5% 22.0%Large Metropolitan
Residents 10.7% 24.8% 13.7% 25.0%Other MetropolitanResidents 6.2% 30.4% 12.4% 27.1%
NonmetropolitanResidents 3.5% 15.8% 8.2% 15:1%
49
60
.1

Using the 1977 data as the basis for projecting use, we can estimate thenumber of young adults whO will admit to being regular or occasional usersof marijuana In 1977 and the number who will admit to this behavior in.,1985, 1990, and 1995 (table 13).
Table 13Number of Young Adults 18 to 25 In Various Subgroups Using
Marl uana Regularly or Occasionally, 1977 Survey, andProjections for 1985, 1990, and 1995
Subgroup
1977 1905 1990 1995
negular Occasional negulsr Occasional negular Occasional Regular Occasional
reMales .. 1,138* 3,463 1,113 3,388 1,000 3,067 930 2,830
Males 2;819 4,253 .2,754 4,155 2:496 3067 2,313 3,489
Whites 1,404 6,613 3,266 6,345 2,909 5,650 2,646 5,141
Nonwhites 508 1,065 550 1,152 541 1,135 538 1,127
Large Metro-politanResidents' 1,736 3,169 1,697 3,097 1,537 2,006 1,422 2,594
Other Metro-politanResidents 1,223 2,672 1,195 2,611 . 1,082 2,365 1,001 2,187
Nonmetro-politanResidents 837 1,542 819 1,508 742 1,366 686 1,263
Numbers presented are in thousands, and are based on 1977 prevalence rates.
1NHALA NTS3
Lifetime Prevalence
In 1977, 10.8 percent of young adults surveyed by the National Institute onDrug Abuse admitted to having used inhalints at some time in the past.Applying this figure to population projections for young adults, we canestimate that 3,457,000 million young adults will admit to having usedinhalants in 1985. The corresponding estimates for 1994gand 1995,respectively, are 3,132,000 and 2,896,000.
Using prevalence rates reported in 1977 with a level straight -line projectiontechnique, we can estimate the number of young adults who will have usedinhalants in the future. Table 14 presents the 1976 and 1977 reportedprevalence rates and table 15 presents estimates of the number of youngadults in various subgroups who admitted to having used inhalants in 1977and who will admit to their use in 1985, 1990, and 1995.

Table 14Percent of Young Adults 18 to .73 In Various Subgroup* Who Had Used
Inhalants, 1976 and 1977 Surveys
ISubgroups of Young Adults .:1076 !: 1077
Females 5 :0%. 8.0%Males 9.9% 14.4%Whites 83% 11.2%Nonwhites 5.1% 10.7%Large Metropolitan Residents 10.8% 10.7%Other Metropolitan Residents 83% 13.7%Nonmetropolitan Residents .3.7% 7.1%
Table 15Number of Young Adults 18 to 25 in/Various Subgroups Who Had Used
inhalants, 1977 Survey, and Projections for 1985,1990, and 1995
Subgroups of Young Adults 1977 1985 1990 1995
Females . i,301* 1,272 1,152 1,063Males /2,374 2,319 2,102 1,948whites /3,125 2,998 2,670 2,429Nonwhites 1 518 560..... 552 548Large Metropolitan ResidentS 1 1,356 1,325 1,201 1,110Other Metropolitan Residents 1 1,351 1,320' 1,196 1,106Nonmetropolitan Residents ,/ 725 709 642 594
*Numbers presented are in thousands, and are based on1977 prevalence rates.
Use in Past Month
A very small percentage of young adults admitted to current use ofinhalants in 1976, and in 1977 this percentage dropped below one percent.Using the 1977 reported figures (table 16), we can project the number ofyoung adults, in various subgroups, who did admit to being current users ofinhalants in 1977 and who will admit to current use in 1985, 1990,and 1995(table 17). In 1985 the number of current young adult users of inhalants isprojected to be approximately 161,000.
51
62

Table 16
Percent of Young Adults 18 to 25 Using Inhalants Current lys
1976 and 1977 Surveys
Subgroups of Young Adults 1976 1977
---3
Females , .3% -
'Males . 10% .5%Whites .5% .3%Nonwhites .4% -
Large Metropolitan Residents , .6% .4%Other Metropolitan Residents 1.1% .3%Nonmetropoliten,Aesidents -
Table 17Number of Young Adults 18 to 25 in Various Subgroups UsingInhalants Currently, 1977 Survey, and Projections for 1985,
1990, and 1995
Subgroups of YoUnd Adults 1977 1985 1990 1995
Females -. - -
Males 82* 81 ' 73 68Whites 84 80 72 65Nonwhites . - - -
Large Metropolitan Residents 51 50 ,5 4ZOther Metropolitan Residents 30 29 26 ,, 24Nonmetropolitan Residents - - If -
*Numbers presented are in thousands, and are based on-1977 prevalence rates.
Type of User
In the 1977 NIDA survey, 1.6 percent of young adults surveyed describedthemselves as occasional users of inhalants; no young adults surveyedreported regular use of inhalants. Using the 1977 data (table 18)Nwe canproject the number of young adult occasional users in various subgroupings(table 19). In 1985, the number of young adult users who will describethemselves as occasional users is projected to be approximately 512,000.
52
63

Table 18Percent of Young Adults 18 to 23 In Various Subgroups UsingInhalants Regularly or Occasionally, 1976 and 1977 Surveys
SutsgrouP
197611-7,00177-m-E5T5,17
User User
1977flegulac. Occasional
User ()tot
Females .3% .0%stiles .3% 1.4% 2.4%Whites .0% 1.9%Nonwhites 1.5%Large Metropolitan
Residents .6% 1.4% .7%Other MetropolitanResidents .7% I. 2.8%
Nonmetropol I tonResidents .7% .9%
Table 19Number of Young Adults 18 to 25 in Various Subgroups Using
Inhalants Regularly or Occasionally, 1977 Survey, and---1,rojections for 1985, 1990, and 1995
_
1917 1985 1990 1995Subgroup Regular Occasional Regular Occasional Regular Occasional- Regular axissiunal
.
Females 130 121 lls 106%ales 396 386 325whites 531 509 45 412Nonwhiteslarge Hermon-tan Residents 89 81 79 13
Other metropoli-tan Residents 216 270 244 226
NbnmetropolltanResidents 92 90 81 73
NuMbers presented are in thousands, and are based on'1977 prevalence rates.
HALLUCINOGENS4
Lifetime Prevalence
In 1977, 19.4 percent of young adults surveyed by the National Institute onDrug Abuse admitted to having used hallucinogens at some time in the past.Applying this figure to population projections for young adults, we canproject that 6,209,000 young adults will admit to having used hallucinogens
, in 1985. The corresponding projections for 1990 and 1995, respectively, are5,626,000 and 5,202,000.
53

Using prevalence rotes repirtril in 1117 with 4 level stroightvline projectimi
technique, we C4I1 prujeet the number of young adults in various subgroups,
who will have used halluciogens In the toile. Table 10 presents the 19/6
and 11/7 reported prevalence rates And Nair 21 prrArnh pralectioni at thenumber at young adults In V4flan% 8rOnpl W141 dill 4(11141 to having used
luilhichogens In 19// and who will admit to their use in 1985 1190 and 1993.
Table 20
Percent of Young Adults II to 25 in Various Subgroups Who Hadt heti 11alkieirmstisi 1976 and 1977 Surveys
L
Subgroups of Young Adults 1976 1977
Females 14.8% 14.4%Males 19.2% 25.6%Whites 7.9% 21.3%Nonwhites 7,9% 11.6%Large Metropolitari Residents 18.7% 19.8%Other Metropolitan Reidents 20.8% 73.8%Nonmetropolitan Residents 9.9% 13.2%
Table 21
Number of Young Adults 18 to 25 in Various,Subgroups Who HadUsed Hallucinogens, 1977 Survey, and Projections for 1985,
1990, and 1995
Subgroups of Young Adults 1977 1985 1990 "°- 1995
Females 2,341* 2,290 , 2,073 1,914Males 4,220 4,122 3,737 3,462Whites 5,944 5,702 5,078 4,620Nonwhites 561 607 598 574Large Metropolitan Residents 2,509 2,453 2,222 2,055Other Metropolitan Residents 2,346 2,293 2,077 1,921Nonmetropolitan Residents 1,348 1,318 ,1,194 1,104
Iwimbers presented are in thousands, and are based on1977 prevalence rates.
54
65
.

tine in 14;441 Month
1,r$4' than two paicent of the feuhife adults and three percent of theiiiale vow% adults, admitted to 4Littera toe of h4lIwinogens to VIA anti 1411(table 42). Using the ill/ repocteu figures, we can j-woject the imoine ofYoung adults, hi VAret$1 lilt)P.r""Pio who 414 admit Nt Cut tnr(% of114110C it)tipt&IIS ift III/ 4110 whit W111 4ilfiiit 10 Current Lite lqq() 4101Prit (table 11). In s the of current yoting 44iit users of3141hiciuoiten% is proircted to he .11)ProxittiAleli` 7f16,000,
Table 2?Percent of Young Adults 13 to 2) Various Subgroups Who Had Used
Halliwintlensf 19/6 and .1917 5tirvey1
ItRic uuti of Youotl V4 if, 1911
Feol.i 1 e 1.2% 1.4%Riles 2.3% 3.01whites 1.8% 2.1%tainvihl.t es 1.9%
Metropol It to Re- alttrrity 2.4%Other Metttivol ltatt Ite5 Went., 2.`A 1.0%Naninet rope 11 t in Ife.)1d1 'r 1.0% 1.7%
Table 23Number of Young Adults 18 to 2
Hallucinogens Currently, 1977 Su4 1990, an
arious Subgroups-Usingd Projections for 1935,
ecragrokips Yeung Adults
remile --,MaleswhitesNcriwhIte-:Large' .1etrrior.311 t-vs ResidentsOther kVtrecolltan Residents-rionnietronolitan Residents
1977 1985 1990 1995
228 223 202 1136495 483 438 406586 562 501 456
92, 100 98 97304 297 269 249197 193 175 16174 170 154 .142
fix6bers presented are In thousands, and are based on1977 prevalence rates.
Type of User
In the 1977 NIDA survey, 7.0 percent of young adults described theinselvesas occasional users of hallucinogens; less than one percent described
341-:
55
66

ittiookelkOk es fttoldf users of tidlioCtitOddtik, thing ltta lti7i7 tiara (1461d11) 1:41) proiect the number of young dttollk tti kdffook subgroups wart iltdescribe f6ctokdIV0i as 104oldf void okis,:dkfondl u# k of fkdflocinoildn; $111end *Ito dill ditto It to this behavior tit future yorrS 11410 5). fn 1115, die
ituittber uf,young adults *tto will describe themselves as regular users ofttittiocilkogeok IS plO)0c1011 to 60 011440k11t74Ittif t,660, The noffibef 61
***rig adults *Ito will describe thenoodikdk is occdskdidi 4.0,0{4 in that &voleyear is profet:10a to be 2,1s1,000.
Idtttercfctnt of Young Adults It to 25 to Various Subgroups Uarkg
Itallucink-vnt Regularly ter Occrsiortallvi IVA gokei 1911 !turves*
St.ttotoucts tau t . dies
191/
noololar pc aikaSaTUser User
FemalesmaleswhitesffOrdonite5large Metropoli-
tan Residentsother metropoli-
tan ResidentsmonmetrrpolitanResidents
4.4% 4.6311
6.9% .71t 9.4%6.1% .1% 7.5%2.5% 4.5%
5.5% 1% 6,1%
/.?% .2% 9.1%
3.5% 5.1%
Table 23Number of Young Adults 18 to 25 in Various Subgroups UsingHallucinogens Regularly or Occasionally, 1977 Survey, and
Projections for 1985, 1990, and 1993
Utsgtssalpyr
7 ,-.17;1",;;T1,T
tsr-Ols=e isosplar doyular Qs, alwt.Ts1 groasi ,,ssal
rama1as lad NI 442 6111) 1. wt) 72 i . Uit tO i , all: I7 I.2941shit*,aortanites
29 2,09121$
27 2,0(1$23a
N 1, /19)212
27 1,a172 92
Large Destro-
Polltartastslarnts 1) 77) 12 7% 11 dal Id 41)Other mat ro-
Pars Want a $97 19 $77 17 794 Id 734Parsurtro0011tanresIdant 971 SIN adl 427
omurbers presestad are Irs thousands, asst and David on 1977 prevalarcs rotas.
56
6/

t 31
tlicti,1.c: VI ca ale*, c'
Ili 11,H, ill', trcF. w,I ,rt thct 1.04,1i6 A, %. ttkiC.,1 Is, il,c;A.lyn,41rt-
tits4e fr,i44:4ft,nricl,irs Ei. a,S t,4hal 174tt.i
0,1111, ittefrsock hvet, Ate "1411
t ore-.41croe 1.31, eikti let! i,. 11P? coil!, a levelV140ti, t!O )041148 :161tillt, 11i
>001 t,41,Ar, 2t, etrws:frO tair3 aisJ tAGld ;/ the
4.4,41t: =-4,ft:tN-1 4144 .t.q1,,,t!117! ad,= 11 1,, it., :t:
yabirrt-t,Crn1 .,Sint* IS Ill :1 in at 1041% 544.4t %NI 1411
IVit. 411d Itir rsiift,ty%
!Kot.),,,g ot4r4 of y )11 5
irm.11r1K*111%
1.42:96 Met ;owl Rat) kt,11.5(!f1tsOtnar Mr/tropolitan MeitlefttiItacvne t rcoollt an Re 1 Ikt It 74
'table :71'N:oath/I of `foonit Adult% I it to 2) al 1'4f NIlltlgrotip% %thy 7140 t'a.ed
Cocaine 1971 -Snrev, awl Projectionl for 1133,1110, Art 1'pol
tir fonfX; it,X111.1, 1177 1935 ITA) 1)--.1!)
Ferales -2,1-71* :,111 1,1:1 1,1:11btaltYS 4,01) 3,945 . 3,577 3.314tirrlites 5.:46 a 5,033 4,4et: 4.,016donithlte.s 910 995 970 961Liatoe Wtropolitao fie-.1:k-ts :,'166 :,HP) 2 ,6;'e; 2,4:1Other metropolitan Residents 1,903 1,8",-1,,t.,0 I,VM
fitartnet rcxxallt an Hes ILlents 1,113 1,6,19 9t11.; 912
tuelt)ers presented are In trvx,sands, anti are, taa..e,1 cv).1977 prevalence rates.
57

Use InTast Month
Approximately two per_cent of thefemales and six percent of'the malessurveyed admitted'to current..use of cocaine in 1977 (table 28). Using the1977 reportedfigures, we Can.project the number ofyoung adults, in varloug'subgroups, who did admit to being current users of cocaine 1n-1977 or whowill admit to curreit use in 1985, 1990, and 1995 (table 29). ,In 1985 thenumber of current young adult users of cocaine is projected to beapproximately 1,204,000.
Table 28Percent of Young Adults 18 to 25 in Various Subgroups Using,
Cocaine Currently: 1976 and 1977 Surveys
Subgroups of; Young Adults 1976 1977;
FemalesMalesWhites ,
. .
Large Metrcipolitan'Residents.Other Metropolitan ReSidentsNonme tropoli tan Residents
1.
1.5 %. 1.6%2:6% 5.9%2.0% 3.5963.1% ' 5.4%4.1% 6.1%1.6% 2.7%1.0% 1.5%
Table ;29-Number of Young Adults 18 to 25 in Various Subgroups Using Cocaine
Currently, 1977 Survey, and Projections for 1985,1990, and 1995
Subgroups o1 Young 'Adults 1977 , 1985 1990 1995
Females 260*. 254_ 230 . 213
Males 973 950 861 798
Whites "977 2 937,_ ;834 - 759
Nonwhites '. 261 283 278 277
Large Metropolitan Residents 773 756 685 633
Other Metropolitan Residents 266 260 236 218
Nonmetropolitan Residents 153 150 . 136 . 125
*Numbers presented are' in 'thousands, and are based an1977 prevalence rates.,
Type of Use
In the 1977 NIDA survey, 8-...kercerit of young acliilfs stirveyed describedthemselvei as occasional tliegitaf'ccicaine; less than one percent describedthemselves as regular. Useridf. cocaine. Usihg_the 1977 data (table 30) we

can, project the number of young adults.ln various subgroups who diddescribe themselves as regular and occasional users..of cocaine in 1977 orwho will adrnit to this behavior in future years (table 31). In 1985, thenumber pf young adults who will describe themselves as regular users ofcocableis-projected .to be approximate)), 81,000. The number of youngadults who will describe themselves as occOsional users in 1985 is projectedto be 2,849,000.
. u.. Table 30 -Percent of -Young Adults 18 to 25 in Various Subgroups UsingCocaine Regularly or Occasionally: 1976 and 1977 Surveys
Subgroups,
1976. 1977
RegularUser
OccasionalUser
RegularUser
OccasionalUser
..
Femtles .1% 4.4% - 5.3% '' ., 1Mies .4% 9.2% , .5% 12.8% ,White
. 7.1% .1% 8.8%Nonwhites 1.5% 4.4% .8% , 8.8%Large Metro-politan .Residents 9.5% .5% .11.4%,,,;-,,
Other Metro-
politan-Residents .1% 74.2% .2% 8.8%NonmetropolitanResidents .7% 3.7% 5.3%.1t
Table 31 ,'Number of Young Adults,_ 8 to 25 in V'trio s Subgroups Using
Cocaine Regularly o1 casionally, 1977 Survey, andProjections fo 1985, 1.990, and 1995
1977, 1985 : 1990 1995
Subgroup Regular Occasional Regular Occasional :,Regular Occasional ,Regular Occasional
FemalesMalesWhites!NonwhitesLarge Metro-
:OolitanoResidents
Metro-'politan. politan
- 862 -82. 2,110 8128 2,456 2739 ° 423 42
63 1,445 62'
ResidentsNonmetro-Politan ':.
Residents.. ' - '541. . i
. 843 - 763 .. - 704'2,961 . 73 1,869.' 1,731 :
2,356 2,098. 22 1,909461 -41 W54 41 451
.
1,412 56 1,279 52, 1,183.
848 17 768 16 . e10
;!.,,.29- 479 843
.Numbers presented.arb in thoaSands-,' end are based on 197,7 prevalence rates.
, .4".7z1S4,
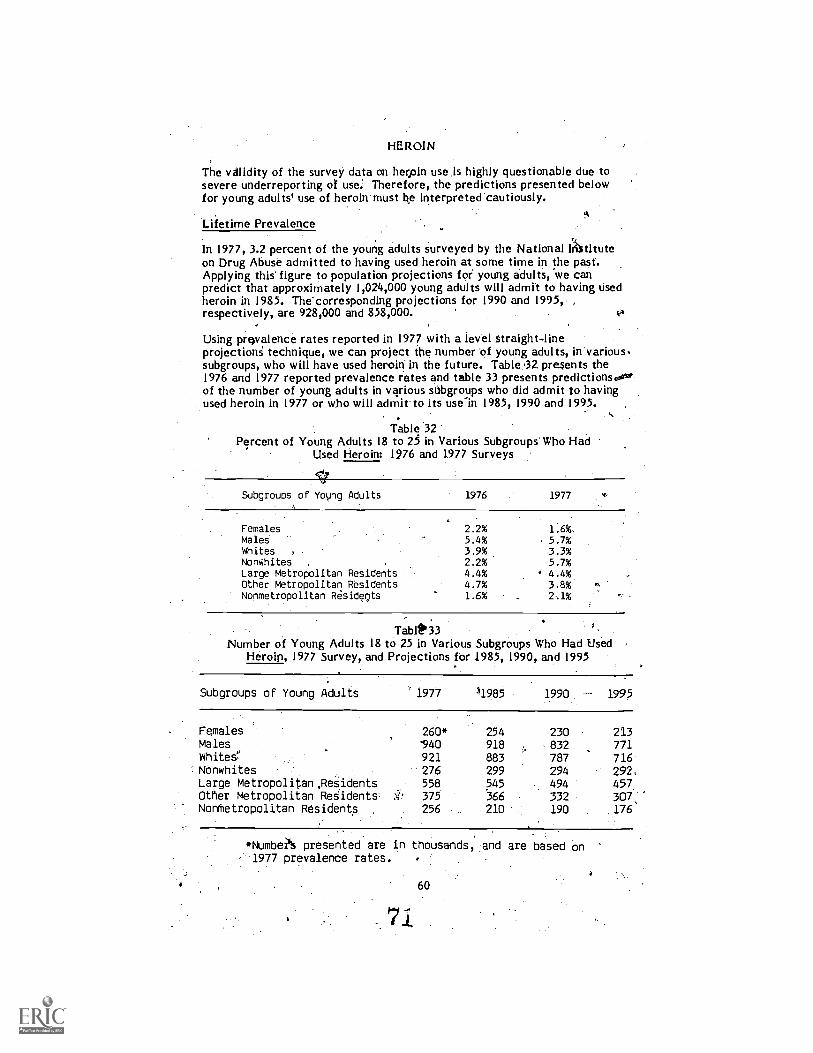
HEROIN
The validity of the survey data on herpin use is highly questionable due tosevere underreporting of use. Therefore, the predictions presented belowfor young adults' use of heroin must be interpreted cautiously.
Lifetime Prevalence
In 1977, 3.2 percent of the young adults surveyed by the National Altituteon Drug Abuse admitted to having used heroin at some time in the past.Applying this figure to population projections for young adults, we canpredict that approximately 1,024,000 young adults will admit to having usedheroin in 1985. The'corresponding projections for 1990 and 1995, ,
respectively, are 928,000 and 858,000. ,1
Using prvalence rates reported in 1977 with a level straight-lineprojections technique, we can project the number' f young adults, in varioussubgroups, who will have used heroin in the future. Table ,32 presents the1976 and 1977 reported prevalence rates and table 33 presents predictions oatof the number of young adults in various subgroups who did admit to havingused heroin in 1977 or who will admit to its use-in 1985, 1990 and 1995.
Table '32Percent of Young Adults 18 to 25 in Various Subgroups' Who Had
Used Heroin: 1976 and 1977 Surveys
Subgroups of' Yovng Adults 1976 1977
Females 2.2%Males 5.4% 5.7%Whites 3.9% 3.3%Nonwhites . 2.2% 5.7%large Metropolitan Residents 4.4% 4.4%,
Other Metropolitan Residents 4.7% 3.8%Nonmetropolitan Residents 1.6%
Tablt033 ;.
Number of Young Adults 18 to 25 in Various Subgroups Who Had UsedHeroin, 1977 Survey, and Projections for 1985, 1990, and 1995
Subgroups of Young Adults 1977 31985 1990 1995
FemalesMalesWhitesNonwhitesLarge Metropolitan; ResidentsOther Metropolitan ResidentsNontetropolitan Residents ..
:ii!
260*-940
921276558375256
254918
883299.
545366
210
230832787294494332190
213771
716
:.241!
:307
*NumbeiN presented are in thousands, and are based on.1977 prevalence rates.
60

Use in Past Month
Less Haan one percent of the young adults surveyed admitted to current useof heroin in 1977 (table 34). Using the 1977 reported figures, we can projectthe number of young adults, in various subgroups, who did admit to beingcurrent users of heroin in 1977 or who will admit to current use in 1985,1990 and 1995 (Table 35). In 1985, the number of current, young adult usersof heroin is project d to be approximately 113,000.
Table 34Percent of Young A ults 18 to 25 in Various Subgroups Using Heroin
Cur ntiy: 1976 and 1.977 Surveys
Subgroups of Young'Adults .1976 1977
\males -Males - .7%Whites - .3%Nonwhites .8%Large Metropolitan Residents - .3%Other Metropolitan Residents .5%Nonmetropolitan Residents - -
Table 35Number of Young Adults 18 to 25 in Various Subgroups Using Heroin
Currently, 1977 Sur,v6y, and Projections for 1985, 1990, and 1995
Subgroups of Young Adults 1977 1985 1990 1995
Females - - -Males 115* 113 102 95Whites 84 80 72 65Nonwhites 39 42 41 41Large Metropolitan Residents 38' 37 /34 31Other Metropolitan Residents 49 48 44 404Nonmetropolitan Residents . - - - -
*Numbers presented are in thousands, and are based on1977 prevalence rates.
Type of Use
In 1977, less than one percent of the young adults survemf-describedthemselves as regular or occasional users of heroin.,psing 1977 data (table36), we can project the number of young adults, in Various subgroups, whodid describe themselves as regular or occasional users of heroin in 1977 andwho will admit to this behavior in future years (table 37). In 1985 the
61
72.

,-,
number of.young adults who will describe themselves as regular users ofheroin Is projected to be approximately 48,000. The number of young adultswho will describe themselves as occasional users in 1985 Is projected to be225,000.
Table 36Percent of Young Adults 18 to 25 In Various Subgroups Using Heroin
Regularly or Occasionally: 1976 and 1977 Surveys
1976 177Regular
Subgroups - UserOccasional
UserRegularUser'
OccasionalUser
Females - .4% .3% .4%
Males ,.6% - 1.0%Whites .6% .1% .3%Nonwhites . .3% .4% 2.7%Large Metro-politan Residents .6% .5% .5%
Other Metro-.
politan Residents .4% 1.2%NonmetropolitanResidents .5%
Table 37Number of Young Adults 18 to 25 in Various Subgroups. ng Heroin
Regularly or 0,ccasionally, 1977 Survey, and Projections for1985, 1990, and 1995
Subgroup1977 1985 1990 1995
Regular Occasional Regular Occasional Regular Occasional Regular
Females 49 65 48 64 43 58 40 53Males - 165 - 161 146 - 135whites 28 84 27 80 24 . 72 22 65Nonwhites 19 131 21 141 21 139 20 138Large metro-politanResidents 63 63 62 62 56 .56 52 52Other Metro-politan
...4)
Residents 118 116 105 97NonmetropolitanResidents
*Numbers presented are in thousands, and are based on1977 prevalence rates.
62

OPIA1'US5
Lifetime Prevalence
. In 1977, 13.1 percent pf' the young adults surveyed by the National Instituteon Drug Abuse admitted to having used other opiates at some time in thepast. Applying this figure to population projections for young adults, wecan project that approximately 4,193,000 young adults will admit to havingused other opiates in l ?85. The corresponding projections for 1990 and1995, respectively, are 3,799,000 and 3,153,000.
Using prevalence rates reported in 1977 with-a level straight-line projectiontechnique we can project, the number of young adults, in various subgroups,' -who will have used other opiates, in the future. Table 38 presents the 1976 ,
and 1977 reported prevalence rates and table 39 presents projections of thenumber of young adults,'in, various subgroups, who did adMit to having used,other opiates in 197irand who will admit to their use in 1985, 1990, and 1995.
Table 38Percent of Young Add Its 18 to 25 in Various Subgroups Who
Had Used Other Opiates: 1976 and 1977 Surveys
Subgroups of Young 'Adults
Females 8.9% 8.7%Males 17.3% 17.8%
- -Whites-- 13,5% 13.2%Nonwhites 12.8% ,12.4%Large Metropolitan. Residents 15.0% 13.4%btqpr Metropolitan Residents 16.8% 15.3%Nonmetroporitan Residents 5.8% 8:6 %-
1976 1977
.... _ ......
Table 39Number of Young Adults 18 to 25 in Various Subgroups Who Had
Used Other Opiates, 1977 Survey, and Projections for1985, 1990, and 1995
Subgroups of Young Adults
: Females 1,415* ,1,384 1,253 . 1,156Males ,2934 2,866 2,599 2,407Whites 3,683 3,534 3,147 2,863Nonwhites ,600 649 639 635Large Metropolitan Residents 1 698 '1,660 1,504 -1-,391Other Metropolitan Residents 1,508-- -'--4474-.-1,335 1,235Nonmetropolitan-ReSidentg 878 853 778 719
1977 1985 1990 1995
*Numbers presented are in thousands, and are based oh1977 prevalence rates.
63

Use In Past Month
Less than one percent of the young adults surveyed admitted to current useof other ()Plates In 1977. Using thp 1977 reported figures (table 40), we canproject the number of young adults, In various subgroups, who did admit tobeing current users of other opiates In 1977 and who will admit to currentuse In 1985, 1990,and 1995 (table 41). In 1985, the number of current; youngadult users of other opiates is projected to be 352,000.
Table 40Percent of Young Adults 18 to 25 In Various Subgroups Using Other
. Opiates Currently: 1976 and 1977 Surveys
Subgroups of Young Adults 1976 1977
Females .8% .8%Males 2.2% '1.4%whites 1.8% 1.0%Nonwhites .3% .9%Large Metropolitan Residents 1.1% .6%Other Metropolitan Residents 1.5% 1.7%Nonmetropolitan Residents 2.0% .5%
Table 41Number of Young Adults 18 to 25 in Various Subgroups Using. Other
Opiates Currently, 1977 Survey, and Projections for1985, 1990, and 1995
v.
Subgroups of Young Adults 1977 1,985 1990 1995
Females 130*. 127 115 106Males 231 225 204 189Whites 279 268 238 217Nonwhites 44 . 47 46 46Large Metropolitan Residents -- 76 74 67 62Other Metropolitan Residents 168 164 ° 148 137Nonmetropolitan Residents 51 50- 45 . 42
*Numbers presented are in thousands, and are based on1977 prevalence rates.
64
75
-,

Type of Use
In 1977, 4.3 percent of .the young.adults surveyed described themselves asoccaslonatusers of other opiates. Using the,I977 data (table 42) we canproject the'humbet of young adults, in various subgroups, who did describethemselves as regular or occasional users of other opiates in 1977 and whowill admit to this behavior in 1985, 1990, and 1995 (table 43). In 1985, thenumber of young adults who will describe themselves as regular'users ofother opiates is projected to be approximately 48,000. The number of youngadulti who will describe themselves as occasional users of other opiates in1985 is projected to be 1,376,000.
Table 42 .
Percent of Young Adults 18 to 25 in Various' Subgroups UsingOther Opiates Regularly or Occasionally: 1976 and 1977 Surveys
1976 1977Regular 0-cTasTOTST Regular. Occasional-
Subgroups User User User User
Females .1 1.9% .3% 2.8%Ma les 5.4% 6.0%Whites .1% 4.0% .2% 4.5%.Nonwhites .- 2.3% 3.3%Large Metropolitan ,
Residents 5.2% .2% 3.2%Other Metropolitan .
Residents 2.8g .1% 6.3%Nonmetropolitan
. . . .. -Residents-------, '. 2%.-------KiN 2.6%
Table 43'Number of Young Ate 18 to 25 in Various Subgroups Using
Other Opiates Re larly or Occasionally, 1977 Survey,and Proje .ions for 1985, 1990, and 1995
_Subgroup1977 1985 1990 1995
Regular Occasional oegUlar Occasional Regular Occasional '41egular Occasional
Females 49 455 48 445 43 403 .40 372Wales - 989 966 876 812Whites 56 1,256 54 1,205 48 1,073 43 976Nonwhites - 160 173 - 170 169Large Metro-politanResidents 25 406 25 396 22 359 21 332
Other Retro-DelitanResidents .10 621 10 607 9 .550 '8 508
Nonmetro-politan
Residents 266 260 235 218
Numbers presented are in thousands, and are based on1977 prevalence rates.
65
76

Summary
The projections ordrug abuse presented in this chapter are Wased on 1977reported rates of drug abuse. It should be noted that the preliminary resultsof the 1979 bolatimal Survey of Drug Abuse indicate an increase in drugabuse rates since 1977. Therefore, the projections for 1985, 1990, and .1945presented herein are conservative. It can be expected that if straight-lineprojections of drug abuse were calculated using 1979 data, the number ofyoung adult drug abusers in future years would be larger. However, theprojections presented herein are adequate for broad planning purposes.
1
FOOTNOTES
A sixth surve y in this series was conducted I 1979; however, the data qrenot yet avai able for review.
2 In 1977, 19 6, and 1974 marijuana and ha ish were treated as separatecategoricsriiuring the data collection phase. However, for purpOses ofthis repo , these two substances have been combined under the tirugcategory "marijuana."
3 In 1977 and 1976 inhalants were defined as "Glue o some othersubstances that people inhale for kicles.or to get high. Besides glue, thereare things like gasoline, some aerosols, nitrous oxide, amyl nitrite (whichis also called 'poppers') and other solvents,"
4 In 1977 and 1976 hallucinogens were defined as "LSD and otherhallucinogens like mescaline, peyote, psilocybin, and DMT."
5 In 1977 and 1976 other opiates were defined as "Opium or other drugscontaining opium and its derivatives. They are usually in the form ofprescription cough syrups, pain killers, or stomach medicines--things likemorphine, codeine, dilaudid, demerol, and paregoric. Although they arefrequently prescribed for medical reasons, these questions ask about theuse of these drugs for nonmedical purposes--that is, for kicks or for highs,to gain insight or pleasure." Also include" were hycodan, laudanum, andtalwin.
66
' 7 7

Chapter 5
Overview of Drug Abuse Trendsand Recommendations for Aefiditional Research
Overview of Drug Abuse Trends
Previous research indicates there is a relationship between nonmedical useof drugs and age, with the highest percentage of drug abusers included in theyoung adult (18-25 years old) population. The population projections
,. presented In appendix A to this report clearly point to the decline in the sizeof the young adult population between now and 1995. Given these two facts,it is reasonable to assume that the number of young adult drug abusers willalso decline between now and 1995.14
This study (s based on the assumption that rates of drug abuse reported In1977 will remain stable; and, therefore, the number of yourig adult drugabusers can be expected to decline continually between the present and1995. This trend is demonstrated by many of the tables presented in chapter4. A decline in the number of young adult drug abusers can be expectedacross most subgroups (e.g., both males and females) with one notableexception. The size of the nonwhite young adult population, unlike othersbgroups of young adults, is projected to grow in future years. Much of this
0/growth can be attributed to the changing structure of the Hispanicpopulation. In fact, demographers generally agree at American residents$of Hispanic origin will probably outnumber Americ Blacks before 1990.While consistently high birth rates contribute to the rapid expansion of theHispanic population, illegal immigration is the largest single growth factor,accounting since 1970 for more than 50 percent of the population increase.It is difficult to estimate the total significance and extent of illegalimmigration as a growth factor, but it is certainly a major one.
Historically, a very large proportion of these illegal immigrants have beenyoung males and there. is no reason to believe that this trend will notcontinue.
While the number of young adult drug abusers, overall, may decline in thenext decade, it is difficult to estimate with any precision the shape.of thedrug abuse problem among this group. If earlier trends continue to repeatthemselves, the following patterns of drug abuse may emerge:
A
o Regular use of marijuana will be on the upswing but thepercentage of occasional users should stabilize.
o Use of hallucinogens should not change dramatically.
o The percentage of cocaine users, particularly occasional users,will increase over the next decade.
o The percentage of young adults using heroin and other opiatesshould not change dramatically.
67

These observations should be interpreted cautiously, of Course, becausethere are any number of demographic and sociological phenomena that couldinfluence future drug abuse patterns among young adults. As chapter 2 ofthis report suggests, fertility rates in the near future, mortality rates amongyoung adults, new waves of immigration, the extent of geographic mohilit)experienced within this country, the changing family structure, and careerpatterns for young adults should he monitored closely in the coming years.,In order to support this et fort, an alternative methodology for developingprojections of drug abuse would need to be developed.
Additional Work to Be Accomplished
Several alternative approaches to projecting drug abuse in the future werereviewed in designing this study. The most straightforward approach tomaking projections is to apply the current levels of reported drug abuse topopulation projections in order to estimate the number s.ot drug abusers atBiture points in time.
'A second approach is to use data collected at several points In time todOCOMelit trends. When such data are available, one can study the directionand magnitude of change in the level of drug abuse 'over time and assumethat this same pattern will continue in the future. With this approach onecould Modify the most recently reported level of drug abuse and multiply,the modified percentag'e by population projections to estimate the numberof drug abusers in the future.
Using a third approach, one could identify a number of demographic andsociological issues which ought potentially affect future patterns of drugabuse. Each issue could be analyzed and a set of hypotheses developedwhich express the relationship between drug abuse and changing socialphenomena. Statistical equations could be developed to express theserelationships; and these equations, factored with population projections,would generate another set of projections of future drug abuse.
Within the scope of this- y and the confines of. the drug abuse data basesalready establishe primarily-the .first approach was used to develop thedrug abuse projecti s presented here. This approach produces modestprojections which will be useful for planning drug prevention and treatmentstrategies over the next decade. At the same time, this approach and thesecond one described above have two major limitations:
o They assume that current trends will continue, a sometimesmisleading assumption; and
o They do not account for other significant demographic andsociological changes in the future.
Because the demographics of the 1970's weresurprising to many--baby boomturned baby bust, population redistributions from North to South, shrinkagein the average household size, and significant increases in the number offemales in the work forceHt is important to anticipate similar changes inthe 1980's in an effort to improve the reliability of projections of futuredrug abuse. The modeling technique, presented as a third projectiontechnique above, would take into consideration a range of demographic
68
79

and 44)(10100C4i issues Such An approach would increase the accuracy withwhich (flanging drug abuse patterns over the next decade can beanticipated. This approach would also make clear the critical demographicand sociological issues which should he monitored and tracked on a periodicbasis over the next 10 to IS years as both short- and long-term plans arediscussed. Additionally, development of such a model would enable us toplot alternative changes in drug abuse patterns in future years. The reviewof population trends, the analysis of existing drug abuse data sets, and theconservative projections of drug abuse presented in this report representimportant steps in this direction.
69

Annotated Bibliography of Selected Malaria la onDemographic Trends and Forecasting Techniques
Bane, Mary 1019/a
Barclay, George W.19sa
title to Sild),1 himilies theTwentieth eeditir.y, New Yoe id Retie Rookx, IyyPP,
Bone shows by analyzing demographic and surveydata, that the American family is here to stay,albeit in a somewhat, altered form, Policyimplications are discussed.
Terniques of Po illation Anal Os. New York!Wiley, 30 pp,
standard textbook in demographic techniques,Less detailed than IStiryock and Siegal (197))anti requires less mathematical background thanKeyfitz (1977).
Bean, Frank D., and W. Parker Frisbee1975
Birch, David1978
Biggar, Jeanne C.1979
The Demo f4 h of Racial and Ethnic Groins.Fri VS or 1 Ca ern c reir,714 pp.
Contains several useful articles on blacks andHispanici. Topics covered include residential .
segregation, education, fertility, mortality, andhouseholds.
Statement, House Select Committee onPopulation, Hearings, Consequences of ChangingU.S. Population: Vol. 3,,Population Movementand Planning.
t-!Growth in employment and immigration is duemore to creation and growth of firms thanrelocation over long distances. Livingpreferences as well as the cost of doing businessinfluence where firms locate.
The Sunning of America: Migration to theSunbelt. Population Bulletin, Vol. 34, No. IiMarch), Washington, Population ReferenceBureau, 39 pp.
70
81

Oa X antra., Julie191M
1 astr9101,197S
fdrynolds1977
A Ciiiitrifthett4ISCitilii)rriisphie shifIrt thatitIC, altii pCitit
iref'rlow tit MIS Iruisortdittussiutt of
al ittliolicatiort5.
11.`.. Intel ocap.11trrationTettitootty- to Iropolatott, Ctiti%cipirfitPO04141444 l'0114114,100%
11\1il't).
St ha tStkaSra&Ora t Comitittre urrof Chanting
t) rutrltt anti l'lahriiltp,
who Hag., ate in hour their -.c4tttisig*410 ICSSeft thrif ittCitirtice a I uortuplo)tieril. I orlahor ntarl.ris, ruler:4110n la an alt11111.4.14.g.tort r, atiot1Ia1 ilirc-cle,(104\n stole IhI4tioit nt.trr rf .(jar.
%hat Still 1934 br t liar 1.04.104.1;onoolicof 1411ent twists in the Age
Structure-. IleynaSfirarh), 1,1.191.41.i%
A rise the relative niiii-iher of sourig malessox r I¶ILO has fOiltritmitra to a nuuntwr of sax-141Nobler-lit, Including tt(fealCti urerrnplo went,dceleratine, inthitIO11, 4fill higher levels ofdixort e. **WC Wet r 41t1t1 plIliti(di Mien:11"I hr U.S. is now at the start of a new period ofgrowing scarcity of young adults as a result ofthe birth rate decline that wt 111 at trf 1960 thislinpfirs that the 1930's will see a turnaround in awide varlets of these social, political andkonorhic small ions."
Pe-in-lent sal Segregation and Urbanized Areas ofthe 1,,,-ateil States rt 19701 An Analysis of Scx=ialClass and Racial Pitterences. Demography.14:497-513.
"Levels of social lass set regatiori varied littlefrom one urbanized area to another and were
'about Vie state in central cities and suburbanrings. Padal residential segregation was muchgreater thin the Segregation toil social classeswithin either the blaCt or whifecommiinities.The extent of racial residential segregaWirrnes,not vary by educationarat tainment,.ocCfpatitintir.income."
71
82

p
'r, .. ,,i16.FlaIrn ..Pauk 0.,"and HOWard N. Fullerton, ,Jr. I. -'
. . ,
1990° '''Labor Force Projections tq ., -Three PtcsiblePaihs. 64OhthliLabor.Review;.(De.cernber .25-35.!
All-thre;rat di.!to
plecteci growth to 1990 showO-drOli'frOin:ilie.l' .0477'.pace, Projections are '-,givenby age and se. 'based on.Cenms Bureauprojections for the total popularrOn.. .-
' .'' 1978. ,
rancese, Peter.K.1979
Glick Paul C.1978 ;
t
The 1980 Cerisus: TheiCoonting of. America.Pdpulation Bulletin, 41. 34, No. 4(Sepnernber),Washington: PoptilatIon Referelice
a
A good introduction to the 1980 erisus., Includesdiscussion,s-of planning fon,..th erlsus, how.itly,111be ducted and census otlucts4d services.,
The Fut.4. before th
Populatio
,USG.
re of the Am ricen FarrUlA
TestimonyHouse lec Committee on, Consequences'aCtiangl U.S.: Bab Boom and 'Bust. Was ingtoC:
Changes in American family life `lh the ryixt two° decades will be leSs than in the last two.
Documents the growth of,:therrairkiter of childrenliving 'in single'parent hOtiSe11 i9ds,14utiioints o!Stthat 77percent df all children tinder' 18 live with.two parents..
,
Greenberg; MiChael R., et al. .
-Local Population and Employment ProjectionTechniques; "New Brunswick: Center for Urban'
Policy,Research; 277 pp. ;';
ntludes9Verviewand,presehtation of detailed,1methods, ic:luding:cemputer progrpms.
Guest, Avery19791
Patterns of SU6Urban Population Growth'1970-75. DentogrOphy, 16:401:
ProxiMity of central city ana age of central:citr:4.are both associated with netloss for suburbs:
.7.2

Ka01J Y
977h,
counting the Uncolintable: Estimat s.ofUndoeumentedgAliens in the United States.Population and Development Review, 3:473-81.
Revi ar ous estimates of stock and flow andproble involved in developing sound estimates.Keely is writing a more up-to-date account ofthip prgblerp for Argerican Demographics, whichwill be published in 4986.
,
Keyfitz, Nathan1977
Matras, Judah1973
4.
e
Morrison, Peter A.1978
4
Applied Mathematical Demography. New York:Wiley, 388 pp. '
.
Populations and Societies. Englewood Cliffs:Prentice Hall, 550 pp.
A standard jtext for undergraduate populationtour es. COritains considerable historical andcorn arative material, as do' mdst gich works,but Matras is more thorough on quantitativedemographic analysis.
The U.S. Population's Ch ging RegionDistribution: Trends and .111plications: Testimonyto HouSe Select Comrnittekon Population,Consequences of ChariginM.S. Population: BabyBoom and Bust.
Good overview of the population changes reault-,ing from piirfterit trends in internal migratioq.,Sane areas wiLlexperierIte population deClinewhile 'others''Continue to grow at rapid rates.
National Center. for Education/Statistics' 1978Projections of Education Statistics to 1986-87.Washington: USGPO, 184 po.\
Chapter 2 gives,enrollment projections for all-levels of education. Ctiapter 3 ojects,enrollment by,rlegree Subject are'a -. Newprojections wilfbe published in 1980.

Qak Ridge Associatec011niversltles "') .
li.:F;opulation Forecasting for Small Areas. Oak.Ridge, Tennessee: Oak Ridge Associated,.,/Universities, 90 pp.
c .
Pittenge nald B.1,979 .
cvReYnolds, Reid T.
A conference report-containilig paPers ondifferent methogtof forecasting and applicationsfor energy' plant siting, education andtransportation planning, and State health careplanning and development.
How to Bvaluati American Demo
asts.ry, pp. 33-35.
Users oLpopulattOn tor quid know.whithparti of d.foreca.stfrernodeL,are buttressed bytheory, which parts,aresirripfy empirical, andwhiO parts represent guesswork. .
4 AT.; . 7 t,
%,pefrirggraphic Models. rotrican Demographics,,,No. 10 .1\lo'vembu432-33. ..
Discusses the application'of econometricforecasting techniques hit population projeCtionsfor separate components of the poPulation and
.vbnational areas&t., Demographic models are now. available from se)>eral, privat9 sources and are
being developed by Federal and Stite agencies.
Reynolds,1980
Reid' T., Bryant Robey, end Cheryl Russell
The DemograPhics of the 1980s. AmericanIgkrnographics, Vol: 2,,,No.1.(Janui:W
Several important deinOgraphic trend at the1970's are projected to 1'990. caws ogether
,projections. from severaLditferent ralagencies and eValuates certainty of .th se.prOtection.S. Ten charts.
Ric, Dorothy e.1979 '
.. Long' Life to You. American Demographics, Vol.9, No, 9,(Oetober):9715.
After slow improvements during the'1960's, deg. .
rates haVe declined more rapidly in recent years.If death rates improve in the next 25 years as s-
rapidly as in the past decade, we can expect adeciease in the death rate for all ages
74
85

.Rogers, Andrei1968
Shryock, Henry S.1975
'Siegal, JaCob S.1978
Slater, Courtney1980 .
combined of 9 percent, with the, greatestimprovement for those under 20 and over 45.
Matrix Analysis oi\lnterregional PopulationGrowth and Distribution. Berkeley: Universityof California Press, 115-pp.
The application of matrix algebra andmultiregional emographic forecasting.
Id Jacob S. Siegal
The Methods and Materials of Demography. 2
Steinberg, Joseph (ed.)1979
Vols. Washington: USGPO, 888 pp.
Discussion of the nature and quality of .ceKusdata on immigration. /
Collection and Analysis of Irrimigration, Dat'a 'at <the Census Bureau. Testimony to the House' .
Select Committee on Population, InimigratiOnthe United States.
Pieces of the Puzzle. American Demographicsi,Vol. 2, No. 2 (February).
Changes in household size and composition ttavaffected income trends imrecent year,,,s. ,
Synthetic Estimates for Small Areas: StatisticallWorkshop Papers and Discussion.r N1DAResearch Monograph. 24. Washington: ' wstPo,282 pp. ' ' :,' ' i
Papers describing and evalpating a net techni,q,for making estimates of a. otarget statistic" (e.level of drug abbse) for specific subnatiOnara
, using descriptive data forthe,':area (e.g., popUlar:,,usingestimates by age and sex for counties) in .,,v1'
\\combination, with average..values of the t4rge.k:,:-?Patistic for national or regional territory, feg.,'drug abuse estimates from the National:SurVeys '' ,.of Drug Abuse). , .
'/'

Bureau 0; the Census -
.197,51.Historical Statistics of the United States:Colonial Times to 070. Two Parts.
1
U.S. Bureau of the Census1975b
U.S. BuredU of the Census1977a
U.S: Bureau, of the Census1977b
Washington: USGPO, 1298 pp.
. ..Loroprehens1V lection of statistical data fort)the U.S:,GhapI 11f-Population; Chapter ,--VitalStatistics; Chaptl*C-Nlgration; ChapterD -- Labor; Chapter.te.tiocial Statistics...
As,
Coverage of the Populatiorl in th! 1970 Censusand Some Implications or Public frograms.Current Population ,ReP rts, Series P-23, No. 56. ,
A detailed assessment of the undercount problemin the 1970 Census.
Reference Manual on Population and HousingStatistics from' the Census Bureau.' Washington:USGPO, 146 pp., .
A comprehensive,introduction to demographicdata available, from the Census BUreau. Usefuldiscussion of 1970 Census concepts and methods.
Projection of the. Population of the.bnitedStates 1977tto 20g). Current Population Repot- s,Series P-25, .No. 704.
The most re- Census. Bureau projection,s of thetotal U.S. '61. on by tige/sex, and race,:Three proL eries are given to 2050. t.ac0*:--_series assum ript annual. immigration of Q000.and gradual: rnprovements in morality. Asassumes a giadual transition to a total fertilityrate of 2.7; Series II assumes 2.2 (rePlacenientlevel fertility); and Series III assumes 1.7. The Oltbureau does not anticipate releasing newprojections until after results of the 1980 Censuhave been analyzed.
U.S. Bureau of the Census'1978
Statistical Abstract of the United States: 1978.Washington: USGPO, 1011 pp.

4,
U.S. Bureau of the Census1979zr
An extreijieljlvaluable compendium of statisticsgathered by; various Federal agencies:Data reieleant to demographic trends arelocatetlIn sections F-5, 13 and 14. The sources for moredetailed information on each statistical seriesarementIoned in chapter introductions andfootnotes to tables.
Illustrative Projections of State Populations byAge, Race and Sex: 1975 to 2000. CurrentPopulation Reports, Series P-25, No. 796.
Uses fertility and mortality assumptions of theSeries II projections (U.S. Bureau of the Census,19770. State populatiorprojeCtions are'based ontwo different assumptions about interstatemigration. Series II-A assumes' continuation ofthe 1965-75 rates; Series II-B uses the 1970-75
_rates. Series Il -B shows lower-,Chtes of populationgrowth for the Northeast and, North CentralRegions.
U.S. Bureau of the CensusI979b
A
Poputhtion Profile of the United States: 1978. "Current Population Reports, Series P-20, No. 336.
A useful collection of. findings from the Current'Population Surve'. Issued annually.. .
U.S. Bureau of the CensusI 979c
Projections of the Number of House Olds andFamilies: 1979 to 1991. Current PopulationReports, Series P-25, No. 805.
Four series of projections based on changes inmarital status and household statussince 1964.
4'2-4U.S. House of Representatives,'Select Committee on Population
1978
Hearings and Reports. Washington: USGPO.
Of the 10 volumes of hearings the most pertinent 4":1
are: Consequences of Changing U.S. ".,
Population--Vol. 1 Demographics of Aging; Vol. IIBaby'Boom and Bust;and III PopulationMovement and Planning; and
Vol:'Immigration to the
United.States. The most pertinent reports are.Fertility and Contraception in the U.S.; Legal andIllegal Immigration, and the Final Report.
,14t
77
° 8

Westof f, Charlei F.
Several of, the background papers prepared by,witnesses are cited in this bibliography by author.
Some Speculation on the Future of Marriage Andthe Family. Familyj lanning Vol.10; No. 2p940.
Foresees a transition to zero population growth inthe next 50 years. 'Low fertility can be attributedto the availability of and use of more effectivecontraception and greater availability ofabortion. ". . there are reasons to believe thatsome subsidization.of reproduction mayeventually become necessary. ".
Zuiches, James J., and David L. Brown1978
\ The-Changtn-g--Characier-of the Nonmetio-pollonPopulation, 1950-75. In Thomas R. Ford, RuralU.S.A.: Persistence and Change.
\ Ames: Iowa State University Press, pp. 55-72.
DiscUsses various characteristics of thehonmetropolitan population. A good'backAroundOrunderstanding the recent resurgence of some
rionmetreolitan areas.
V' .
VI.
78

. Drug Abuse Data Sources
At .1son, Il.i and Atkinson, 11. l'ithlie Exmienct: with PsychoactivekSubstances. Prepared for iliirKilinii1 Institute on Drug Abuse byfr;sponse Analysis Corporation, Princeton, New Jersey, and Social
. Research Group, George Washington 'Univellty, 1975.
Abelson, 11.1 Cohen, R.; and Schrayer,D. Public attitudes towardmarihuana. Prepared by Response Analysis Corporation. Inl&rititiaria: A Signal of Misunderstanding. first Report of the ..)
-.-Wational Commission onMaiitaiana and Drug Abuse. Appendix Vol, 11..Washington, D.C.: Supt. of Does., U.S. Govt. Print. Off., March-19.72.
. . ,Abelson, f t.;Cohen,Cohen, R.; Schrayer, I).; and Rappeport, M. Drug 1:2t_perier .Attitudes and Related Behavior Among_Adolescents and Adults.Prepared griliegiiii7r7TaTTiisTriiiiTiiiThrug Abuse by ResponseAnalysis Corporation, Princeton, New Jersey, and Social ResearchGroup, George' Washington Uniysity, 1973.
Abelson, H.; and fishburne; P,.. Nonmedical Use of Psychoactive Substances;1975/6 Nationwide Study Anion_gyouth and Adults. Prepared for theNatialzil'institute on Drug Abuse b Response Analysis Corporation,Princeton, View Jersey, and Social Research Group, George WashingtonUnivers'IY:'19:76.
. '. ,
.Abelson, Iii41.4shb,urtie, P.; and Cisin, I. Na ional Surye on Dru Abuse:1977... t ion wide Study Youth,.yI-cursan(ffeo.Preparedlor2,,the National Institute on Drug Abuse. by ResponseAnalysis Corporation.. DHEWD.C.:. Supt.' of Docs., U.S. Govt;Print. ,
131--'cieC-ker, L., and, tgAPVIllictt Use of Dangerous Drugs in the United. States., A Corripilanon of. Studies, Surveys and Polls. Washington,
D.C.: Department of Justice, Drug Control Division of the Bureau ofNarcotics and Dangerous Drugs, 1972.
4
Drug Enforcement Adrelir4stra;ion.. Drug Enforcement,Statistieal Report.. ,
Statisties:C-ornpiled ThrOufill September 1979. Washingtbp, D.C.: DrugEnforcement Administration,. )979.
Drug Enforcement Administration. Regional Drug Sitution AnalysesThrough September 1979. Northeastern, North Central, Southeastirri .
South Central, and W,esternAegions. Washington, D.C.: Drug .
Enforciernerit Acimlnistrat lot?;i,r 979.
Glenn, *.;-41c1 Richards, L.-Recent Susyeys Of NonTiiiedfeal Dru ..i..fse: aComperwiltim of Abstracts. DHEW.Pub. No. (ADM)75-13Maryland: National Institute on Drug Abuse, 1974.
.
oJohnston, L.'13.: Dizugs and American Youth. Ann Arbor, Michigan: .
..University.of Michigan, Inslitute for Social. Research, 1973.
61,
no."' n

Johnston, L. I).; Pactiman, J. (.4 and O'Malley, P. M. Dm Use AnionAmerican High School Students-I975-1977. Prepare( or t le tit onatInstitute on Drug Abuse ay the Institute for Social Research, Universityof Michigan. DIIEW Pub.'No. (ADM)78-619. Washington, D.C.! Supt,of Does., U.S. Govt. print. Off., 1977.
Johnston, L. 1).; Bachman, J. G.; and O'Malley; P. M. Muss and the Class of'78: liehaviors,Attitudes and Recent National Trends. Prepared for.t to National Inst tute on Drug Abuse by the Institute for SocialResearch, University of Michigan. DIfEW Pub. No. (ADM)79-877.Washington, D.C.1 Supt. of Docs., U.S. Govt. Print. Off., I979a.
Johnston, L. ; Rachman, J. G.; and O'Malley, P. M. 1979 HighlightsNation's I i h School Students Five Year National Trends. Preparedor t e ationa nst tute on lrug usc y t e nst tute or Social
Research, University of Michigan. DHEW Pub. No. (ADM)81-930.Washington, D.C.: Supt. of Docs., U.S. Govt. Print. Off., 1979b.
National Institute on Drug Abuse. An Index of the Number of Drug AbusersIn States and Major Urban Areas: Prepared by Respolse AnalysisCorporation, Princeton, New Jersey, 1975.
,fNational Institute on Drug Abuse. Drug Watch, July 1977. DHEW Pub. No.
(ADM)77-503. Rockville,' Maryland: the Institute, 19,7.
National Institute on Drug Abuse. Data From the National Dru$ AbuseTreatment Utilization Survey (NDATUS), April 1978, Series F, No. 6..DHEW Pub. No. (ADMT79-829. Rockville, Maryland: the Institute, 1978.
National Institute on Drug Abuse and Drug Enforcement Administration.Dawn Quarterly Report AOI-June 1978. Prepared byittiS America,Ltd., Ambler, Pennsylvania, 1978.
J b °Natiorial Institute on Drug Trend Report anstar, er:19V8. Data From the-Che tOtilainted Data Acquisition ProcestiOeritsE, No. 10. DHEW ADM)79-845. Rockville, Maryland: 'theInstitute, 197ff'
- -National Institute on Drug Abuse. Annual Data 1978. Data From theClient Oriented Data Acquisition Process. Series E, No. 12. DHEW
;Pub. No. (ADM)80-866. Rockville, Maryland, the Institute, 1979.
O'Donnell, J. A.; Vosi, H. L.; Clikton, Slatin, GA-T:; and Room, R. G. W.Young Men.and Drugs A NikionWide Survey. National Institute onDrug A use Research Mtnoulaph). DHEW Pub. No. (ADM)76-31I.Washington, D.C.: Supit. of Does., U.S. govt. Print. Off., 1976:
80

Appendix A
Population Projections for Ydugg Adultsfor 1985, 1990, 'and'1995
I
92

APPENDIX A
POKLATINTWOIMON S FORYOUNG ADULTS F1 1905, 1990, ANO 1995
(1N TH0USAN01)
Total Popu I at ion
1905 1990 1995
232 880 243 513 252,750,
Pop. 12-17 20,909 191240 21,956'
12 3,163 3,280 3,894
13 3,354 3,190 3,835
14 3,728 3,189 3,801
,15 3,6441g/ 3,236
16 3,526 3,129
17 3,494 3,216
46.
18-21'
, 18
19
21v
22-25
22
23
e
26+
3,643
3,450
'3,333
15 444 14 506 12 995
3,606 3,426 3,262
.3,740 3769- 3,232
4,025' ?63,754 3,338
4;673 3,557 3,163
,16,394 M 14,491 13,820
4,065 3,457 3,185
4,069 .3,488
4,155 3,696 3,724
4,105 3,850 3,592
138,598 149738 157,543
82

Nonwhl o (ennt'd
20.24
Total 18-25
APVER)a A (Cont,d)
1985
3;2',
642
,009
Largo Metro, 12,387
Other, Metro 9,634
Nonmetro 9,907
AVOI,os'"
83
VPAI 99
3,165 1,236
.650 637'
28,998 26,813
11,222 10,377
8,728 6,010
9,047 8,366

Appendix. f3
Charts and Tables OepictingVarious Demogilaphic Trends

11.4 Atialti: 111 9-1 .Ht
Not ;t4t c,( 1 4t mla.ta,111441. tkiptl4t4 or th, ilttr11 Vs4. Aka-:t Wca0, tir JO 411.1 :neat
AO 1a 1:01 !+? ',JOY 1,
-MALE
11 'ono
20 S 0 OSrota. txsouirsort .talta Will
10 S
t_ Isuro.itt ttqlt Ik v41.3!, icc
86
9c)
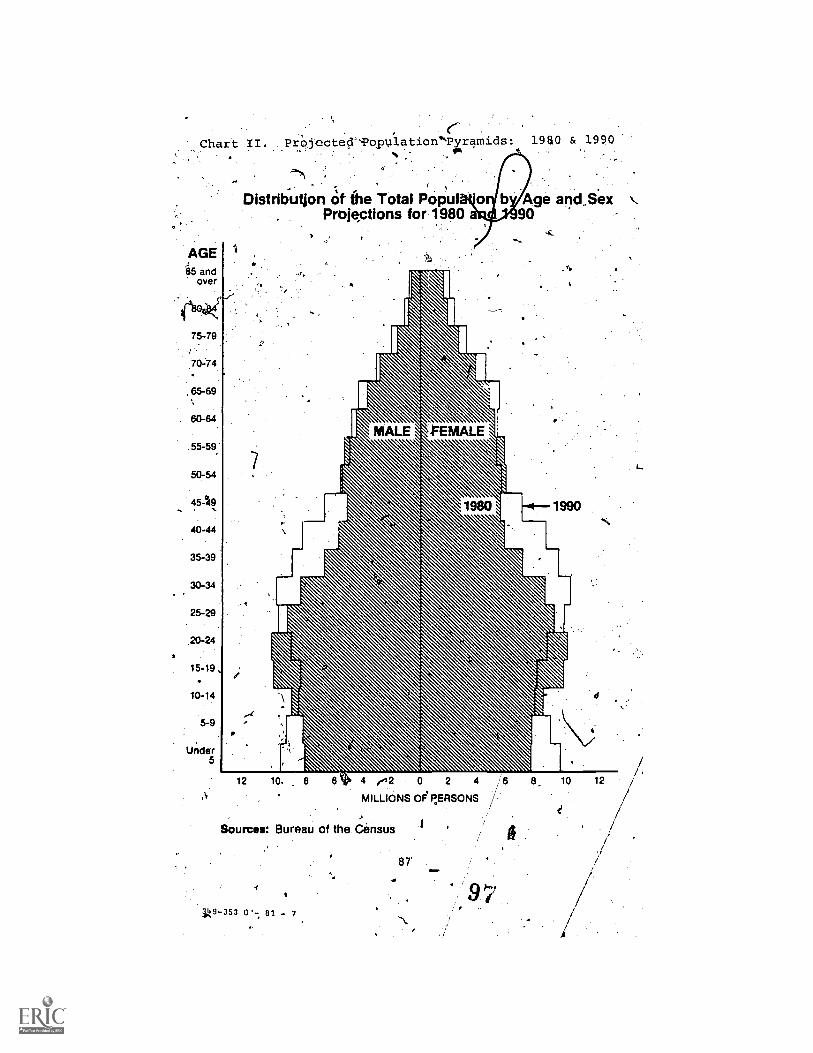
Chart, ii. PrOjecteV-Popplation`nramids: 1980 & 1990
AGE85 and
over
. S
''>
DisttitutIon of the Total PoPtil o b Age and,.Sex, Projections for 1980 90
75-79
70-44
, 65-69
60-64
55-59,
50-54
45-49
40-44
35-39
30-34.
25-29
20-24
1990
15-19 ,
10-14
5-9
Under5 L\\
12 10 8 4 "42 0 2 4 10 12
87'
MILLIONS OF PERSONS
Sources: Bureau of the Census
1149-353 0- 81 - 7
I,

I
f
i
I.
1
t
ie.
I
+
I.P
i
I
1
Pc
s4k.
,II P
TOOL
1 aL jits.111A I 222,lh I

+
q
I 4
r
N
1
A 1
+
1
P
a
%IL
NI.
I
6
1111
I.. I I
r
I
r
I
r
F
I
f
1 1 4 41
II

Chart V. Teenage Birth Rates4
-Birth Rates of U.S. WometerAges.16-19., 1920-1976$rotinhseker1r1090
100
80
60
40
20
,0
1920 1925 1930 1935 1940 1945 1.950'195 1960 1965 1970 1976'.
Source: National Center for, Health Statistics
a
0
Chart VI. Projected School-Age Populaflon
.0/
a
,source: U.S. Bureaof the Census
The school age ponulatOn. childrenage 5 to 17, will reach a low around
":4985. but then should rift again.
P.ss
10 15 'W W
90'.

Chart VII Retentien Rates
I
700 ri
600
high School Graduate.
300
200
100
FirstAinse College Students
After increasing for two decades,retention rates now have stabilised
1933 .1960 1963
Uar6(1003.11oWeredustkm.1910 .197S
Source: National Centerfor
91
101.
atistics


Charts IX and X. Metropolitan and Non-Metropo itan Growth
Sourde:
Where We LiveMat Americans live in metropolitan areas, bitt:sjikce 1970
. central cities have lost population and sulstnlyS.97'.*. continued to grow.
"'
1977 TotalPopulationsin asillidha
Mmrtyoht.mu.ntral
chin ge1970-77
Census Bureau,'to:
MorpoktanSuburb,
+ I change1970-77
Nma.Ntetrm,ohtatt
4-9. chatigtI97077
20
Source:
bioarovelltom . WtrowWse 3$terollsot Now..or A Jona I ).lave IOW" $ maim Minvolime
Census 'Bureau
94
102-,r or

Chart VIII. The Baby Boom and baby Bust (continued)
1445 1910Ir
1995
0
I1960 I96s 19170
I I1979 1976
Thin chart is ruprinted with permission from Amoricqp DomoBraphics
.magazine, 0,5eptembe? 1979.
93
"104) A

s9
U.S. Immigrants by Region of Origin, 1820-1976.,1820-1860 1881-1900 \\
NorthernAmerica
3
121,900
1901,1930Asia3
Latin America
Asia 350,7002
1931.1960
Other 1
NorthernAlVerICE1
Southern\and EasternEurtipe
22., /
Northern and WesternEurope
. 41
NorthernAmerica
11
Northernunct
WesternEurope
0111,4 3
NorthernAmerica
331,100 t.totithernand 1 astern
wormIn
Asia5
`southernand fate
Lampe
.1971.1970
131,9(X)
Other
Northern America21
Northernand
WesternEurope
Other 3
NorthernAfIllrfleil
4
:Intithern and
Lump')1:I
,rcent et Immigrants from region
000 Average mutual number of Immigrants
Source: Loon r. Llouvior, with loory 5. Shryoch find? filmy lloodolt00. "lt1 10,0141k)0,11 M1000100:Yestortlay,- today and Tomorrow" Pt.)001a1100 llullafln, KO 32, No 4 Courreff? 01 Ma 1)0001,1110,111010ror rt thireati, lure., Woilliootoo, 11 C, Novi. Igt 1, pp 21, 75
e.
98
") 103

NationalInstitute on
Drugbuse
earch.monograph series
'While limited supplies last, single copies of the monographs maybe obiained free of charge from the National Clearinghouse forDrug Abuse Information (NCOAI). Please,contact NCOAI also forinformation about availability of coming issues and otherpualications of the National Institute on Drug Abuse relevant todrug abuse. research.
Additional copies. may be purchased from the U.S. GovernmentPrinting Office (GPO) and/or the National Technical InformationService (NTIS) as indicated. NTIS prices are for,,Pepel copy.Microfiche copies, at $3.50, are also available from NTIS.Prices from either source are subject to change.
Addresses are:
NCDAINational Clseringhouse for Drug Abuse InformationRoom 10A-531'5600:Fishers LaneRockville, Maryland 20057
GPO .NTISSuperintendent of Documents National Technical InformationU.S. Government Printing Office. ServiceWashington; D.C. 20402 U.S. Department of Commerce
Springfield, Virginia 22161
1 FINDINGS OF DRUG ABUSE RESEARCH. Not available from NCOAt.Vol. 1: GPO out of stock NTIS P13 0272 067/AS $27.50Vol. 2: GPO out of stock NTIS P(3 0272 060/AS $27.50
2 OPERATIONAL DEFINITIONS IN SOCIO-OCHAVIOCAL DRUG USE RESEARCH1975.' Jack Elinsun, ph.o., 'and David-NurCO, Ph.D., eds. Notavailable from NCOAl.GPO out of stock NTIS PO 0246 333 /AS $14
3 AMINERGIC HYPOTHESES OF BEHAVIOR: REALITY OR CLICHE? Bruce J.Bernard, Ph.D., ed.GPO Stock'0017-024-00406-3 $2.25 ' NTIS PO 0246 607/AS $14
99
104

9
E
4 NARCOTIC ANTAGONISTS: THE SEARCH FCR LONG,AOTINIG PRERARATIONS.Robert Willette, Ph.D., ed.GPO Stock 0017-024-00488-0 $1.10 NTIS P8 4247 096/AS $6.50
5 YOUNG MEN AND ORLGS: A NATIONwIOC SURVEY. 'John A. O'Donnell,Ph.D., et al. Not available from NCOAI.GPO Stock 0017-024-00511-8 $2.25 NTIS P8 0247 446/AS $14
6 EFFECtS OF LABELING THE "CRUD ABUSER"; AN INQUIRY. ,tiay R..'
Williams, Ph.D.GPO Stock 0017-024-00512-6 $1.05 NTIS P8.0249 092/AS $6.50
7 CANNABINOID ASSAYS IN HUMANS. Robert willett, Ph.O., ed.GPO Stock 0017-024-00510-0 $1'.95 NTIS P8 4251 905/AS $12.50
8 Rx: 3x/WEEK LAAM - ALTERNATIVE TO METHADONE. Jack Blaine, m.0.,.
and Pierre Renault, M.D., eds.Not available from GPO NTIS P8 0253 763/AS $12.50
Julius,
ANTAGONISTS: NALTREXCNC PROGRESS REPORT. DemetriosJulius, M.D., and Pierre Renault, M.D., eds.GPO Stock 0017-024-00521-5 $2.55 NTIS PB 0255.833/AS $14:50
10 EPIDEMIOLOGY OF DRUG ABUSE: CURRENT ISSUES. Louise G. Richards,Ph.D., and Louise 8. Blevens, eds. Examines metlodological issuesin surveys and data collection. Not available from NCOAI.
GPO Stock 0017-024-00571-1 $2.60 NTIS P8 0266 691/AS $20
11 DRUGS ,ANO DRIVING. Robert Willette, Ph.D., ed. Reviewsresearch on effects of drugs on psychomotor performance, focusingon measures of impairment by dift5tnt drugs at various levels.GPO Stock 0017-024-00576-2 $1.70 NTIS PO 0269 602/AS $14
12 PSYCHoOYNAMICS Er DRUG DEPENDENCE. Jack D. Blaine, M,.Q. and
Demetrios A. Julius, M.O., eds. Theoretical and clinical chi
concerned with thd intrapsychic determinants of drug addiction.GPO Stock 0017-024-00642-4 $2.75 NTIS PO 0276 004/AS $15.50
13 COCAINE: 1977. Robert C. Petersen, Ph.D., and Richard C.
Stillman, M.O., cal. Reports the extent and limits of currentknowledge abdut cocaine, its use and Misuse. .
GPO Stock 0017-024-00592-4 $3 NTIS PO 0269 175/AS $17
14 MARIHUANA RESEARCH FINDINGS:ea. Technical mem on whichto Concress ;#as based.GPO Stock 0017-024-09622-0 Si
1976. Robert C. Petersen, MO:,the 6th marihuana and Health report
NTIS.P044271 279/AS $20
15 REVIEW or INHALANTS: LIPHORIA TO Or:FUNCTION. Charles wm,
Sharp, Ph.D., and Mary Lee Orehm, edl. Review of Inhalantabuse, including an extensive 1)11)11ov:01y.CPO Stock 1017-024-00650-5 $4.25 NTIS PO 4275 798/A5 $26
100
b
IS THE ERIDEmICLOGY cc mEPOIN AND OTHE4 NARCOTICS. Scan DunneRittenhouse, Ph.D., ed. Task rorce reccrt on researchtechnologies and imolicattions for studying heroin-narcotic use.
NTIS P9 $16.500276 357/AS $16.GPO Stock 41017-024-00690-4 $3.50
I-TR:SEARCH L1 SKIKING BEhAvIOR. murray E. ,3arvik, m.0.. Ph.0..et al., eds. Induces epidemiology, etiology, consecuences ofuse: and aPPrcaches to Oehavioral change. From a NIUA-sucoortedUCLA conference.CPO Stock 0017-024-00694-7 $4.50 NTIS P9 9276 353/AS $27.50
Id EILHAvIORAL TOLERANCE: RE5 ARCH At0 TPEATMLNT IMPLICATIONS.Norman A. Krasnegor, Ph.D. 'c0. Theoretical and empirical studiesof noncharmacologic factor 4n cevelopment of drug tolerance.CP0 Stock 00174724-00699-8 S2.75. NTIS PO 0276 337/AS $14
19 THE INTERNATIONAL CHALLENGE OF 4.1G AOUE. 'Robert C. Petersen,Ph.D.,- ). Papers from the VI WO 1. ,OrNreSS of PSyChi4try whichdeal with drug issues of particular interest worldwide.CP0 Stock 0017-024-0062,2-2 $4.50 NT15 PD 9243 607/AS $2';
20 SELF - ADMINISTRATION OF AOUSLD W8SIANCLS: NILTHOUS FOR 5TUDY.Norman A. Krasnegor, Ph.D., ed. ,Techniclues used to study basicprocesses underlying abuse of drugs, ethanol, food, and'tobacco.WO Stock 9017-024-00794-3 $3.75 NTIS P8 9268 471/AS $20
21 PHENCYCLIDINE (PCP) ABUSE: AN APPRAISAL. Robert C. Petersen,Ph.D., and Richard C. Stillman, M.D., eds. Pioneering volume forclinicians and researchers assessing what Is known about theproblem of PCP anuse.('0 Stock 0017-024-00785-4 $4.25 NTIS PO /298 472/AS $23
22 LAJASIV1: WANTITATIVC t)TRUOTURC ACTIVITY RELATIONSHIPS 1)-ANALOESWS, NAReof IC ANTAWNISTs, ANO HAELOCINUTNS. Gene8arnett, Ph.D.; Milan trsiC, Ph.0.1, and Robert Willotte, Ph.D.:eds. Reports from an interdisciplinary conference on themolecular nature of drug-receptor interactions.GPO Stock /017-024-00786-2 $5.25 NTIS P8 /292 265/AS $33.50
23 CIGARETTE SmOKING AS A OLTENOCNCE PROCESS.- Norman A.Krasnegor, Ph.O., rd, OisCualel faCtOr, involved in the onset,maintenance, and cessation of the cigarette smoking habit.10cludos 40 agenda for future rrsearch,GPO Stock 0017-024.400011.0 1.4,50 NTIS PU /217 721/AS $17
-..!a SYNTHETIC L'AIMAILS 1-014 MALI. ARIAS: STATISTICAL 140Rw:POP
PAmRs ANA) 04CUSSION. Js seph Stolobrtd. rd. 13400ra from 1wOrkIho0 Cosponsored by NIOA and the National Center for HealthStatistics on a C.111 of statistical approichel that yield hcylmvoestimates or data for States and local arras. Not avallaOle fromNCOAI.
GPO Stock M017-024-00111-1 S5 Nt1S 113 /291 001 /AS $21.30
101
106',

-
25 BEHAVIORAL -WOWS AND TREATMENT OF. SUBSTANCE ABUSE, Korman
A. KrasbegOr, Ph.D., ed. Papers present'commonalities.andimplications far-treatmentof dependency -on drugs,, ethanol, fopd,
and 'tobacco: -GPO Stock #017-024-00939.73-$4.50 NTIS PB #807112428 $20
. ' .
26 THE BEHAVIORAL ASPECTS OF SMOKING,'.Normaprasn'egor,ed. Reprint of ..the bOhaviotal.section of tviel 1979 .Report' of the
Surgeop .Ceneralon Smoking and Realth;,intrdductiOn by editor.
OPO.Stbck 4017-024,009t7-4 $4.25 PB #80-118755 $15.50 .
°,n. -
27.PROBLP5ODRUG DEPENDENCE<,e1919:.PROCEEDINGS OF THE 41ST
ANNUAL SCIENTIFIC MEETING' THE. COMMITTEEON PROBLEMS OF,DRUGDEPENDENCE, INC. Louis S'?"-Harris,Ph,D.,-ed. Not available.ftpm
NCDAI.GPO Stock. #6174024L-00981=4 $8 ''NTIS PB ` #80- 175482''$35
28 NARCOTIC ANTAGON:4STS: NALTREXONE PHARMACOCHEMISTRY ANDSUSTAINEORELEASE PREPARATIONS. Robert Willette, Ph.O., and_gene-Barnett, Ph.D., eds. Papers report research on insertedsustained-release and long-pcting drug devices, and on possible
..use with the narcotic antagonist naltrexone. In press.
29 DRUG ABUSE DEATHS TN NINE CITIES: 4 SURVEY REPORT, Louis A.
GOttSchalk, M.D., et al.- Epidemiologic study providing data,on.druarinvolveedeaths and procedures for their inyestigatiOns%--
Not available from NCDAI.GPO Stock #017-024-00982-2 $4.25 , NTIS PB 480-178882 $15.50
30 THEORIES ON DRUG ABUSE: SELECTED CONTEMPORARY PERSPECTIVES.
Dan 3. Lettieri,,Ph.D.; Mollie Sayers; and Helen Wallenstein
Pearson, eds. Volume presents summaries of the major contem-
porary theories of drug abuse by each of'43 leading theorists.
GPO Stock #017-024-00997-1 $8.50 Not available from NTIS"3
31 MARIJUANA RESEARCH FINDINGS: 198)3.-kobert C. Petersen, Ph.D'.,
ed. The text, of the 8th Marijuana and.Health report to Cong"rees
and the background scientific papers on which this slmmary report
Was based.GPO Stock.#017-624-01010-3 $5. NTIS PB #80-215171 $18.50.
32 GC/MS.ASSAYS FOR ABUSED DRUGS IN BODY FLUIDS. Rodger UP.'"Foltz,
Ph.D.; Allison F. Fentiman, Jr., Ph.D.; and Ruth B. Foltz. A
collection of methods for the quantitative analysis of several
important drugs of abuse by the technioue of gas chromatography_
massspedtrometry.GPO Stock #017-024-01015-4 $5 NTIS PB #81-133746 $17 0
34. PE/EMS OF DRUG DEPENDENCE, 1980: PROCEEDINGS OF THE 42ND
ANNUAL SCIENTIFIC MEETING, THE COMMITTEE ON PROBLEMS OF DRUG,
DEPENDENCE, INC. Louis S. Harris, Ph.D.,, ed. Comprehensive
assethblage of ongoing research on drug abuse, addiction, and new
compoundS.GPO Stock #017:024-01061-8 $7 NTIS PB-#81-194847 $32.
GPO : 1981 0 349-353