resuspension and transport of allergen-carrier particles
TRANSCRIPT

Resuspension and Transport of Allergen-carrier Particles
in Residential HVAC Systems
D. H. Kang1, D. H. Choi
2, P. Kremer
3, and J. D. Freihaut
4
1Department of Architectural Engineering, Pennsylvania State University, University
Park, PA 16802, USA; PH (814) 865-6394; FAX (814) 863-4789; email:
[email protected] 2 Department of Architectural Engineering, Pennsylvania State University, University
Park, PA 16802, USA; PH (814) 865-6394; FAX (814) 863-4789; email:
[email protected] 3Department of Architectural Engineering, Pennsylvania State University, University
Park, PA 16802, USA; PH (814) 865-6394; FAX (814) 863-4789; email:
[email protected] 4Department of Architectural Engineering, Pennsylvania State University, University
Park, PA 16802, USA; PH (814) 865-6394; FAX (814) 863-4789; email:
ABSTRACT
HVAC systems play an important role in transporting allergen-carrier particles that
trigger asthma episodes in residential indoor environments. Unfiltered particles
deposited on interior duct surfaces resuspend and transport when disturbed under
mechanical vibration and varying air flow conditions in the system. Experimental
data is needed to characterize the behaviors of individual allergen-carrier particles in
response to HVAC system disturbances and to inform modeling work that will lead to
better design and performance guidance for builders seeking to improve indoor air
quality in residential settings. In this study, a combination of experimental work in
residential settings and in a more controlled laboratory resuspension chamber setup is
conducted to characterize the resuspension of allergen-carrier particles deposited in
residential HVAC ductwork and to obtain resuspension rate data for individual
allergen-carrier particles in various HVAC system environments. The results of this
research investigation are important to understanding the behavior of allergen sources
in residential homes.
INTRODUCTION
Asthma is a life threatening disease that is affecting one in every ten residents in
Pennsylvania. In particular, high rates of asthma hospitalization were shown for
children and adults over 65 who tend to spend many hours at home (PDOH, 2012).
2nd Residential Building Design & Construction Conference - February 19-20, 2014 at Penn State, University Park PHRC.psu.edu
383

Despite attainment of general reductions in outdoor air pollutant levels, increases in
asthma prevalence has led many researchers to focus on the home environment as a
potential risk factor (Custovic et al., 1998).
Factors that are known to trigger asthma episodes include exposure to house dust and
allergens (e.g., dust mite, cockroach, pet dander and fur dust, pollen). Allergens
adhere to dust particles found in indoor air pathways (Gomes et al., 2007).
Entrainment of dust in air supplied and recirculated in residential HVAC systems is
affected by several aspects of the system design. Dust particles containing allergens
deposit on interior duct surfaces, then resuspend and transport when disturbed under
varying air flow conditions and mechanical vibrations in the system. Currently,
ASHRAE 62.2 requires that HVAC system air filters meet a minimum efficiency
reporting value (MERV) of 6 for residential applications (ASHRAE, 2010). At this
MERV rating, the average particle size efficiency from 3 to 10 µm, is between 35 –
50%, which allows respirable (generally defined as particles less than 10 µm in size)
unfiltered particles to remain a problem. Filter bypass, which is a common problem in
HVAC systems, increases the dust load further. Hence, the potential for particles
distributed through HVAC system ducting to affect indoor occupant exposure is
significant.
Although it is important to understand particle resuspension and transport behavior,
experimental data is still limited. Previous studies (Wang et al., 2012) have attempted
to analyze the lumped behavior of “average” dust particles resuspended in ducts.
However, lumped behavior does not consider important aspects of individual
allergen-carrier particles, whose resuspension behavior differs by particle type to
various disturbances. Resuspension characteristics of individual allergen-carrier
particles need to be investigated to gain insight into the impact of in-duct particles on
occupant exposure and to develop best-practice mitigation approaches.
The objective of this study is to characterize resuspension and transport of allergen-
carrier particles deposited in residential HVAC ductwork. Field measurements are
carried out to establish the typical range of disturbances for residential HVAC duct
settings. Subsequently, laboratory measurements are performed to measure
resuspension rates of particles deposited on residential HVAC duct materials under
the established disturbances. Measured resuspension data are used in the development
of models to predict particle concentrations in the indoor environment, and to
investigate the impact of in-duct particle resuspension and transport on occupant
exposure, which is the broader goal of this work.
2nd Residential Building Design & Construction Conference - February 19-20, 2014 at Penn State, University Park PHRC.psu.edu
384

FIELD MEASUREMENT
Overview. Field measurement is designed to determine the particle disturbance
factors in HVAC duct within actual residential settings. The measured disturbances
are used for laboratory experiment and computational fluid dynamic simulation to
quantify the particle resuspension rate and assess human exposure to indoor particle
due to HVAC operation, respectively.
Measurement of mechanical vibration in the HVAC system. Mechanical
vibrations in the HVAC ducting during start-up and steady-state operation of the
packaged unit at various flows in the duct is measured using an array of
accelerometers coupled to a wireless dynamic signal analyzer as shown in Figure 1a.
Measurement locations are near the diffusers in the duct runs and at the air handler.
Accelerometers are placed onto interior and /or exterior duct surfaces.
a.
b. c.
Figure 1. a. Schematic diagram of the field experiment at the MorningStar Solar
Home; b. Particle sizing units that will be used to measure real time particle size
distributions from 0.02 to 20 microns within the ductwork; c. Spatial profiling
particle sizing set up.
2nd Residential Building Design & Construction Conference - February 19-20, 2014 at Penn State, University Park PHRC.psu.edu
385
Measurement of air flow, temperature and RH in the HVAC system. Air flow
conditions in the HVAC duct are measured using multi-function anemometer probes
and barometers at various set points for the packaged unit serving the duct runs.
Measurement of resuspended particles in the HVAC system. Resuspension of
existing particles in the MorningStar Solar Home ductwork and the space served by
the ductwork is measured within the ductwork and outside of the ductwork using
particle counters shown in Figure 1b.
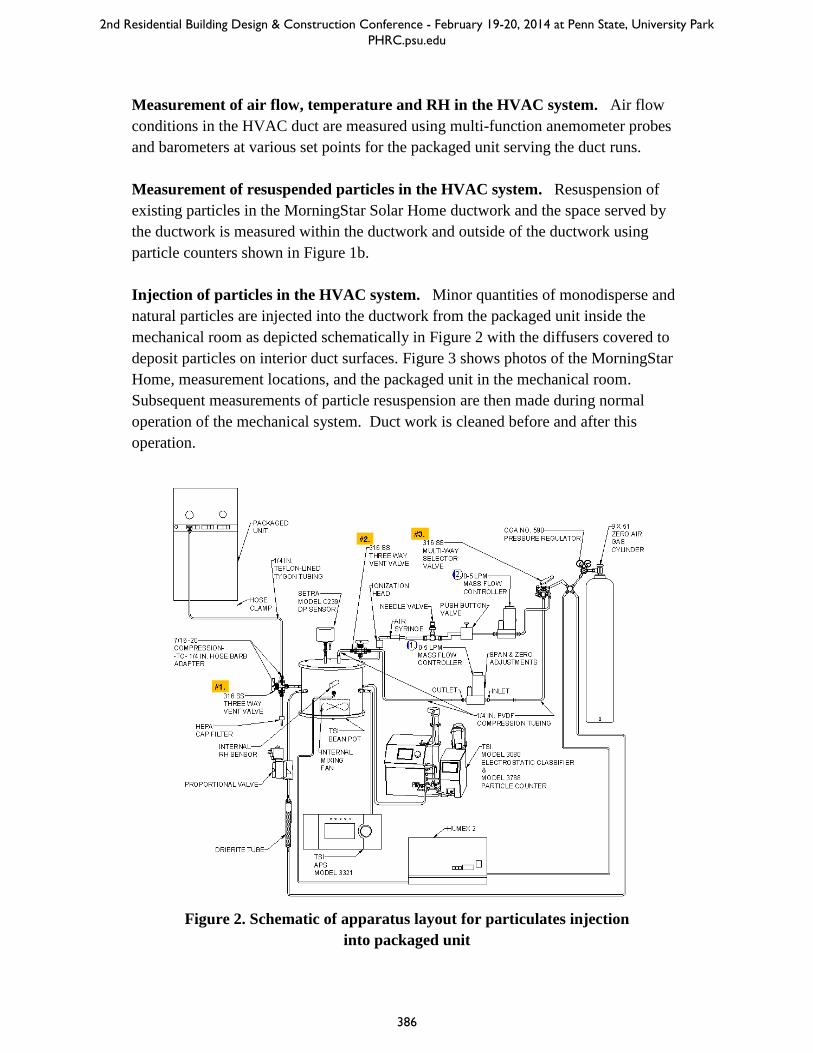
Injection of particles in the HVAC system. Minor quantities of monodisperse and
natural particles are injected into the ductwork from the packaged unit inside the
mechanical room as depicted schematically in Figure 2 with the diffusers covered to
deposit particles on interior duct surfaces. Figure 3 shows photos of the MorningStar
Home, measurement locations, and the packaged unit in the mechanical room.
Subsequent measurements of particle resuspension are then made during normal
operation of the mechanical system. Duct work is cleaned before and after this
operation.
Figure 2. Schematic of apparatus layout for particulates injection
into packaged unit
2nd Residential Building Design & Construction Conference - February 19-20, 2014 at Penn State, University Park PHRC.psu.edu
386

a.
b. c.
Figure 3. a. MorningStar Solar Home; b. Two of four measurement locations
near duct diffusers; c. Packaged unit in mechanical room; red dots are
approximate locations for ½ in. diameter traverse caps to be installed in the
ductwork to enable velocity profiling and to fit particle injection line
LABORATORY RESUSPENSION EXPERIMENT
Overview. The laboratory resuspension experiment is designed to investigate the
particle resuspension from various HVAC duct materials under the controlled HVAC
disturbance forces. The measured actual HVAC disturbances such as mechanical
vibration and air flow rates in the MorningStar Solar Home are replicated in the
laboratory chamber experiment. The details of laboratory resuspension experiments
are as follows.
Test Dusts and Flooring Samples. Quartz as a non-biological particle, and dust
mite, dog fur dust and cat fur dust as biological particles are selected for this study.
Quartz is one of the mineral aerosols which are commonly produced outdoors and
enter through windows/cracks or are brought by occupants. Crushed Quartz #10
2nd Residential Building Design & Construction Conference - February 19-20, 2014 at Penn State, University Park PHRC.psu.edu
387

bt#4339 (Particle Technology Limited, UK) is used for the testing. For dust mite,
Spent Mite Culture powder (Indoor Biotechnologies Inc., USA) is used. The dust
mite samples are milled to produce fine mixed powder. The milled dusts are sieved to
separate the particles. Dog fur dust and cat fur dust are prepared from respective pet
animal fur collected from local pet grooming companies, which are then milled and
separated using sieve. The grinding and sieving process is considered to prevent the
dust particles from forming particle-to-particle agglomeration.
The particle size distribution of four test dusts is characterized using Wet and Dry
Laser Diffraction (Mastersizer S, Malvern, UK) which has 64 bins between 0.05 and
900 μm. To confirm whether the test dusts represented typical indoor dust, the
particle size distribution of test dusts is compared to that of Standard Reference
Material (SRM 2583 Indoor Dust) distributed by NIST (National Institute of
Standards and Technology). The NIST SRM 2583 is composed of dust collected from
vacuum cleaner bags in dwelling space (US NIST 2010). For the experiment, typical
metal duct and fibre-glass duct which are commonly used for residential duct systems
are used as particle reservoirs. The dimension of each flooring sample is 90 mm x 90
mm.
Resuspension Chamber Experiment Setup To examine the resuspension behavior
of test dusts affected by particle disturbances factors, which were measured in field
tests, laboratory small-scale chamber experiments are performed in controlled
temperature, relative humidity, background particle level of supply air and
mechanical/aerodynamic disturbance conditions. The chamber system is originally
constructed for the research of particle resuspension subjected to mechanical and
aerodynamic disturbance (Gomes et al. 2007). Figure 4 shows the schematic diagram
of resuspension chamber system. The system consists of a resuspension chamber, an
air control system and a data acquisition (DAQ)/control system. The air control
system consists of a temperature/humidity environmental chamber, a desiccant, a
HEPA filter and pumps.
The resuspension chamber is made of stainless steel and has a size of 400 × 200 ×
200 mm (L × W × H). The bottom center of the chamber has an area of 100 × 200
mm (L × W) where a test flooring sample is placed. As a part of the chamber, an
actuator-induced mechanical shaker (F4, Wilcoxon, USA) and six aerodynamic air-jet
nozzles made of copper are embedded beneath the chamber to stimulate the flooring
sample with the vibration and air swirl caused by occupant walking. The controlled
air supplied from the air control system is passed into the resuspension chamber. An
inlet porous panel (1100S-0039-02-A, Mott Corp., USA) is installed at the
longitudinal square cross section of the entrance of the chamber to ensure uniform
2nd Residential Building Design & Construction Conference - February 19-20, 2014 at Penn State, University Park PHRC.psu.edu
388

distribution of the air. The laminar air flow sweeps the chamber carrying resuspended
particles into the sampling line attached to the exhaust port. The exhaust flow is
collected through an optical particle counter. The pressure inside of the chamber is
measured by a pressure gauge (2020S AKPT, Orange Research, USA) to ensure the
chamber was pressurized relative to the laboratory.
Figure 4. Schematic diagram of resuspension chamber system
The humidity and temperature of the supply air is controlled using a
temperature/humidity environmental chamber (SM-8-3800, Thermotron, USA). The
environmental chamber provides temperature range from -70 ℃ to 180 ℃ and
humidity range from 35% to 97% at 21 ℃. The air from the environmental chamber
is mixed with the air from the desiccant cartridge to meet desired humidity conditions
using a proportional mixing valve. The temperature/humidity controlled supply air is
filtered (HEPA CAP36, Whatman, UK) and pumped (1532-101-6288X, GAST, USA)
to the resuspension chamber. The temperature and relative humidity within the
2nd Residential Building Design & Construction Conference - February 19-20, 2014 at Penn State, University Park PHRC.psu.edu
389

resuspension chamber is monitored by a temperature/humidity sensor (HX15-W,
OMEGA, USA).
The experiments are controlled and the data from sensors and optical particle counter
were collected in a data acquisition (DAQ)/control system. For a high degree of
automatic control and data acquisition, LabView (version 8.20, National Instrument,
USA) is used communicating with a DAQ board (PCI 6259, National Instrument,
USA).
Seeding and Measuring Procedures. To uniformly seed the test dusts on flooring
samples for resuspension experiments, a particle disperser chamber is used. The
chamber is made up of glass and stainless steel plates with dimensions of 760 × 760 ×
420 mm (L × W × H), which is sealed and air tight. Total of nineteen flooring
samples are laid out in five rows with five samples in each row except in the middle,
where a particle injection nozzle is located. Each test dusts are injected in the amount
3 g m-2
by a compressed air line from a scale syringe to a cone, which is attached at
the end of the particle injection nozzle. An air-jet is simultaneously injected from
another nozzle hung from the top of the chamber to impact the cone. At the same time,
four miniature fans placed in each of the four corners of the chamber are activated to
ensure uniform dispersion of the dusts.
After the seeding process, the flooring samples are placed in a sample conditioning
chamber with protective lids for at least 24 hours before each resuspension
experiment to give sufficient time to reach the desired relative humidity equilibrium.
The sample conditioning chamber is a plastic storage container, which enabled the
samples to be controlled at desired relative humidity conditions. The conditioned
flooring sample is placed in the resuspension chamber, and then the supply air is
introduced at the flow rate of 0.0259 m3 min
-1. Simultaneously, disturbance signal is
activated and the particle concentration is measured at the exhaust port of the
resuspension chamber. Sixteen-second disturbance signal ran for four minutes. Air
samples from the chamber are measured using an optical particle counter (Spectro .3,
Climet Instruments, USA) with a sampling rate of 7.9 × 10⁻³
m3 min
-1. The optical
particle counter has 16 bins between 0.3 to 10 μm. The particle concentration is
measured every second per unit of air volume during 4-min testing period. During the
resuspension experiments, the mechanical vibration and air flow patterns measured in
MorningStar Solar home is replicate in the resuspension chamber by using the
accelerometer and air nozzles located in the resuspension chamber.
Before each test, the particle disperser chamber and resuspension chamber are
thoroughly cleaned. To check the cleanliness of the resuspension chamber, the
2nd Residential Building Design & Construction Conference - February 19-20, 2014 at Penn State, University Park PHRC.psu.edu
390

background sample of the particle concentration is taken prior to each test. The
LabView code in the DAQ system enables monitoring the real-time background data
from the optical particle counter until the number reached a threshold value of 5
particles m-3
.
Estimation of resuspension rate. Resuspension rate (RR) is calculated as the
fraction of a surface species removed in unit time as shown in Equations (1) and (2).
(1)
∫
∫
(2)
where RRd is the resuspension rate for particle size d, Gd is the surface removal rate
for particle size d, Cd,surface is the surface dust concentration for particle size d,
Qsampling is the sampling air volume flow rate, Cd, air is the air dust concentration for
particle size d, Asurface is the surface area. The mean value of the 2-min data is used as
a representative resuspension rate for each particle size of test dusts.
CFD (COMPUTATIONAL FLUID DYNAMICS) SIMULATION
Overview. Indoor airflow and particle dispersion in a Morning Star Solar Home is
simulated by CFD modeling. Resuspension data previously measured in the
laboratory resuspension experiment are used in the development of models to predict
particle concentrations in the indoor environment, and to investigate the impact of in-
duct particle resuspension and transport on occupant exposure.
Indoor Airflow and Particle Transport Analysis. The indoor airflow is modeled by
the renormalization group (RNG) k-ε turbulence model. The RNG k-ε turbulence
model is suggested to be suitable for indoor airflow simulation. The particle
dispersion is modeled by a Lagrangian discrete random walk (DRW) model. The
Lagrangian method solves the momentum equation based on Newton’s law to
calculate the trajectory of each particle. This study uses Fluent 6.0 with GAMBIT as a
pre-processor for the simulation.
( )
(3)
where up is velocity vector of the particle; ua is the velocity vector of the air; FD(ua -
up) is the drag force per unit particle mass; ρp is the particle density; ρa are the air
density; g is the gravitational acceleration vector, and Fa is the additional forces.
2nd Residential Building Design & Construction Conference - February 19-20, 2014 at Penn State, University Park PHRC.psu.edu
391

a. b.
Figure 5. a. 3-dimensional modeling of MorningStar Solar Home; b. CFD mesh
generation
a. b.
Figure 6. a. Velocity magnitude contour plot on the YZ cross-section plane near
supply register; b. Velocity magnitude contour plot on the XZ cross-section
plane near supply register and return grill
Figure 5 shows the 3-dimensional modeling of MorningStar Solar Home and the
result of CFD mesh generation. Figure 6 shows the velocity magnitude contour plot
on the YZ cross-section plane near supply register and the velocity magnitude contour
plot on the XZ cross-section plane near supply register and return grill.
Particle Concentration Analysis. PSI-C (particle source in cell) method is used to
calculate the particle concentration in the modeled space [Bin paper 9].
∑
(4)
where Cj is the mean particle concentration in a cell, Vj is the volume of a
computational cell for particles, dt is the particle residence time, and subscript i and j
2nd Residential Building Design & Construction Conference - February 19-20, 2014 at Penn State, University Park PHRC.psu.edu
392

represent the ith trajectory and the jth cell, respectively. Ṁ is the flow rate of each
trajectory.
Validation of CFD model. To validate the CFD model described above, the
experimental data from the previous research is used. The experiment was carried out
for the particle of which diameter of 10 μm in the space of 0.8 m× 0.4 m × 0.4 m
(Length × Width × Height). The CFD model for validation was identically set to have
the same location of openings, diffuser location and air velocity as the experimental
case.
CONCLUSION
The research is currently ongoing, partially funded by PHRC (Pennsylvania Housing
Research Center). The experimental setup required for the field and laboratory
experiments has been completed as described in this paper. Also, CFD model to
assess human exposure to indoor particle has been done. The study will measure the
disturbances of particle resuspension in MorningStar Solar Home and subsequently
conduct the resuspension chamber experiment to rigorously quantify the particle
resuspension rates suggested in this paper. Finally, the particle resuspension rates for
the various indoor particles and duct materials will be used for CFD simulation to
assess human exposure to indoor particles. It is expected that the research can
contribute to assessing the health risk of occupants due to exposure to indoor
particulate, which may be induced by HVAC duct.
REFERENCES
The Pennsylvania Department of Health. (2012). “Pennsylvania asthma burden
report.”
Custovic, A., Smith, A., and Woodcock, A. (1998). “Indoor allergens are a primary
cause of asthma.” European Respiratory Review, 8(53), 155-158.
Gomes, C., Freihaut, J.D., and Bahnfleth, W. (2007). “Resuspension of Allergen-
Containing Particles under Mechanical and Aerodynamic Disturbances from
Human Walking.” Atmos. Environ., 41, 5257-5270.
ASHRAE. (2010). “Ventilation and acceptable indoor air quality in low-rise
residential buildings” Standard 62.2, American Society of Heating,
Refrigerating and Air Conditioning Engineers, Atlanta.
Wang, S., Zhao, B., Zhou, B., Tan, Z. (2012). “An experimental study on short-time
particle resuspension from inner surfaces of straight ventilation ducts” Build.
Environ., 53, 119-127.
2nd Residential Building Design & Construction Conference - February 19-20, 2014 at Penn State, University Park PHRC.psu.edu
393

Zhao, B., Yang, C., Yang, X., and Liu, S. (2008). “Particle dispersion and deposition
in ventilated rooms: Testing and evaluation of different Eulerian and
Lagrangian models” Build. Environ., 43, 388-397.
Zhang, Z., Chen, Q. (2006). “Experimental measurements and numerical simulation
of fine particle transport and distribution in ventilated rooms” Atmos. Environ.,
40, 3396–3408.
2nd Residential Building Design & Construction Conference - February 19-20, 2014 at Penn State, University Park PHRC.psu.edu
394