retail capacity study - lewisham council a vitality and viability health-checks appendix b study...
TRANSCRIPT
�
Lewisham local development framework
Retail Capacity Study
November 2009
LONDON BOROUGH OF LEWISHAM
RETAIL CAPACITY STUDY
CL/11936/NG/JEH/LCJ
November 2009
Nathaniel Lichfield & Partners Ltd
14 Regent's Wharf
All Saints Street
London N1 9RL
Offices also in
Cardiff
Manchester
Newcastle upon Tyne
T 020 7837 4477
F 020 7837 2277
www.nlpplanning.com
Contents
1.0 INTRODUCTION 1
The Study 1
Content of the Study 1
2.0 PLANNING POLICY CONTEXT 3
National Retail Planning Policy 3
The London Plan 10
Consumer Expenditure and Comparison Goods Retail Floorspace Need in
London (March 2009) 11
Convenience Goods Floorspace Need in London (June 2005) 12
East London Sub-Regional Development Framework (2006) 13
Lewisham Unitary Development Plan 13
Local Development Framework 15
3.0 THE SHOPPING HIERARCHY 16
Major Shopping Centres in the London Borough of Lewisham and the
Surrounding Area 16
Centre Audits 19
Lewisham Major Town Centre 19
Catford Major Town Centre 20
Blackheath District Centre 21
Deptford District Centre 22
Downham District Centre 23
Forest Hill District Centre 24
Lee Green District Centre 25
New Cross District Centre 26
Sydenham District Centre 27
4.0 HOUSEHOLD SURVEY 29
Survey Structure 29
Food and Grocery Shopping 30
Non-Food Shopping 31
Likes and Dislikes about Shopping 34
Markets 36
Leisure Activities 38
5.0 QUANTITATIVE & QUALITATIVE SCOPE FOR NEW RETAIL DEVELOPMENT 40
Introduction 40
Methodology and Data 40
Population and Spending 41
Existing Retail Floorspace 2009 43
Existing Spending Patterns 2009 44
Quantitative Capacity for Additional Convenience Floorspace 47
11936/679166v2
Quantitative Capacity for Additional Comparison Floorspace 52
Scope for Additional Comparison Floorspace with increased retention for
Lewisham Town Centre 56
Sensitivity Analysis 57
Qualitative Need 58
6.0 SCOPE FOR ACCOMMODATING GROWTH 61
Floorspace Projections 61
Accommodating Future Growth 62
Potential Development Opportunities 63
Evaluation of Potential Development sites 65
Summary of Capacity 69
7.0 RECOMMENDATIONS AND CONCLUSIONS 71
Introduction 71
Meeting Shopping Needs within the London Borough of Lewisham 71
Convenience Goods Floorspace 72
Comparison Goods Floorspace 72
Existing Centres and Current Strategies 73
Scope for Accommodating Growth 75
Future Strategy Implementation and Monitoring 77
APPENDICES
Appendix A Vitality and Viability Health-Checks
Appendix B Study Area and Existing Retail Facilities
Appendix C Household Survey Results
Appendix D Convenience Retail Assessment
Appendix E Comparison Retail Assessment
Appendix F Analysis of Potential Development Sites
11936/679166v2
1.0 INTRODUCTION
The Study
1.1 Nathaniel Lichfield & Partners (NLP) was commissioned by the London Borough
of Lewisham (LBL) to prepare a Retail Capacity Study (RCS) for the Borough.
This RCS 2009 updates the original Retail Capacity and Site Allocations Study
(RCASAS) which was published in July 2004 and was also undertaken by NLP.
1.2 The RCS 2009 responds to the consultants brief prepared by LBL and is
informed by the RCASAS 2004. The RCS 2009:
• assesses the existing supply, and the capacity for additional retail
floorspace within the Borough (convenience and comparison goods) and
the role played by each of the nine Major and District town centres;
• assesses the potential future role and capacity within existing town
centres over the period to 2025;
• identifies potential sequential opportunities to accommodate growth
within centres, and outside, if necessary, over the period to 2025;
• provides a review of the existing retail hierarchy and identifies any
deficiencies in the existing network together with future development
strategies;
• identifies issues and options for the future of Lewisham’s town centres;
• provides an assessment of, and likely timescale for, individual identified
sites to meet the retail need as well as efficiency increases and other
policy objectives to assess residual capacity to 2025. Reference is made
to the GLA Experian Retail Reports entitled “Convenience Goods
Floorspace Need in London (June 2005)” and “Consumer Expenditure
and Comparison Goods Retail Floorspace Need in London (March 2009);
• takes full account for the floorspace needed to achieve the policy
objective of moving Lewisham Town Centre up the retail hierarchy to a
Metropolitan Centre and whether the joining of New Cross and New Cross
Gate centres into one is consistent with the strategy for Lewisham Town
Centre and other centres.
Content of the Study
1.3 This Study responds to the consultants brief and is informed by the format of
the RCASAS 2004. Section 2.0 provides an overview of the national, strategic
and Unitary Development Plan policy context. Section 3.0 sets out the
shopping hierarchy in and around the LBL.
1.4 Section 4.0 summarises current shopping patterns based on the results of a
household survey undertaken by NEMS as part of this Study and compares
P1/79 11936/679166v2
these to the results obtained in 2004. Section 5.0 sets out the quantitative
analysis of the scope for further retail floorspace and Section 6.0 reviews how
this may be accommodated, including potential retail development sites in the
Borough.
1.5 Our recommendations and conclusions arising from this are contained at
Section 7.0.
P2/79 11936/679166v2
2.0 PLANNING POLICY CONTEXT
National Retail Planning Policy
2.1 PPS6: Planning for Town Centres (March 2005) sets out the Government’s
policies on town centres, retail, commercial leisure and other town centre uses.
2.2 The Government’s key objective for town centres (this covers city, town, district
and local centres) is to promote their vitality and viability by planning for growth
and development of existing centres and promoting and enhancing existing
centres, by focusing development in such centres and encouraging a wide
range of services in a good environment, accessible to all.
2.3 Other Government objectives that need to be taken account of in the context of
the key objective are set out in paragraph 1.4 of PPS6:
• Enhancing consumer choice by making provision for a range of shopping,
leisure and local services, which allow genuine choice to meet the needs
of the entire community and particularly socially excluded groups;
• Supporting efficient, competitive and innovative retail, leisure, tourism
and other sectors, with improving productivity; and
• Improving accessibility, ensuring that existing or new development is, or
will be, accessible and well served by a choice of means of transport.
2.4 Regional planning bodies (RPB’s) and local planning authorities (LPAs) are
advised in paragraph 1.6 to implement the Government’s objectives for town
centres, by planning positively for their growth and development. They should
therefore:
• develop a hierarchy and network of centres;
• assess the need for further main town centre uses and ensure there is
capacity to accommodate them;
• focus development in, and plan for the expansion of, existing centres as
appropriate, and at the local level identify appropriate sites in
development plan documents;
• promote town centre management, creating partnerships to develop,
improve and maintain the town centre and manage the evening and night
time economy; and
• regularly monitor and review the impact and effectiveness of their
policies for promoting vital and viable town centres.
2.5 Paragraph 2.1 states that in order to deliver the Government’s key objective,
RPB’s and LPA’s should actively promote growth and manage change in town
P3/79 11936/679166v2
centres, define the network and a hierarchy of centres, each performing their
appropriate role to meet the needs of their catchment, and adopt a pro-active,
plan-led approach to planning for town centres, through regional and local
planning.
2.6 The main town centre uses to which PPS6 applies are outlined in paragraph
1.8:
• retail (including warehouse clubs and factory outlet centres);
• leisure, entertainment facilities and the more intensive sport and
recreation uses (including cinemas, restaurants, drive-through
restaurants, bars and pubs, night-clubs, casinos, health and fitness
centres, indoor bowling centres and bingo halls);
• offices, both commercial and those of public bodies; and
• arts, culture and tourism (theatres, museums, galleries and concert
halls, hotels and conference facilities).
2.7 Paragraph 1.9 of PPS6 also acknowledges that housing will be an important
element in most mixed-use, multi-storey developments.
2.8 PPS6, paragraphs 2.15 to 2.17 offers specific guidance to LPA’s on the role of
plans at local level, including the need to work in conjunction with stakeholders
and the community to:
• assess the need for new floorspace for retail, leisure and other main
town centre uses, taking account of both quantitative and qualitative
considerations;
• identify deficiencies in provision, assess the capacity of existing centres
to accommodate new development, including, where appropriate, the
scope for extending the primary shopping area and/or town centre, and
identify centres in decline where change needs to be managed;
• identify the centres within their area where development will be focused,
as well as the need for any new centres of local importance, and develop
strategies for developing and strengthening centres within their area;
• define the extent of the primary shopping area and the town centre, for
the centres in their area on their Proposals Map;
• identify and allocate sites in accordance with the considerations on site
selection and land assembly e.g. assessment of need, appropriate scale
of development, sequential approach, impact and accessibility (set out in
para. 2.28-2.51 of PPS6);
• review all existing allocations and reallocate sites which do not comply
with PPS6;
P4/79 11936/679166v2

• develop spatial policies and proposals to promote and secure investment
in deprived areas by strengthening and/or identifying opportunities for
growth of existing centres, and to seek to improve access to local
facilities; and
• set out criteria based policies, in accordance with PPS6, for assessing
and locating new development proposals, including development on sites
not allocated in development plan documents.
2.9 PPS6 also indicates that:
“In addition to defining the extent of the primary shopping area for their
local centres, LPA’s may distinguish between primary and secondary
frontages. These frontages should be realistically defined. Having regard to
the need to encourage diversification of uses in town centres as a whole,
primary frontages should contain a high proportion of retail uses, while
secondary frontages provide greater opportunities for flexibility and diversity
of uses. Where frontages are identified the appropriate local development
documents should includes policies that make clear which uses will be
permitted in such locations.”
(Para.2.17, PPS6)
Demonstrating Need for development
2.10 PPS6 requires Councils to undertake assessments of need for retail and other
non-retail town centre uses. Paragraph 2.33 states that:
“In assessing the need and capacity for additional retail and leisure
development, local planning authorities should place greater weight on
quantitative need for additional floorspace for the specific types of retail and
leisure developments. However local planning authorities should also take
account of qualitative considerations. In deprived areas which lack access
to a range of services and facilities, and there will be clear and
demonstrable benefits in identifying sites for appropriate development to
serve the communities in these areas, additional weight should be given to
meeting these qualitative considerations”.
2.11 In assessing quantitative need for additional development, local planning
authorities should assess the likely future demand for additional retail and
leisure floorspace, having regard to a realistic assessment of the existing
forecast population levels, forecast expenditure for specific classes of goods to
be sold, within the broad categories of comparison and convenience goods and
for main leisure sectors and forecast improvements in productivity in the use of
floorspace.
2.12 With regards to assessing the qualitative need for additional development,
paragraph 2.35 states:
P5/79 11936/679166v2
“In assessing the qualitative need for additional development when
preparing its development plan documents, a key consideration for a LPA
will be to provide for consumer choice, by ensuring that:
- an appropriate distribution of locations is achieved, subject to the key
objective of promoting the vitality and viability of town centres and the
application of the sequential approach, to improve accessibility for the
whole community; and
- provision is made for a range of sites for shopping, leisure and local
services, which allow genuine choice to meet the needs of the whole
community, particularly the needs of those living in deprived areas.”
2.13 Other issues, although not necessarily elements of ‘need’, can be important
material considerations.
Appropriate Scale of Development
2.14 PPS6 also requires that local planning authorities ensure that the scale of
opportunities identified is directly related to the role and function of the centre
and its catchment. Paragraph 2.41 states:
“The aim should be to locate the appropriate type and scale of development
in the right type of centre, to ensure that is fits into that centre and that it
complements its role and function.”
2.15 For city and town centres, PPS6, paragraph 2.43 states that where a need has
been identified, LPA’s should seek to identify sites in the centre, or failing that
on the edge of the centre, capable of accommodating larger format
developments. Paragraph 2.42 indicates that in most cases it is likely to be
inappropriate to include local centres within the search area to be applied
under the sequential approach for large scale developments.
2.16 The guidance places greater emphasis on the regeneration of town centres,
particularly smaller centres and the need to define a network of centres, and
where appropriate to plan for the decline of some centres. Local authorities
are expected to set indicative upper limits on the scale of new floorspace
appropriate in different types of centres.
The Sequential Approach
2.17 PPS6 sets out the sequential approach to site selection for new retail
development (paragraph 2.44), namely that first preference should be existing
centres where suitable sites or buildings for conversion are, or are likely to
become available, taking account of an appropriate scale of development in
relation to the role and function of the centre, followed by edge-of-centre
locations, with preference given to sites that are or will be well-connected to the
centre and only then out-of-centre sites, with preference given to sites which are
or will be well served by a choice of means of transport and which are close to
the centre and have a high likelihood of forming links with the centre.
P6/79 11936/679166v2
2.18 Further to this LPA’s should, in consultation with stakeholders (including the
development industry) and the community, identify an appropriate range of sites
to allow for accommodation of the identified need. Paragraph 2.45 emphasises
the need for flexibility and realism from both LPA’s and developers and
operators in discussing the identification of sites,
“LPA’s should be sensitive to the needs of the community and
stakeholders, including developers and operators and identify sites that
are, or are likely to become available for development during the
development plan document period and which allow for the
accommodation of the identified need, including sites capable of
accommodating a range of business model.”
2.19 The factors that should be taken into account in considering business models
are scale, format, car park provision and the scope for disaggregation.
2.20 In selecting sites for allocation, the LPA should also consider the degree to
which other considerations, including specific local circumstances, may be
material to the choice of appropriate locations for development, and these
include physical regeneration, employment, economic growth and social
inclusion.
2.21 The guidance clearly states that local planning authorities should plan positively
for growth by making provision for a range and choice of shopping and services.
If a ‘need’ for new development is established, it will be necessary to identify
opportunities to meet that need. PPS6 indicates that local authorities should
allocate sufficient sites to meet anticipated demand for the next five years.
PPS6 also suggests that an apparent lack of sites of the right size and in the
right location should not be construed as an obstacle to site allocation and
development to meet this need. Local planning authorities should consider the
scope for effective site assembly using their compulsory purchase order (CPO)
powers, to ensure that suitable sites within or on the edge of centres are
brought forward for development.
2.22 This suggests the onus is placed on the Council to identify sites to
accommodate the 5-year demand for development. This Study provides
floorspace projections up to 2025. Therefore, it is not likely to be appropriate
for the Council to seek to identify opportunities to accommodate projections up
to 2025 at this stage.
2.23 PPS6 also suggests that where growth cannot be accommodated in identified
existing centres, local planning authorities should plan for the extension of the
primary shopping area if there is a need for additional retail provision or, where
appropriate, plan for the extension of the town centre to accommodate other
main town centre uses. Extension of the primary shopping area or town centre
may also be appropriate where a need for large developments has been
identified and this cannot be accommodated within the centre. Larger stores
may deliver benefits for consumers and local planning authorities should seek
to make provision for them in this context. In such cases, local planning
authorities should seek to identify, designate and assemble larger sites
adjoining the primary shopping area (i.e. in edge-of-centre locations). P7/79 11936/679166v2
Draft PPS4: Planning for Prosperous Economies (May 2009)
2.24 On 5th May 2009, the Department for Communities and Local Government
published a consultation paper on a new PPS4: Planning for Prosperous
Economies. This follows the publication of the “Proposed Changes to PPS6” in
July 2008 which sets the context for emerging retail planning policy as set out
in draft PPS4. Draft PPS4 incorporates the town centre and retail policy
statements contained in PPS6 and the policies on economic development in
urban and rural areas in PPG4, PPG5 and PPS7 into a single PPS. The aim of
the document is “to make planning policies clearer, more concise, more
businesslike and easier to use” and brings together all the Government’s key
planning policies relating to the economy.
2.25 The Good Practice Guide on Need, Impact and the Sequential Approach was
published alongside PPS4 as a “living draft” to help practitioners implement its
policies. PPS4 places retail and other town centre development in a wider
context, as “economic development” which provides employment, generates
wealth and/or economic growth. This brief summary and comment deals with
the retail and town centre elements of PPS4 only.
Plan Making
2.26 In common with PPS6, there remains considerable emphasis on the plan-led
approach and the “town centres first” policy.
2.27 The roles and responsibilities for regional planning bodies and local planning
authorities in preparing the evidence base that will underpin development plan
policy are clearly specified. Regional planning bodies will focus on the
requirements for comparison retail, leisure and office uses, and must define a
network and hierarchy of higher level centres.
2.28 New requirements for local planning authorities include the need to:
• identify deficiencies in floorspace provision, including the provision
of local convenience shopping and other facilities which serve day-to
day needs;
• define the network and hierarchy of lower order centres and set out
a spatial vision and strategy for the management and growth of
centres in their Core Strategy;
• consider setting thresholds for the scale of edge-of-centre and out-of
centre development which should be the subject of an impact
assessment, specify the areas where this will apply and the types of
impacts having particular local importance; and
• prepare policies for the scale of development likely to be permissible
in different centres.
Decision Making
P8/79 11936/679166v2

2.29 With the removal of the need test, the two key tests for applications are the
expanded impact test and the sequential test. The assessment of each should
be proportionate to the scale and nature of proposals and their likely impact.
2.30 The sequential test remains largely unchanged from the July 2008 draft PPS6
changes. There is no additional clarification on the test, for example on the
ambiguity between operators’ business models and the need to consider the
scope for disaggregation, however the Guide explains how this tension should
be assessed.
2.31 Impact assessments are to consider positive and negative impacts, including
cumulative effects. The list of impact issues to be considered is longer and
more stringent than that which first appeared in the draft PPS6.
2.32 Eight “key impacts” are defined to assess proposals. These include whether
the proposal has been planned over the lifetime of the development to limit
carbon dioxide emissions. In addition, scale and accessibility have been added.
2.33 Unless the local planning authority has identified locally important impacts in its
development plan, it must also consider impact on allocated sites outside
centres, deprived areas and social inclusion objectives, local employment and
economic and physical regeneration.
2.34 Where there is clear evidence that a proposal is likely to lead to a significant
adverse impact in relation to any of the “key impacts”, the recommendation is
that the application be refused. Conversely, proposals should be considered
favourably where any adverse impacts are likely to be outweighed by their
significant wider economic, social and environmental benefits.
2.35 The Guide proposes the introduction of an impact evaluation matrix to help to
weigh and balance the impact considerations when determining planning
applications.
Planning Policy Guidance Note 13: Transport (PPG 13, March 2001)
2.36 The key objectives, set out at paragraph 4 of PPG13 are to integrate planning
and transport, in order to:
• “promote more sustainable transport choices for both people and for
moving freight;
• promote accessibility to jobs, shopping, leisure facilities and services by
public transport; and
• reduce the need to travel, especially by car.”
2.37 The Guidance advises that planning policies should seek to promote the vitality
and viability of existing town centres, which should be the preferred locations
for new retail and leisure developments. When this development cannot be
P9/79 11936/679166v2
accommodated in or on the edge of existing centres, it may be appropriate to
combine the proposal with existing out-of-centre developments.
The London Plan
2.38 The London Plan: Spatial Development Strategy was published in February
2004, and Alterations were consolidated in 2008. One of the strategic priorities
for South East London (Policy 5D.1) is to:
“ensure that town centre capacity is available to accommodate increased
demand for retail, leisure, community and business services associated
with a substantial increase in population and to consolidate the strategic
office offer in appropriate centres.”
2.39 Policy 3D.1 relates to town centres stating that the Mayor and London
Boroughs should: “enhance access to goods and services and strengthen the
wider role of town centres, including UDP policies to:
• Encourage retail, leisure, and other related uses in town centres, and
discourage them outside the town centres;
• Encourage forms of development, operational practice and consumer
behaviour which will help to reduce carbon dioxide emissions;
• Improve access to and within town centres by public transport, cycling
and walking;
• Enhance the competitiveness and quality for retail and other consumer
services in town centres
• Support a wide role for town centres as locations for leisure and cultural
activities, as well as business and housing;
• Require the location of appropriate health, education and other public
and community services in town centres;
• Designate core areas primarily for shopping uses and secondary areas
for shopping and other uses and set out policies for the appropriate
management of both types of area;
• Undertake regular town centre health check and integrated strategic and
local consumer need and capacity assessments; and
• Support and encourage town centre management, partnerships and
strategies including the introduction of Business Improvement Districts in
appropriate locations and appropriate provisions to support the safety
and security of the centres.”
2.40 Policies 3D.2 and 3D.3 are consistent with advice set out in PPS6, regarding
maintaining town centres and focusing development within centres.
2.41 The London Plan sets out a hierarchy/classification of centres across London,
i.e. international centres (2), metropolitan centres (11), major centres (35) and
district centres (146). Catford and Lewisham are classified as major centres.
Deptford, Sydenham, Forest Hill, New Cross, Lee Green, Downham and
Blackheath are classified as district centres. The London Plan indicates that
P10/79 11936/679166v2

the broad classification of centres should be refined in the light of local
circumstances through development plans.
2.42 The Mayor produced the draft replacement London Plan in October 2009 and
the consultation period ends in January 2010. In terms of retail policy, Policy
4.7 deals with retail and town centre development and essentially supports the
approach in PPS6. It confirms that LDFs should identify future levels of retail
floorspace and undertake regular health checks, take a proactive approach to
bringing forward town centre development and manage out-of-centre retail
development. Policy 4.8 supports a successful and diverse retail sector.
Consumer Expenditure and Comparison Goods Retail Floorspace
Need in London (March 2009)
2.43 Supporting the London Plan the Mayor has published the Consumer Expenditure
and Comparison Goods Retail Floorspace Need in London (CECGRFL) which
sets out the future requirement for comparison retail floorspace. It was
prepared by Experian and published in March 2009.
2.44 In terms of comparison goods, the CECGRFL uses two different scenarios to
estimate need; scenario 1 is based on existing floorspace remaining the same
and scenario 2 incorporates allowances for retail commitments and proposals
in the planning pipeline. Scenario 2 is considered to more accurately reflect
future floorspace requirements. Experian incorporates high, mid-range and low
floorspace estimates based on differing productivity growth rates of 1.5%, 2.2%
and 2.8% respectively.
2.45 The estimated requirement for additional comparison goods floorspace in
Lewisham, South East London (which this document considers to include LB
Lewisham) and the wider London area, based on Scenario 2, is shown in Table
2.1 below. It should be noted that Experian only include major pipeline
developments of over 20,000 sqm gross such as White City, Bromley, Croydon
and Woolwich, and therefore do not make any allowance for any retail
commitments in LBL.
P11/79 11936/679166v2

Table 2.1 Gross comparison goods floorspace requirements
Year Productivity Space required (sqm gross)
Growth
%
Lewisham South East
London
London
2011 1.5
2.2
2.8
8,257
4,563
1,516
59,039
34,057
13,446
476,732
272,656
104,288
2016 1.5
2.2
2.8
19,029
11,051
4,675
137,550
83,215
39,794
1,075,378
629,645
273,435
2021 1.5
2.2
2.8
37,253
23,702
13,211
264,597
172,018
100,356
2,087,461
1,330,595
744,723
2026 1.5
2.2
2.8
33,261
36,551
21,343
286,335
268,158
163,351
2,872,429
2,076,553
1,220,566
Source: CDCGRFL (March 2009)
Convenience Goods Floorspace Need in London (June 2005)
2.46 The Convenience Goods Floorspace Need in London (CGFNL) document
provides detailed strategic guidance on the need for additional convenience
goods floorspace in Greater London over the 2001 to 2016 period. It was also
produced by Experian. This study is based on retail data that has now been
superseded given the length of time that has elapsed since its production. On
this basis, the findings of this report should be viewed with caution and hold
limited weight.
2.47 Similarly to the CECGRFL, the CGFNL estimates future convenience
requirements based on a ‘timeline’ approach within which an allowance is
made for committed and proposed retail developments. Three different
productivity growth rates of 0.15%, 0.5% and 1.0% are applied to the results
and two different sales densities of £5,500 per sqm and £9,400 per sqm are
used to estimate the turnover of pipeline developments.
2.48 The predicted requirement for additional convenience goods floorspace in
Lewisham, East London and the wider London area is shown in Table 2.2. It
should be noted that although Lewisham was included in the ‘South East’ sub
region in the CECGRFL it is classified as forming part of the ‘East’ sub-region
according to the CGFNL.
P12/79 11936/679166v2
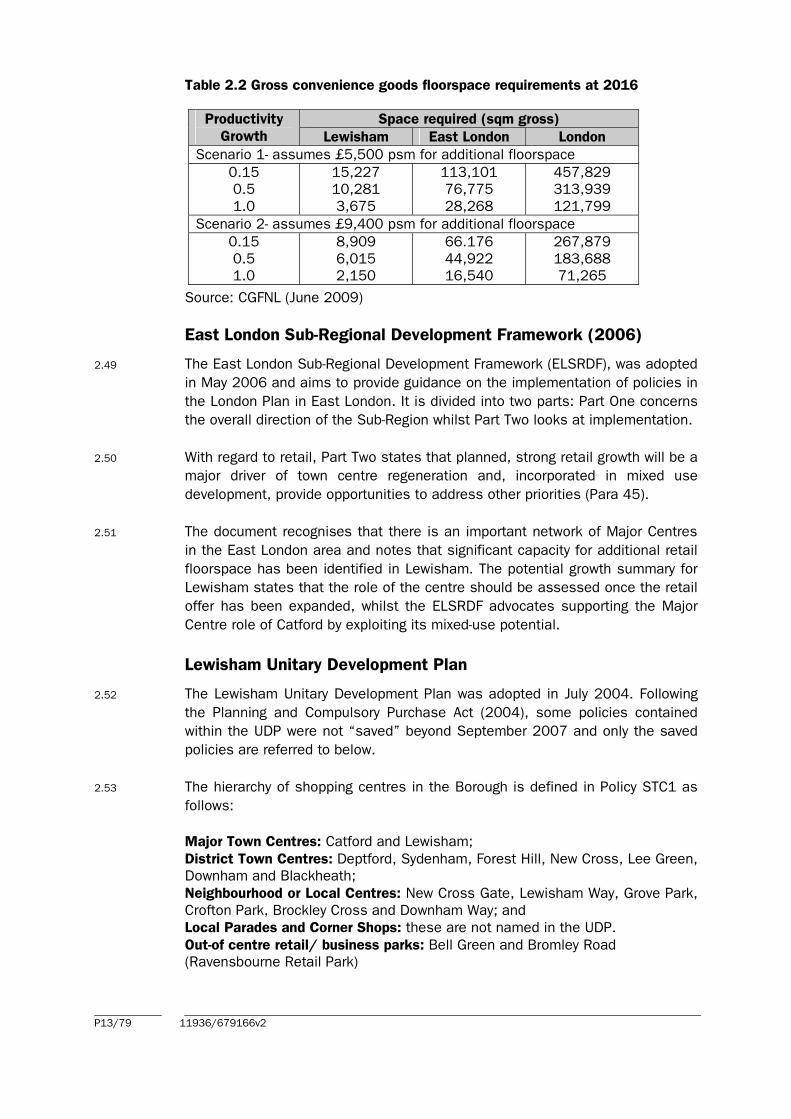
Table 2.2 Gross convenience goods floorspace requirements at 2016
Productivity
Growth
Space required (sqm gross)
Lewisham East London London
Scenario 1- assumes £5,500 psm for additional floorspace
0.15
0.5
1.0
15,227
10,281
3,675
113,101
76,775
28,268
457,829
313,939
121,799
Scenario 2- assumes £9,400 psm for additional floorspace
0.15
0.5
1.0
8,909
6,015
2,150
66.176
44,922
16,540
267,879
183,688
71,265
Source: CGFNL (June 2009)
East London Sub-Regional Development Framework (2006)
2.49 The East London Sub-Regional Development Framework (ELSRDF), was adopted
in May 2006 and aims to provide guidance on the implementation of policies in
the London Plan in East London. It is divided into two parts: Part One concerns
the overall direction of the Sub-Region whilst Part Two looks at implementation.
2.50 With regard to retail, Part Two states that planned, strong retail growth will be a
major driver of town centre regeneration and, incorporated in mixed use
development, provide opportunities to address other priorities (Para 45).
2.51 The document recognises that there is an important network of Major Centres
in the East London area and notes that significant capacity for additional retail
floorspace has been identified in Lewisham. The potential growth summary for
Lewisham states that the role of the centre should be assessed once the retail
offer has been expanded, whilst the ELSRDF advocates supporting the Major
Centre role of Catford by exploiting its mixed-use potential.
Lewisham Unitary Development Plan
2.52 The Lewisham Unitary Development Plan was adopted in July 2004. Following
the Planning and Compulsory Purchase Act (2004), some policies contained
within the UDP were not “saved” beyond September 2007 and only the saved
policies are referred to below.
2.53 The hierarchy of shopping centres in the Borough is defined in Policy STC1 as
follows:
Major Town Centres: Catford and Lewisham;
District Town Centres: Deptford, Sydenham, Forest Hill, New Cross, Lee Green,
Downham and Blackheath;
Neighbourhood or Local Centres: New Cross Gate, Lewisham Way, Grove Park,
Crofton Park, Brockley Cross and Downham Way; and
Local Parades and Corner Shops: these are not named in the UDP.
Out-of centre retail/ business parks: Bell Green and Bromley Road
(Ravensbourne Retail Park)
P13/79 11936/679166v2
2.54 The supporting text states that although the hierarchy recognises Lewisham
and Catford as major centres for the Borough, the Council considers Lewisham
as the most important in retail terms with by far the largest amount of retail
floorspace.
2.55 It further states that the Council considers that Lewisham has the potential to
rise up the retail hierarchy and become a Metropolitan Centre and will take
action to help realise this potential.
2.56 The UDP also recognises that each of the District Centres and Major Centres
has its own individual character, and their future lies in developing these
strengths
2.57 Policy STC 2 is a criteria-based policy relating to the location of new stores.
This states that:
“The Council will grant planning permission for additional retail use, and in
particular substantial additional retail development, in the Major and District
Town Centres as defined on the Proposals Map. If no suitable, viable or
available sites are present in these locations then edge of centre sites should
be considered, followed only then by out of centre sites in locations that are or
can be made accessible by a choice of means of transport. Proposals for
substantial* retail provision on the edge or outside of these Centres will only be
considered if the following criteria are satisfied:
(a) there is a quantitative and qualitative need for the proposal;
(b) there are no other sites available in accordance with the sequential test;
(c) the proposal, either by itself or together with other recent or committed
developments would not demonstrably harm the vitality and viability of an
existing Shopping Centre;
(d) the proposal is sited so as to reduce the number and length of car journeys
and can serve not only car journeys but also those on foot, bicycle or using
public transport;
(e) the proposal is not on land allocated for employment purposes on the
Proposals Map and for which a demand can be established; and
(f) if planning permission were to be granted then a S106 may be negotiated
for relevant improvements.
* For Guidance developments of 1,000 sq.m gross floorspace or more will
normally be considered substantial.
2.58 Other policies within the UDP (policies STC 4, STC 5 and STC 6) relate to
permitted uses within core, non core and other shopping areas. They also
encourage town centre regeneration (STC 11) and mixed use development (STC
12).
2.59 Policy STC 15 states that LBL will promote Lewisham Town Centre as the
Borough’s premier shopping area, and will aim to improve its position within the
London hierarchy of centres. It states that it will give favourable consideration
to applications for new or refurbished retail floorspace (particularly comparison
P14/79 11936/679166v2
floorspace), as well as supporting proposals which add to the variety and vitality
of the Town Centre, including those related to the evening economy.
Local Development Framework
2.60 LBL is in the process of preparing its Local Development Framework (LDF) in
line with the provisions of the Planning and Compulsory Purchase Act 2004.
When adopted, the LDF will replace the UDP and will cover the period to 2025.
The latest Local Development Scheme adopted April 2008 anticipates that the
LDF will completely replace the existing UDP in 2011, although the Core
Strategy is due to be adopted at the end of 2010. The Lewisham LDF will
comprise the following:
• Statement of Community Involvement (adopted June 2006);
• Core Strategy (Options Report consultation occurred February 2009);
• Proposals Map (Preferred Options consultation occurred April 2007);
• Development Policies and Site Allocations DPDs (Preferred Options
consultation occurred June 2007); and
• Catford and Lewisham Area Action Plans (Preferred Options consultation
occurred June 2007 and April 2007 respectively).
2.61 The LDF will also contain Supplementary Planning Documents (SPDs) which
explain the application of the policies outlined in the Development Plan
Documents (DPDs).
P15/79 11936/679166v2

3.0 THE SHOPPING HIERARCHY
Major Shopping Centres in the London Borough of Lewisham and
the Surrounding Area
3.1 Lewisham is the main shopping centre within the LBL and is of sub-regional
importance in providing goods and services to residents of the Borough and
beyond. Catford is the second largest shopping centre in the Borough. It is
situated within close proximity to Lewisham and also provides an important role
in the provision of goods and services, although it has a lesser range of retail
facilities. These two town centres compete with major shopping destinations
outside of the Borough such as Bromley and Croydon as well as facilities
further afield including the West End and Bluewater. Supporting these two
centres are the seven smaller district town centres in the Borough, smaller
local shops and the freestanding retail and business parks.
3.2 Management Horizons Europe’s UK Shopping Index 2008 provides an index of
retail centres on the basis of a weighted score for multiple retailers represented
in each centre. Management Horizon’s rank for centres in Lewisham catchment
area and other shopping centres in the sub-region is shown in Table 3.1 below.
Table 3.1 Management Horizons Europe Shopping Index (2008)
MHE Venue MHE Index Rank Rank change since
2003/04
London, West End 1,143 1 -
London, Oxford St 625 4 Going Up
Croydon 349 20 Going Up
Bluewater 321 25 Going Down
Bromley 300 32 Going Down
Lewisham 168 156 Going Up
Docklands 161 163 Going Up
Eltham 111 271 Going Down
Woolwich 110 274 Going Down
Streatham 100 314 Going Up
Greenwich 99 322 Going Up
Peckham 96 332 Going Down
Brixton 92 350 Going Up
Catford 77 440 Going Down
Surrey Quays 62 553 Going Down
Bermondsey 61 565 Going Up
Blackheath 40 896 Going Up
East Dulwich 37 959 Going Up
Sydenham 34 1,066 Going Down
Forest Hill 29 1,247 Going Down
Elephant & Castle 24 1,481 Going Down
South Norwood 24 1,481 Going Up
New Cross 19 1,950 -
Deptford 17 1,950 -
Downham 13 2,356 -
Ravensbourne Retail
Park
9 2,988 -
P16/79 11936/679166v2
3.3 The catchment areas of the centres listed above overlap to a large extent.
London West End is ranked as the highest shopping destination and is 1st
nationally, attributable to the concentration of national multiple retailers, the
range of goods available and strength of anchor stores.
3.4 According to the MHE Index 2008, Lewisham is ranked 156th nationally with a
score of 168. This is significantly lower than the rankings achieved by the
nearby centres of Croydon (20th) and Bromley (32nd) albeit these are defined as
Metropolitan Centres in The London Plan compared to the Major Town Centre
status of Lewisham. Catford is ranked significantly further down the MHE
hierarchy at 440th with a score of 77. Catford is thus ranked lower than
Docklands (163rd). Eltham (271st), Woolwich (274th), Streatham (314th),
Greenwich (322nd), Peckham (332nd) and Brixton (350th).
3.5 Although the Management Horizons Europe (MHE) is only one indicator of the
performance of a centre, it suggests that Lewisham is performing reasonably
well compared to other Major Town Centres in the local catchment, but still has
a lower number of national multiples compared to that provided in the nearby
Metropolitan Centres. Catford appears to be under-performing in terms of its
provision of national multiple representation compared to competing centres in
the sub-region, and in particular representation from high order multiples that
would ensure it is more competitive in relation to its rival centres.
3.6 Of the District Centres in Lewisham, Blackheath achieves the highest rank of
896th. This is followed by Sydenham (1,066th), Forest Hill (1,247th), Lee Green
(1,247th), New Cross (1,950th), Deptford (1,950th) and Downham (2,356th).
These centres appear to be performing adequately compared with other centres
outside Lewisham of a similar size and function, given that their role is
predominately in the provision of convenience goods and services, and to a
lesser extent lower order comparison goods.
3.7 Ravensbourne Retail Park is also included in the MHE rankings, although it
achieves a low score of 9 which equates to a national ranking of 2,988th.
3.8 The relative performance and importance of town centres can be demonstrated
by reviewing commercial yields and Zone A rental levels achieved for retail
property. Retail yields for the established centres in the sub-region are shown
in Table 3.2 and a comparison of Zone A rental levels is shown in Table 3.3.
3.9 Commercial yields are a measure of property values, which enables the values
of properties of different size, location and characteristic to be compared. The
level of yield broadly represents the market’s evaluation of risk and return
attached to the income stream of shop rents. Broadly speaking low yields
indicate that a centre is considered to be attractive and, as a result, more likely
to attract investment and rental growth than a centre with high yields.
P17/79 11936/679166v2
6
Table 3.2: Retail Yields in Lewisham
Centre Yield (%)
Croydon
04/03
6
01/04
6
07/04
6
01/05
6
07/05
6
01/06
6
07/06
6
01/07
6
07/07
5.75
01/08
5.75
07/08
6
Bromley 6 6 6 6 6 6 6 5.75 5.75 6
Lewisham 7.5 7.5 7.5 7.5 7.5 7 7 7 7 7 7
Eltham 7.5 7.5 7.5 7.5 7.5 7 7 7 6.5 6.5 7
Source: Valuation Office Agency (April 2008)
3.10 The Valuation Office Agency (VOA) record trend data relating to retail yields in
established centres. It should be noted that the reporting of locations with a
yield of 10% or over throughout the time series are not included on the
assumption that such locations are not of major interest in terms of retail
property investment. Lewisham is the only destination in the Borough which
records yield levels lower than 10%.
3.11 Table 3.2 outlines the yields in Lewisham and other competing centres in the
sub-region over the April 2003 to July 2008 period. According to the VOA,
Lewisham had a yield of 7.5% at the beginning of the period, which declined
marginally to 7% at the end of the period. This is higher than the latest yields
recorded in Croydon and Bromley (6% each), although both these centres’
yields reduced to 5.75% between July 2007 and January 2008. Eltham
recorded yields of 7.5% in April 2003 which declined to 6.5% at January 2008,
although yields in the centre had fallen to 7% at July 2008. On this basis,
Lewisham appears to have performed favourably compared to rival centres in
the sub-region in terms of the recorded yields.
3.12 Prime Zone A retail rents in shopping centres are recorded by Colliers CRE, and
the only centres in Lewisham for which such information is recorded are
Blackheath, Catford and Lewisham. This data is shown in Table 3.3 below,
together with the rents achieved in other centres in the sub-region.
Table 3.3: Retail Rents in Blackheath, Catford, Lewisham and Other
Centres
Centre Annual Zone A Retail Rents £ per Sq M
1998 1999 2000 2001 2002 2003 2004 2005 2006 2007 2008
Blackheath - - - 538 592 592 592 592 646 700 700
Bluewater -
1,453Bromley
Catford -
Croydon 2,691
Eltham -
3,767
1,722
3,229
-
3,875
2,153
-
3,229
-
3,498
1,884
-
2,960
807
3,552
2,260
-
2,906
969
3,875
2,260
-
2,906
969
4,306
2,368
431
2,906
969
4,413
2,368
431
2,906
969
4,413 4,467 4,467
2,422 2,476 2,530
431 484 538
2,906 2,906 2,906
969 969 969
Greenwich 538 538 592 592 700 700 700 700 753 807 807
Lewisham 1,076 1,076 1,076 1,130 1,238 1,292 1,345 1,345 1,345 1,399 1,399
Source: Colliers CRE
3.13
P18/79
Table 3.3 highlights the disparity between the rents achieved in Bluewater
(£4,467 per square metre at 2008) compared to other centres in the sub
region. This reflects high demand from national multiples for representation in
Bluewater, in light of the wide catchment from which it draws shoppers and the
high levels of footfall recorded. 11936/679166v2
3.14 Lewisham achieves rents of £1,399 per sqm at 2008 which is much lower than
its main competitor centres of Bromley (£2,530 per sq m) and Croydon (£2,906
per sq m). Rents from Lewisham have risen over the last ten years albeit by a
modest amount. At 1998 rents were £1,076 per sqm, rising to £1,130 per sqm
at 2001, £1,238 per sqm at 2002, £1,292 per sqm at 2003, £1,345 per sqm
at 2004 and finally £1,399 per sqm at 2008. Over the 1998 to 2008 period
rental levels in Lewisham have risen by 30%, which compares to a rise of 74%
in Bromley, but only 8% in Croydon.
3.15 Catford recorded the lowest Prime Zone A rents out of any centre in Table 3.3
at £538 per sqm at 2008. Rents for this centre have only been recorded since
2004 when they were £431 per sqm indicating a small rise over the 2004 to
2008 period. The smaller retail centre of Blackheath achieves rental levels of
£700 per sqm at 2008 reflecting the concentration of national multiples and
specialist retailers. This compares to £538 per sqm recorded in 2001
representing a 30% rise over the 2001 to 2008 period.
Centre Audits
3.16 NLP has undertaken a detailed PPS6 compliant health-check, including a SWOT
(Strengths, Weaknesses, Opportunities and Threats) analysis of the two Major
Town Centres and seven District Town Centres defined in the Borough. The
detailed health-checks for the centres are included in this Study at Appendix A
and these are summarised below.
Lewisham Major Town Centre
3.17 Lewisham is the dominant retail destination in the Borough and contains a total
of 80,490 sqm gross of retail and service floorspace in 330 retail units at April
2009, based on the Goad centre survey, as updated by NLP. The provision of
convenience retailers and A2 services in Lewisham, in terms of the proportion
of units, is above the Goad national average, although comparison retailers, A1
services and A3 and A5 services are under represented compared to the
national average.
3.18 The centre contains good representation of national multiple retailers which
account for nearly half of all retail occupiers. The EGi database of retailer
requirements records strong demand for representation in the centre from
national retailers, with some 70 requirements at May 2009. This compares to
33 requirements recorded in the RCASAS 2004, although some requirements
listed in 2004 remain unsatisfied at 2009 which may reflect a lack of
appropriate premises.
3.19 The proportion of vacant units in Lewisham is nearly double the national
average, although to some extent this may be due to voids created by securing
the site for the Lewisham Gateway scheme which has been granted outline
planning consent. The centre is accessible by a range of means of transport
with public transport connections by bus, railway and DLR. The centre provides
a safe pedestrian environment.
P19/79 11936/679166v2
3.20 The SWOT analysis for Lewisham Town Centre based on our site surveys is
shown in Table 3.4 below
Table 3.4: Lewisham Major Town Centre SWOT Analysis 2009
Strengths Weaknesses
• Large quantum of retail/ service units
and floorspace;
• Above average proportion of
convenience units;
• Good representation of national
multiple retailers;
• High number of retailers seeking to
locate in the centre
• Excellent accessibility by a range of
transport modes;
• Declining yields.
• The number of A1 units in Lewisham is at
the lowest recorded level since 1999;
• Below average proportion of comparison
units;
• High proportion of vacant units when
compared against the national average,
and vacancies have grown significantly
since 2004;
• Lack of modern floorspace for new
potential occupiers.
Opportunities Threats
• Improved links between the Shopping
Core Area and the rest of the centre,
particularly Lee High Road;
• Intensification of retail uses in the
Lewisham Shopping Centre;
• New investment in the centre such as
the Gateway Scheme and the current
leisure development;
• Increase catchment population and
town centre dwellings;
• Continued success of the street
market.
• Increased competition from competitor
centres outside of the Borough such as
Bromley;
• Increase in internet sales;
• Lack of investment in new floorspace which
could prevent new retailers investing in the
centre;
• Decline in spending associated with the
credit crunch/ recession;
• Further decline of the centre’s peripheral
retail/ service units.
3.25 Based on the NLP health check Lewisham is a relatively healthy centre,
although if suffers from a high vacancy rate and a below average proportion of
comparison goods retailers. The development of the Lewisham Gateway
scheme, if implemented, would strengthen the retail offer of the town centre
particularly for comparison goods.
Catford Major Town Centre
3.26 Catford is the second largest retail centre in the Borough and is defined as a
Major Town Centre. It contains some 48,800 sqm gross retail/service
floorspace in 233 units at April 2009 based on the Goad Town Centre survey
and NLP update. Although the proportion of retail units occupied by comparison
retailers is less than half the national average, the proportion of convenience
units and all types of services are above the national average. The proportion of
vacant units is only marginally above the national average. The retail offer of
Catford is supplemented a strong civic role played by the centre.
3.27 The centre has a good balance between national multiple retailers and
independents, the latter being aided by the presence of the market. EGi records
9 retailer requirements for town centre or edge-of-centre floorspace
requirements in Catford from a range of predominately comparison goods
retailers, which compares to 7 requirements recorded at the time of the
previous health-check,
P20/79 11936/679166v2
3.28 The centre is served by two railway stations and a number of local bus routes.
Pedestrian movement around the centre is unproblematic. The health-check
notes that although occupied units in Catford are generally adequate in terms
of environmental quality, some of the vacancies are of poor quality and the
busy nature of Rushey Green and Catford Road detracts from the environment
in these areas.
3.29 Our SWOT analysis of Catford Town Centre is shown below.
Table 3.5: Catford Major Town Centre SWOT Analysis 2009
Strengths Weaknesses
• Good provision in the convenience
goods sector;
• All types of services in Catford are
above the national average in terms of
the proportion of units which they
occupy;
• Strong civic role;
• Contains a good balance between
independent retailers and national
multiples.
• Comparison goods provision in the centre
is significantly below the national average;
• Catford has fallen in the MHE Rankings
since 2003/04;
• Lack of vacant large-format retail units
could prevent new national multiples
locating in the centre;
• Poor environmental quality in parts of the
centre.
Opportunities Threats
• Regeneration/ redevelopment of the
Catford Centre;
• Improvements to the environmental
quality of the centre;
• Diversifying the retail offer of the centre
particularly in the comparison goods
sector;
• Building on the civic role of Catford.
• Lack of investment in the centre or in new
retail floorspace;
• Increased competition from competing
centres;
• Increase in internet sales;
• Decline in spending associated with the
credit crunch/ recession.
3.34 Catford is trading reasonably well and plays a strong civic role, although there is
a need to enhance its comparison goods offer and the centre is likely to be
vulnerable to the improvement of the retail offer of competing centres. It has
declined in the MHE retail rankings since 2003/04, and there is a danger that
the centre could fall further in the national rankings if there is no new
investment in the centre.
Blackheath District Centre
3.35 The district centre of Blackheath transcends the boundaries of LB Lewisham
and LB Greenwich, although the majority of the centre falls within LB Lewisham.
When compared against the national average, all sectors of retail and service
provision are above the national average except for comparison goods. The
centre contains a wide range of goods and services, although it includes only
small-format convenience traders. The number of retail units in the centre has
increased since 2008, and at April 2009 Blackheath contained 13,170 sqm
(gross) retail floorspace in 125 units.
3.36 The centre has a vacancy rate nearly two-thirds lower than the national average
indicating strong demand for representation from retailers. This is reflected in
an extremely high number of expressions of interest from national retailers for
representation in the centre as recorded by EGi. The centre contains good
representation from national multiples given its size, and the range of traders is
P21/79 11936/679166v2
improved by a number of high quality niche retailers. Prime Zone A rents in the
centre are reasonably high at £700 per sqm and have risen 30% since 2001.
3.37 The centre contains a railway station and a number of bus services operate
through Blackheath. Surface level car parking facilities are provided, and
movement around the centre on foot is unproblematic, albeit roads in the
centre can be busy with vehicular traffic. Environmental quality in the centre is
good.
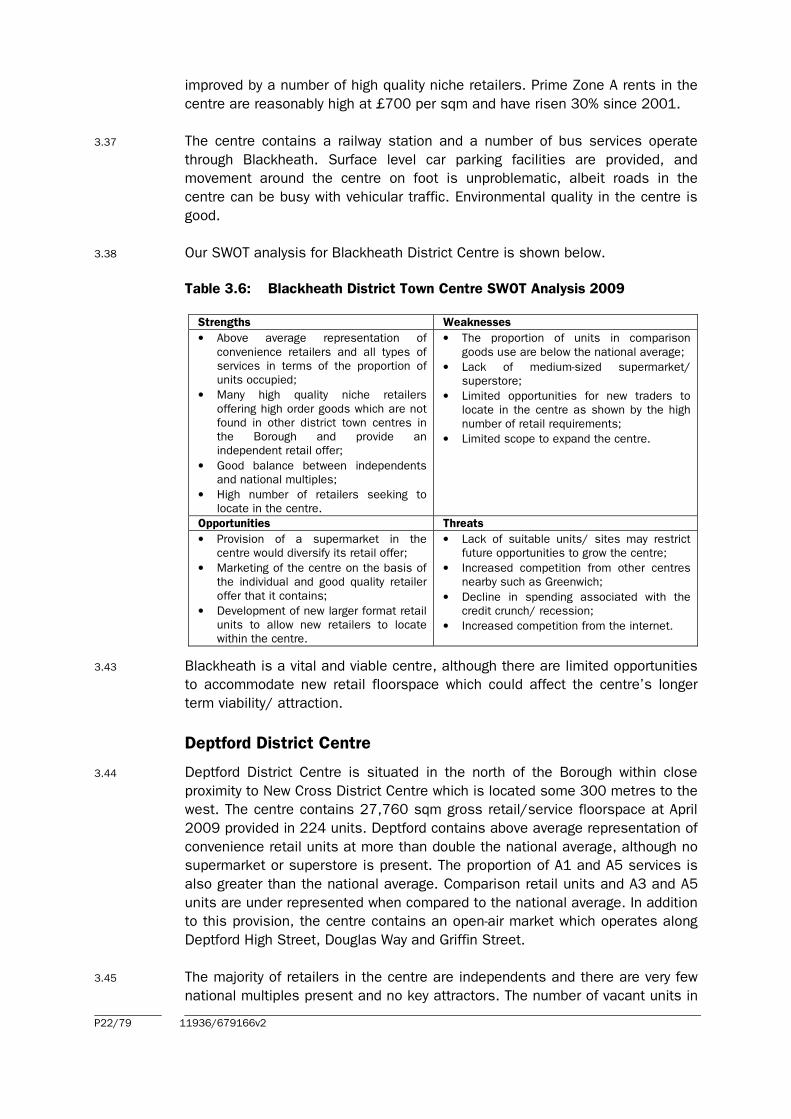
3.38 Our SWOT analysis for Blackheath District Centre is shown below.
Table 3.6: Blackheath District Town Centre SWOT Analysis 2009
Strengths Weaknesses
• Above average representation of
convenience retailers and all types of
services in terms of the proportion of
units occupied;
• Many high quality niche retailers
offering high order goods which are not
found in other district town centres in
the Borough and provide an
independent retail offer;
• Good balance between independents
and national multiples;
• High number of retailers seeking to
locate in the centre.
• The proportion of units in comparison
goods use are below the national average;
• Lack of medium-sized supermarket/
superstore;
• Limited opportunities for new traders to
locate in the centre as shown by the high
number of retail requirements;
• Limited scope to expand the centre.
Opportunities Threats
• Provision of a supermarket in the
centre would diversify its retail offer;
• Marketing of the centre on the basis of
the individual and good quality retailer
offer that it contains;
• Development of new larger format retail
units to allow new retailers to locate
within the centre.
• Lack of suitable units/ sites may restrict
future opportunities to grow the centre;
• Increased competition from other centres
nearby such as Greenwich;
• Decline in spending associated with the
credit crunch/ recession;
• Increased competition from the internet.
3.43 Blackheath is a vital and viable centre, although there are limited opportunities
to accommodate new retail floorspace which could affect the centre’s longer
term viability/ attraction.
Deptford District Centre
3.44 Deptford District Centre is situated in the north of the Borough within close
proximity to New Cross District Centre which is located some 300 metres to the
west. The centre contains 27,760 sqm gross retail/service floorspace at April
2009 provided in 224 units. Deptford contains above average representation of
convenience retail units at more than double the national average, although no
supermarket or superstore is present. The proportion of A1 and A5 services is
also greater than the national average. Comparison retail units and A3 and A5
units are under represented when compared to the national average. In addition
to this provision, the centre contains an open-air market which operates along
Deptford High Street, Douglas Way and Griffin Street.
3.45 The majority of retailers in the centre are independents and there are very few
national multiples present and no key attractors. The number of vacant units in
P22/79 11936/679166v2
the centre is above the national average, with some of these being of poor
quality and almost all being in small retail units. EGi records just 4
requirements for representation in Deptford at May 2009.
3.46 The Shopping Core Area of Deptford is pedestrianised and is used for the open-
air market. As a consequence, it provides a safe environment for shoppers.
Deptford train station is located within the town centre, with Deptford Bridge
DLR station in close proximity to the south-east. No bus services operate
through the centre, although bus stops are located on the north and south
periphery.
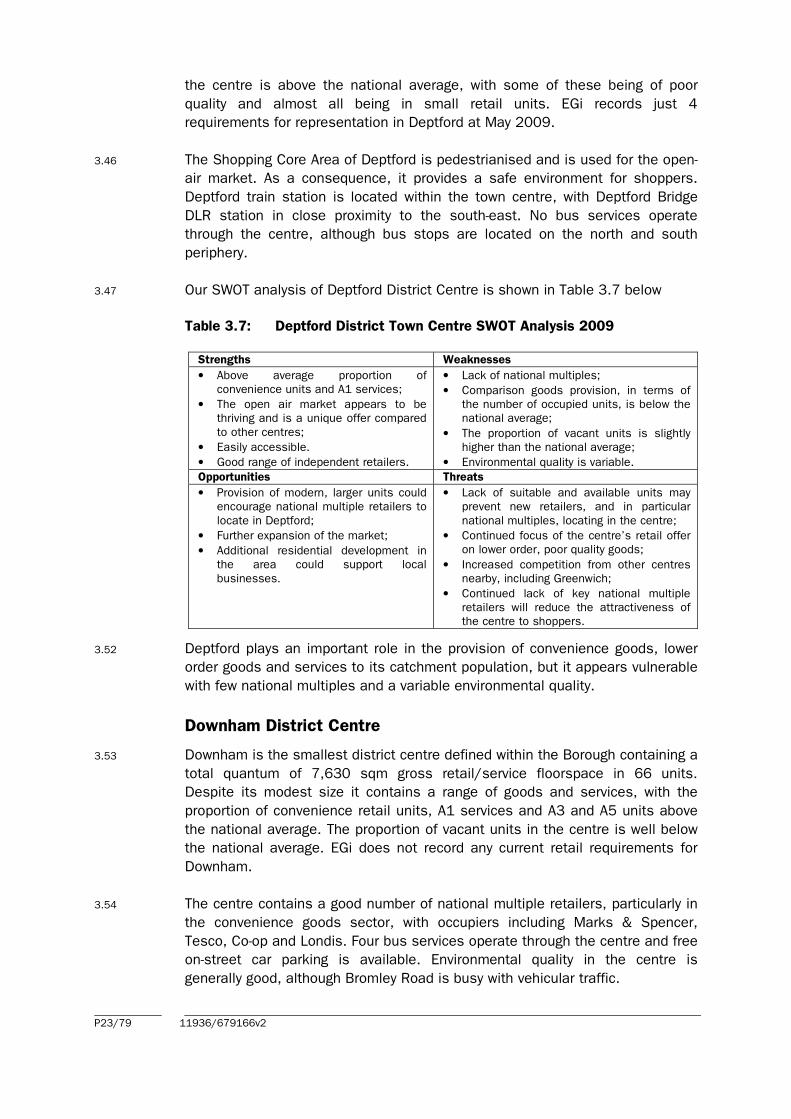
3.47 Our SWOT analysis of Deptford District Centre is shown in Table 3.7 below
Table 3.7: Deptford District Town Centre SWOT Analysis 2009
Strengths Weaknesses
• Above average proportion of
convenience units and A1 services;
• The open air market appears to be
thriving and is a unique offer compared
to other centres;
• Easily accessible.
• Good range of independent retailers.
• Lack of national multiples;
• Comparison goods provision, in terms of
the number of occupied units, is below the
national average;
• The proportion of vacant units is slightly
higher than the national average;
• Environmental quality is variable.
Opportunities Threats
• Provision of modern, larger units could
encourage national multiple retailers to
locate in Deptford;
• Further expansion of the market;
• Additional residential development in
the area could support local
businesses.
• Lack of suitable and available units may
prevent new retailers, and in particular
national multiples, locating in the centre;
• Continued focus of the centre’s retail offer
on lower order, poor quality goods;
• Increased competition from other centres
nearby, including Greenwich;
• Continued lack of key national multiple
retailers will reduce the attractiveness of
the centre to shoppers.
3.52 Deptford plays an important role in the provision of convenience goods, lower
order goods and services to its catchment population, but it appears vulnerable
with few national multiples and a variable environmental quality.
Downham District Centre
3.53 Downham is the smallest district centre defined within the Borough containing a
total quantum of 7,630 sqm gross retail/service floorspace in 66 units.
Despite its modest size it contains a range of goods and services, with the
proportion of convenience retail units, A1 services and A3 and A5 units above
the national average. The proportion of vacant units in the centre is well below
the national average. EGi does not record any current retail requirements for
Downham.
3.54 The centre contains a good number of national multiple retailers, particularly in
the convenience goods sector, with occupiers including Marks & Spencer,
Tesco, Co-op and Londis. Four bus services operate through the centre and free
on-street car parking is available. Environmental quality in the centre is
generally good, although Bromley Road is busy with vehicular traffic.
P23/79 11936/679166v2
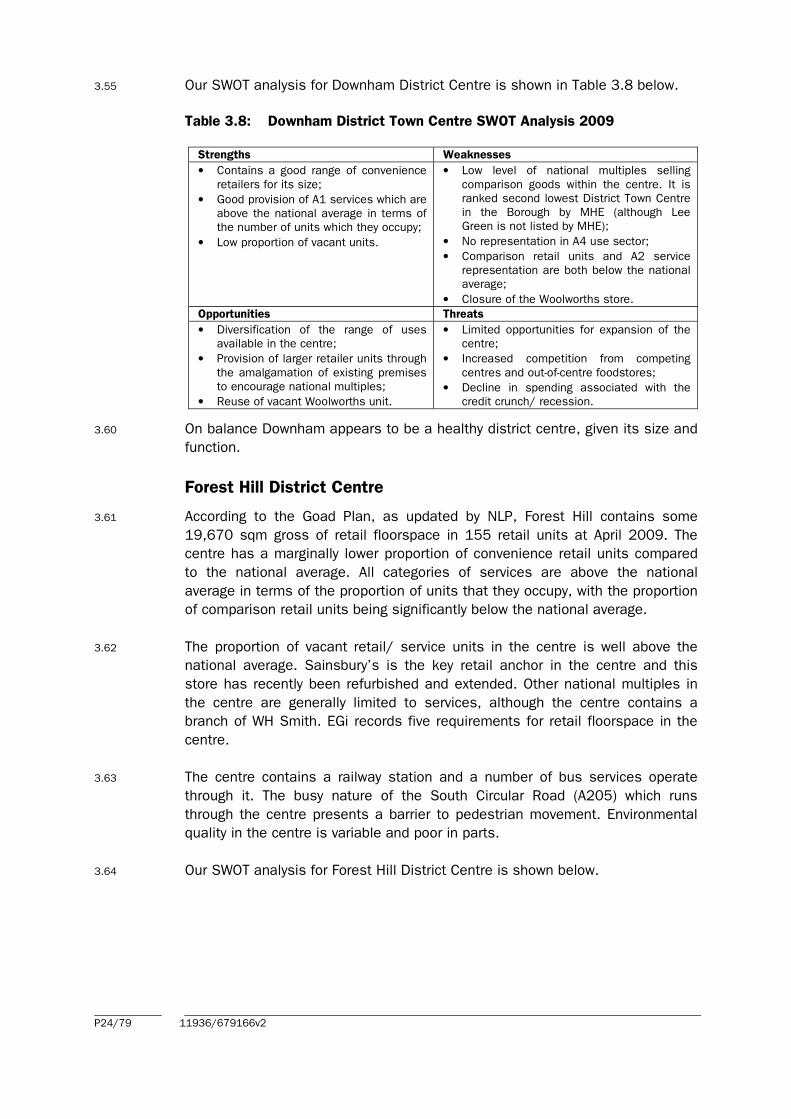
3.55 Our SWOT analysis for Downham District Centre is shown in Table 3.8 below.
Table 3.8: Downham District Town Centre SWOT Analysis 2009
Strengths Weaknesses
• Contains a good range of convenience
retailers for its size;
• Good provision of A1 services which are
above the national average in terms of
the number of units which they occupy;
• Low proportion of vacant units.
• Low level of national multiples selling
comparison goods within the centre. It is
ranked second lowest District Town Centre
in the Borough by MHE (although Lee
Green is not listed by MHE);
• No representation in A4 use sector;
• Comparison retail units and A2 service
representation are both below the national
average;
• Closure of the Woolworths store.
Opportunities Threats
• Diversification of the range of uses
available in the centre;
• Provision of larger retailer units through
the amalgamation of existing premises
to encourage national multiples;
• Reuse of vacant Woolworths unit.
• Limited opportunities for expansion of the
centre;
• Increased competition from competing
centres and out-of-centre foodstores;
• Decline in spending associated with the
credit crunch/ recession.
3.60 On balance Downham appears to be a healthy district centre, given its size and
function.
Forest Hill District Centre
3.61 According to the Goad Plan, as updated by NLP, Forest Hill contains some
19,670 sqm gross of retail floorspace in 155 retail units at April 2009. The
centre has a marginally lower proportion of convenience retail units compared
to the national average. All categories of services are above the national
average in terms of the proportion of units that they occupy, with the proportion
of comparison retail units being significantly below the national average.
3.62 The proportion of vacant retail/ service units in the centre is well above the
national average. Sainsbury’s is the key retail anchor in the centre and this
store has recently been refurbished and extended. Other national multiples in
the centre are generally limited to services, although the centre contains a
branch of WH Smith. EGi records five requirements for retail floorspace in the
centre.
3.63 The centre contains a railway station and a number of bus services operate
through it. The busy nature of the South Circular Road (A205) which runs
through the centre presents a barrier to pedestrian movement. Environmental
quality in the centre is variable and poor in parts.
3.64 Our SWOT analysis for Forest Hill District Centre is shown below.
P24/79 11936/679166v2
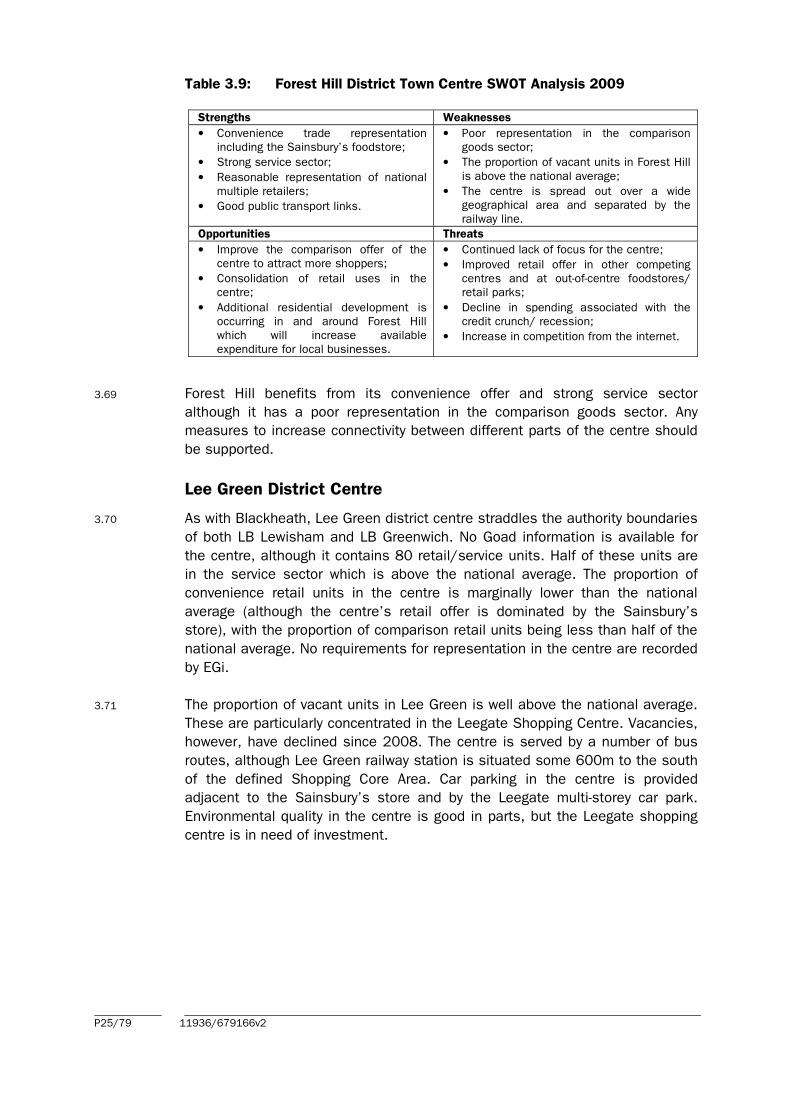
Table 3.9: Forest Hill District Town Centre SWOT Analysis 2009
Strengths Weaknesses
• Convenience trade representation
including the Sainsbury’s foodstore;
• Strong service sector;
• Reasonable representation of national
multiple retailers;
• Good public transport links.
• Poor representation in the comparison
goods sector;
• The proportion of vacant units in Forest Hill
is above the national average;
• The centre is spread out over a wide
geographical area and separated by the
railway line.
Opportunities Threats
• Improve the comparison offer of the
centre to attract more shoppers;
• Consolidation of retail uses in the
centre;
• Additional residential development is
occurring in and around Forest Hill
which will increase available
expenditure for local businesses.
• Continued lack of focus for the centre;
• Improved retail offer in other competing
centres and at out-of-centre foodstores/
retail parks;
• Decline in spending associated with the
credit crunch/ recession;
• Increase in competition from the internet.
3.69 Forest Hill benefits from its convenience offer and strong service sector
although it has a poor representation in the comparison goods sector. Any
measures to increase connectivity between different parts of the centre should
be supported.
Lee Green District Centre
3.70 As with Blackheath, Lee Green district centre straddles the authority boundaries
of both LB Lewisham and LB Greenwich. No Goad information is available for
the centre, although it contains 80 retail/service units. Half of these units are
in the service sector which is above the national average. The proportion of
convenience retail units in the centre is marginally lower than the national
average (although the centre’s retail offer is dominated by the Sainsbury’s
store), with the proportion of comparison retail units being less than half of the
national average. No requirements for representation in the centre are recorded
by EGi.
3.71 The proportion of vacant units in Lee Green is well above the national average.
These are particularly concentrated in the Leegate Shopping Centre. Vacancies,
however, have declined since 2008. The centre is served by a number of bus
routes, although Lee Green railway station is situated some 600m to the south
of the defined Shopping Core Area. Car parking in the centre is provided
adjacent to the Sainsbury’s store and by the Leegate multi-storey car park.
Environmental quality in the centre is good in parts, but the Leegate shopping
centre is in need of investment.
P25/79 11936/679166v2
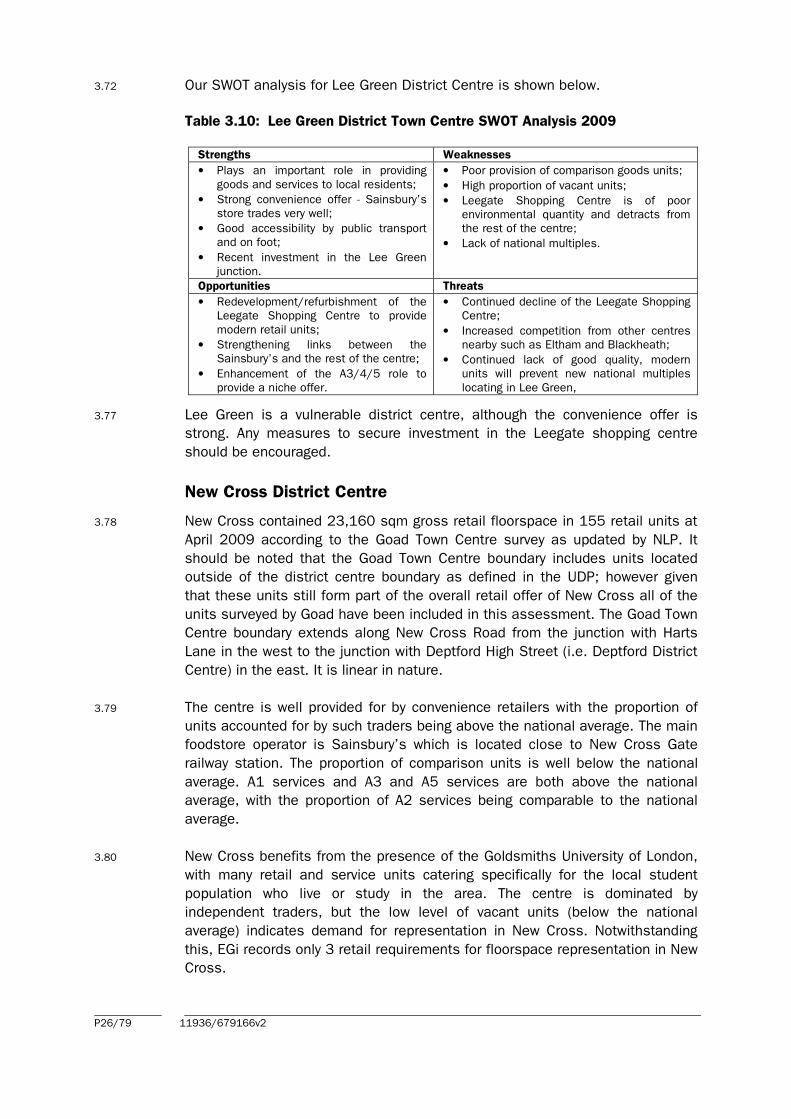
3.72 Our SWOT analysis for Lee Green District Centre is shown below.
Table 3.10: Lee Green District Town Centre SWOT Analysis 2009
Strengths Weaknesses
• Plays an important role in providing
goods and services to local residents;
• Strong convenience offer - Sainsbury’s
store trades very well;
• Good accessibility by public transport
and on foot;
• Recent investment in the Lee Green
junction.
• Poor provision of comparison goods units;
• High proportion of vacant units;
• Leegate Shopping Centre is of poor
environmental quantity and detracts from
the rest of the centre;
• Lack of national multiples.
Opportunities Threats
• Redevelopment/refurbishment of the
Leegate Shopping Centre to provide
modern retail units;
• Strengthening links between the
Sainsbury’s and the rest of the centre;
• Enhancement of the A3/4/5 role to
provide a niche offer.
• Continued decline of the Leegate Shopping
Centre;
• Increased competition from other centres
nearby such as Eltham and Blackheath;
• Continued lack of good quality, modern
units will prevent new national multiples
locating in Lee Green,
3.77 Lee Green is a vulnerable district centre, although the convenience offer is
strong. Any measures to secure investment in the Leegate shopping centre
should be encouraged.
New Cross District Centre
3.78 New Cross contained 23,160 sqm gross retail floorspace in 155 retail units at
April 2009 according to the Goad Town Centre survey as updated by NLP. It
should be noted that the Goad Town Centre boundary includes units located
outside of the district centre boundary as defined in the UDP; however given
that these units still form part of the overall retail offer of New Cross all of the
units surveyed by Goad have been included in this assessment. The Goad Town
Centre boundary extends along New Cross Road from the junction with Harts
Lane in the west to the junction with Deptford High Street (i.e. Deptford District
Centre) in the east. It is linear in nature.
3.79 The centre is well provided for by convenience retailers with the proportion of
units accounted for by such traders being above the national average. The main
foodstore operator is Sainsbury’s which is located close to New Cross Gate
railway station. The proportion of comparison units is well below the national
average. A1 services and A3 and A5 services are both above the national
average, with the proportion of A2 services being comparable to the national
average.
3.80 New Cross benefits from the presence of the Goldsmiths University of London,
with many retail and service units catering specifically for the local student
population who live or study in the area. The centre is dominated by
independent traders, but the low level of vacant units (below the national
average) indicates demand for representation in New Cross. Notwithstanding
this, EGi records only 3 retail requirements for floorspace representation in New
Cross.
P26/79 11936/679166v2
3.81 New Cross is served by two railway stations at either end of the defined centre.
New Cross Road is busy in nature and forms a barrier to unconstrained
pedestrian movement, although the eastern and western ends of the centre are
some distance apart. Environmental quality in the centre is generally
reasonable, although the busy nature of New Cross Road detracts from it.
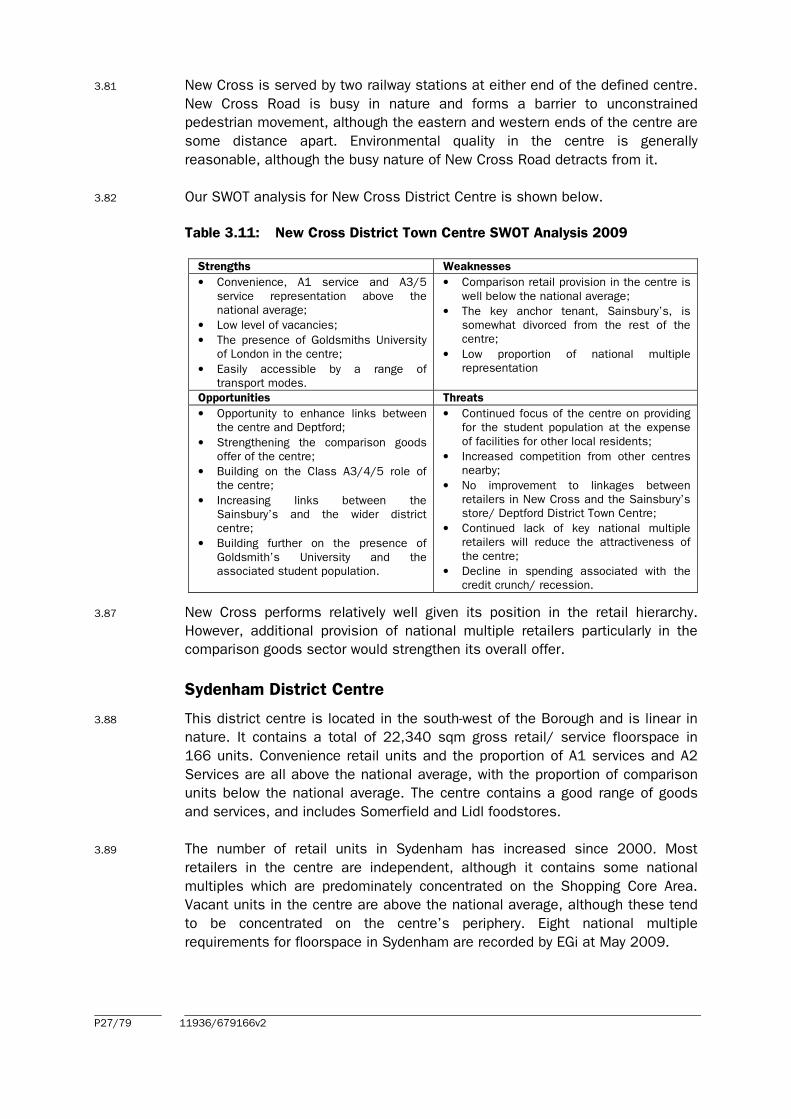
3.82 Our SWOT analysis for New Cross District Centre is shown below.
Table 3.11: New Cross District Town Centre SWOT Analysis 2009
Strengths Weaknesses
• Convenience, A1 service and A3/5
service representation above the
national average;
• Low level of vacancies;
• The presence of Goldsmiths University
of London in the centre;
• Easily accessible by a range of
transport modes.
• Comparison retail provision in the centre is
well below the national average;
• The key anchor tenant, Sainsbury’s, is
somewhat divorced from the rest of the
centre;
• Low proportion of national multiple
representation
Opportunities Threats
• Opportunity to enhance links between
the centre and Deptford;
• Strengthening the comparison goods
offer of the centre;
• Building on the Class A3/4/5 role of
the centre;
• Increasing links between the
Sainsbury’s and the wider district
centre;
• Building further on the presence of
Goldsmith’s University and the
associated student population.
• Continued focus of the centre on providing
for the student population at the expense
of facilities for other local residents;
• Increased competition from other centres
nearby;
• No improvement to linkages between
retailers in New Cross and the Sainsbury’s
store/ Deptford District Town Centre;
• Continued lack of key national multiple
retailers will reduce the attractiveness of
the centre;
• Decline in spending associated with the
credit crunch/ recession.
3.87 New Cross performs relatively well given its position in the retail hierarchy.
However, additional provision of national multiple retailers particularly in the
comparison goods sector would strengthen its overall offer.
Sydenham District Centre
3.88 This district centre is located in the south-west of the Borough and is linear in
nature. It contains a total of 22,340 sqm gross retail/ service floorspace in
166 units. Convenience retail units and the proportion of A1 services and A2
Services are all above the national average, with the proportion of comparison
units below the national average. The centre contains a good range of goods
and services, and includes Somerfield and Lidl foodstores.
3.89 The number of retail units in Sydenham has increased since 2000. Most
retailers in the centre are independent, although it contains some national
multiples which are predominately concentrated on the Shopping Core Area.
Vacant units in the centre are above the national average, although these tend
to be concentrated on the centre’s periphery. Eight national multiple
requirements for floorspace in Sydenham are recorded by EGi at May 2009.
P27/79 11936/679166v2
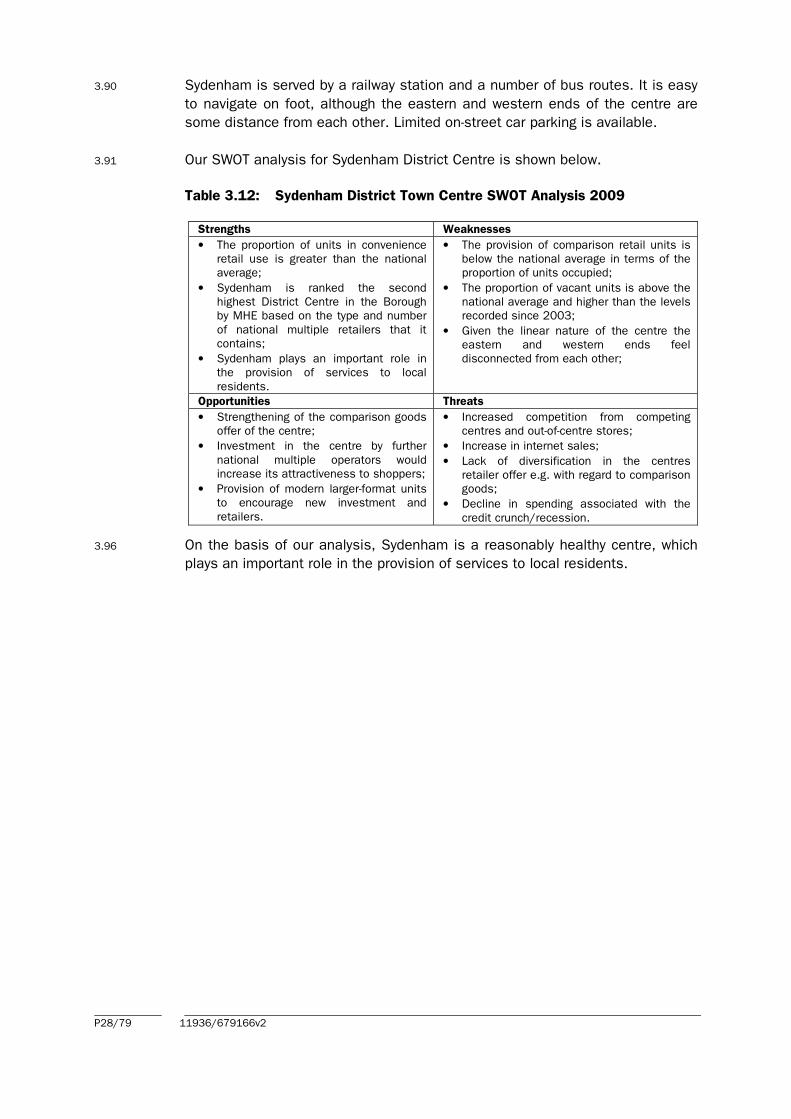
3.96
3.90 Sydenham is served by a railway station and a number of bus routes. It is easy
to navigate on foot, although the eastern and western ends of the centre are
some distance from each other. Limited on-street car parking is available.
3.91 Our SWOT analysis for Sydenham District Centre is shown below.
Table 3.12: Sydenham District Town Centre SWOT Analysis 2009
Strengths Weaknesses
• The proportion of units in convenience
retail use is greater than the national
average;
• Sydenham is ranked the second
highest District Centre in the Borough
by MHE based on the type and number
of national multiple retailers that it
contains;
• Sydenham plays an important role in
the provision of services to local
residents.
• The provision of comparison retail units is
below the national average in terms of the
proportion of units occupied;
• The proportion of vacant units is above the
national average and higher than the levels
recorded since 2003;
• Given the linear nature of the centre the
eastern and western ends feel
disconnected from each other;
Opportunities Threats
• Strengthening of the comparison goods
offer of the centre;
• Investment in the centre by further
national multiple operators would
increase its attractiveness to shoppers;
• Provision of modern larger-format units
to encourage new investment and
retailers.
• Increased competition from competing
centres and out-of-centre stores;
• Increase in internet sales;
• Lack of diversification in the centres
retailer offer e.g. with regard to comparison
goods;
• Decline in spending associated with the
credit crunch/recession.
On the basis of our analysis, Sydenham is a reasonably healthy centre, which
plays an important role in the provision of services to local residents.
P28/79 11936/679166v2
4.0 HOUSEHOLD SURVEY
Survey Structure
4.1 NEMS Market Research carried out a telephone survey of 1,002 households in
the study area between 20th April and 2nd March 2009. The survey results are
attached at Appendix C and summarised in this section. The study area was
split into ten zones based on postcode boundaries and was identical to the
survey area used in the 2004 household survey. A plan of the study area is
included at Appendix B. The survey zones used were:
• Zone 1 Rotherhithe;
• Zone 2 Peckham/ New Cross;
• Zone 3 Greenwich/ Blackheath;
• Zone 4 Lewisham Town Centre;
• Zone 5 Catford;
• Zone 6 Downham/ Bromley;
• Zone 7 Forest Hill/ Sydenham;
• Zone 8 Norwood;
• Zone 9 Beckenham; and
• Zone 10 Dulwich.
4.2 These sectors reflect the extent of the primary catchment areas of the main
shopping centres in LB Lewisham. A copy of the survey questionnaire is
attached at Appendix C. The main aims of the survey were to establish patterns
for the following:
• Main food and grocery shopping;
• Top-up food and grocery shopping; and
• Non-food shopping, including:
- clothing and footwear;
- domestic electrical appliances;
- other electrical goods (TV, Hi-FI and computers)
- furniture, soft furnishing or carpets;
- DIY/garden items and hardware; and
- Other non-food items.
• Leisure Activities, including:
- cinema;
- theatre;
- pub/restaurant;
- swimming;
- bingo;
- health club; and
- ten-pin bowling. P29/79 11936/679166v2
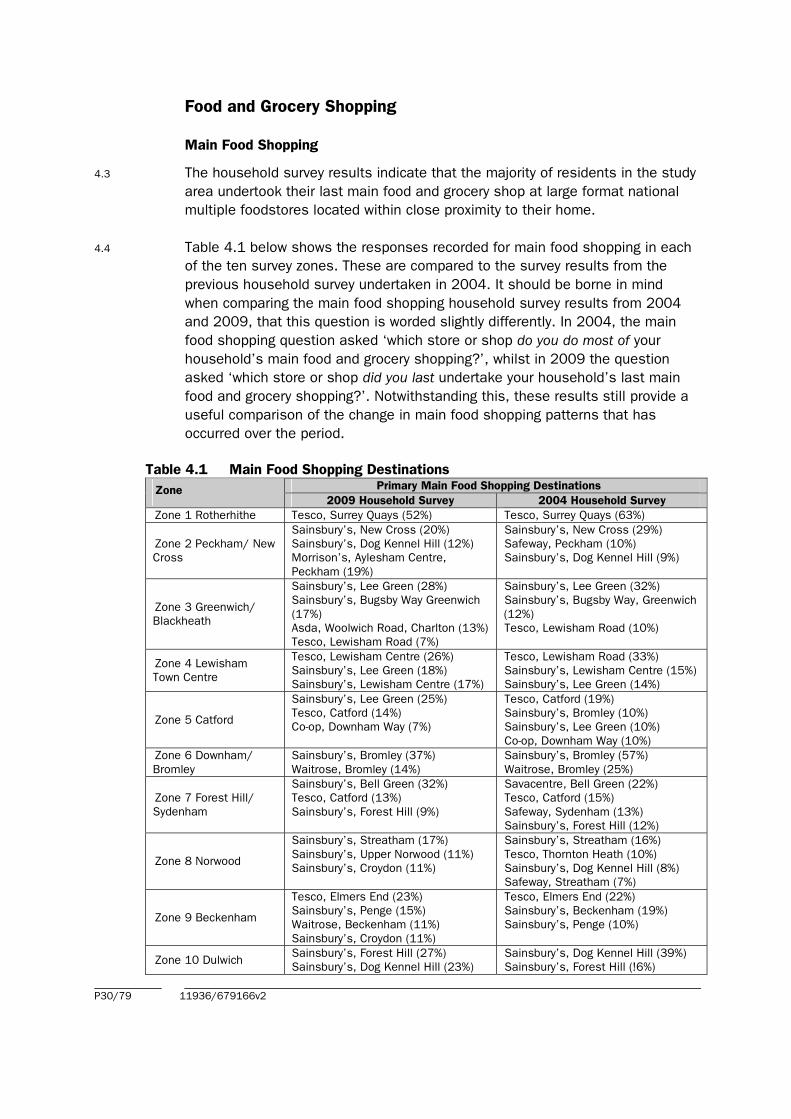
Food and Grocery Shopping
Main Food Shopping
4.3 The household survey results indicate that the majority of residents in the study
area undertook their last main food and grocery shop at large format national
multiple foodstores located within close proximity to their home.
4.4 Table 4.1 below shows the responses recorded for main food shopping in each
of the ten survey zones. These are compared to the survey results from the
previous household survey undertaken in 2004. It should be borne in mind
when comparing the main food shopping household survey results from 2004
and 2009, that this question is worded slightly differently. In 2004, the main
food shopping question asked ‘which store or shop do you do most of your
household’s main food and grocery shopping?’, whilst in 2009 the question
asked ‘which store or shop did you last undertake your household’s last main
food and grocery shopping?’. Notwithstanding this, these results still provide a
useful comparison of the change in main food shopping patterns that has
occurred over the period.
Table 4.1 Main Food Shopping Destinations
Zone Primary Main Food Shopping Destinations
2009 Household Survey 2004 Household Survey
Zone 1 Rotherhithe Tesco, Surrey Quays (52%) Tesco, Surrey Quays (63%)
Zone 2 Peckham/ New
Cross
Sainsbury’s, New Cross (20%)
Sainsbury’s, Dog Kennel Hill (12%)
Morrison’s, Aylesham Centre,
Peckham (19%)
Sainsbury’s, New Cross (29%)
Safeway, Peckham (10%)
Sainsbury’s, Dog Kennel Hill (9%)
Zone 3 Greenwich/
Blackheath
Sainsbury’s, Lee Green (28%)
Sainsbury’s, Bugsby Way Greenwich
(17%)
Asda, Woolwich Road, Charlton (13%)
Tesco, Lewisham Road (7%)
Sainsbury’s, Lee Green (32%)
Sainsbury’s, Bugsby Way, Greenwich
(12%)
Tesco, Lewisham Road (10%)
Zone 4 Lewisham
Town Centre
Tesco, Lewisham Centre (26%)
Sainsbury’s, Lee Green (18%)
Sainsbury’s, Lewisham Centre (17%)
Tesco, Lewisham Road (33%)
Sainsbury’s, Lewisham Centre (15%)
Sainsbury’s, Lee Green (14%)
Zone 5 Catford
Sainsbury’s, Lee Green (25%)
Tesco, Catford (14%)
Co-op, Downham Way (7%)
Tesco, Catford (19%)
Sainsbury’s, Bromley (10%)
Sainsbury’s, Lee Green (10%)
Co-op, Downham Way (10%)
Zone 6 Downham/
Bromley
Sainsbury’s, Bromley (37%)
Waitrose, Bromley (14%)
Sainsbury’s, Bromley (57%)
Waitrose, Bromley (25%)
Zone 7 Forest Hill/
Sydenham
Sainsbury’s, Bell Green (32%)
Tesco, Catford (13%)
Sainsbury’s, Forest Hill (9%)
Savacentre, Bell Green (22%)
Tesco, Catford (15%)
Safeway, Sydenham (13%)
Sainsbury’s, Forest Hill (12%)
Zone 8 Norwood
Sainsbury’s, Streatham (17%)
Sainsbury’s, Upper Norwood (11%)
Sainsbury’s, Croydon (11%)
Sainsbury’s, Streatham (16%)
Tesco, Thornton Heath (10%)
Sainsbury’s, Dog Kennel Hill (8%)
Safeway, Streatham (7%)
Zone 9 Beckenham
Tesco, Elmers End (23%)
Sainsbury’s, Penge (15%)
Waitrose, Beckenham (11%)
Sainsbury’s, Croydon (11%)
Tesco, Elmers End (22%)
Sainsbury’s, Beckenham (19%)
Sainsbury’s, Penge (10%)
Zone 10 Dulwich Sainsbury’s, Forest Hill (27%)
Sainsbury’s, Dog Kennel Hill (23%)
Sainsbury’s, Dog Kennel Hill (39%)
Sainsbury’s, Forest Hill (!6%)
P30/79 11936/679166v2
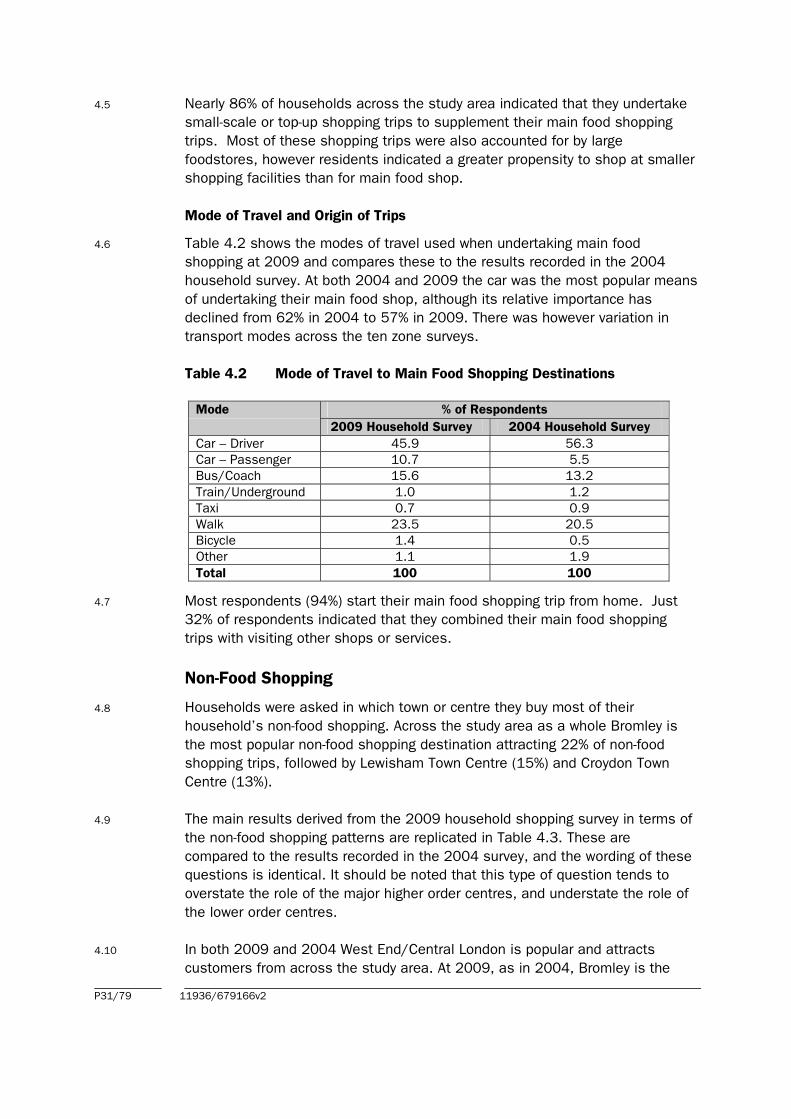
4.5 Nearly 86% of households across the study area indicated that they undertake
small-scale or top-up shopping trips to supplement their main food shopping
trips. Most of these shopping trips were also accounted for by large
foodstores, however residents indicated a greater propensity to shop at smaller
shopping facilities than for main food shop.
Mode of Travel and Origin of Trips
4.6 Table 4.2 shows the modes of travel used when undertaking main food
shopping at 2009 and compares these to the results recorded in the 2004
household survey. At both 2004 and 2009 the car was the most popular means
of undertaking their main food shop, although its relative importance has
declined from 62% in 2004 to 57% in 2009. There was however variation in
transport modes across the ten zone surveys.
Table 4.2 Mode of Travel to Main Food Shopping Destinations
Mode % of Respondents
2009 Household Survey 2004 Household Survey
Car – Driver 45.9 56.3
Car – Passenger 10.7 5.5
Bus/Coach 15.6 13.2
Train/Underground 1.0 1.2
Taxi 0.7 0.9
Walk 23.5 20.5
Bicycle 1.4 0.5
Other 1.1 1.9
Total 100 100
4.7 Most respondents (94%) start their main food shopping trip from home. Just
32% of respondents indicated that they combined their main food shopping
trips with visiting other shops or services.
Non-Food Shopping
4.8 Households were asked in which town or centre they buy most of their
household’s non-food shopping. Across the study area as a whole Bromley is
the most popular non-food shopping destination attracting 22% of non-food
shopping trips, followed by Lewisham Town Centre (15%) and Croydon Town
Centre (13%).
4.9 The main results derived from the 2009 household shopping survey in terms of
the non-food shopping patterns are replicated in Table 4.3. These are
compared to the results recorded in the 2004 survey, and the wording of these
questions is identical. It should be noted that this type of question tends to
overstate the role of the major higher order centres, and understate the role of
the lower order centres.
4.10 In both 2009 and 2004 West End/Central London is popular and attracts
customers from across the study area. At 2009, as in 2004, Bromley is the
P31/79 11936/679166v2
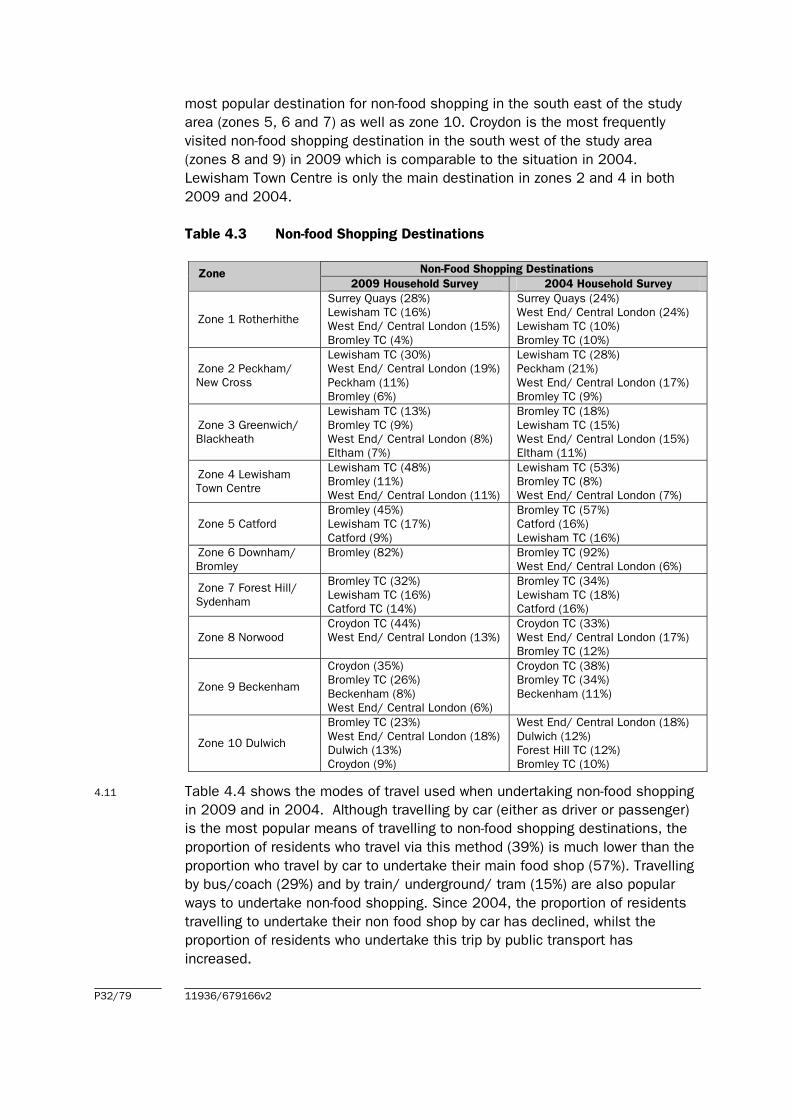
4.11
most popular destination for non-food shopping in the south east of the study
area (zones 5, 6 and 7) as well as zone 10. Croydon is the most frequently
visited non-food shopping destination in the south west of the study area
(zones 8 and 9) in 2009 which is comparable to the situation in 2004.
Lewisham Town Centre is only the main destination in zones 2 and 4 in both
2009 and 2004.
Table 4.3 Non-food Shopping Destinations
Zone Non-Food Shopping Destinations
2009 Household Survey 2004 Household Survey
Zone 1 Rotherhithe
Surrey Quays (28%)
Lewisham TC (16%)
West End/ Central London (15%)
Bromley TC (4%)
Surrey Quays (24%)
West End/ Central London (24%)
Lewisham TC (10%)
Bromley TC (10%)
Zone 2 Peckham/
New Cross
Lewisham TC (30%)
West End/ Central London (19%)
Peckham (11%)
Bromley (6%)
Lewisham TC (28%)
Peckham (21%)
West End/ Central London (17%)
Bromley TC (9%)
Zone 3 Greenwich/
Blackheath
Lewisham TC (13%)
Bromley TC (9%)
West End/ Central London (8%)
Eltham (7%)
Bromley TC (18%)
Lewisham TC (15%)
West End/ Central London (15%)
Eltham (11%)
Zone 4 Lewisham
Town Centre
Lewisham TC (48%)
Bromley (11%)
West End/ Central London (11%)
Lewisham TC (53%)
Bromley TC (8%)
West End/ Central London (7%)
Zone 5 Catford
Bromley (45%)
Lewisham TC (17%)
Catford (9%)
Bromley TC (57%)
Catford (16%)
Lewisham TC (16%)
Zone 6 Downham/
Bromley
Bromley (82%) Bromley TC (92%)
West End/ Central London (6%)
Zone 7 Forest Hill/
Sydenham
Bromley TC (32%)
Lewisham TC (16%)
Catford TC (14%)
Bromley TC (34%)
Lewisham TC (18%)
Catford (16%)
Zone 8 Norwood
Croydon TC (44%)
West End/ Central London (13%)
Croydon TC (33%)
West End/ Central London (17%)
Bromley TC (12%)
Zone 9 Beckenham
Croydon (35%)
Bromley TC (26%)
Beckenham (8%)
West End/ Central London (6%)
Croydon TC (38%)
Bromley TC (34%)
Beckenham (11%)
Zone 10 Dulwich
Bromley TC (23%)
West End/ Central London (18%)
Dulwich (13%)
Croydon (9%)
West End/ Central London (18%)
Dulwich (12%)
Forest Hill TC (12%)
Bromley TC (10%)
Table 4.4 shows the modes of travel used when undertaking non-food shopping
in 2009 and in 2004. Although travelling by car (either as driver or passenger)
is the most popular means of travelling to non-food shopping destinations, the
proportion of residents who travel via this method (39%) is much lower than the
proportion who travel by car to undertake their main food shop (57%). Travelling
by bus/coach (29%) and by train/ underground/ tram (15%) are also popular
ways to undertake non-food shopping. Since 2004, the proportion of residents
travelling to undertake their non food shop by car has declined, whilst the
proportion of residents who undertake this trip by public transport has
increased.
P32/79 11936/679166v2
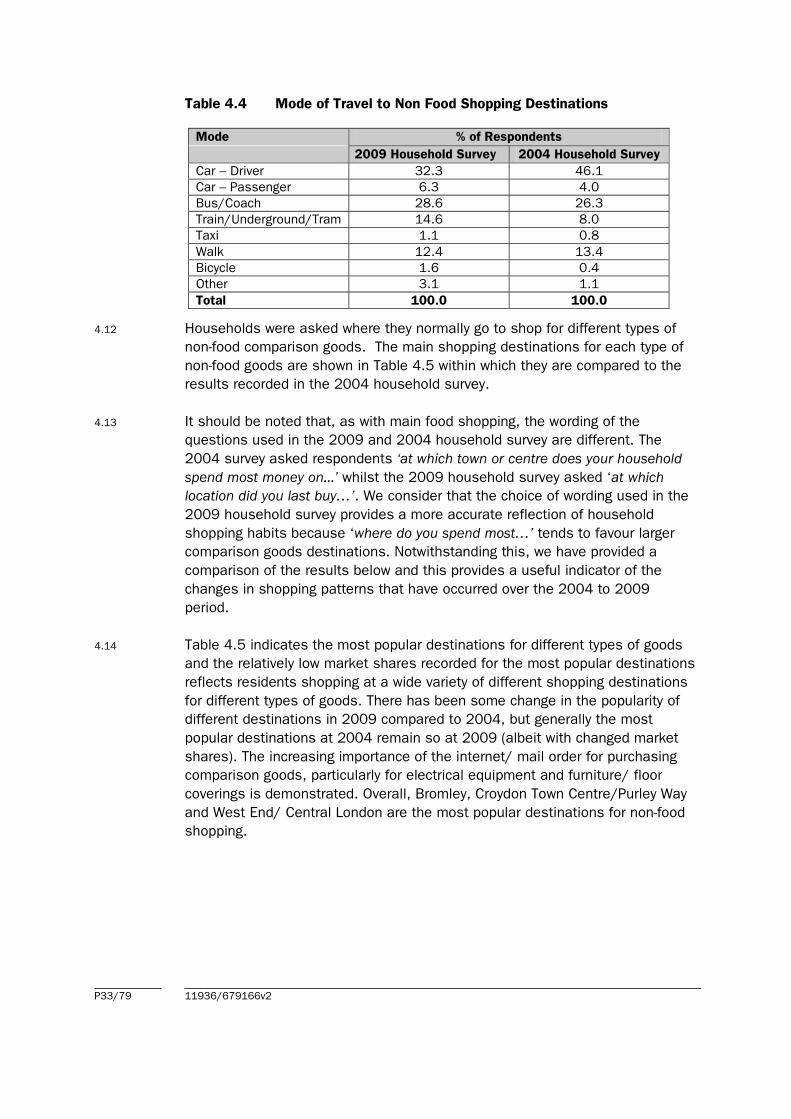
Table 4.4 Mode of Travel to Non Food Shopping Destinations
Mode % of Respondents
2009 Household Survey 2004 Household Survey
Car – Driver 32.3 46.1
Car – Passenger 6.3 4.0
Bus/Coach 28.6 26.3
Train/Underground/Tram 14.6 8.0
Taxi 1.1 0.8
Walk 12.4 13.4
Bicycle 1.6 0.4
Other 3.1 1.1
Total 100.0 100.0
4.12 Households were asked where they normally go to shop for different types of
non-food comparison goods. The main shopping destinations for each type of
non-food goods are shown in Table 4.5 within which they are compared to the
results recorded in the 2004 household survey.
4.13 It should be noted that, as with main food shopping, the wording of the
questions used in the 2009 and 2004 household survey are different. The
2004 survey asked respondents ‘at which town or centre does your household
spend most money on...’ whilst the 2009 household survey asked ‘at which
location did you last buy…’. We consider that the choice of wording used in the
2009 household survey provides a more accurate reflection of household
shopping habits because ‘where do you spend most…’ tends to favour larger
comparison goods destinations. Notwithstanding this, we have provided a
comparison of the results below and this provides a useful indicator of the
changes in shopping patterns that have occurred over the 2004 to 2009
period.
4.14 Table 4.5 indicates the most popular destinations for different types of goods
and the relatively low market shares recorded for the most popular destinations
reflects residents shopping at a wide variety of different shopping destinations
for different types of goods. There has been some change in the popularity of
different destinations in 2009 compared to 2004, but generally the most
popular destinations at 2004 remain so at 2009 (albeit with changed market
shares). The increasing importance of the internet/ mail order for purchasing
comparison goods, particularly for electrical equipment and furniture/ floor
coverings is demonstrated. Overall, Bromley, Croydon Town Centre/Purley Way
and West End/ Central London are the most popular destinations for non-food
shopping.
P33/79 11936/679166v2

Table 4.5 Non-Food Shopping Destinations by Type of Goods
Mode % of Respondents
2009 Household Survey 2004 Household Survey
Clothes and shoes Bromley TC (22%)
West End/ Central London (15%)
Croydon (11%)
Lewisham TC (11%)
Bromley TC (21%)
West End/ Central London (17%)
Croydon TC (14%)
Lewisham TC (13%)
Domestic electrical
appliances
Internet/ mail order (15%)
Croydon TC/ Purley Way (9%)
West End/ Central London (7%)
Croydon TC/ Purley Way (15%)
Bromley TC (14%)
Lewisham TC (5%)
TV/ HiFi and Computers Internet/ mail order (18%)
West End/ Central London (8%)
Croydon TC/ Purley Way (7%)
Bromley TC (5%)
Bromley Road, Catford (5%)
Croydon TC/ Purley Way (15%)
Bromley TC (12%)
West End/ Central London (5%)
Lewisham TC (4%)
Furniture, floor coverings Croydon TC/ Purley Way (11%)
West End/ Central London (7%)
Bromley TC (6%)
Internet/ mail order (5%)
Lewisham TC (5%)
Croydon TC/ Purley Way (15%)
Bromley TC (12%)
West End/ Central London (7%)
Lewisham TC (3%)
DIY/ hardware Homebase, Catford (8%)
B&Q, Old Kent Road (8%)
Croydon TC/ Purley Way (6%)
Homebase, Catford (12%)
Bromley TC (6%)
Croydon TC/ Purley Way (11%)
Old Kent Road (4%)
Other comparison goods Internet/ mail order (27%)
Bromley TC (12%)
West End/ Central London (8%)
Lewisham TC (6%)
Bromley TC (20%)
West End/ Central London (10%)
Croydon TC (8%)
Lewisham TC (9%)
Likes and Dislikes about Shopping
4.15 Respondents were asked what they like and dislike about shopping in their
main non-food shopping destination. The results for all centres are
summarised in Tables 4.6 and 4.7 and compared to the results obtained from
the 2004 household survey. The proximity of the centre to the respondents’
home was the main factor people like about their main comparison goods
shopping destination at 2009 followed by the choice and quality of shops.
These two factors were also the most popular at 2004.
4.16 In terms of factors which respondents disliked about comparison goods
shopping, over half of respondents indicated that there was ‘nothing in
particular’ which they disliked at 2009 as shown in Table 4.7. This response
aside, respondents disliked crowded/ busy centres.
P34/79 11936/679166v2
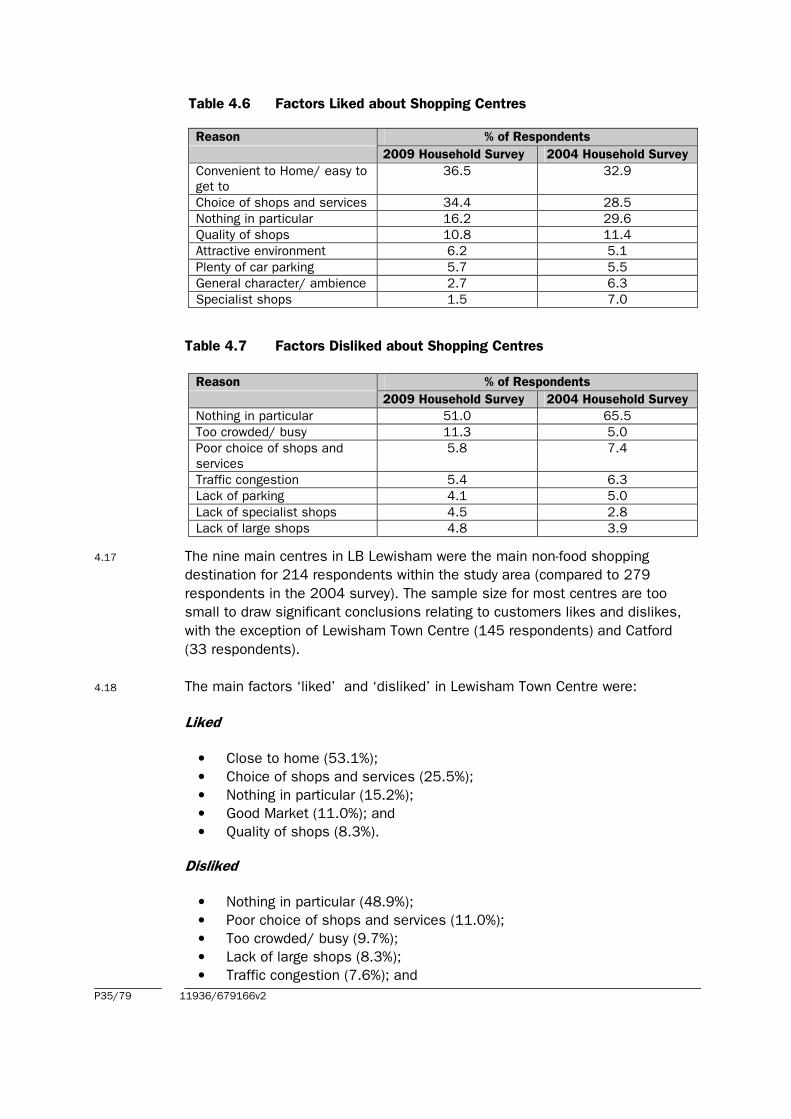
Table 4.6 Factors Liked about Shopping Centres
Reason % of Respondents
2009 Household Survey 2004 Household Survey
Convenient to Home/ easy to
get to
36.5 32.9
Choice of shops and services 34.4 28.5
Nothing in particular 16.2 29.6
Quality of shops 10.8 11.4
Attractive environment 6.2 5.1
Plenty of car parking 5.7 5.5
General character/ ambience 2.7 6.3
Specialist shops 1.5 7.0
Table 4.7 Factors Disliked about Shopping Centres
Reason % of Respondents
2009 Household Survey 2004 Household Survey
Nothing in particular 51.0 65.5
Too crowded/ busy 11.3 5.0
Poor choice of shops and
services
5.8 7.4
Traffic congestion 5.4 6.3
Lack of parking 4.1 5.0
Lack of specialist shops 4.5 2.8
Lack of large shops 4.8 3.9
4.17 The nine main centres in LB Lewisham were the main non-food shopping
destination for 214 respondents within the study area (compared to 279
respondents in the 2004 survey). The sample size for most centres are too
small to draw significant conclusions relating to customers likes and dislikes,
with the exception of Lewisham Town Centre (145 respondents) and Catford
(33 respondents).
4.18 The main factors ‘liked’ and ‘disliked’ in Lewisham Town Centre were:
Liked
• Close to home (53.1%);
• Choice of shops and services (25.5%);
• Nothing in particular (15.2%);
• Good Market (11.0%); and
• Quality of shops (8.3%).
Disliked
• Nothing in particular (48.9%);
• Poor choice of shops and services (11.0%);
• Too crowded/ busy (9.7%);
• Lack of large shops (8.3%);
• Traffic congestion (7.6%); and
P35/79 11936/679166v2

• Lack of specialist shops (6.9%).
4.19 The main factors ‘liked’ and ‘disliked’ in Catford Town Centre were:
Liked
• Close to home (54.5%);
• Nothing in particular (24.2%); and
• Plenty of parking (9.1%).
Disliked
• Nothing in particular (42.4%);
• Lack of large shops (18.2%);
• Poor choice of shops and services (12.1%); and
• Unsafe/ poor security/ dangerous (9.1%).
4.20 Additional questions were asked about whether there were any measures that
would make them shop in Catford, Deptford and Lewisham Town Centres more
often. Across the study area as a whole most respondents stated that there
was ‘nothing that could be done to encourage them to use these centres more
often. The main results for each centre are shown below
Table 4.8 Measures to encourage more frequent use of Catford, Deptford
and Lewisham Town Centres
Reason % of Respondents
Catford Deptford Lewisham
Nothing 64.6 74.9 66.2
Better choice of non-food
shops
6.1 3.3 7.7
More car parking 4.6 2.2 3.5
Better Maintenance/
cleanliness
3.6 2.4 2.7
Improved bus services/
public transport
2.4 2.6 2.4
Better quality shops 2.4 1.0 3.5
More traffic free areas/
pedestrianisation
1.6 0.6 2.9
Other 14.7 13.0 11.1
Markets
4.21 The household survey asked respondents specific questions regarding their use
of markets. Most respondents (54.8%) indicated that they visited nearby
markets, with 18.7% of these visiting once a week or more and 38.5% visiting
once a month or more.
4.22 Respondents’ use of different markets is shown in Table 4.9 below. Food
shopping is more frequently undertaken at markets than non-food shopping,
with 85.4% of respondents who visit markets doing so for food compared to
P36/79 11936/679166v2
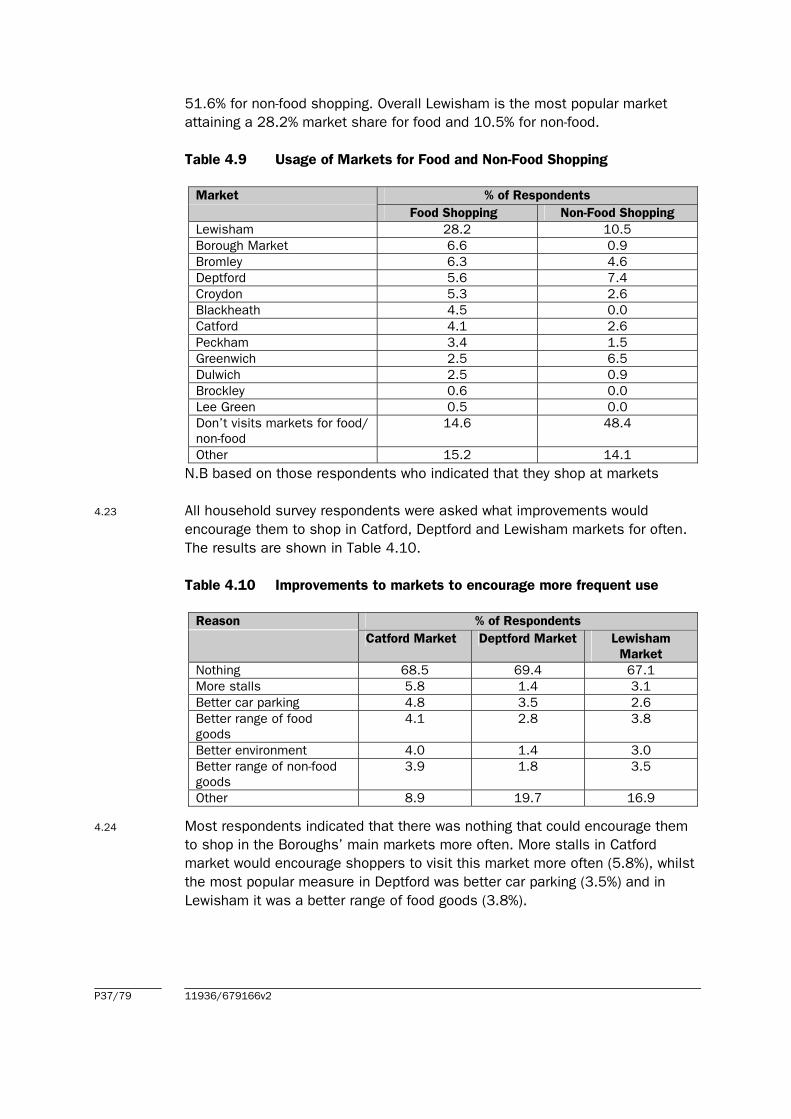
4.23
4.24
51.6% for non-food shopping. Overall Lewisham is the most popular market
attaining a 28.2% market share for food and 10.5% for non-food.
Table 4.9 Usage of Markets for Food and Non-Food Shopping
Market % of Respondents
Food Shopping Non-Food Shopping
Lewisham 28.2 10.5
Borough Market 6.6 0.9
Bromley 6.3 4.6
Deptford 5.6 7.4
Croydon 5.3 2.6
Blackheath 4.5 0.0
Catford 4.1 2.6
Peckham 3.4 1.5
Greenwich 2.5 6.5
Dulwich 2.5 0.9
Brockley 0.6 0.0
Lee Green 0.5 0.0
Don’t visits markets for food/
non-food
14.6 48.4
Other 15.2 14.1
N.B based on those respondents who indicated that they shop at markets
All household survey respondents were asked what improvements would
encourage them to shop in Catford, Deptford and Lewisham markets for often.
The results are shown in Table 4.10.
Table 4.10 Improvements to markets to encourage more frequent use
Reason % of Respondents
Catford Market Deptford Market Lewisham
Market
Nothing 68.5 69.4 67.1
More stalls 5.8 1.4 3.1
Better car parking 4.8 3.5 2.6
Better range of food
goods
4.1 2.8 3.8
Better environment 4.0 1.4 3.0
Better range of non-food
goods
3.9 1.8 3.5
Other 8.9 19.7 16.9
Most respondents indicated that there was nothing that could encourage them
to shop in the Boroughs’ main markets more often. More stalls in Catford
market would encourage shoppers to visit this market more often (5.8%), whilst
the most popular measure in Deptford was better car parking (3.5%) and in
Lewisham it was a better range of food goods (3.8%).
P37/79 11936/679166v2
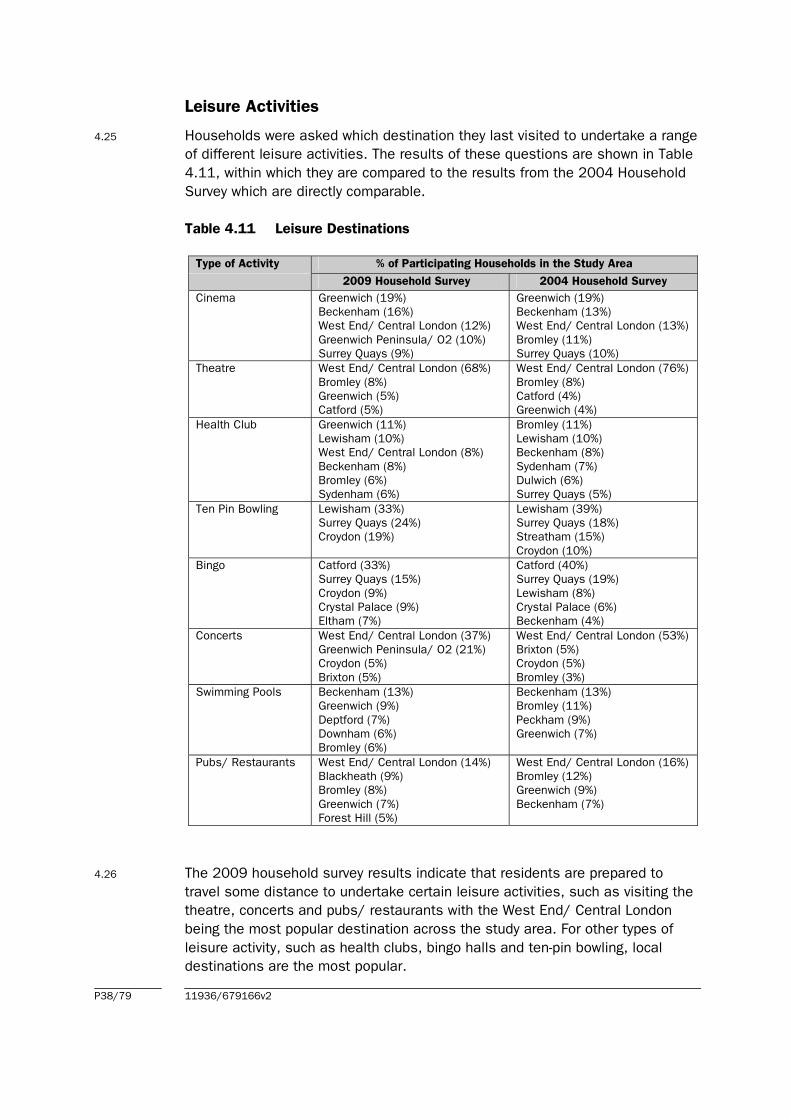
4.25
Leisure Activities
Households were asked which destination they last visited to undertake a range
of different leisure activities. The results of these questions are shown in Table
4.11, within which they are compared to the results from the 2004 Household
Survey which are directly comparable.
Table 4.11 Leisure Destinations
Type of Activity % of Participating Households in the Study Area
2009 Household Survey 2004 Household Survey
Cinema Greenwich (19%) Greenwich (19%)
Beckenham (16%) Beckenham (13%)
West End/ Central London (12%) West End/ Central London (13%)
Greenwich Peninsula/ O2 (10%) Bromley (11%)
Surrey Quays (9%) Surrey Quays (10%)
Theatre West End/ Central London (68%) West End/ Central London (76%)
Bromley (8%) Bromley (8%)
Greenwich (5%) Catford (4%)
Catford (5%) Greenwich (4%)
Health Club Greenwich (11%) Bromley (11%)
Lewisham (10%) Lewisham (10%)
West End/ Central London (8%) Beckenham (8%)
Beckenham (8%) Sydenham (7%)
Bromley (6%) Dulwich (6%)
Sydenham (6%) Surrey Quays (5%)
Ten Pin Bowling Lewisham (33%) Lewisham (39%)
Surrey Quays (24%) Surrey Quays (18%)
Croydon (19%) Streatham (15%)
Croydon (10%)
Bingo Catford (33%) Catford (40%)
Surrey Quays (15%) Surrey Quays (19%)
Croydon (9%) Lewisham (8%)
Crystal Palace (9%) Crystal Palace (6%)
Eltham (7%) Beckenham (4%)
Concerts West End/ Central London (37%) West End/ Central London (53%)
Greenwich Peninsula/ O2 (21%) Brixton (5%)
Croydon (5%) Croydon (5%)
Brixton (5%) Bromley (3%)
Swimming Pools Beckenham (13%) Beckenham (13%)
Greenwich (9%) Bromley (11%)
Deptford (7%) Peckham (9%)
Downham (6%) Greenwich (7%)
Bromley (6%)
Pubs/ Restaurants West End/ Central London (14%) West End/ Central London (16%)
Blackheath (9%) Bromley (12%)
Bromley (8%) Greenwich (9%)
Greenwich (7%) Beckenham (7%)
Forest Hill (5%)
4.26 The 2009 household survey results indicate that residents are prepared to
travel some distance to undertake certain leisure activities, such as visiting the
theatre, concerts and pubs/ restaurants with the West End/ Central London
being the most popular destination across the study area. For other types of
leisure activity, such as health clubs, bingo halls and ten-pin bowling, local
destinations are the most popular.
P38/79 11936/679166v2
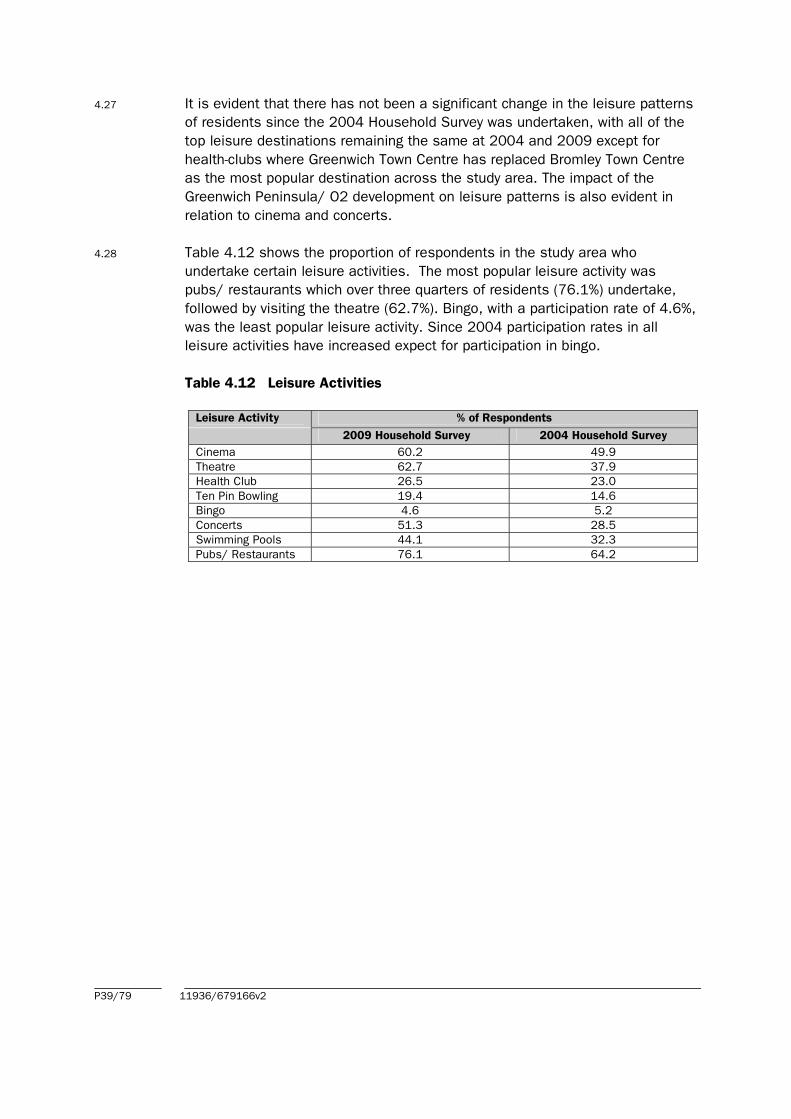
4.27 It is evident that there has not been a significant change in the leisure patterns
of residents since the 2004 Household Survey was undertaken, with all of the
top leisure destinations remaining the same at 2004 and 2009 except for
health-clubs where Greenwich Town Centre has replaced Bromley Town Centre
as the most popular destination across the study area. The impact of the
Greenwich Peninsula/ O2 development on leisure patterns is also evident in
relation to cinema and concerts.
4.28 Table 4.12 shows the proportion of respondents in the study area who
undertake certain leisure activities. The most popular leisure activity was
pubs/ restaurants which over three quarters of residents (76.1%) undertake,
followed by visiting the theatre (62.7%). Bingo, with a participation rate of 4.6%,
was the least popular leisure activity. Since 2004 participation rates in all
leisure activities have increased expect for participation in bingo.
Table 4.12 Leisure Activities
Leisure Activity % of Respondents
2009 Household Survey 2004 Household Survey
Cinema 60.2 49.9
Theatre 62.7 37.9
Health Club 26.5 23.0
Ten Pin Bowling 19.4 14.6
Bingo 4.6 5.2
Concerts 51.3 28.5
Swimming Pools 44.1 32.3
Pubs/ Restaurants 76.1 64.2
P39/79 11936/679166v2
5.0 QUANTITATIVE & QUALITATIVE SCOPE FOR
NEW RETAIL DEVELOPMENT
Introduction
5.1 This section assesses the quantitative and qualitative scope for new retail
floorspace in LB Lewisham in the period from 2009 to 2025. It sets out the
methodology adopted for this analysis and provides a quantitative capacity
analysis in terms of levels of spending for convenience and comparison
shopping. A qualitative assessment of the range and scale of existing shopping
facilities has also been undertaken.
5.2 All monetary values expressed in this analysis are at 2007 prices, consistent
with Experian’s base year expenditure figures for 2007.
Methodology and Data
5.3 The quantitative analysis is based on a defined study area that covers the LB
Lewisham together with parts of the neighbouring authorities of Bromley,
Croydon, Greenwich Lambeth and Southwark. The study area is sub-divided into
10 zones as shown in Appendix B and set out in para 4.1 above.
5.4 The study area is based on postcode area boundaries. The extent of the study
area is based on the previous study area in the RCASAS 2004 and reflects the
proximity of competing shopping destinations, i.e. shopping facilities within the
Borough are expected to attract the majority of their trade from residents within
the study area, although there will still be limited inflow from outside of the
study area.
5.5 The level of available expenditure to support retailers is based on first
establishing per capita levels of spending for the study area population.
Experian’s local consumer expenditure estimates for comparison and
convenience goods for each of the study area zones for the year 2007 have
been obtained.
5.6 Experian’s EBS national expenditure information has been used to forecast
expenditure within the study area in the short term (2007 to 2011). Unlike
previous expenditure growth rates provided by The Data Consultancy (formerly
URPI), which were based on past trends, Experian’s projections are based on
an econometric model of disaggregated consumer spending. This model takes
a number of macro-economic forecasts (chiefly consumer spending, incomes
P40/79 11936/679166v2
and inflation) and uses them to produce forecasts of consumer spending
volumes, prices and value, broken down into separate categories of goods. The
model incorporates assumptions about income and price elasticities.
5.7 For longer term projections Experian’s ultra long term growth rate has been
adopted (0.7% for convenience goods and 4.6% for comparison) to project
expenditure between 2011 to 2016 and beyond. We believe the Experian’s
lower EBS growth rates reflect the current economic downturn and provide an
appropriate growth rate for the short term. In the longer term it is more difficult
to forecast year on year changes in expenditure, and in our view past trend line
growth rates provide the most appropriate average growth rate and the potential
post recession recovery.
5.8 To assess the capacity for new retail floorspace, penetration rates are
estimated for shopping facilities within the study area. The assessment of
penetration rates are based on a range of factors, but primarily information
gathered through the 2009 household survey.
5.9 The total turnover of shops within LB Lewisham is estimated based on
penetration rates. These turnover estimates are then compared to average
company benchmark or average sales floorspace densities derived from Verdict
information and Mintel’s Retail Rankings 2008, which provides an indication of
how individual retail units and centres are performing against expected turnover
averages. This allows the identification of potential surplus or deficit capacity
for retail sales floorspace.
Population and Spending
5.10 The study area population for 2009 to 2025 is set out in Table 1D in Appendix
D. Experian provides population estimates for each of the survey zones at 2001
based on Census data. These have been projected forward between 2001 and
2025 based on the Greater London Authorities low population projections
(March 2009) interpolated and apportioned on the basis of Borough
boundaries. The GLA recommends the use of the low projections for planning
purposes at a Borough level. This is consistent with the approach adopted in
the RCASAS 2004.
5.11 On this basis, the population within the study area is expected to increase
between 2009 and 2025 by 15%. There are variations between individual
zones, for example the population in Zone 10 (Dulwich) is anticipated to
increase by 22%, whilst the population in Zone 6 (Downham/ Bromley) is
anticipated to increase by 6%.
P41/79 11936/679166v2

5.12 Table 2D in Appendix D sets out the forecast growth in spending per head for
convenience goods within each zone in the study area up to 2025. Forecasts
of per capita spending on comparison goods are shown in Table 1E in Appendix
E.
5.13 The levels of available spending are derived by combining the population in
Table 1D and per capita spending figures in Tables 2D and 1E. For both
comparison and convenience spending, a reduction has been made for special
forms of trading such as mail order, e-tail (non-retail businesses) and vending
machines.
5.14 Special Forms of Trading (SFT) and non-store activity is included within
Experian’s Goods Based Expenditure (GBE) estimates. “Special forms of
trading” includes other forms of retail expenditure not spent in shops e.g. mail
order sales, some internet sales, vending machines, party plan selling, market
stalls and door to door selling. SFT needs to be excluded from retail
assessments because it relates to expenditure not spent in shops and does
not have a direct relationship to the demand for retail floorspace. The growth in
home computing, Internet connections and interactive TV may lead to a growth
in home shopping and may have effects on retailing in the high street. Experian
provides projections for Special Forms of Trading and E-tailing (Retail Planner
Briefing Note 6.0 – October 2008).
5.15 This Experian information suggests that non-store retail sales in 2008 is:
• 5.9% of convenience goods expenditure; and
• 11.3% of comparison goods expenditure.
5.16 Experian predicts that these figures will increase to 8.1% and 13.9% by 2016.
For convenience expenditure 5.8% of the 5.9% is estimated to be E-tailing, and
the rest 0.1% is other forms of SFT e.g. mail order. E-tailing in 2004 was
broken down into E-tailing through retail businesses (e.g. Tesco and Sainsbury)
at 1.1% and non-retail businesses (0.5%). The E-tailing split for retail and non-
retail businesses was approximately 70:30 in 2004.
5.17 For comparison expenditure in 2008, 9.1% of the 11.3% is estimated to be E-
tailing, and the rest 2.2% is other forms of SFT e.g. mail order. E-tailing through
retail businesses (e.g. Next and Argos) was 1.3% and for non-retail businesses
1.8% (e.g. Amazon) in 2004. The E-tailing split for retail and non-retail
businesses was approximately 40:60 in 2004.
5.18 Experian provide projections for E-tailing and other SFT. These projections have
been used to exclude expenditure attributed to e-tailing through non-retail
businesses, which will not directly impact on the demand for retail floorspace.
Based on Experian data SFT (including non-retail e-tailing but excluding e-tail
through retail businesses) is 1.8% and 7.7% of total convenience and
comparison goods expenditure respectively in 2008. The projections provided
by Experian suggest that these percentages could increase to 2.8% and 8.9%
P42/79 11936/679166v2
by 2016. The amount of e-tail expenditure through non-retail businesses is
expected to increase significantly in proportional terms, but as a proportion of
total expenditure this sector is expected to remain relatively insignificant for the
foreseeable future.
5.19 Home/electronic shopping has also emerged with the increasing growth in the
use of personal computers and the Internet. Trends within this sector may well
have implications for retailing. Therefore, it will be necessary to carefully
monitor the growth within this sector particularly in the long term and the effect
that it may have on diverting expenditure that might otherwise be spent in
shops.
5.20 On-line shopping has experienced rapid growth since the late 1990s but in
proportional terms the latest available data suggests it remains a small
percentage of total retail expenditure. Recent trends suggest continued strong
growth in this sector. However, there is still uncertainty about its longer-term
prospects. Experian’s figures suggest that the growth in e-tailing has to a
certain extent been at the expense of other forms of home shopping such as
catalogue and mail order shopping.
5.21 The implications on the demand for retail space are unclear. For example,
some retailers operate on-line sales from their traditional retail premises e.g.
food store operators. Therefore, growth in on-line sales may not always mean
there is a reduction in the need for retail floorspace. Given the uncertainties
relating to internet shopping and the likelihood that it will increase in
proportional terms, this assessment has adopted relatively cautious growth
projections for retail expenditure.
5.22 As a consequence of growth in population and per capita spending,
convenience goods spending within the study area is forecast to increase by
25.7% from £1,098.31 million in 2009 to £1,380.28 million in 2025, as
shown in Table 3D.
5.23 Comparison goods spending is forecast to more than double between 2009
and 2025, increasing from £1,676.72 million in 2009 to £3,586.19 million, as
shown in Table 2E. These figures relate to real growth and exclude inflation.
Existing Retail Floorspace 2009
5.24 Existing convenience goods floorspace within LB Lewisham is estimated at
39,424 sq m net as set out in Table 1B, Appendix B. This floorspace figures
excludes comparison sales floorspace within food stores (7,581 sq m net).
P43/79 11936/679166v2
5.25 Comparison goods retail floorspace within LB Lewisham is estimated as
79,335 sq m net as shown in Tables 2B, Appendix B.
5.26 It should be noted that these figures do not take into account convenience and
comparison floorspace provide in local centres in the Borough which will
increase the quantum of existing retail floorspace.
Existing Spending Patterns 2009
Convenience Goods Shopping
5.27 The results of the household shopper survey undertaken by NEMS in April 2009
have been used to estimate existing shopping patterns within the study area.
The estimates of market share or penetration for convenience goods spending
within each study area zone are shown in Table 4D, Appendix D.
5.28 In order to ensure consistency with the previous Study we have made no
allowance for inflow of convenience goods expenditure into the Borough. We
believe that this approach is realistic given the presence of large convenience
retail facilities beyond the Borough boundaries but within close proximity to it,
and we consider that the study area is an accurate reflection on where
convenience facilities in LB Lewisham will draw their trade.
5.29 The level of convenience goods expenditure attracted to shops/stores in LB
Lewisham in 2009 is estimated to be £464.47 million as shown in Table 5D,
Appendix D. LB Lewisham’s market share of total convenience expenditure in
the study area as a whole is estimated to be about 42% (£464.47 million of
£1,098.31 million). This compares to a market share of 35% for convenience
goods retention recorded in the RCASAS 2004. The wider study area as a whole
retains some 86% of available convenience goods expenditure at 2009
(£939.26 million).
5.30 As would be expected, the retention of convenience goods expenditure by
destinations in LB Lewisham varies across the zones, with retention being
greatest in Zone 4 Lewisham (94%) and Zone 7 Forest Hill/ Sydenham (85%)
and lowest in Zone 8 Norwood (5%) and Zone 9 Beckenham (5%).
5.31 Company average turnover to sales floorspace densities are available for major
food store operators and are compiled by Verdict. Company average sales
densities (adjusted to exclude petrol and comparison sales and include VAT)
have been applied to the sales area of the large food stores listed in Table 1B,
Appendix B, and a benchmark turnover for each store has been calculated.
This benchmark turnover is not necessarily the actual turnover of the food
store, but it provides a useful benchmark for assessing existing shopping
patterns and the adequacy of current floorspace in quantitative terms.
P44/79 11936/679166v2
5.32 The estimated convenience goods sales areas have been derived from a
combination of Experian Goad data, the Council’s own floorspace surveys,
Institute of Grocery Distribution (IGD) and NLP estimates based on site visits.
Estimates for comparison sales floorspace within large food stores has been
deducted from the figures in Table 1B in Appendix B, for consistency with the
use of goods based expenditure figures.
5.33 Average sales densities are not widely available for small convenience shops,
particularly independent retailers. An average sales density of £4,500 per sq m
has been adopted for small convenience shops in the defined town centres in
the Borough (2009). The total benchmark turnover of existing convenience
sales floorspace within the nine town centres in LB Lewisham (including the
Sainsbury’s, Bell Green) is £295.32 million at 2009.
5.34 We have made some adjustments to the market shares recorded in the
household survey. This is because household survey results, particularly in
London, often overestimate the expenditure attracted to the large foodstores
compared with smaller local convenience facilities. On this basis, a small
proportion of the convenience goods expenditure directed to some of the large
national multiple retailers in the Borough which appear to be trading particularly
well, such as the Sainsbury’s stores in Lee Green, Forest Hill, and Lewisham,
has been redirected to the smaller convenience facilities. The amount deducted
varies depending upon the level of overtrading of each store/ location
compared to the benchmark.
5.35 The assessment of shopping patterns, based on the household survey results,
suggests that convenience goods expenditure attracted to LB Lewisham
(excluding local shops and small freestanding facilities) in 2009 is £377.96
million (Table 5.1). These figures suggest that collectively convenience retail
facilities in LB Lewisham are over-trading significantly. The identified available
expenditure is 28.0% (or +£82.63 million) above benchmark levels. Although it
is likely that a number of the large foodstores in Lewisham are trading very well,
the figures need to be treated with some caution as it is arguable whether
some of the stores are trading at the levels suggested by the survey.
5.36 It should be noted that these trading level figures exclude the £86.51 million
convenience goods expenditure directed to other facilities in Lewisham such as
local centres, small freestanding convenience stores and other convenience
facilities such as petrol filling stations. This is because no accurate floorspace
data is available for some of these stores and therefore it is difficult to
estimate the benchmark that these stores should achieve. This approach is
consistent with that adopted in the RCASAS 2004. This relatively high level of
convenience goods expenditure attracted to other convenience floorspace is
unsurprising given the high number of freestanding national multiples present in
the Borough such as the Tesco Express stores at Hither Green, Loampit Vale,
Lewisham Way, Forest Hill, Catford and Sydenham, the Marks & Spencer store
on Lee High Road and the Somerfield store in Grove Park amongst other local
facilities. P45/79 11936/679166v2
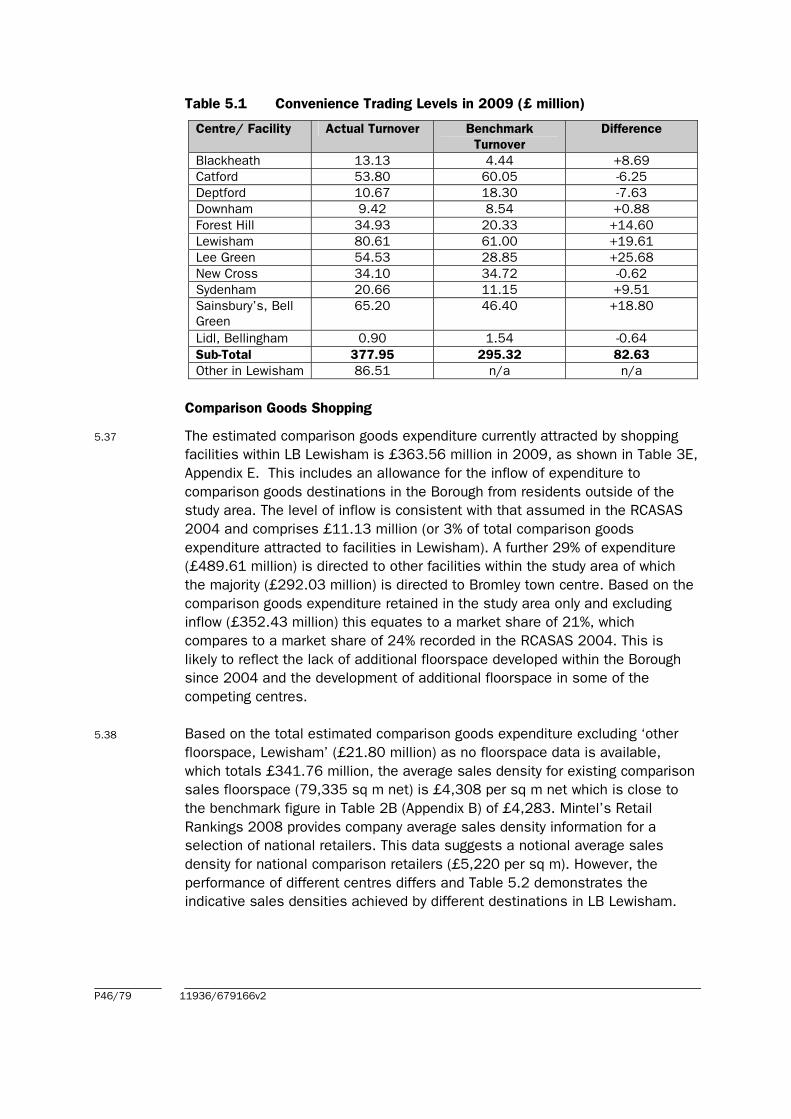
Table 5.1 Convenience Trading Levels in 2009 (£ million)
Centre/ Facility Actual Turnover Benchmark
Turnover
Difference
Blackheath 13.13 4.44 +8.69
Catford 53.80 60.05 -6.25
Deptford 10.67 18.30 -7.63
Downham 9.42 8.54 +0.88
Forest Hill 34.93 20.33 +14.60
Lewisham 80.61 61.00 +19.61
Lee Green 54.53 28.85 +25.68
New Cross 34.10 34.72 -0.62
Sydenham 20.66 11.15 +9.51
Sainsbury’s, Bell
Green
65.20 46.40 +18.80
Lidl, Bellingham 0.90 1.54 -0.64
Sub-Total 377.95 295.32 82.63
Other in Lewisham 86.51 n/a n/a
Comparison Goods Shopping
5.37 The estimated comparison goods expenditure currently attracted by shopping
facilities within LB Lewisham is £363.56 million in 2009, as shown in Table 3E,
Appendix E. This includes an allowance for the inflow of expenditure to
comparison goods destinations in the Borough from residents outside of the
study area. The level of inflow is consistent with that assumed in the RCASAS
2004 and comprises £11.13 million (or 3% of total comparison goods
expenditure attracted to facilities in Lewisham). A further 29% of expenditure
(£489.61 million) is directed to other facilities within the study area of which
the majority (£292.03 million) is directed to Bromley town centre. Based on the
comparison goods expenditure retained in the study area only and excluding
inflow (£352.43 million) this equates to a market share of 21%, which
compares to a market share of 24% recorded in the RCASAS 2004. This is
likely to reflect the lack of additional floorspace developed within the Borough
since 2004 and the development of additional floorspace in some of the
competing centres.
5.38 Based on the total estimated comparison goods expenditure excluding ‘other
floorspace, Lewisham’ (£21.80 million) as no floorspace data is available,
which totals £341.76 million, the average sales density for existing comparison
sales floorspace (79,335 sq m net) is £4,308 per sq m net which is close to
the benchmark figure in Table 2B (Appendix B) of £4,283. Mintel’s Retail
Rankings 2008 provides company average sales density information for a
selection of national retailers. This data suggests a notional average sales
density for national comparison retailers (£5,220 per sq m). However, the
performance of different centres differs and Table 5.2 demonstrates the
indicative sales densities achieved by different destinations in LB Lewisham.
P46/79 11936/679166v2

5.39
5.40
Based on our recent experience across the country average sales densities for
comparison floorspace can range from £2,000 to £7,000 per sq m net. The
higher end of this range is usually only achieved by very successful shopping
centres, which reflects the higher proportion of quality multiple retailers. Table
5.2 indicates that the largest centres in the Borough, Lewisham Town Centre
and Catford Town Centre, achieved the highest turnovers of £6,175 per sq m
net and £6,594 per sq m net respectively reflecting the strength of retail
provision and the presence of key attractor national multiple retailers.
Blackheath, with a sales density of £5,569 per sq m net, also performs well.
The smaller centres in the Borough record much lower sales densities with
Downham Town Centre (£1,623) and Deptford Town Centre (£1,780 per sq m
net) recording the lowest. The sales density of retail warehouse floorspace in
the Borough is also low, at £2,479 per sq m net. We consider that the survey
underestimates the performance of these lower order centres which is not
untypical of the results of household surveys in London. In reality we consider
that these lower order centres are trading at higher levels than those suggested
by the survey.
Table 5.2 Comparison Goods Trading Levels in 2009, (£m)
Centre/ Facility Actual Turnover Net Floorspace
(sqm)
Resulting Turnover
(£ per sq m net)
Blackheath 11.85 2,128 5,569
Catford 56.87 8,625 6,594
Deptford 9.58 5,383 1,780
Downham 2.17 1,337 1,623
Forest Hill 11.88 2,416 4,917
Lewisham 158.06 25,593 6,175
Lee Green 3.87 1,901 2,035
New Cross 5.62 2,227 2,524
Sydenham 19.62 4,614 4,252
Retail Warehouses
in LB Lewisham
62.24 25,111 2,479
Sub-total 341.76 79,335 4,308
Other Facilities in
Lewisham
21.80 n/a n/a
Quantitative Capacity for Additional Convenience Floorspace
The level of available convenience goods expenditure in 2014, 2019 and 2025
is shown at Tables 6D to 8D, in Appendix D. These tables assume existing
2009 market shares will be maintained in the future. The total level of
convenience goods expenditure available for shops in LB Lewisham between
2009 and 2025 is summarised in Table 9D. This table takes into account the
population and expenditure projections shown in Table 1D to 3D in Appendix D.
The benchmark turnover of existing convenience floorspace has been
subtracted from the estimates of available expenditure to provide deficit/
surplus expenditure estimates, as shown in Table 9D, Appendix D.
P47/79 11936/679166v2
5.41 Convenience goods expenditure available to shopping facilities in LB Lewisham
is expected to increase from £464.47 million in 2009 to £591.05 million in
2025.
5.42 The following commitments in LB Lewisham have been taken into account:
• a Lidl foodstore of 1,700 sqm gross/ 1,286 sqm net (1,040 sqm net
convenience goods) at 102- 104 Lee High Road;
• a convenience retail unit of 408 sqm gross/ 286 sqm net permitted at 262-
274 Lewisham High Street;
• the Lewisham Gateway scheme which has outline planning permission for
12,000 sqm gross/ 8,400 sqm net (10% of the approved floorspace is
assumed to comprise convenience floorspace);
• the Loampit Vale redevelopment which includes 1,230 sqm gross/ 861
sqm net Class A1, A2 and B1 floorspace. Given that no further clarification
of the split of floorspace is available and to ensure robustness, for the
purposes of this assessment we have assumed that all of the floorspace
will be used for Class A1 purposes and 30% of this floorspace is assumed
to be convenience floorspace;
• Convoys Wharf which has a resolution to grant planning permission subject
to a Section 106 agreement. This scheme incorporates 6,945 sqm gross/
4,862 sqm net Class A1/ A2 floorspace. For the purposes of this
assessment all of this floorspace is assumed to be Class A1 floorspace
and based on guidance from LB Lewisham we have assumed that 75% of
this floorspace will be used for the sale of convenience goods;
• Catford Greyhound Stadium has outline planning permission for a
predominantly residential scheme which includes 508 sqm gross/ 356 sqm
net A1 floorspace of which 50% is assumed to be convenience floorspace.
5.43 The assumed turnovers of these facilities are set out in Table 3B, Appendix B
and Table 9D, Appendix D. For all of these commitments except for the Lidl
foodstore and Convoys Wharf we have used an indicative sales density of
£7,491 per sqm at 2009. This is the average benchmark sales density of
convenience goods facilities in the Borough derived by dividing the benchmark
turnover of convenience goods facilities (£295.32 million) by the quantum of
floorspace for which they account (39,424 sqm net) as shown in Table 1B,
Appendix B. For Lidl, the convenience goods sales density at 2009 has been
derived from Mintel Retail Rankings (2009) whilst for Convoys Wharf, given the
quantum of convenience floorspace proposed which may be suitable for a
national multiple retailer, an indicative sales density of £11,000 per sqm at
2009 has been used.
P48/79 11936/679166v2
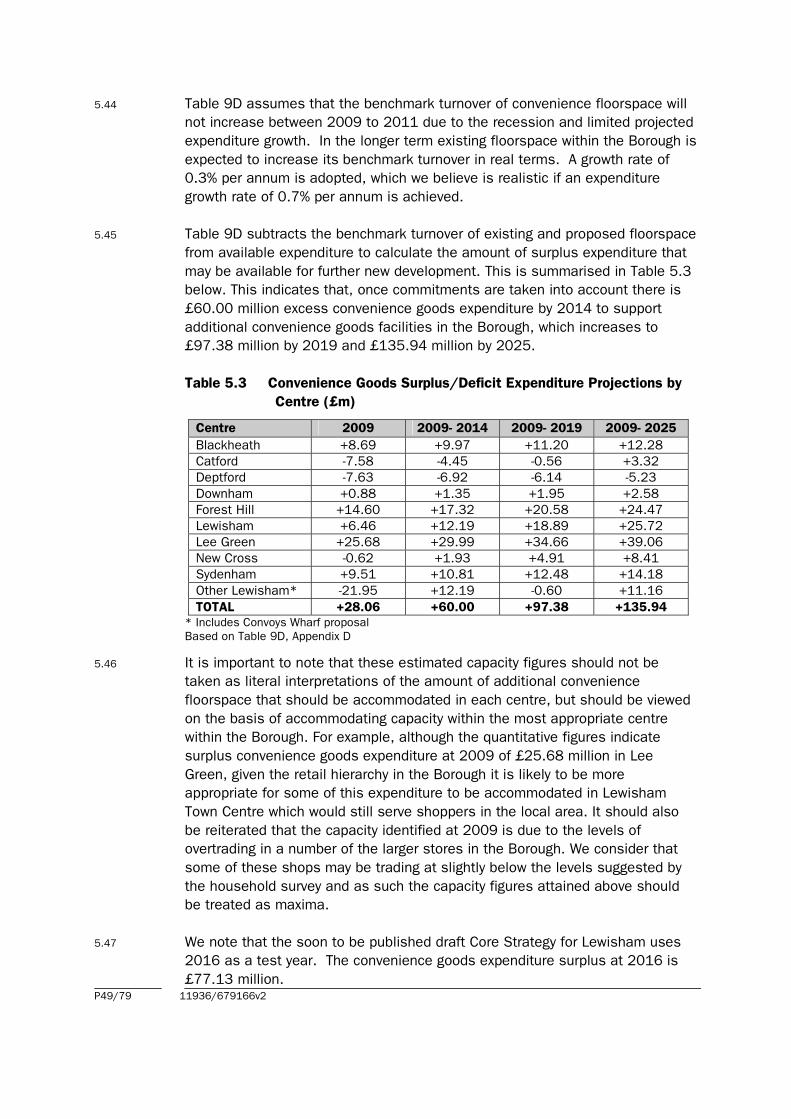
5.44 Table 9D assumes that the benchmark turnover of convenience floorspace will
not increase between 2009 to 2011 due to the recession and limited projected
expenditure growth. In the longer term existing floorspace within the Borough is
expected to increase its benchmark turnover in real terms. A growth rate of
0.3% per annum is adopted, which we believe is realistic if an expenditure
growth rate of 0.7% per annum is achieved.
5.45 Table 9D subtracts the benchmark turnover of existing and proposed floorspace
from available expenditure to calculate the amount of surplus expenditure that
may be available for further new development. This is summarised in Table 5.3
below. This indicates that, once commitments are taken into account there is
£60.00 million excess convenience goods expenditure by 2014 to support
additional convenience goods facilities in the Borough, which increases to
£97.38 million by 2019 and £135.94 million by 2025.
Table 5.3 Convenience Goods Surplus/Deficit Expenditure Projections by
Centre (£m)
Centre 2009 2009- 2014 2009- 2019 2009- 2025
Blackheath +8.69 +9.97 +11.20 +12.28
Catford -7.58 -4.45 -0.56 +3.32
Deptford -7.63 -6.92 -6.14 -5.23
Downham +0.88 +1.35 +1.95 +2.58
Forest Hill +14.60 +17.32 +20.58 +24.47
Lewisham +6.46 +12.19 +18.89 +25.72
Lee Green +25.68 +29.99 +34.66 +39.06
New Cross -0.62 +1.93 +4.91 +8.41
Sydenham +9.51 +10.81 +12.48 +14.18
Other Lewisham* -21.95 +12.19 -0.60 +11.16
TOTAL +28.06 +60.00 +97.38 +135.94
* Includes Convoys Wharf proposal
Based on Table 9D, Appendix D
5.46 It is important to note that these estimated capacity figures should not be
taken as literal interpretations of the amount of additional convenience
floorspace that should be accommodated in each centre, but should be viewed
on the basis of accommodating capacity within the most appropriate centre
within the Borough. For example, although the quantitative figures indicate
surplus convenience goods expenditure at 2009 of £25.68 million in Lee
Green, given the retail hierarchy in the Borough it is likely to be more
appropriate for some of this expenditure to be accommodated in Lewisham
Town Centre which would still serve shoppers in the local area. It should also
be reiterated that the capacity identified at 2009 is due to the levels of
overtrading in a number of the larger stores in the Borough. We consider that
some of these shops may be trading at slightly below the levels suggested by
the household survey and as such the capacity figures attained above should
be treated as maxima.
5.47 We note that the soon to be published draft Core Strategy for Lewisham uses
2016 as a test year. The convenience goods expenditure surplus at 2016 is
£77.13 million. P49/79 11936/679166v2
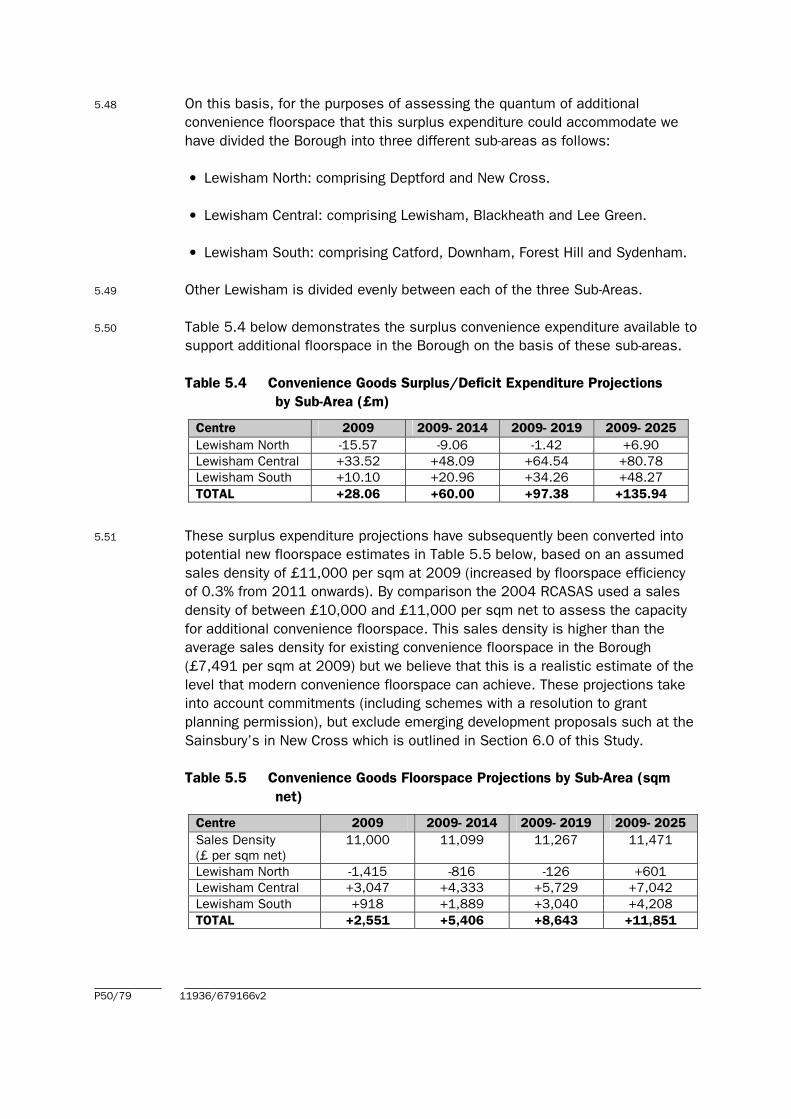
5.51
5.48 On this basis, for the purposes of assessing the quantum of additional
convenience floorspace that this surplus expenditure could accommodate we
have divided the Borough into three different sub-areas as follows:
• Lewisham North: comprising Deptford and New Cross.
• Lewisham Central: comprising Lewisham, Blackheath and Lee Green.
• Lewisham South: comprising Catford, Downham, Forest Hill and Sydenham.
5.49 Other Lewisham is divided evenly between each of the three Sub-Areas.
5.50 Table 5.4 below demonstrates the surplus convenience expenditure available to
support additional floorspace in the Borough on the basis of these sub-areas.
Table 5.4 Convenience Goods Surplus/Deficit Expenditure Projections
by Sub-Area (£m)
Centre 2009 2009- 2014 2009- 2019 2009- 2025
Lewisham North -15.57 -9.06 -1.42 +6.90
Lewisham Central +33.52 +48.09 +64.54 +80.78
Lewisham South +10.10 +20.96 +34.26 +48.27
TOTAL +28.06 +60.00 +97.38 +135.94
These surplus expenditure projections have subsequently been converted into
potential new floorspace estimates in Table 5.5 below, based on an assumed
sales density of £11,000 per sqm at 2009 (increased by floorspace efficiency
of 0.3% from 2011 onwards). By comparison the 2004 RCASAS used a sales
density of between £10,000 and £11,000 per sqm net to assess the capacity
for additional convenience floorspace. This sales density is higher than the
average sales density for existing convenience floorspace in the Borough
(£7,491 per sqm at 2009) but we believe that this is a realistic estimate of the
level that modern convenience floorspace can achieve. These projections take
into account commitments (including schemes with a resolution to grant
planning permission), but exclude emerging development proposals such at the
Sainsbury’s in New Cross which is outlined in Section 6.0 of this Study.
Table 5.5 Convenience Goods Floorspace Projections by Sub-Area (sqm
net)
Centre 2009 2009- 2014 2009- 2019 2009- 2025
Sales Density
(£ per sqm net)
11,000 11,099 11,267 11,471
Lewisham North -1,415 -816 -126 +601
Lewisham Central +3,047 +4,333 +5,729 +7,042
Lewisham South +918 +1,889 +3,040 +4,208
TOTAL +2,551 +5,406 +8,643 +11,851
P50/79 11936/679166v2
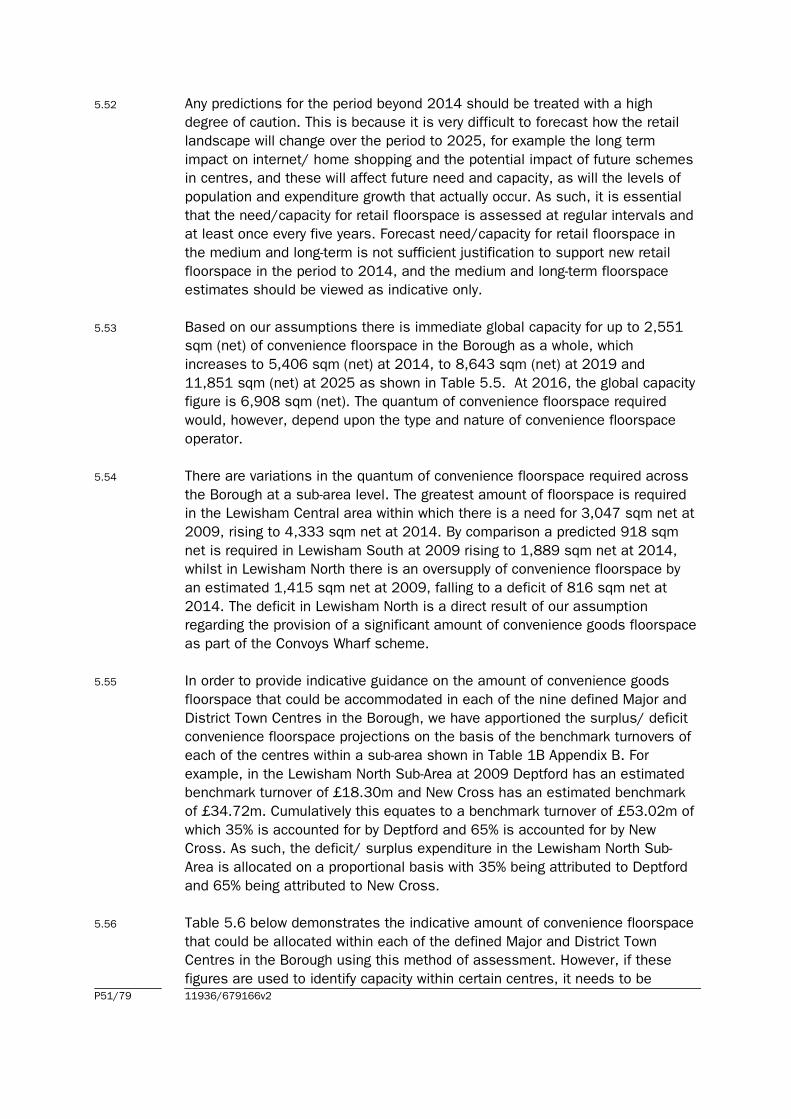
5.52 Any predictions for the period beyond 2014 should be treated with a high
degree of caution. This is because it is very difficult to forecast how the retail
landscape will change over the period to 2025, for example the long term
impact on internet/ home shopping and the potential impact of future schemes
in centres, and these will affect future need and capacity, as will the levels of
population and expenditure growth that actually occur. As such, it is essential
that the need/capacity for retail floorspace is assessed at regular intervals and
at least once every five years. Forecast need/capacity for retail floorspace in
the medium and long-term is not sufficient justification to support new retail
floorspace in the period to 2014, and the medium and long-term floorspace
estimates should be viewed as indicative only.
5.53 Based on our assumptions there is immediate global capacity for up to 2,551
sqm (net) of convenience floorspace in the Borough as a whole, which
increases to 5,406 sqm (net) at 2014, to 8,643 sqm (net) at 2019 and
11,851 sqm (net) at 2025 as shown in Table 5.5. At 2016, the global capacity
figure is 6,908 sqm (net). The quantum of convenience floorspace required
would, however, depend upon the type and nature of convenience floorspace
operator.
5.54 There are variations in the quantum of convenience floorspace required across
the Borough at a sub-area level. The greatest amount of floorspace is required
in the Lewisham Central area within which there is a need for 3,047 sqm net at
2009, rising to 4,333 sqm net at 2014. By comparison a predicted 918 sqm
net is required in Lewisham South at 2009 rising to 1,889 sqm net at 2014,
whilst in Lewisham North there is an oversupply of convenience floorspace by
an estimated 1,415 sqm net at 2009, falling to a deficit of 816 sqm net at
2014. The deficit in Lewisham North is a direct result of our assumption
regarding the provision of a significant amount of convenience goods floorspace
as part of the Convoys Wharf scheme.
5.55 In order to provide indicative guidance on the amount of convenience goods
floorspace that could be accommodated in each of the nine defined Major and
District Town Centres in the Borough, we have apportioned the surplus/ deficit
convenience floorspace projections on the basis of the benchmark turnovers of
each of the centres within a sub-area shown in Table 1B Appendix B. For
example, in the Lewisham North Sub-Area at 2009 Deptford has an estimated
benchmark turnover of £18.30m and New Cross has an estimated benchmark
of £34.72m. Cumulatively this equates to a benchmark turnover of £53.02m of
which 35% is accounted for by Deptford and 65% is accounted for by New
Cross. As such, the deficit/ surplus expenditure in the Lewisham North Sub-
Area is allocated on a proportional basis with 35% being attributed to Deptford
and 65% being attributed to New Cross.
5.56 Table 5.6 below demonstrates the indicative amount of convenience floorspace
that could be allocated within each of the defined Major and District Town
Centres in the Borough using this method of assessment. However, if these
figures are used to identify capacity within certain centres, it needs to be P51/79 11936/679166v2
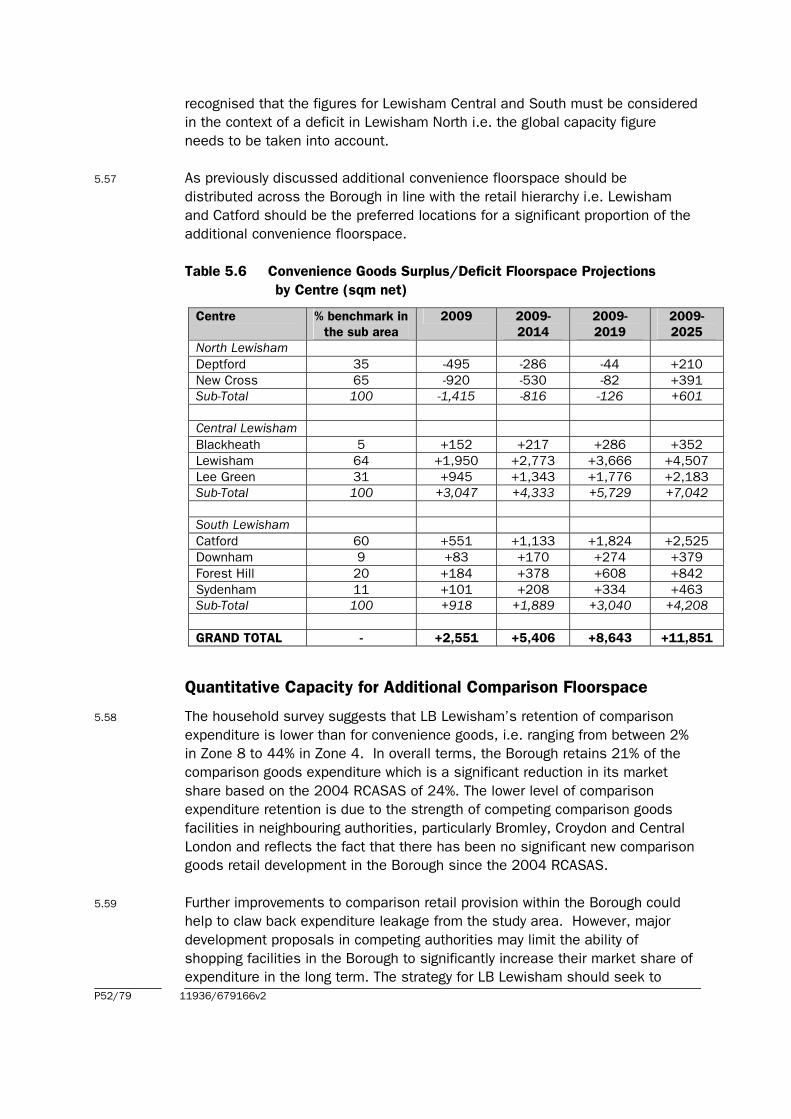
5.57
recognised that the figures for Lewisham Central and South must be considered
in the context of a deficit in Lewisham North i.e. the global capacity figure
needs to be taken into account.
As previously discussed additional convenience floorspace should be
distributed across the Borough in line with the retail hierarchy i.e. Lewisham
and Catford should be the preferred locations for a significant proportion of the
additional convenience floorspace.
Table 5.6 Convenience Goods Surplus/Deficit Floorspace Projections
by Centre (sqm net)
Centre % benchmark in
the sub area
2009 2009-
2014
2009-
2019
2009-
2025
North Lewisham
Deptford 35 -495 -286 -44 +210
New Cross 65 -920 -530 -82 +391
Sub-Total 100 -1,415 -816 -126 +601
Central Lewisham
Blackheath 5 +152 +217 +286 +352
Lewisham 64 +1,950 +2,773 +3,666 +4,507
Lee Green 31 +945 +1,343 +1,776 +2,183
Sub-Total 100 +3,047 +4,333 +5,729 +7,042
South Lewisham
Catford 60 +551 +1,133 +1,824 +2,525
Downham 9 +83 +170 +274 +379
Forest Hill 20 +184 +378 +608 +842
Sydenham 11 +101 +208 +334 +463
Sub-Total 100 +918 +1,889 +3,040 +4,208
GRAND TOTAL - +2,551 +5,406 +8,643 +11,851
Quantitative Capacity for Additional Comparison Floorspace
5.58 The household survey suggests that LB Lewisham’s retention of comparison
expenditure is lower than for convenience goods, i.e. ranging from between 2%
in Zone 8 to 44% in Zone 4. In overall terms, the Borough retains 21% of the
comparison goods expenditure which is a significant reduction in its market
share based on the 2004 RCASAS of 24%. The lower level of comparison
expenditure retention is due to the strength of competing comparison goods
facilities in neighbouring authorities, particularly Bromley, Croydon and Central
London and reflects the fact that there has been no significant new comparison
goods retail development in the Borough since the 2004 RCASAS.
5.59 Further improvements to comparison retail provision within the Borough could
help to claw back expenditure leakage from the study area. However, major
development proposals in competing authorities may limit the ability of
shopping facilities in the Borough to significantly increase their market share of
expenditure in the long term. The strategy for LB Lewisham should seek to
P52/79 11936/679166v2
increase its market share in the face of increasing future competition and in
view of its objective in achieving Metropolitan Centre status for Lewisham Town
Centre.
5.60 The retail capacity projections in this report assume as a starting point that LB
Lewisham will maintain its market share of comparison expenditure in the
future. Available comparison goods expenditure has been projected forward to
2014, 2019 and 2025 based on 2009 penetration rates in Tables 4E to 6E in
Appendix E, and summarised in Table 7E. Available comparison expenditure for
facilities in LB Lewisham is expected to increase from £363.56 million in 2009
to £787.38 million in 2025.
5.61 The growth in comparison goods expenditure available for shops in the Borough
between 2009 and 2025 is summarised in Table 7E, in Appendix E. Future
available expenditure is compared with the projected turnover of existing and
proposed comparison retail facilities within the Borough in order to provide
estimates of surplus expenditure, as shown in Table 7E. Committed/ proposed
comparison retail developments are also taken into consideration and taken off
the need for additional comparison goods floorspace over the period. In this
regard we have taken into consideration the following commitments:
• the Lewisham Gateway scheme which has outline planning permission for
12,000 sqm gross/ 8,400 sqm net;
• the Loampit Vale redevelopment which includes 1,230 sqm gross/ 861
sqm net Class A1, A2 and B1 floorspace. Given that no further clarification
of the split of floorspace is available and to ensure robustness, for the
purposes of this assessment we have assumed that all of the floorspace
will be used for Class A1 purposes and have assumed that 70% of this
floorspace will be used for the sale of comparison goods;
• retail warehousing at the Thurston Road Industrial Estate which comprises
6,771 sqm gross/ 5,417 sqm net floorspace;
• retail units at 36-56 Lee High Road, Lewisham which will occupy 922 sqm
gross/ 645 sqm net floorspace;
• the comparison goods element of the Lidl foodstore at 102- 104 Lee High
Road, Lewisham, which we estimate will comprise 246 sqm net;
• Convoys Wharf which has a resolution to grant planning permission subject
to a Section 106 agreement. This scheme incorporates 6,945 sqm gross/
4,862 sqm net Class A1/ A2 floorspace. For the purposes of this
assessment all of this floorspace is assumed to be Class A1 floorspace
and based on guidance from LB Lewisham, 25% of the floorspace will be
used for the sale of comparison goods;
P53/79 11936/679166v2
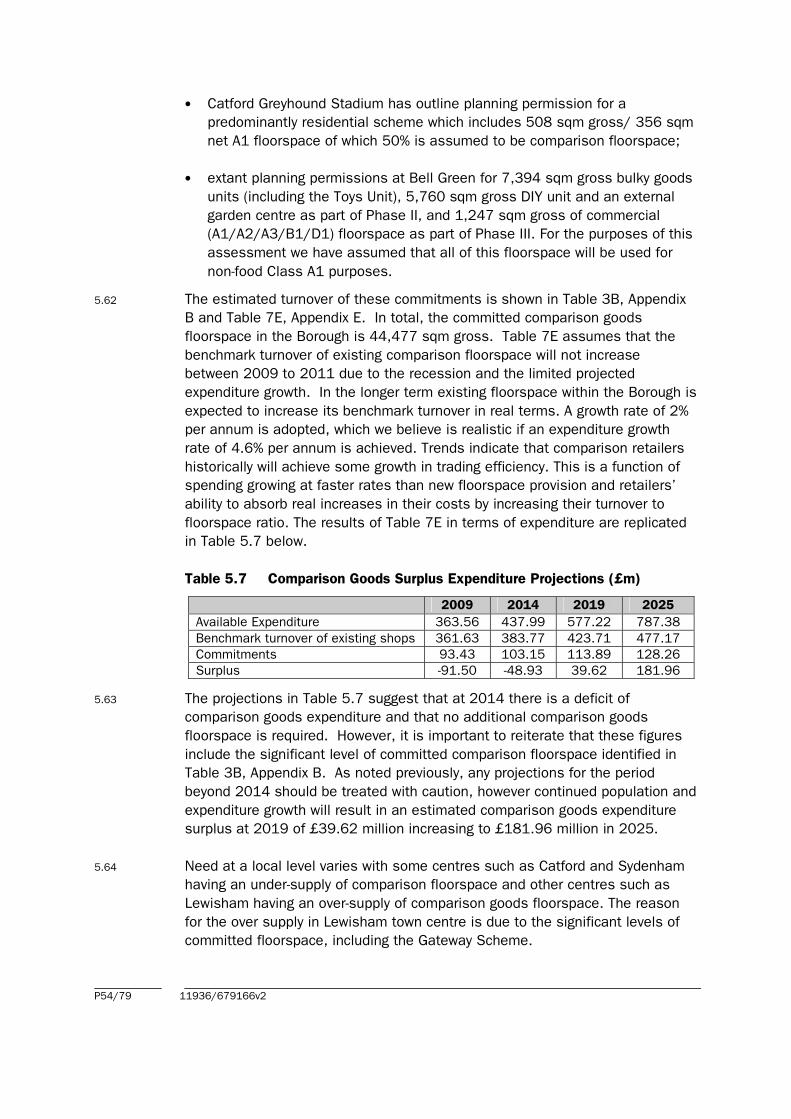
5.62
• Catford Greyhound Stadium has outline planning permission for a
predominantly residential scheme which includes 508 sqm gross/ 356 sqm
net A1 floorspace of which 50% is assumed to be comparison floorspace;
• extant planning permissions at Bell Green for 7,394 sqm gross bulky goods
units (including the Toys Unit), 5,760 sqm gross DIY unit and an external
garden centre as part of Phase II, and 1,247 sqm gross of commercial
(A1/A2/A3/B1/D1) floorspace as part of Phase III. For the purposes of this
assessment we have assumed that all of this floorspace will be used for
non-food Class A1 purposes.
The estimated turnover of these commitments is shown in Table 3B, Appendix
B and Table 7E, Appendix E. In total, the committed comparison goods
floorspace in the Borough is 44,477 sqm gross. Table 7E assumes that the
benchmark turnover of existing comparison floorspace will not increase
between 2009 to 2011 due to the recession and the limited projected
expenditure growth. In the longer term existing floorspace within the Borough is
expected to increase its benchmark turnover in real terms. A growth rate of 2%
per annum is adopted, which we believe is realistic if an expenditure growth
rate of 4.6% per annum is achieved. Trends indicate that comparison retailers
historically will achieve some growth in trading efficiency. This is a function of
spending growing at faster rates than new floorspace provision and retailers’
ability to absorb real increases in their costs by increasing their turnover to
floorspace ratio. The results of Table 7E in terms of expenditure are replicated
in Table 5.7 below.
Table 5.7 Comparison Goods Surplus Expenditure Projections (£m)
2009 2014 2019 2025
Available Expenditure 363.56 437.99 577.22 787.38
Benchmark turnover of existing shops 361.63 383.77 423.71 477.17
Commitments 93.43 103.15 113.89 128.26
Surplus -91.50 -48.93 39.62 181.96
5.63 The projections in Table 5.7 suggest that at 2014 there is a deficit of
comparison goods expenditure and that no additional comparison goods
floorspace is required. However, it is important to reiterate that these figures
include the significant level of committed comparison floorspace identified in
Table 3B, Appendix B. As noted previously, any projections for the period
beyond 2014 should be treated with caution, however continued population and
expenditure growth will result in an estimated comparison goods expenditure
surplus at 2019 of £39.62 million increasing to £181.96 million in 2025.
5.64 Need at a local level varies with some centres such as Catford and Sydenham
having an under-supply of comparison floorspace and other centres such as
Lewisham having an over-supply of comparison goods floorspace. The reason
for the over supply in Lewisham town centre is due to the significant levels of
committed floorspace, including the Gateway Scheme.
P54/79 11936/679166v2
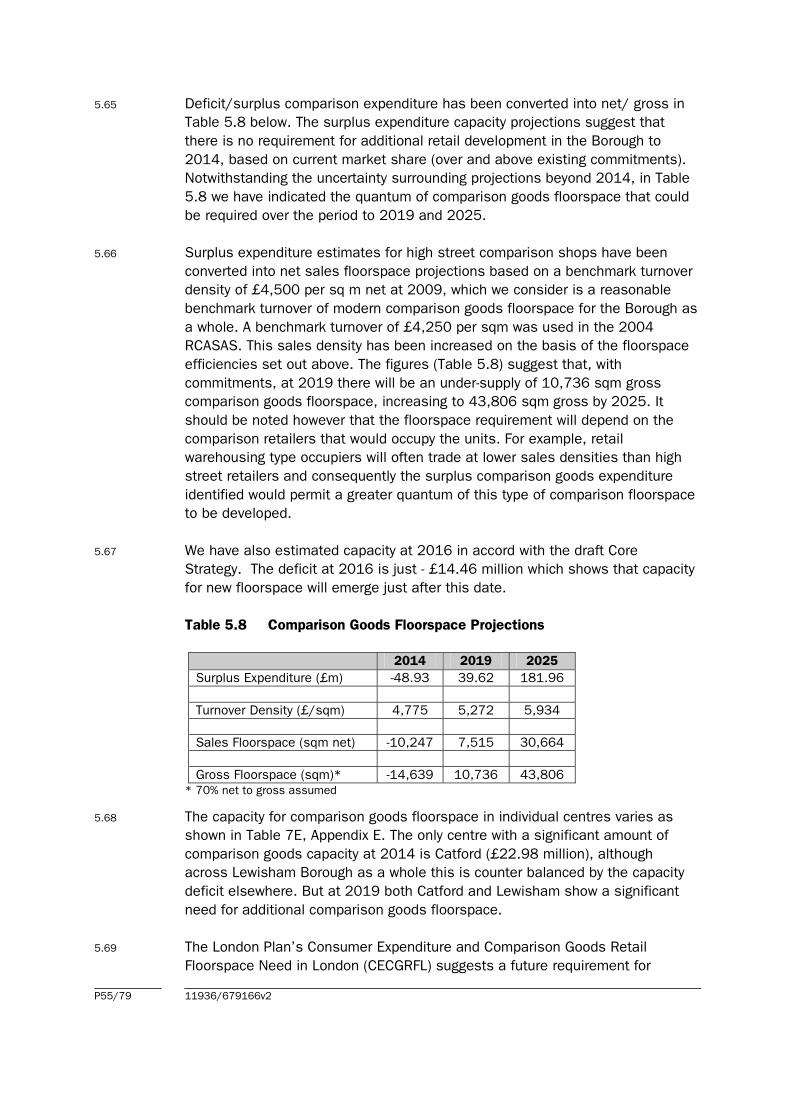
5.65 Deficit/surplus comparison expenditure has been converted into net/ gross in
Table 5.8 below. The surplus expenditure capacity projections suggest that
there is no requirement for additional retail development in the Borough to
2014, based on current market share (over and above existing commitments).
Notwithstanding the uncertainty surrounding projections beyond 2014, in Table
5.8 we have indicated the quantum of comparison goods floorspace that could
be required over the period to 2019 and 2025.
5.66 Surplus expenditure estimates for high street comparison shops have been
converted into net sales floorspace projections based on a benchmark turnover
density of £4,500 per sq m net at 2009, which we consider is a reasonable
benchmark turnover of modern comparison goods floorspace for the Borough as
a whole. A benchmark turnover of £4,250 per sqm was used in the 2004
RCASAS. This sales density has been increased on the basis of the floorspace
efficiencies set out above. The figures (Table 5.8) suggest that, with
commitments, at 2019 there will be an under-supply of 10,736 sqm gross
comparison goods floorspace, increasing to 43,806 sqm gross by 2025. It
should be noted however that the floorspace requirement will depend on the
comparison retailers that would occupy the units. For example, retail
warehousing type occupiers will often trade at lower sales densities than high
street retailers and consequently the surplus comparison goods expenditure
identified would permit a greater quantum of this type of comparison floorspace
to be developed.
5.67 We have also estimated capacity at 2016 in accord with the draft Core
Strategy. The deficit at 2016 is just - £14.46 million which shows that capacity
for new floorspace will emerge just after this date.
Table 5.8 Comparison Goods Floorspace Projections
2014 2019 2025
Surplus Expenditure (£m) -48.93 39.62 181.96
Turnover Density (£/sqm) 4,775 5,272 5,934
Sales Floorspace (sqm net) -10,247 7,515 30,664
Gross Floorspace (sqm)* -14,639 10,736 43,806
* 70% net to gross assumed
5.68 The capacity for comparison goods floorspace in individual centres varies as
shown in Table 7E, Appendix E. The only centre with a significant amount of
comparison goods capacity at 2014 is Catford (£22.98 million), although
across Lewisham Borough as a whole this is counter balanced by the capacity
deficit elsewhere. But at 2019 both Catford and Lewisham show a significant
need for additional comparison goods floorspace.
5.69 The London Plan’s Consumer Expenditure and Comparison Goods Retail
Floorspace Need in London (CECGRFL) suggests a future requirement for
P55/79 11936/679166v2

comparison retail floorspace of between 4,675 to 19,029 sq m gross in LB of
Lewisham by 2016. This is based on differing productivity growth rates of
2.80% and 1.50% respectively (in comparison this Study has used an assumed
productively growth rate of 0% to 2011 and 2.0% beyond 2011). The CECGRFL
projection for 2021 is between 13,211 to 37,253 sq m gross and for 2026
between 21,343 and 36,551 sq m gross is anticipated to be required.
5.70 The CECGRFL projections take into account major retail developments that are
either committed, approved or proposed in the short to medium term, however
it is unclear when Experian have assumed the retail developments will come
forward. Our capacity assessment, including commitments but not proposals,
identifies a surplus of £39.62 million at 2019. On a basis of a sales density of
£4,500 per sqm at 2009, this equates to a requirement for some 10,736 sqm
gross comparison floorspace at 2019. This is slightly lower than the minimum
requirement of 13,211 sqm gross recorded by Experian at 2021. On this basis
NLP’s projections are considered to be broadly consistent with the lower end of
the range suggested within the CECGRFL.
Scope for Additional Comparison Floorspace with increased
retention for Lewisham Town Centre
5.71 The household survey identifies that significant levels of comparison
expenditure originating within the study area is currently being spent beyond the
Borough boundary and of concern is the fact that this level of outflow has
increased since the 2004 RCASAS. Although, given the proximity of the major
centres of Bromley and Croydon as well as Bluewater and the West End a
significant level of outflow is to be expected.
5.72 Notwithstanding this, in view of the aim within planning policy for shopping
requirements to be met by reducing the need to travel, as well as for Lewisham
town centre to establish itself as a Metropolitan Centre within the retail
hierarchy, we have undertaken a sensitivity test which assumes that the town
centre increases its market share within the study area by reducing the level of
outflow.
5.73 In the event that this level of claw back is achieved, it would be because in the
period to 2014, additional floorspace within Lewisham town centre would be
brought forward of sufficient quantum and of a sufficiently higher order nature
to increase the attractiveness of the centre relative to other centres such as
Bromley and Croydon. If all the committed developments come forward, this
would significantly improve the retail offer of the Borough and is likely to have a
resultant increase in the market share achieved by destinations within it.
5.74 We emphasise however, that this is against a background where there are a
number of retail commitments and proposals beyond the study area (eg. the
recently developed Tesco foodstore in Orpington and the redevelopment
commitments/ proposals for Stratford, Surrey Quays, Woolwich and the
P56/79 11936/679166v2
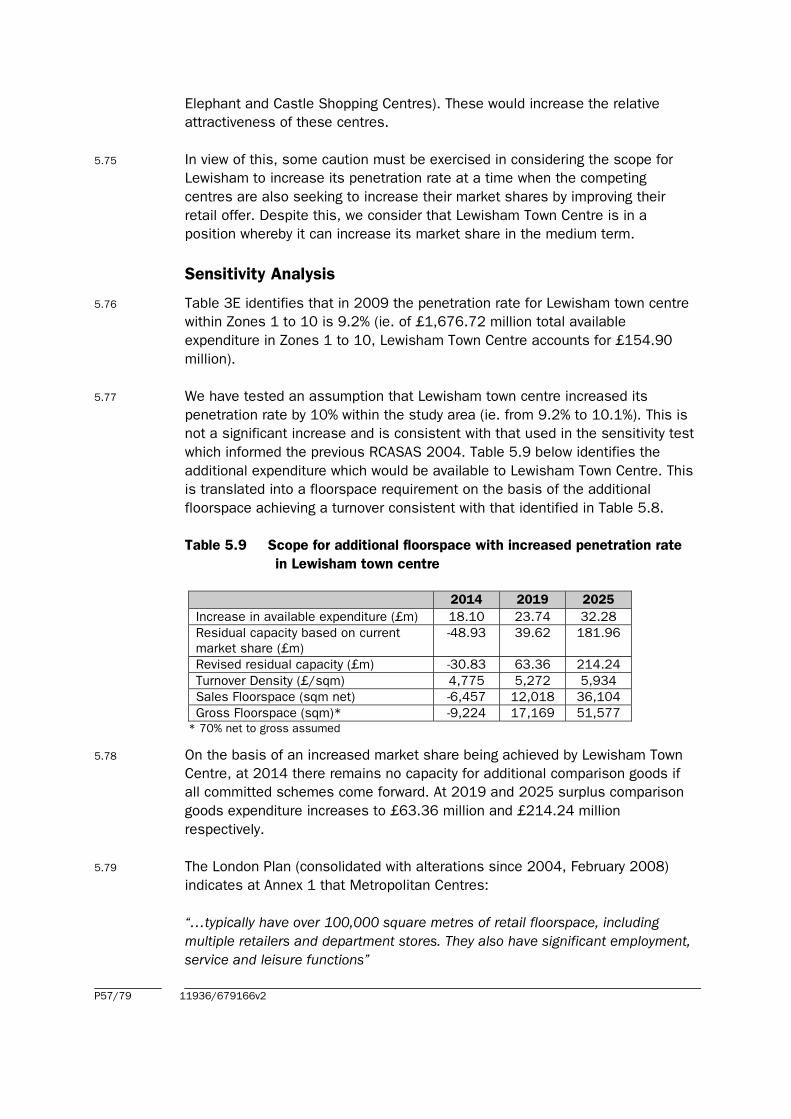
Elephant and Castle Shopping Centres). These would increase the relative
attractiveness of these centres.
5.75 In view of this, some caution must be exercised in considering the scope for
Lewisham to increase its penetration rate at a time when the competing
centres are also seeking to increase their market shares by improving their
retail offer. Despite this, we consider that Lewisham Town Centre is in a
position whereby it can increase its market share in the medium term.
Sensitivity Analysis
5.76 Table 3E identifies that in 2009 the penetration rate for Lewisham town centre
within Zones 1 to 10 is 9.2% (ie. of £1,676.72 million total available
expenditure in Zones 1 to 10, Lewisham Town Centre accounts for £154.90
million).
5.77 We have tested an assumption that Lewisham town centre increased its
penetration rate by 10% within the study area (ie. from 9.2% to 10.1%). This is
not a significant increase and is consistent with that used in the sensitivity test
which informed the previous RCASAS 2004. Table 5.9 below identifies the
additional expenditure which would be available to Lewisham Town Centre. This
is translated into a floorspace requirement on the basis of the additional
floorspace achieving a turnover consistent with that identified in Table 5.8.
Table 5.9 Scope for additional floorspace with increased penetration rate
in Lewisham town centre
2014 2019 2025
Increase in available expenditure (£m) 18.10 23.74 32.28
Residual capacity based on current
market share (£m)
-48.93 39.62 181.96
Revised residual capacity (£m) -30.83 63.36 214.24
Turnover Density (£/sqm) 4,775 5,272 5,934
Sales Floorspace (sqm net) -6,457 12,018 36,104
Gross Floorspace (sqm)* -9,224 17,169 51,577
* 70% net to gross assumed
5.78 On the basis of an increased market share being achieved by Lewisham Town
Centre, at 2014 there remains no capacity for additional comparison goods if
all committed schemes come forward. At 2019 and 2025 surplus comparison
goods expenditure increases to £63.36 million and £214.24 million
respectively.
5.79 The London Plan (consolidated with alterations since 2004, February 2008)
indicates at Annex 1 that Metropolitan Centres:
“…typically have over 100,000 square metres of retail floorspace, including
multiple retailers and department stores. They also have significant employment,
service and leisure functions”
P57/79 11936/679166v2
Annex 1, para 3
5.80 It should be noted that the London Plan does not define what constitutes ‘retail
floorspace’, although following discussions with LBL officers, we understand
that this refers to all floorspace in Class A use as well as any vacant retail or
service floorspace. Although the London Plan recognises the characteristics of
Metropolitan Centres as outlined above, it does not specify requirements which
should be fulfilled in order for a centre to qualify for such status.
5.81 Based on the quantum of floorspace in Class A use present in Lewisham Town
Centre according to the latest Goad Town Centre Survey (updated by NLP), and
including vacant retail and service floorspace, the centre contains
approximately 80,000 sqm gross retail/service floorspace. The level of
floorspace requirement at 2019, if converted into floorspace using a sales
density of £4,500 per sqm at 2009, when considered in conjunction with the
existing Lewisham Gateway commitment (12,000 sqm gross) and the other
convenience and comparison floorspace commitments in Lewisham Town
Centre, would be enough for the centre to qualify for Metropolitan Centre status
i.e. it would contribute more than the additional 20,000 sqm required.
However, this will be dependent upon the Gateway scheme being implemented
together with new schemes to accommodate the capacity indentified.
Notwithstanding this, some of the identified capacity for additional floorspace
could be accommodated in existing vacant floorspace which is included in the
total retail floorspace figure for Lewisham Town Centre previously quoted.
5.82 It should also be recognised that the indicative floorspace requirement of a
Metropolitan Centre, outlined in Annex 1 of the London Plan, could be revised
by the time the Town Centre reaches the current threshold.
Qualitative Need
Socio-Economic Characteristics within Lewisham
5.83 Shopping needs may vary considerably, often related to socio-economic
characteristics. For example, residents without access to a car or those on low
incomes will have different needs to those who are mobile by car or who enjoy
higher income. Lower income groups without access to a car may be less able
to travel to shopping facilities and may also be socially excluded from high
priced shops, therefore, the availability of discount or value retail facilities may
be important for these groups. The socio-economic characteristics of the LB
Lewisham have been examined and compared with the county and national
averages.
5.84 Car ownership in LB Lewisham (57.3% of households) is below the average for
London (62.6%) and significantly below the UK average (73.2%), as shown in
Table 5.10, which partly reflects the location of the Borough and the good
public transport network. However, it is above the average for Inner London. The
proportion of households with two or more cars in LB Lewisham is similar to the
P58/79 11936/679166v2
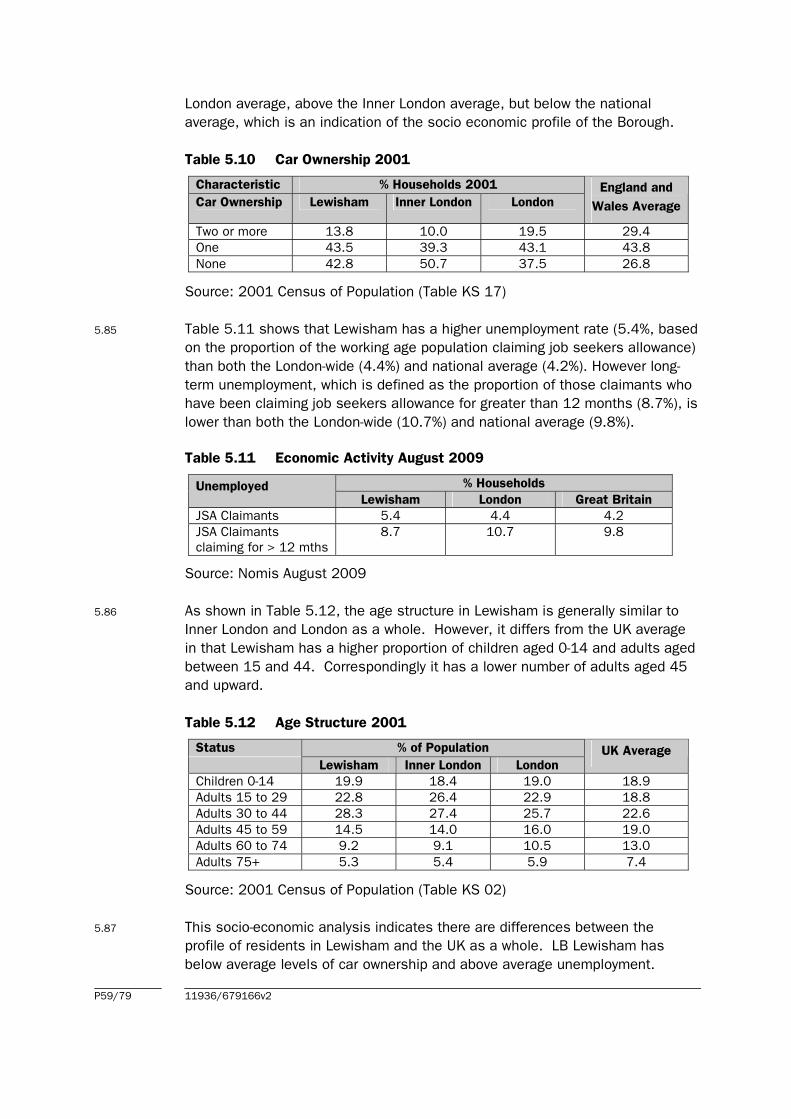
5.85
5.86
London average, above the Inner London average, but below the national
average, which is an indication of the socio economic profile of the Borough.
Table 5.10 Car Ownership 2001
Characteristic % Households 2001 England and
Wales Average Car Ownership Lewisham Inner London London
Two or more 13.8 10.0 19.5 29.4
One 43.5 39.3 43.1 43.8
None 42.8 50.7 37.5 26.8
Source: 2001 Census of Population (Table KS 17)
Table 5.11 shows that Lewisham has a higher unemployment rate (5.4%, based
on the proportion of the working age population claiming job seekers allowance)
than both the London-wide (4.4%) and national average (4.2%). However long-
term unemployment, which is defined as the proportion of those claimants who
have been claiming job seekers allowance for greater than 12 months (8.7%), is
lower than both the London-wide (10.7%) and national average (9.8%).
Table 5.11 Economic Activity August 2009
Unemployed % Households
Lewisham London Great Britain
JSA Claimants 5.4 4.4 4.2
JSA Claimants
claiming for > 12 mths
8.7 10.7 9.8
Source: Nomis August 2009
As shown in Table 5.12, the age structure in Lewisham is generally similar to
Inner London and London as a whole. However, it differs from the UK average
in that Lewisham has a higher proportion of children aged 0-14 and adults aged
between 15 and 44. Correspondingly it has a lower number of adults aged 45
and upward.
Table 5.12 Age Structure 2001
Status % of Population UK Average Lewisham Inner London London
Children 0-14 19.9 18.4 19.0 18.9
Adults 15 to 29 22.8 26.4 22.9 18.8
Adults 30 to 44 28.3 27.4 25.7 22.6
Adults 45 to 59 14.5 14.0 16.0 19.0
Adults 60 to 74 9.2 9.1 10.5 13.0
Adults 75+ 5.3 5.4 5.9 7.4
Source: 2001 Census of Population (Table KS 02)
5.87 This socio-economic analysis indicates there are differences between the
profile of residents in Lewisham and the UK as a whole. LB Lewisham has
below average levels of car ownership and above average unemployment.
P59/79 11936/679166v2
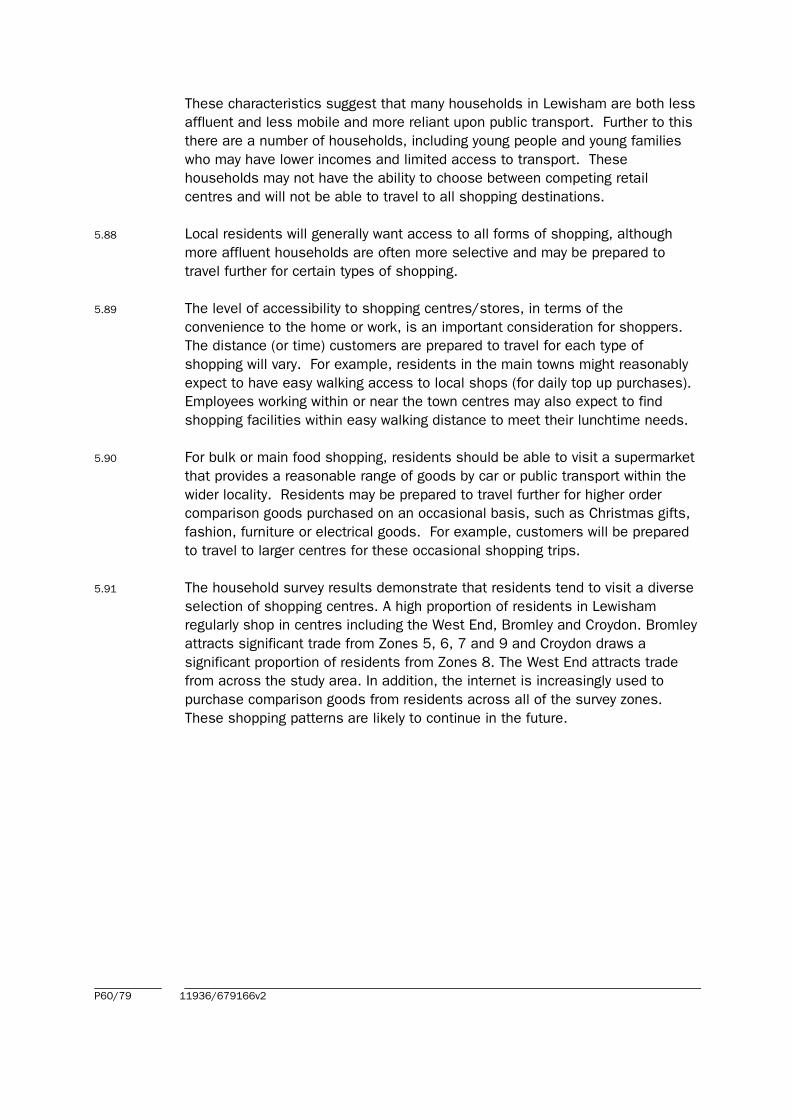
These characteristics suggest that many households in Lewisham are both less
affluent and less mobile and more reliant upon public transport. Further to this
there are a number of households, including young people and young families
who may have lower incomes and limited access to transport. These
households may not have the ability to choose between competing retail
centres and will not be able to travel to all shopping destinations.
5.88 Local residents will generally want access to all forms of shopping, although
more affluent households are often more selective and may be prepared to
travel further for certain types of shopping.
5.89 The level of accessibility to shopping centres/stores, in terms of the
convenience to the home or work, is an important consideration for shoppers.
The distance (or time) customers are prepared to travel for each type of
shopping will vary. For example, residents in the main towns might reasonably
expect to have easy walking access to local shops (for daily top up purchases).
Employees working within or near the town centres may also expect to find
shopping facilities within easy walking distance to meet their lunchtime needs.
5.90 For bulk or main food shopping, residents should be able to visit a supermarket
that provides a reasonable range of goods by car or public transport within the
wider locality. Residents may be prepared to travel further for higher order
comparison goods purchased on an occasional basis, such as Christmas gifts,
fashion, furniture or electrical goods. For example, customers will be prepared
to travel to larger centres for these occasional shopping trips.
5.91 The household survey results demonstrate that residents tend to visit a diverse
selection of shopping centres. A high proportion of residents in Lewisham
regularly shop in centres including the West End, Bromley and Croydon. Bromley
attracts significant trade from Zones 5, 6, 7 and 9 and Croydon draws a
significant proportion of residents from Zones 8. The West End attracts trade
from across the study area. In addition, the internet is increasingly used to
purchase comparison goods from residents across all of the survey zones.
These shopping patterns are likely to continue in the future.
P60/79 11936/679166v2
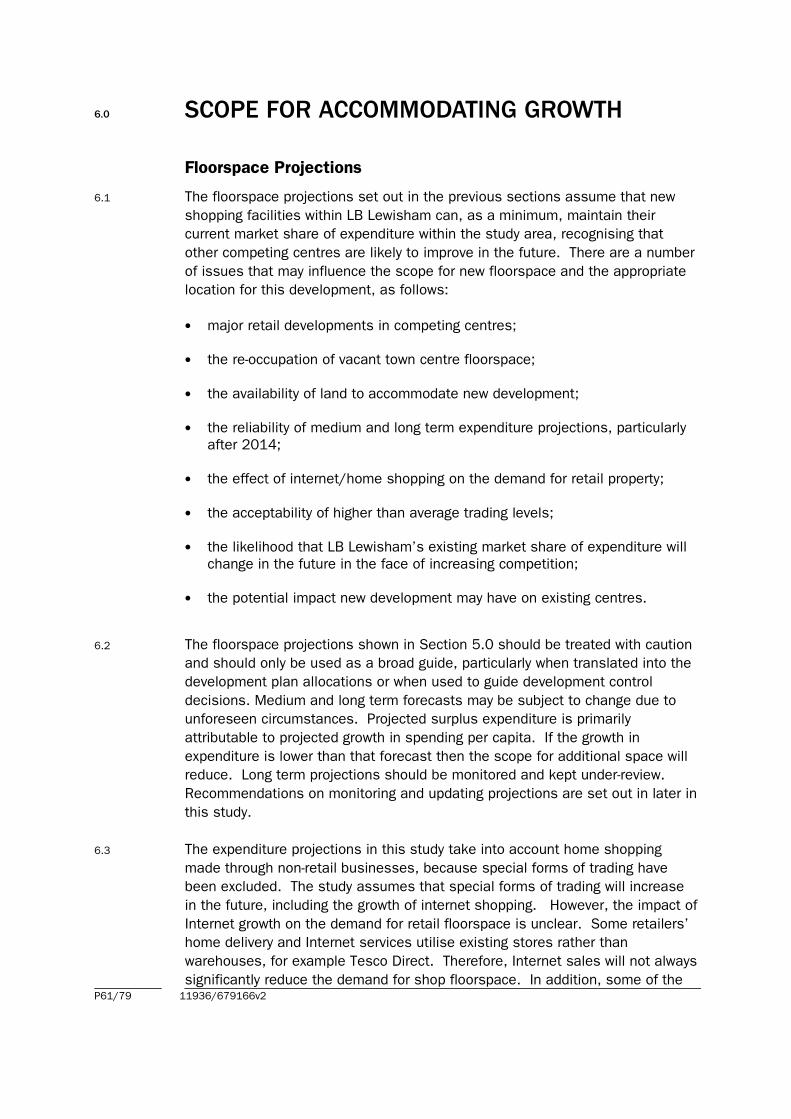
6.0 SCOPE FOR ACCOMMODATING GROWTH
Floorspace Projections
6.1 The floorspace projections set out in the previous sections assume that new
shopping facilities within LB Lewisham can, as a minimum, maintain their
current market share of expenditure within the study area, recognising that
other competing centres are likely to improve in the future. There are a number
of issues that may influence the scope for new floorspace and the appropriate
location for this development, as follows:
• major retail developments in competing centres;
• the re-occupation of vacant town centre floorspace;
• the availability of land to accommodate new development;
• the reliability of medium and long term expenditure projections, particularly
after 2014;
• the effect of internet/home shopping on the demand for retail property;
• the acceptability of higher than average trading levels;
• the likelihood that LB Lewisham’s existing market share of expenditure will
change in the future in the face of increasing competition;
• the potential impact new development may have on existing centres.
6.2 The floorspace projections shown in Section 5.0 should be treated with caution
and should only be used as a broad guide, particularly when translated into the
development plan allocations or when used to guide development control
decisions. Medium and long term forecasts may be subject to change due to
unforeseen circumstances. Projected surplus expenditure is primarily
attributable to projected growth in spending per capita. If the growth in
expenditure is lower than that forecast then the scope for additional space will
reduce. Long term projections should be monitored and kept under-review.
Recommendations on monitoring and updating projections are set out in later in
this study.
6.3 The expenditure projections in this study take into account home shopping
made through non-retail businesses, because special forms of trading have
been excluded. The study assumes that special forms of trading will increase
in the future, including the growth of internet shopping. However, the impact of
Internet growth on the demand for retail floorspace is unclear. Some retailers’
home delivery and Internet services utilise existing stores rather than
warehouses, for example Tesco Direct. Therefore, Internet sales will not always
significantly reduce the demand for shop floorspace. In addition, some of the P61/79 11936/679166v2
growth in Internet sales may divert trade away from mail order companies rather
than retail operators. Overall the long term impact of home shopping on
expenditure projections is uncertain.
6.4 The quantitative and qualitative assessment of the potential capacity for new
retail floorspace within the previous sections suggests that there is scope for
new retail development within LB Lewisham, over and above existing
commitments, although this is after 2014 for comparison goods floorspace.
This section examines the opportunities for accommodating this projected
growth and assesses potential opportunities to accommodate this floorspace.
Accommodating Future Growth
6.5 The sequential approach suggests that designated town centres should be the
first choice for retail and leisure development. In considering this important
issue the following factors should be assessed.
• What is the locational area of need the development seeks to serve and
what existing centre could potentially fulfil the identified area of need?
• Is the nature and scale of development likely to serve a wide catchment
area?
• Is a site available in one of the designated centres, including vacant
premises and will this site meet the identified need?
• If the development has a more localised catchment area, is a site available
in a local centre and will this site meet the identified need?
6.6 Some forms of retail or leisure facilities, which serve more localised catchment
areas, may be more appropriate within local centres, rather than the main
centres. However, all development should be appropriate in terms of scale and
nature to the centre in which it is located.
6.7 The existing stock of premises may have a role to play in accommodating
projected growth. The retail capacity analysis in this report assumes that
existing retail floorspace can, on average, increase its turnover to sales
floorspace densities. A growth rate of 2% per annum is assumed for
comparison floorspace after 2011 and 0.3% per annum for convenience
floorspace after 2011. The adoption of these growth rates represents a
balanced approach. The floorspace projections reflect these assumptions. In
addition to the growth in sales densities, vacant shops could help to
accommodate future growth.
P62/79 11936/679166v2
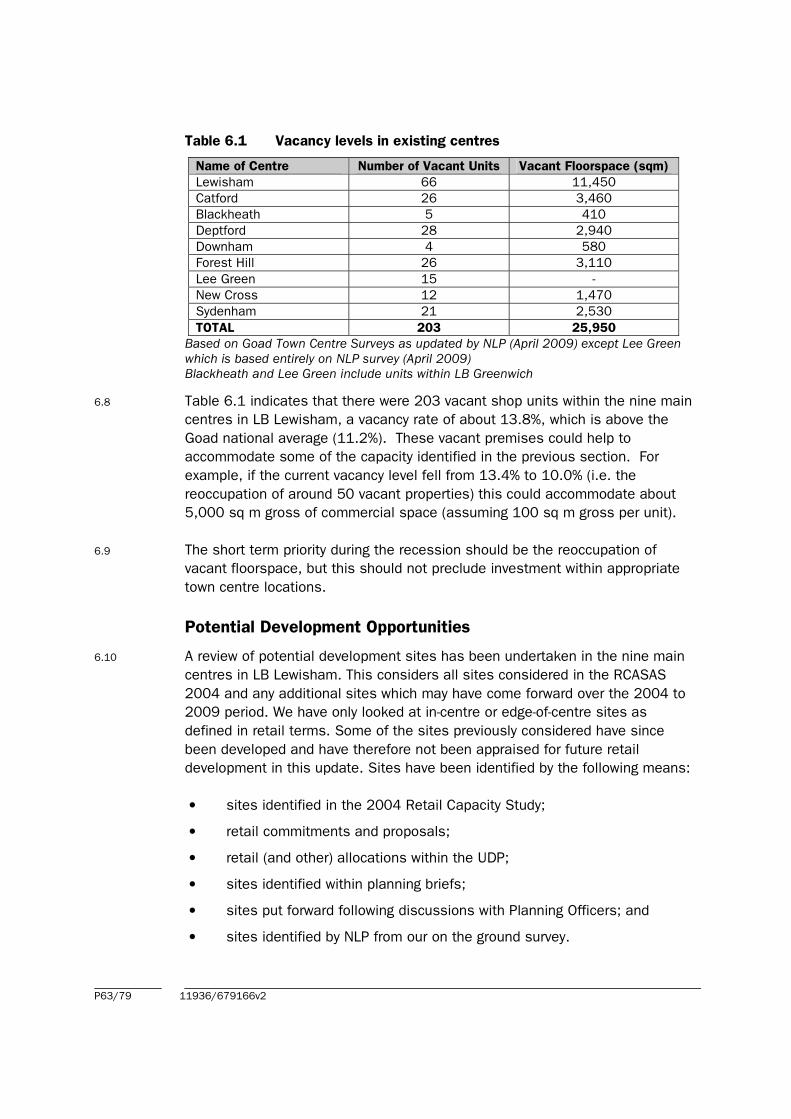
Table 6.1 Vacancy levels in existing centres
Name of Centre Number of Vacant Units Vacant Floorspace (sqm)
Lewisham 66 11,450
Catford 26 3,460
Blackheath 5 410
Deptford 28 2,940
Downham 4 580
Forest Hill 26 3,110
Lee Green 15 -
New Cross 12 1,470
Sydenham 21 2,530
TOTAL 203 25,950
Based on Goad Town Centre Surveys as updated by NLP (April 2009) except Lee Green
which is based entirely on NLP survey (April 2009)
Blackheath and Lee Green include units within LB Greenwich
6.8 Table 6.1 indicates that there were 203 vacant shop units within the nine main
centres in LB Lewisham, a vacancy rate of about 13.8%, which is above the
Goad national average (11.2%). These vacant premises could help to
accommodate some of the capacity identified in the previous section. For
example, if the current vacancy level fell from 13.4% to 10.0% (i.e. the
reoccupation of around 50 vacant properties) this could accommodate about
5,000 sq m gross of commercial space (assuming 100 sq m gross per unit).
6.9 The short term priority during the recession should be the reoccupation of
vacant floorspace, but this should not preclude investment within appropriate
town centre locations.
Potential Development Opportunities
6.10 A review of potential development sites has been undertaken in the nine main
centres in LB Lewisham. This considers all sites considered in the RCASAS
2004 and any additional sites which may have come forward over the 2004 to
2009 period. We have only looked at in-centre or edge-of-centre sites as
defined in retail terms. Some of the sites previously considered have since
been developed and have therefore not been appraised for future retail
development in this update. Sites have been identified by the following means:
• sites identified in the 2004 Retail Capacity Study;
• retail commitments and proposals;
• retail (and other) allocations within the UDP;
• sites identified within planning briefs;
• sites put forward following discussions with Planning Officers; and
• sites identified by NLP from our on the ground survey.
P63/79 11936/679166v2
6.11 The search identified a total of 59 sites within the Borough of these, 19 were in
Lewisham, 12 in Catford, 8 in Forest Hill, 6 in New Cross, 5 in Deptford, 3 in
Sydenham and 2 each in Downham, Blackheath and Lee Green.
6.12 We subsequently undertook an initial sieving process. This excluded sites
which we do not consider form viable or appropriate retail locations. The
reasons for sites being excluded were sites:
• not available for development (i.e. either not likely to come forward as
subsequently developed or allocated for other uses);
• not well located to the existing retail area; and/or
• constraints in site location, size, topography or ownership which was
likely to constrain development.
6.13 We have also excluded sites which are of limited size or if redeveloped are
unlikely to lead to a significant net increase in retail floorspace.
6.14 As a result of this analysis 45 of the initially identified sites have been
discounted. The remaining 14 sites have been evaluated, in terms of their
implications on the scope and need for additional retail facilities in the
authority, and have been assessed against the following factors:
• existing land uses and availability, categorised as follows:
� short to medium term – up to 2016;
� long term - likely to be completed after 2016;
• commercial potential for retail development and the most likely form of
development, categorised as follows:
� prime site - likely to attract a developer and occupiers;
� secondary site – which may generate limited demand or only demand for
a specific kind of use.
• potential scope to accommodate additional retail floorspace (net increase),
categorised as follows:
� small scale - under 1,000 sq m gross floorspace;
� medium scale – 1,000 to 2,500 sq m gross floorspace;
� large scale - over 2,500 sq m gross floorspace;
• potential development constraints; and
• possible alternative uses.
6.15 The overall development prospects of each opportunity, taking on board all of
the factors listed above, has been categorised as follows:
• Good - development sites that have good prospects for providing additional
retail floorspace, and should be considered for implementation in the short
to medium term;
P64/79 11936/679166v2
• Reasonable - development sites which are well located and may provide
potential for additional floorspace, although obstacles to development will
need to be overcome, but implementation may only be achieved in the long
term; and
• Poor - development sites that may be unattractive or unsuitable for retail
development where their delivery is very uncertain.
6.16 This overall rating is based on an initial evaluation for each site. The level of
analysis undertaken at this stage is limited, i.e. detailed appraisals of
development constraints, land ownership and potential development costs have
not been undertaken. More detailed examinations of each site will need to be
undertaken before sites can be brought forward for development or ruled out as
viable options. The evaluations undertaken for each opportunity site are not
detailed planning appraisals and they do not imply that planning permission
should be granted or refused for retail development on any site. However, the
evaluation is expected to identify potentially suitable development opportunities
that may be worthy of further consideration by the Council. This evaluation
provides a framework within which the Council can consider the implementation
of a development strategy for each centre.
Evaluation of Potential Development sites
6.17 Each opportunity site identified has been evaluated based on the factors listed
earlier in this section. An assessment of each site (including the rejected sites)
is provided in Appendix F, and is summarised in Table 6.2 overleaf.
P65/79 11936/679166v2

Table
6.2
: Sit
e E
valu
ati
on S
um
mary
Sit
e
Pote
nti
al S
cale
of
Reta
il D
evelo
pm
ent
Type o
f R
eta
il A
nti
cip
ate
d
Pote
nti
al
Availabilit
y
Overa
ll D
evelo
pm
ent
Pote
nti
al
Quantu
m o
f Flo
ors
pace
Anti
cip
ate
d (
sqm
gro
ss)
LEW
ISH
AM
L 3
Model M
ark
et,
Lew
isham
Sm
all
Sm
all C
om
parison u
nit
Mediu
m t
erm
Poor/
reasonable
S
mall s
cale
incre
ase in r
eta
il
floors
pace
L 5
Lew
isham
Gate
way
Larg
e
Hig
h O
rder
Com
parison
Short
to
mediu
m t
erm
Good
12
,00
0 s
qm
reta
il
5,0
00
sqm
Cla
ss A
3 t
o A
5
uses
3,0
00
sqm
hote
l (1
)
L 6
a a
nd 6
b
Thurs
ton R
oad
Larg
e
Reta
il (
as p
art
of
a m
ixed u
se
deve
lopm
ent)
Short
term
G
ood
6,7
71
sqm
non-food f
loors
pace
on S
ite L
6a (
2)
ove
r and a
bove
exi
sting f
loors
pace o
n S
ite L
6b
L 9
Land n
ort
h o
f
Sunderm
ead
(Loam
pit V
ale
)
Sm
all
Sm
all c
onve
nie
nce/ c
om
parison
reta
il a
s p
art
of
a larg
er
mix
ed-
use s
chem
e
Short
term
G
ood
1,2
30
sqm
Cla
ss A
1,
A2
and
B1
flo
ors
pace (
3)
L 1
1 T
esco S
ite
Sm
all/ m
ediu
m
Ext
ensio
n o
f exi
sting f
oodsto
re.
Conve
nie
nce/ c
om
parison
floors
pace (
assum
ed e
ven s
plit)
Mediu
m t
erm
G
ood
3,0
00
sqm
in t
ota
l (4
)
L 1
2a L
ee H
igh
Road
Sm
all
Sm
all s
cale
reta
il u
nits
Short
to
mediu
m t
erm
Good
92
2 s
qm
gro
ss c
om
parison
floors
pace a
t 3
6-5
6 L
ee H
igh
Road (
6)
1,0
00
sqm
on r
em
ain
der
of
site
L1
2b L
ee H
igh
Road
Mediu
m
Mediu
m s
ized r
eta
il u
nit
Short
to
mediu
m t
erm
Good
1,7
00
sqm
gro
ss /
1,2
86
sqm
net
(1,0
40
sqm
conve
nie
nce/
24
6 s
qm
com
parison)
Lid
l at
10
2- 1
04
Lee H
igh R
oad (
5)
L 1
7 L
ew
isham
Shoppin
g C
entr
e
Larg
e
Food s
tore
- P
ote
ntial to
pro
vide
an e
nla
rged S
ain
sbury
’s f
ood
sto
re
Mediu
m T
erm
G
ood
8,5
00
sqm
(4
)
Net
incre
ase in c
onve
nie
nce
floors
pace lik
ely
to b
e low
er
CA
TFO
RD
C 3
Old
Mark
et
Site
Larg
e
Food a
nd N
on F
ood
Mediu
m/ L
ong
term
Reasonable
, achie
ving a
com
pre
hensiv
e d
eve
lopm
ent
is d
ependent
on a
num
ber
of
3,7
16
sqm
Food
18
,58
0 s
qm
Non- Food (
7)
P66/79
11936/679166v2

facto
rs inclu
din
g t
he
relo
cation o
f a larg
e n
um
ber
of
resid
ential occupie
rs
DEP
TFO
RD
D 3
Deptf
ord
Railw
ay
Sta
tion,
Rose A
pple
Day
Centr
e a
nd c
ar
park
Sm
all
Food/ N
on F
ood
Mediu
m t
erm
R
easonable
Lim
ited incre
ase in r
eta
il
floors
pace
NEW
CR
OS
S
NC
5 S
ain
sbury
’s
Mediu
m
Food/ N
on F
ood –
ext
ensio
n t
o
exi
sting s
tore
Short
/ M
ediu
m
term
Good
1,0
00
- 1
,50
0 s
qm
(4
)
NC
6 N
ew
Cro
ss
Gate
Reta
il P
ark
Mediu
m/ L
arg
e
Com
parison g
oods u
nits
Short
/ M
ediu
m
term
Good
50
0 s
qm
above
exi
sting (
4)
LEE G
REEN
LG
1 L
ee G
ate
Centr
e a
nd m
ulti-
sto
rey
car
park
Larg
e
Food/ N
on F
ood
Mediu
m/ L
ong
term
Poor,
subje
ct
to c
om
merc
ial
att
raction/ v
iability
7,0
00
sqm
(4
)
LG
2 S
ain
sbury
’s
Mediu
m
Foodsto
re e
xtensio
n
Mediu
m/ L
ong
term
Reasonable
1
,00
0- 1
,50
0 s
qm
(4
)
Sourc
es:
1 B
ased o
n p
lannin
g a
pplication r
ef: 0
6/62375
2 B
ased o
n p
lannin
g a
pplication r
ef: 0
7/65251
3 B
ased o
n p
lannin
g a
pplication r
ef: 0
9/71246
(4)
Based o
n N
LP e
stim
ate
(5)
Based o
n p
lannin
g a
pplication r
ef: 0
6/63854
(6)
Based o
n p
lannin
g a
pplication r
ef: 0
6/62788
(7)
Based o
n D
onald
son’s
estim
ate
s (
consis
tent
with 2
004 R
CAS
AS
) – T
he n
et
incre
ase in flo
ors
pace is u
ncert
ain
at
this
sta
ge.
P67/79
11936/679166v2
6.18 Therefore, the analysis above has identified the following scope for each
type of additional floorspace within the Borough. We would emphasise that
the amount of floorspace which is capable of being accommodated is an
approximation.
Convenience Floorspace
6.19 The following represent potential sites (all figures are gross floorspace
unless stated).
i Tesco extension, Lewisham (1,500 sqm gross) – medium term.
ii Lee High Road (Lidl foodstore of 1,700 sqm gross) – short term.
iii Lewisham Shopping Centre reconfiguration (8,500 sqm gross) –
medium term. The net increase in convenience floorspace taking into
consideration the closure of the existing Sainsbury’s store is
estimated to be 3,600 sqm gross.
iv Sainsbury’s, New Cross (1,000- 1,500 sqm gross) – short/ medium
term.
v Sainsbury’s extension, Lee Green (1,000- 1,500 sqm gross) –
medium/ long term.
vi Old Market Site, Catford (3,716 sqm gross) – medium/ long term.
Comparison Floorspace
i Tesco extension, Lewisham (1,500 sqm gross) – medium term.
ii Lewisham Gateway (12,000 sqm gross comparison) – short/ medium
term.
iii Land north of Sundermead (Loampit Vale) (1,230 sqm gross) majority
of which is anticipated to be comparison goods floorspace – short-
term.
iv Lewisham Shopping Centre reconfiguration (8,500 sqm gross of which
assumed to be comparison floorspace) – medium term. The net
increase in comparison floorspace taking into consideration the
closure of the existing Sainsbury’s store is estimated to be 1,100 sqm
gross.
v Lee High Road (922 sqm gross comparison floorspace at 36-56 Lee
High Road and the additional comparison floorspace element provided
in the Lidl foodstore. An additional 1,000 sqm could be
accommodated) – short/ medium term.
vi Old Market Site, Catford (18,580 sqm gross) – medium/ long term.
vii New Cross Gate Retail Park (500 sqm gross above existing) – short/
medium term.
viii Lee Green (7,000 sqm gross) – medium/ long term (but doubts as to
its commercial viability).
vx Thurston Road (6,771 sqm gross permitted) – short term.
P68/79 11936/679166v2
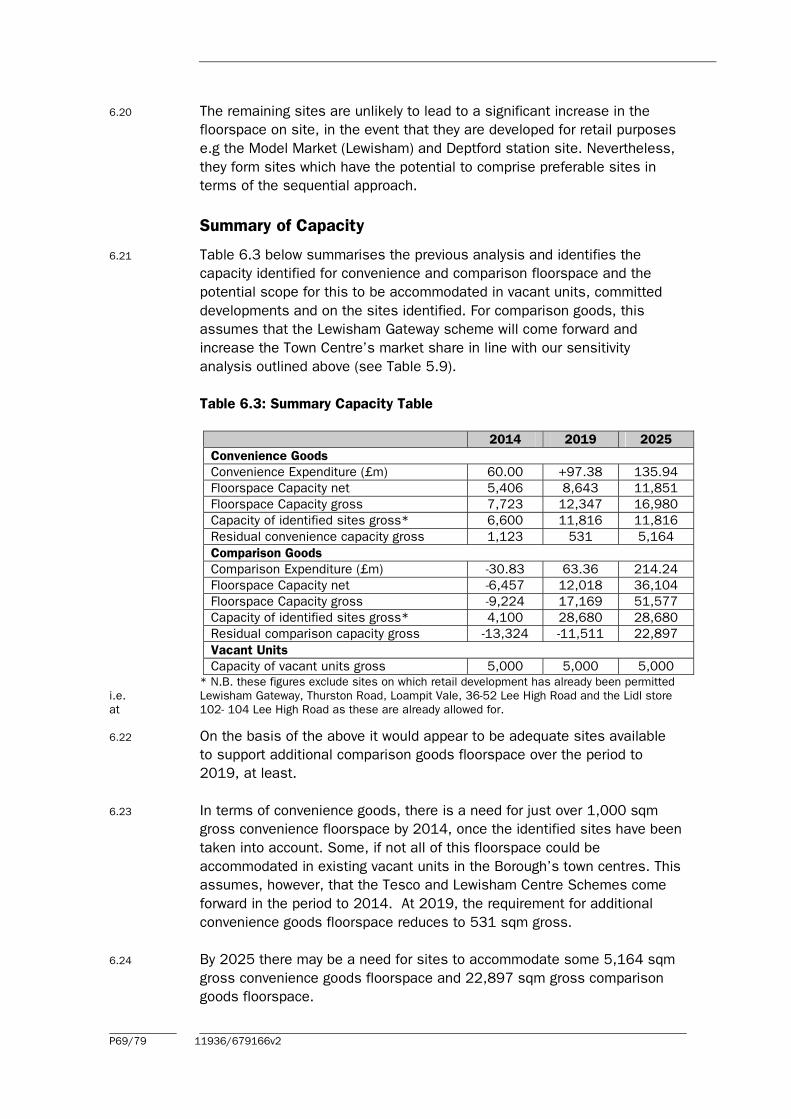
6.20 The remaining sites are unlikely to lead to a significant increase in the
floorspace on site, in the event that they are developed for retail purposes
e.g the Model Market (Lewisham) and Deptford station site. Nevertheless,
they form sites which have the potential to comprise preferable sites in
terms of the sequential approach.
Summary of Capacity
6.21 Table 6.3 below summarises the previous analysis and identifies the
capacity identified for convenience and comparison floorspace and the
potential scope for this to be accommodated in vacant units, committed
developments and on the sites identified. For comparison goods, this
assumes that the Lewisham Gateway scheme will come forward and
increase the Town Centre’s market share in line with our sensitivity
analysis outlined above (see Table 5.9).
Table 6.3: Summary Capacity Table
2014 2019 2025
Convenience Goods
Convenience Expenditure (£m) 60.00 +97.38 135.94
Floorspace Capacity net 5,406 8,643 11,851
Floorspace Capacity gross 7,723 12,347 16,980
Capacity of identified sites gross* 6,600 11,816 11,816
Residual convenience capacity gross 1,123 531 5,164
Comparison Goods
Comparison Expenditure (£m) -30.83 63.36 214.24
Floorspace Capacity net -6,457 12,018 36,104
Floorspace Capacity gross -9,224 17,169 51,577
Capacity of identified sites gross* 4,100 28,680 28,680
Residual comparison capacity gross -13,324 -11,511 22,897
Vacant Units
Capacity of vacant units gross 5,000 5,000 5,000
i.e.
at
* N.B. these figures exclude sites on which retail development has already been permitted
Lewisham Gateway, Thurston Road, Loampit Vale, 36-52 Lee High Road and the Lidl store
102- 104 Lee High Road as these are already allowed for.
6.22 On the basis of the above it would appear to be adequate sites available
to support additional comparison goods floorspace over the period to
2019, at least.
6.23 In terms of convenience goods, there is a need for just over 1,000 sqm
gross convenience floorspace by 2014, once the identified sites have been
taken into account. Some, if not all of this floorspace could be
accommodated in existing vacant units in the Borough’s town centres. This
assumes, however, that the Tesco and Lewisham Centre Schemes come
forward in the period to 2014. At 2019, the requirement for additional
convenience goods floorspace reduces to 531 sqm gross.
6.24 By 2025 there may be a need for sites to accommodate some 5,164 sqm
gross convenience goods floorspace and 22,897 sqm gross comparison
goods floorspace.
P69/79 11936/679166v2
6.25 We emphasise that if all the potential locations for additional floorspace
(ie. specific sites and the reuse of vacant units) did not come forward
during these time frames then the residual floorspace capacity would
increase. Alternatively, if any of the larger potential sites such as those at
Catford (Old Market site) and Lee Green (Leegate Centre) were progressed
sooner than expected then this would further reduce total capacity beyond
2014. It is also reiterated that the figures used for schemes such as the
Market site in Catford are indicative. The net increase in floorspace could
be less than that forecast which would impact upon the longer term
capacity figures.
6.26 The above demonstrates the need to review the Study in 4/5 years as
advised in the next section.
P70/79 11936/679166v2
7.0 RECOMMENDATIONS AND CONCLUSIONS
Introduction
7.1 This Study has been prepared by Nathaniel Lichfield and Partners and
provides a Retail Capacity Study. It replaces the 2004 RCASAS. In brief,
NLP has undertaken the following work:
1. Review of existing retail provision in the Borough.
2. Health-check of each of the nine town centres.
3. Assessed the retail need and capacity for additional convenience and
comparison retail floorspace in the Borough to 2025.
4. Undertaken a sequential approach of all town centres and examined
potential sites that may be capable of accommodating additional
comparison and convenience retail floorspace.
5. Drawing on the above including an assessment of the scope of, and
likely timescale for, individual identified sites to meet the retail need
as well as efficiency increases and other policy objectives, assessed
residual capacity to 2025.
7.2 The preceding sections consider the above issues. To inform the
assessment, current shopping patterns have been forecast based on the
results of a household survey undertaken by NEMS as part of this study.
7.3 The principle conclusions of the assessment contained within this study
are summarised below.
Meeting Shopping Needs within the London Borough of
Lewisham
7.4 In order to meet projected growth in expenditure, there is some need for
additional shopping facilities in the London Borough of Lewisham.
Consistent with the 2004 RCASAS, we consider that the minimum
objective of the retail strategy should be to safeguard the Borough’s
existing shopping role and market share within the sub-region, in the face
of increasing competition from centres outside the Borough, in particular
Bromley and Croydon. However, in line with LB Lewisham’s overall
objectives of Lewisham Town Centre becoming a Metropolitan Centre, we
have undertaken a sensitivity test which assesses an increased
penetration rate for the centre in terms of comparison goods retailing. We
consider that this is an achievable aim and we recommend that the
Council pursues a strategy which supports this objective and encourages
retail investment in the Borough’s Town Centres, and Lewisham Town
Centre in particular.
7.5 Future planning policy and site allocations should therefore seek to identify
opportunities to accommodate identified growth up to 2014. Longer term
P71/79 11936/679166v2

growth beyond 2014 and up to 2025 should be monitored and updated as
necessary.
Convenience Goods Floorspace
7.6 On the basis of a constant market share, our analysis shows that there is
global capacity for additional convenience goods floorspace across the
Borough. The benchmark turnover of existing convenience floorspace has
been subtracted from the estimates of available expenditure. This
calculation has taken account of existing convenience floorspace
commitments in the Borough. As such, the surplus expenditure is made up
of both existing overtrading and growth in expenditure. As outlined in
Section 5.0, the need for new floorspace will be influenced by a number of
issues including the acceptability of higher than average trading levels in
some stores. Such factors need to be considered on a site by site basis,
in the context of a particular centre. However, in general terms, the failure
to address overtrading may result in worsening conditions in existing
stores leading to increased leakage from the Borough.
7.7 The identified surplus expenditure of £28.06 million at 2009 indicates that
there is immediate global capacity for up to 2,551 sqm net of additional
convenience goods floorspace in the Borough. At 2014, the estimated
surplus convenience expenditure of £60.00 million could support up to
5,406 sqm net of convenience goods floorspace. This is a significant
quantum of floorspace and as noted above should be treated as a
maximum figure. Some of this could be provided through extensions to
existing town centre and edge of centre food stores in the Borough and
redevelopment of existing foodstores sites. One site opportunity to
accommodate a significant proportion of this need would be through a
reconfiguration of the Lewisham Shopping Centre to possibly provide a
larger foodstore for Sainsbury’s.
Comparison Goods Floorspace
7.8 The expenditure capacity projections show that, based on the large amount
of comparison goods floorspace that is committed and in particular the
Lewisham Gateway, Bell Green and Thurston Road retail commitments,
there is no capacity for additional comparison goods floorspace at either
2009 or 2014, assuming that the existing market share of facilities in the
Borough remains the same. As indicated, we believe that it is possible that
not all the committed development will come forward over the 2009 to
2014 period. This, combined with the fact that new comparison goods
floorspace will increase the attractiveness of the Borough (and therefore
increase its market share) there may be additional capacity for comparison
goods facilities over the period to 2014. In the medium and long-term
there will be capacity for additional comparison goods facilities; at 2019,
there is a surplus of £39.62 million comparison goods expenditure rising
to £181.96 million at 2025 based on current market shares
P72/79 11936/679166v2
7.9 For comparison goods floorspace, we have also undertaken a sensitivity
test which assumes that Lewisham Town Centre increases its penetration
rate from residents within the study area. We have assumed that the
market share of the Town Centre will increase by 10% which we believe is
realistic if committed developments are implemented. This reflects the aim
within planning policy for shopping requirements to be met by reducing the
need to travel, as well as for Lewisham Town Centre to establish itself as
a Metropolitan Centre within the retail hierarchy.
7.10 The effect of this modest increase in the Town Centre’s penetration rate
would reduce the deficit of comparison goods expenditure at 2009 and
2014 and increase the surplus at 2019 and 2025.
7.11 As noted above, we consider that the Council should pursue policies within
emerging LDF documents which proactively plan for this increase in market
share. The successful implementation of the Gateway scheme is a key
element of this strategy.
7.12 At present Lewisham Town Centre contains around 80,000 sqm of retail/
service floorspace (gross). A minimum of an additional 20,000 sqm is
required to satisfy Metropolitan Area status. This can be achieved through
the successful implementation of current commitments/proposals and
would be aided by the increase in market share referred to above.
Existing Centres and Current Strategies
7.13 This Study analyses the role and function of all the centres within the
Borough, and considers their relative positions within the retail hierarchy.
Lewisham Town Centre is the Borough’s premier shopping destination. In
terms of catchment population, available development opportunities and
future retail development plans, Lewisham provides the main opportunity
to improve comparison goods shopping in the Borough. At present, the
centre does not provide the quantity and quality of retailers to enable it to
function as a Metropolitan Centre. The national MHE Retail Rankings
(2008), which is based on national multiple representation, indicates that
the centre is ranked significantly lower than other Metropolitan Centres in
the Sub-Region such as Croydon and Bromley and that there is a need to
attract additional national multiples if Metropolitan Centre status is to be
achieved.
7.14 A number of schemes in Lewisham have obtained planning consent and
are in various stages of the development pipeline. The key scheme is
Lewisham Gateway which has now obtained outline planning permission
for a development of 12,000 sqm gross of A1 retail floorspace in addition
to office, residential, education and leisure uses. This will enhance an
underused area of the centre and provide good quality modern retail
floorspace which should attract new national multiples into the Centre and
significantly increase its retail offer. The Thurston Road scheme would
P73/79 11936/679166v2
supplement the retail offer of the centre by providing new retail warehouse
floorspace, however given that this permission has been extant since
November 2006 (albeit with a revision approved in February 2008) it is
unclear when or in what form this will eventually be built. Other retail
developments have also been approved in the centre, including a Lidl store
on Lee High Road.
7.15 The Council has pursued a strategy which seeks to consolidate major new
development in Lewisham Town Centre. The above permissions form part
of this strategy and if implemented will significantly enhance the quantum
and quality of comparison goods floorspace in the Town Centre. The
Council is progressing an Area Action Plan for Lewisham Town Centre
which represents a holistic strategy for its future development. The scope
for additional floorspace has been identified through an analysis of
potential development opportunities and this is dealt with in the next sub
section.
7.16 Catford Town Centre is the second largest centre in the Borough. It
provides a wide range of services to Borough residents and a more local
convenience and comparison shopping offer. It performs important
functions as a civic and entertainment centre attracting visitors from
across the Borough and beyond. However there has been no notable
change in the retail offer of the Town Centre even though other centres,
particularly outside the Borough, have enhanced their offer. It is important
that the Centre improves its retail offer in the future if it is to maintain its
position in the retail hierarchy and new investment should be encouraged.
Schemes such as that proposed at the former Greyhound Stadium will help
by introducing a significant number of new residents in close proximity to
the Town Centre.
7.17 The Council is also progressing an Area Action Plan for Catford containing
seven aspirational objectives. This provides a comprehensive strategy for
supporting the Centre and recognises the importance of five key
development sites to the support the wider regeneration of the Centre.
This will form the basis of the future strategy to encourage investment and
enhance its retail role.
7.18 In addition to the two main centres of Lewisham and Catford, there are
seven other centres within the Borough which range in size from Deptford
(224 units) to Downham (66 units). These centres serve their local areas
with day-to-day shopping needs and generally the comparison goods offer
is limited to lower order goods, provided predominately by independent
operators. Any development within these centres should be commensurate
with the scale of each centre and its role in the retail hierarchy.
7.19 The Study found that neither Blackheath nor Deptford has a supermarket
despite their District Town Centre status. Although a medium sized food
store would improve the convenience offer of these centres, it is noted
P74/79 11936/679166v2

that in Blackheath in particular there is a lack of available sites to
accommodate additional retail floorspace. In addition, both Blackheath and
Deptford already has an above average representation of convenience
goods retailers and Deptford also benefits from its strong independent
retail offer. On this basis, we do not consider that a medium sized food
store is vital to the future health of these two centres.
7.20 In response to the project brief this Study has considered the feasibility of
combining New Cross District Town Centre and New Cross Gate
Neighbourhood/ Local Centre into one District Town Centre. Although
residential uses are present in-between the two centres, given their
proximity their amalgamation in retail terms is feasible. The Council could
pursue a strategy through LDF documents to encourage greater investment
in the extended centre. In the interim, opportunities to improve connectivity
between the two centres should be encouraged.
Scope for Accommodating Growth
7.21 Section 6.0 of this study considers the opportunities for accommodating
the projected surplus expenditure. Six sites are identified for convenience
goods floorspace. One of these sites comprises the current Lidl
commitment on Lee High Road, another relates to a possible
reconfiguration of the Lewisham Shopping Centre and the remaining four
sites are existing supermarkets which are capable of being extended or
redeveloped. Only the Lidl is anticipated to come forward in the short-term
i.e. up to 2012. In addition, it is possible that sites identified within the
analysis for non food development may be suitable for food or a mixed
food/non food development. We consider that the re-use of vacant units
within the Borough will also assist in meeting the identified need for
convenience floorspace.
7.22 In terms of comparison goods floorspace, based on a constant market
share, there is no requirement for additional floorspace in the Borough to
2014 (assuming all commitments are implemented). However, if all the
committed developments do not come forward or the market share of
Lewisham Town Centre or other facilities in the Borough increase
significantly, there may be some need for additional comparison goods
floorspace. This can be accommodated in existing vacant units or on the
identified sites. In this respect, we have assumed that the Bell Green
permission will be implemented in its current, or very similar, form. Clearly,
at present there is some uncertainty over the scheme, although we
understand that National Grid will be taking the site forward.
7.23 In our view, the Council should continue to focus new retail development in
the Borough on Lewisham Town Centre and in particular on the shopping
core and non-core areas. The development of the Gateway site is key to
improving the centre’s retail offer and the implementation of this scheme
should not be prejudiced by the development of significant comparison
P75/79 11936/679166v2
floorspace elsewhere (i.e. outside of core and non-core frontages). A key
issue will be the successful integration of the Gateway site with the
remainder of the town centre to maximise the benefits of this
development. Reconfiguration or expansion of the Lewisham Shopping
Centre to provide additional retail floorspace and increase the quality of
existing floorspace is the only other option, at the current time, that offers
the potential to significantly enhance the retail offer within the Town Centre
and any proposals which achieve this aim should be supported (subject to
normal development control criteria.
7.24 In Catford, the only site which could provide a significant level of
comparison goods floorspace is the Old Market site. The net increase in
floorspace will depend upon the scheme that is eventually granted
planning permission. If the existing site is redeveloped (including the
existing Tesco, multi storey car park, surrounding land and potentially
existing retail units), it is likely to provide a longer term option, given the
need to relocate existing residential occupiers. However, the
redevelopment of this site is recognised as a priority in the emerging
Catford AAP and as we have identified securing investment in Catford is
crucial if it is to maintain and hopefully enhance its role in the retail
hierarchy in the future. If the realignment of the South Circular (A205) can
be secured, this could open up several other development sites and would
improve the legibility of the centre for shoppers.
7.25 In the District Town Centres, the only other major site which could
accommodate a significant level of comparison floorspace is the Leegate
Centre at Lee Green. This site could potentially be redeveloped in whole or
in part, although the commercial viability of such a scheme is uncertain.
The redevelopment proposals at New Cross have the potential to improve
the Centre and provide much needed modern floorspace, however given
that the site is in existing retail use it is doubtful that the final scheme
would result in a significantly increased quantum of comparison goods
floorspace over the existing level.
7.26 In terms of the potential development opportunities identified above, we
have considered likely timescales and the potential scale of the
development. Table 6.3 provides a summary capacity table which takes
account of potential development sites. There is a need to accommodate
additional convenience floorspace over the period to 2014, based on the
level of surplus convenience goods expenditure identified. A number of
sites in the Borough have been identified which could accommodate this
need, however it is not clear when these sites will come forward for
redevelopment to provide additional facilities. The main opportunity for
additional convenience floorspace is through a reconfiguration of the
Lewisham Centre to provide a larger Sainsbury’s store. For the purposes
of this analysis we have assumed that this scheme will come forward in
the period to 2014.
P76/79 11936/679166v2
7.27 There is no quantitative need for additional comparison goods floorspace
over the period to 2014, based on the assumption that all the existing
commitments are implemented. If some of these commitments do not
come forward it may provide the opportunity to permit additional
comparison goods schemes. An increase in market share for Lewisham
town centre, created by the implementation of the Gateway scheme, may
also create additional capacity. There could also be qualitative arguments
for permitting additional comparison goods floorspace over the 2009 to
2014 period.
7.28 Other sites that have not been considered may come forward over the
period to 2014 and other redevelopment opportunities may be identified by
the Council. As noted above, support should be given to proposals which
comply with the requirements of national, London Plan and UDP policy, as
well as the emerging Core Strategy and AAP documents. It is important,
however, that the Council ensures that any new scheme located outside a
town centre would not prejudice the implementation of other town centre
sites. In this respect, although the Bell Green proposals will certainly
improve the retail warehouse offer of the Borough, if implemented in its
current form, the Council will need to carefully consider any proposals
which may come forward to relax the current restrictions on the sale of
goods. It is important that any such proposals are considered in the
context of protecting existing centres within the Borough and in particular
ensuring that any such proposals do not prejudice investment in schemes
such as the Gateway.
Future Strategy Implementation and Monitoring
7.29 Given the current uncertainty surrounding national retail planning guidance
(draft PPS4), it is not possible to provide a definitive approach towards
strategy implementation. It will be necessary to review the Council’s
approach towards its defined centres and retail development subsequent
to any new guidance being introduced.
7.30 Notwithstanding this, there are a number of areas which the Council could
pursue in order to maintain and enhance the role of shopping centres in
Lewisham:
• application of guidance within PPS6 (as currently exists), particularly
relating to scale, need, the sequential approach and impact in
determining edge and out-of-centre retail and other development
proposals that generate significant numbers of trips;
• measures to improve accessibility and public transport to the defined
centres in order to encourage more residents to shop within their
nearest centre;
P77/79 11936/679166v2
• the continued implementation of public realm improvements to
improve the attractiveness of shopping environments within all
centres;
• the creation and continued support for town centre management
activities; and
• measures to bring forward development opportunities which accord
with the planning policy tests (PPS6), and in particular the Gateway
site. We see the Gateway site as key to helping Lewisham Town
Centre to achieved Metropolitan Centre status. The Council should
formulate a strategy which ensures, as far as possible, that this
scheme is implemented.
7.31 The recommendations and projections within this Study are expected to
assist the Council in preparing the emerging LDF documents and to assist
development control decisions during this period. The Study provides a
broad overview of the potential need for further retail development up to
2014, and longer-term forecasts to 2019 and 2025. It should be
reiterated that projections are subject to uncertainty and forecasts will
need to be amended to reflect emerging changes as and when new
information becomes available and at a maximum of five years. Long-term
projections beyond 2014 should be treated with a high degree of caution
and should be viewed as indicative only.
7.32 We would recommend that this Study should be updated again in five
years time or sooner and the floorspace projections rolled forward. The
following key assumptions should be updated as necessary:
• population projections;
• local expenditure estimates (information from Experian or other
recognised data providers);
• growth rate assumptions for expenditure per capita (information from
Experian or other recognised data providers);
• the impact of potential increases in home and internet shopping;
• existing retail floorspace and average turnover to floorspace densities
(floorspace surveys and turnover data from Management Horizons
Retail Ranking);
• implemented development within and around the study area;
• the role and function of defined centres; and
• national retail guidance.
P78/79 11936/679166v2
7.33 These key inputs into the Retail Capacity Study can be amended to provide
revised capacity projections. We do not envisage that the structure of the
Study set out here will need to be amended. A new household survey is
likely to be required in order to accurately assess shopping patterns at the
time of any future study.
P79/79 11936/679166v2