retail hot buttons - consumer health products canada influencing cpg growth ... acne products ‐8%....
TRANSCRIPT

REDEFINING RETAILFACTORS INFLUENCING CPG GROWTH
WITHIN HEALTH & BEAUTY
Q2 2014

Copyrig
ht ©
2013
The
Nielse
n Co
mpany. Con
fiden
tial and
proprietary.
2
THE CHALLENGE FOR GROWTH

Copyrig
ht ©
2012
The
Nielse
n Co
mpany. Con
fiden
tial and
proprietary.
3
CPG STILL SPUTTERING FOR GROWTH IN NORTH AMERICA
United States
Nielsen: MarketTrack ‐ Total Tracked Sale52 wks ending June 28, 2014
Canada
+1.4 +0.0
Dollars
Nielsen: ScanTrack ‐ Total Tracked Sale52 wks ending July 5, 2014
UnitsDollars Units
+1.0 ‐0.3

Copyrig
ht ©
2012
The
Nielse
n Co
mpany. Con
fiden
tial and
proprietary.
4
5
22 2
2 20
20 0 0 0
2009 2010 2011 2012 2013 YTD 2014
$ % Chg Unit % Chg
Inflation +5 +0 +2 +2 +2 +2
2014 IS SHAPING UP TO BE MORE OF THE SAME
Source: Nielsen MarketTrack, National All Channels – YTD 28 weeks to June 28, 2014 ‐ Total Tracked Sales excluding Fresh Random Weight
Slow growth, driven only by inflation

Copyrig
ht ©
2012
The
Nielse
n Co
mpany. Con
fiden
tial and
proprietary.
5
1
0
11
3
1
00
0
‐1
2
0
National Maritimes Quebec Ontario Prairies B.C.
$ % Chg
Unit % Chg
THE PRAIRIES LEAD REGIONAL PERFORMANCE
52 week Regional CPG Performance
Source: Nielsen MarketTrack, National All Channels – 52 weeks Ending June 28 2014 ‐ Total Tracked Sales excluding Fresh Random Weight
The Prairies lead regional growth – twice the National average
Copyrig
ht ©
2012
The
Nielse
n Co
mpany. Con
fiden
tial and
proprietary.
6
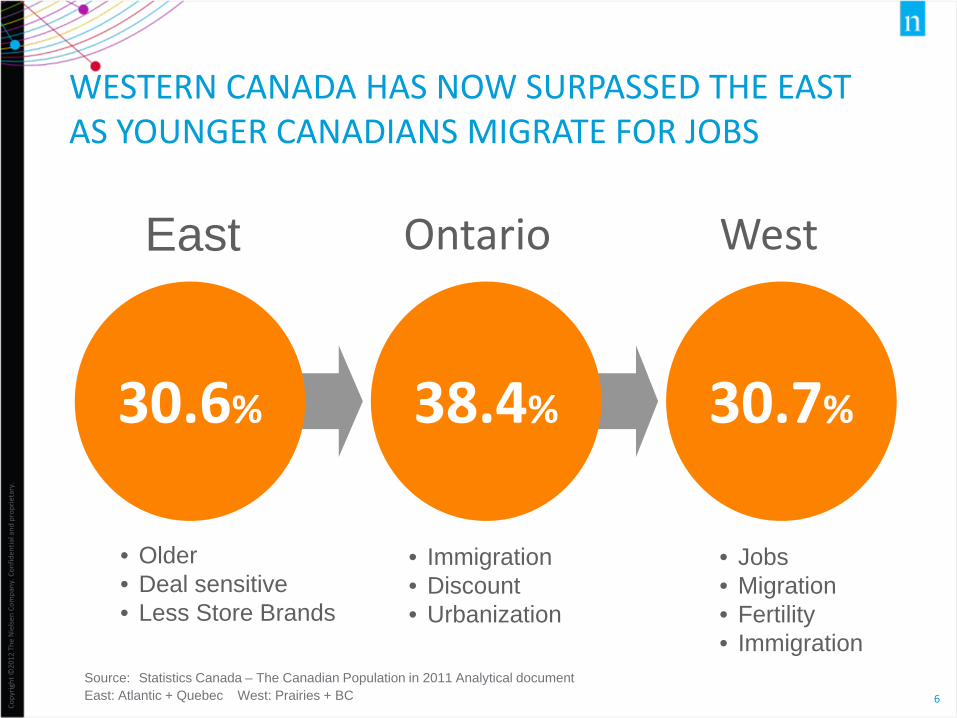
WESTERN CANADA HAS NOW SURPASSED THE EAST AS YOUNGER CANADIANS MIGRATE FOR JOBS
30.6%
East WestOntario
30.7%38.4%
• Jobs• Migration• Fertility• Immigration
• Immigration• Discount• Urbanization
Source: Statistics Canada – The Canadian Population in 2011 Analytical document East: Atlantic + Quebec West: Prairies + BC
• Older• Deal sensitive• Less Store Brands

Copyrig
ht ©
2013
The
Nielse
n Co
mpany. Con
fiden
tial and
proprietary.
7
71%12%
6%11%
Grocery & Mass (+1%)
Convenience & Gas (+3%)*
All Other (+2%) Total Market: $73.3 Billion (+2%)
Source: Nielsen MarketTrack, National, Dollars, 52 weeks ending June 28, 2014Excludes Fresh Random Weight and Food Service; * Includes Tobacco
Drug (+2%)
CONVENIENCE & GAS OUTPACING THE MARKET

Copyrig
ht ©
2012
The
Nielse
n Co
mpany. Con
fiden
tial and
proprietary.
8
66.6 76.4
19.6
18.1 10.5
71.2
15.3 13.0 9.6
$ Share and Growth
HABA
GroceryCategories
Non Grocery
+1
+1
+2
+1
+1
+1
+4
+1
+2
+4
+0
+6
HEALTH & BEAUTY SALES ARE OUTPERFORMING TOTAL CPG
AllChannels
Grocery + Mass
Drug Stores
Source: Nielsen MarketTrack, 52 Weeks to June 28, 2014 ‐ Excludes Random Weight Fresh

Copyrig
ht ©
2012
The
Nielse
n Co
mpany. Con
fiden
tial and
proprietary.
9
HABA CATEGORIES ARE LEADING RETAIL SALES GROWTH WITHIN GROCERY + MASS MERCHANDISERS
$ Share and Growth
66.6 76.4
19.6
18.1 10.5
71.2
15.3 13.0 9.6
HABA
GroceryCategories
Non Grocery
+1
+1
+2
+1
AllChannels
Grocery + Mass
+1
+1
+4
+1
Drug Stores
Source: Nielsen MarketTrack, 52 Weeks to June 28, 2014 ‐ Excludes Random Weight Fresh
+2
+4
+0
+6

Copyrig
ht ©
2012
The
Nielse
n Co
mpany. Con
fiden
tial and
proprietary.
10
FOOD CATEGORIES ACCOUNT FOR ALMOST 1 IN 5 DOLLARS SALES IN DRUG STORES ‐ FUELING GROWTH
$ Share and Growth
66.6 76.4
19.6
18.1 10.5
71.2
15.3 13.0 9.6
HABA
GroceryCategories
Non Grocery
+1
+1
+2
+1
AllChannels
Grocery + Mass
+1
+1
+4
+1
+2
+4
+0
+6
Drug Stores
Source: Nielsen MarketTrack, 52 Weeks to June 28, 2014 ‐ Excludes Random Weight Fresh
Copyrig
ht ©
2012
The
Nielse
n Co
mpany. Con
fiden
tial and
proprietary.
11
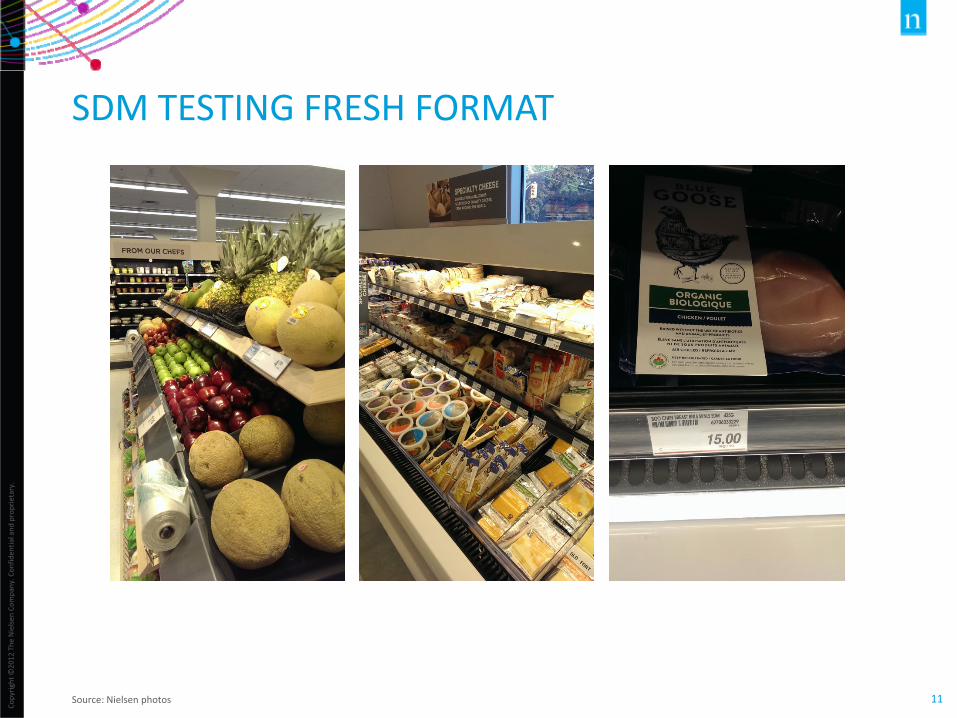
SDM TESTING FRESH FORMAT
Source: Nielsen photos
Copyrig
ht ©
2012
The
Nielse
n Co
mpany. Con
fiden
tial and
proprietary.
12
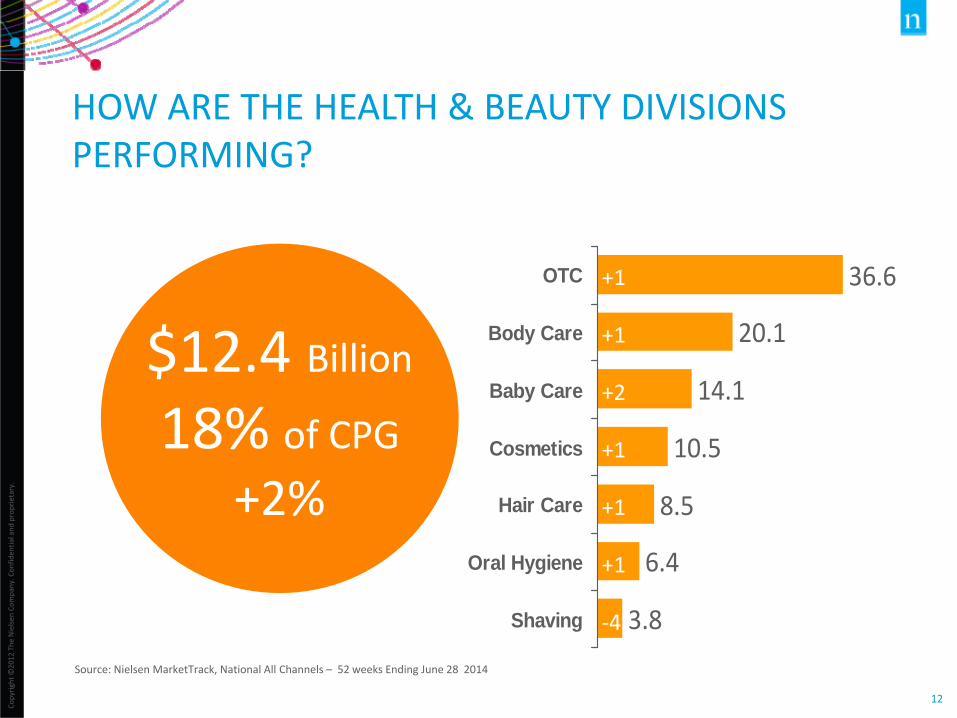
HOW ARE THE HEALTH & BEAUTY DIVISIONS PERFORMING?
Source: Nielsen MarketTrack, National All Channels – 52 weeks Ending June 28 2014
$12.4 Billion18% of CPG
+2%
36.6
20.1
14.1
10.5
8.5
6.4
3.8
OTC
Body Care
Baby Care
Cosmetics
Hair Care
Oral Hygiene
Shaving
+1
+1
+2
+1
+1
+1
‐4

Copyrig
ht ©
2012
The
Nielse
n Co
mpany. Con
fiden
tial and
proprietary.
13
MAKING THE CUT IN HABA
Source: Nielsen MarketTrack, National All Channels – 52 weeks Ending June 28 2014 > $5 million
Men’s Antifungals +17%Sleeping Aids +13%Topical Analgesics +13%Energy Nutrition +11%Athletic Supports +10%
Enemas ‐13%Tooth Polish ‐12%Acne Products ‐8%Menstrual Relief ‐8%Wart Removers ‐6%
Face Care +2%Headache Rem ‐3%Shampoo+Cond. +0%Health Suppl. +5%Diapers +0%
Top 5

Copyrig
ht ©
2012
The
Nielse
n Co
mpany. Con
fiden
tial and
proprietary.
14
DRUG STORES REMAIN THE TOP DESTINATION FOR HABA SALES – BUT LOSING SHARE
$ Share 2009 2014 Pt Chg
Drug Stores 39.6% 36.3% ‐3.4
Grocery 23.4% 22.9% ‐0.5
Mass Merch. 21.4% 21.4% +0.0
Warehouse 7.0% 9.6% +2.6
Health Food 1.9% 2.1% +0.2
Remaining 6.7% 7.7% +1.0
Source: Nielsen Homescan Channel Facts ‐ 52 Weeks Ending June 28, 2014
Copyrig
ht ©
2012
The
Nielse
n Co
mpany. Con
fiden
tial and
proprietary.
15
WHERE IS THE CONSUMER TODAY?
Do you think economics conditions are better today than a year ago?
YES NO

Copyrig
ht ©
2012
The
Nielse
n Co
mpany. Con
fiden
tial and
proprietary.
16
WHERE IS THE CONSUMER TODAY?
As a result, will you change your spending behaviours?
YES NO

Copyrig
ht ©
2012
The
Nielse
n Co
mpany. Con
fiden
tial and
proprietary.
17
WHERE DO WE FIND GROWTH IN A CHALLENGING ENVIRONMENT?

Copyrig
ht ©
2012
The
Nielse
n Co
mpany. Con
fiden
tial and
proprietary.
18
TRENDS IMPACTING GROWTH
• Economy still fragile• Cautious Consumer
Cyclical Changes
• Value Motivators• Emerging Retail Formats• Connected Consumer• Evolving Consumer
Structural Changes

Copyrig
ht ©
2013
The
Nielse
n Co
mpany. Con
fiden
tial and
proprietary.
19
CONSUMER SENTIMENT IN A HOLDING PATTERN

Copyrig
ht ©
2012
The
Nielse
n Co
mpany. Con
fiden
tial and
proprietary.
20
CANADIAN CONSUMER CONFIDENCE IS IN A HOLDING PATTERN SINCE THE RECESSION
Source: Nielsen Global Online Consumer Confidence Surveys – Q2 2014
110114
111 112 113
104
96
84
90
98102 101
9694
10098
100 99102
3Q05 3Q06 3Q07 3Q08 2Q09 2Q10 4Q11 4Q12 4Q13 2Q14
Recession Post‐recessionPre‐Recession
Copyrig
ht ©
2012
The
Nielse
n Co
mpany. Con
fiden
tial and
proprietary.
21
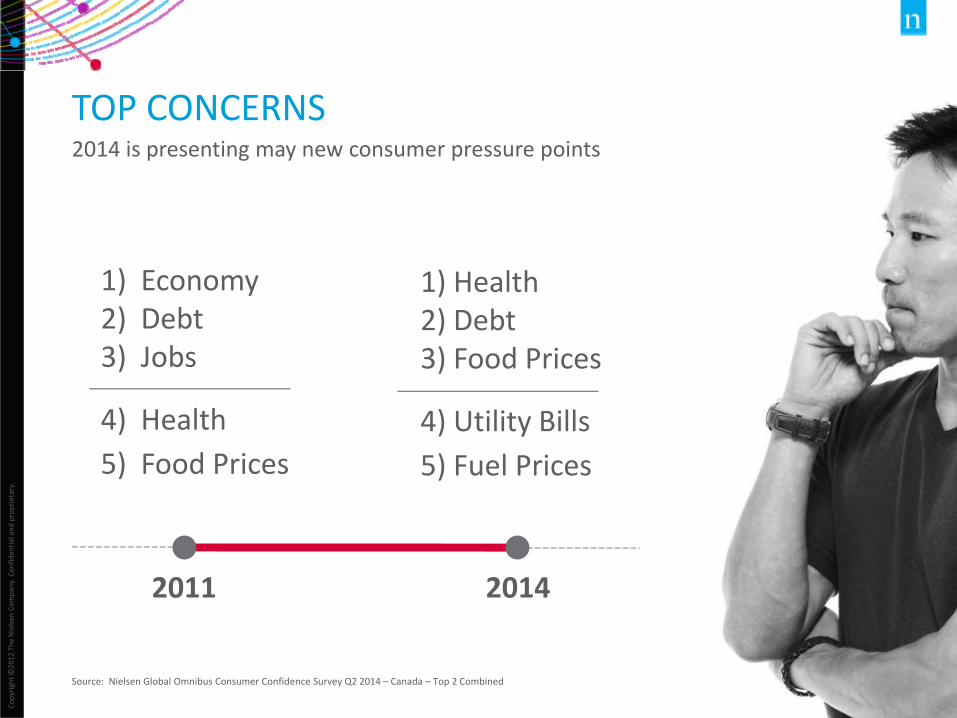
TOP CONCERNS2014 is presenting may new consumer pressure points
20142011
1) Economy2) Debt3) Jobs
4) Health5) Food Prices
1) Health2) Debt3) Food Prices
4) Utility Bills5) Fuel Prices
Source: Nielsen Global Omnibus Consumer Confidence Survey Q2 2014 – Canada – Top 2 Combined

Copyrig
ht ©
2012
The
Nielse
n Co
mpany. Con
fiden
tial and
proprietary.
22
CONSUMERS ARE STILL FOCUSED ON SPENDING RESTRAINT
$$$
54%are trying to reduce household expenses
‐3%decline in household expenditures
Source: Nielsen Homescan, Total Expenditures ‐ 52 Weeks Ending June 28, 2014 – Q2 2014 Global Omnibus Survey – Canada* Nielsen Panel Views Survey June 2014 – Canada
73%are trying to spend less on their grocery bill*

Copyrig
ht ©
2012
The
Nielse
n Co
mpany. Con
fiden
tial and
proprietary.
23
WHAT ARE CONSUMERS DOING TO SAVE?
• Stock up when on promotion 85%
• Only buy items when on sale 75%
• Use Coupons 65%
• Seek out stores with lower prices 59%
• Buy larger sizes 52%
• Buy lower priced store brands 48%
• Buy lower priced name brands 38%
• Shop at Discount Retailers 36%
Top saving activities:
$$$
Source: Nielsen PanelViews Survey ‐ Canada – June 2014
New #1

Copyrig
ht ©
2012
The
Nielse
n Co
mpany. Con
fiden
tial and
proprietary.
24
SINCE BEFORE THE RECESSION, % OF RETAIL SALES SOLD WITH A PRICE CUT HAS INCREASE 10 POINTS
% Dollars Sold on TPR
27% 27%31%
33% 34%35% 37% 37%
2007 2008 2009 2010 2011 2012 2013 2014
Quarterly PeriodsSource: Nielsen MarketTrack, National GB+MM+DG ‐ 12 week periods ending June 28, 2014
HABA 27% +4
+4

Copyrig
ht ©
2012
The
Nielse
n Co
mpany. Con
fiden
tial and
proprietary.
25
36
32
30
28
26
23
21
ORAL HYGIENE
BABY CARE
BODY CARE
HAIR CARE
SHAVING
OTC
COSMETICS
HABA DEPARTMENTS ARE LESS DEPENDENT ON PRICE CUTS BUT IS GAINING MOMENTUM
TPR* % of Total Dollar Sales ‐ $ % Chg
* TPR – Temporary Price Reduction
TPR* Total
+7 +2
+3 +2
+3 +1
‐1 +1
+3 ‐4
+5 +1
+4 +1
Source: Nielsen MarketTrack, National Grocery + Drug + Mass ‐ 52 weeks to June 28, 2014 versus Year Ago

Copyrig
ht ©
2012
The
Nielse
n Co
mpany. Con
fiden
tial and
proprietary.
26
ALMOST 6 BILLION IN GROCERY SALES HAVE SHIFTED TO DISCOUNT RETAILERS SINCE 2007
34.3%
43.7%
Discount $ Share
Yr 2007 Yr 2014
Discount Share Projections:
2014: 44.7%
2017: 50.9%
+9 share points
MORE TO COME
Source: Nielsen MarketTrack – National GB+DG+MM– 52 weeks to June 28, 2014
HABA 36%

Copyrig
ht ©
2012
The
Nielse
n Co
mpany. Con
fiden
tial and
proprietary.
27
69.5
45.7
40.3
39.7
32.7
26.8
24.9
BABY CARE
SHAVING
HAIR CARE
ORAL HYGIENE
BODY CARE
OTC
COSMETICS
DISCOUNT RETAILERS GAINING SHARE OF WALLET FOR THE MAJORITY OF HABA DEPARTMENTSDiscount Dollar Share – $ % Chg Disc
+14
‐2
+2
+3
+1
+5
+4
Conv
‐3
‐5
+0
+1
+1
+0
+0
Source: Nielsen MarketTrack, National All Channels ‐ 52 weeks to June 28, 2014 ‐ * Excludes Random Weight Fresh

Copyrig
ht ©
2013
The
Nielse
n Co
mpany. Con
fiden
tial and
proprietary.
28
TRADITIONAL
TRADITIONAL RETAIL UNDER ATTACK

Copyrig
ht ©
2012
The
Nielse
n Co
mpany. Con
fiden
tial and
proprietary.
29
THE LOYAL, DISLOYAL SHOPPER
Source: Nielsen Homescan: Top 10 Banners in Ontario ‐ Avg $ Share of Requirements 52 weeks to Sept 19/13
Average Loyalty to Store
14%
Need to understand what and where your shoppers are
spending the other 86%
The Opportunity

Copyrig
ht ©
2012
The
Nielse
n Co
mpany. Con
fiden
tial and
proprietary.
30
TRADITIONAL CPG CHANNELS RELATIVELY STATIC
Grocery ‐1%Drug +2%Conv & Gas +3%Warehouse +3%Mass Merch ‐5%
less Zellers +5%
Source: Nielsen Homescan Channel Watch – Canada ‐ 52 weeks to June 28, 2014*Convenience Track 52 weeks to June 28, 2014 – Drug MarketTrack
Copyrig
ht ©
2012
The
Nielse
n Co
mpany. Con
fiden
tial and
proprietary.
31
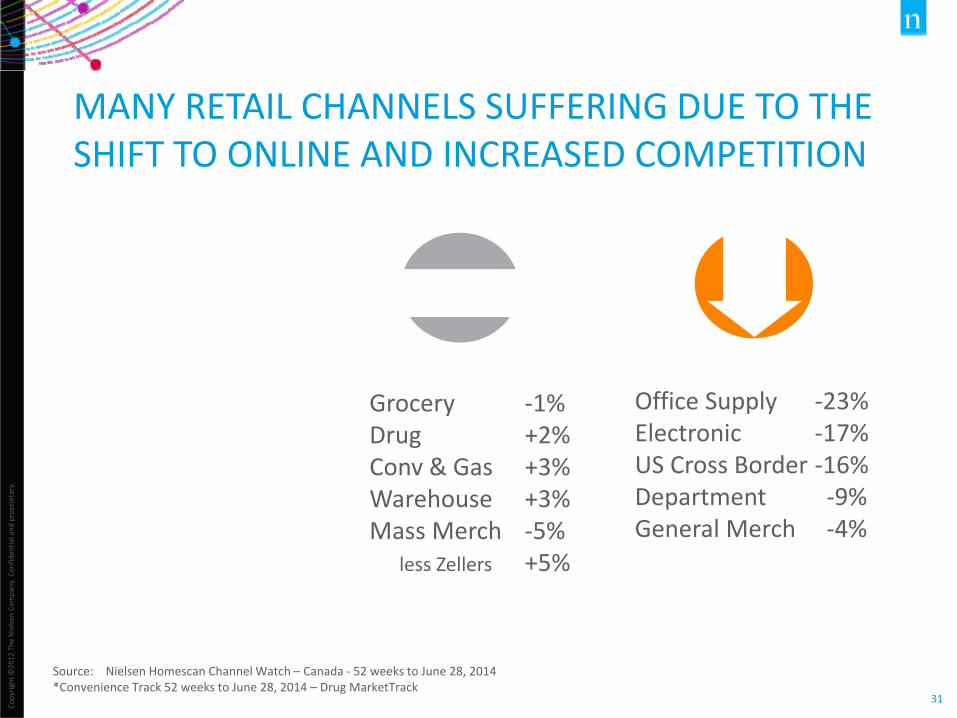
MANY RETAIL CHANNELS SUFFERING DUE TO THE SHIFT TO ONLINE AND INCREASED COMPETITION
Office Supply ‐23%Electronic ‐17%US Cross Border ‐16%Department ‐9%General Merch ‐4%
Source: Nielsen Homescan Channel Watch – Canada ‐ 52 weeks to June 28, 2014*Convenience Track 52 weeks to June 28, 2014 – Drug MarketTrack
Grocery ‐1%Drug +2%Conv & Gas +3%Warehouse +3%Mass Merch ‐5%
less Zellers +5%

Copyrig
ht ©
2012
The
Nielse
n Co
mpany. Con
fiden
tial and
proprietary.
32
E‐COMMERCE, ETHNIC , HEALTH AND DOLLAR STORES LEAD RETAIL GROWTH IN CANADA
Online +43%Ethnic Grocery +20%Health Food +8%Dollar Stores +7%
Office Supply ‐23%Electronic ‐17%US Cross Border ‐16%Department ‐9%General Merch ‐4%
Source: Nielsen Homescan Channel Watch – Canada ‐ 52 weeks to June 28, 2014*Convenience Track 52 weeks to June 28, 2014 – Drug MarketTrack
Grocery ‐1%Drug +2%Conv & Gas +3%Warehouse +3%Mass Merch ‐5%
less Zellers +5%
Copyrig
ht ©
2012
The
Nielse
n Co
mpany. Con
fiden
tial and
proprietary.
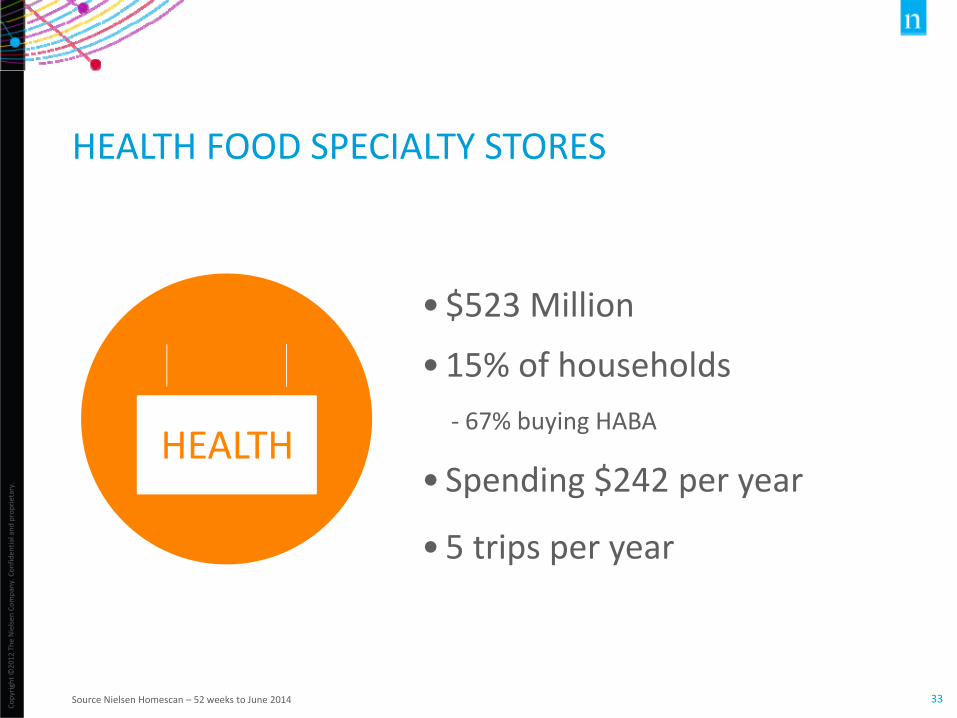
33
HEALTH FOOD SPECIALTY STORES
Source Nielsen Homescan – 52 weeks to June 2014
HEALTH
•$523 Million
•15% of households‐ 67% buying HABA
• Spending $242 per year
• 5 trips per year

Copyrig
ht ©
2012
The
Nielse
n Co
mpany. Con
fiden
tial and
proprietary.
34
DOLLAR STORES HAVE ROOM TO GROW IN CANADA
Source Nielsen Homescan – 52 weeks to June 2014
DOLLAR STORES
CANADA U.S
$ Share 1.2% 2.3%
% Chg +7% +1%
Penetration 75% 66%
33% of Dollar Store shoppers buy HABA in Dollar Stores

Copyrig
ht ©
2012
The
Nielse
n Co
mpany. Con
fiden
tial and
proprietary.
35
ETHNIC STORES CONTINUE TO CAPTURE A LARGER SHARE OF CANADIAN WALLETS
Source: Nielsen Homescan Retailer Watch – Ethnic Stores, 52 weeks to June 28, 2014
Ethnic Grocery
+20%•Estimate $4‐5 Billion*
•17% of households
:36% in Toronto
• Spending $328 per year
• 11 trips per year
* Perry Caico CIBC World Markets

Copyrig
ht ©
2013
The
Nielse
n Co
mpany. Con
fiden
tial and
proprietary.
36
ONLINE SHOPPING GAINING MOMENTUM
Online Shopping
+43%•1.9% share of Tracked Sales
‐ Grocery Composite 0.6%‐ Drug Composite 1.0%
•43% of households (+22%)
• Spending $388 /yr (+17%)$2.3 Billion
Source: Nielsen Homescan, National Total Expenditures, 52 Weeks Ending June 28, 2014
+11% YA

Copyrig
ht ©
2012
The
Nielse
n Co
mpany. Con
fiden
tial and
proprietary.
37
WHAT ARE CONSUMERS BUYING ONLINE AND WILLING TO BUY ONLINE?
Source: Canadian PanelViews Social Media Survey Oct 2013
Currently Buying Online Willing to Buy Online21% Toys16% Health & Beauty14% Cosmetics9% Paper Products7% Household Products7% Confectionery6% Pet Products6% Non Perishable Food6% Baby Products4% OTC Drugs4% Beverages3% Fresh Produce3% Perishable Food
70% Paper Products64% Household Products56% Heath & Beauty55% Toys50% Non Perishable Food49% Pet Products48% Confectionery48% Cosmetics47% OTC Drugs45% Beverages33% Baby Products20% Perishable Food18% Fresh Produce

Copyrig
ht ©
2012
The
Nielse
n Co
mpany. Con
fiden
tial and
proprietary.
38
THE FACE OF THE CANADIAN SHOPPER IS CHANGING
• Ethnicity• Downsizing• Generations

Copyrig
ht ©
2012
The
Nielse
n Co
mpany. Con
fiden
tial and
proprietary.
39
COMMON GENERATIONAL DEFINITIONS While there are many generalizations, there is no “official” definition
<19‘Gen Z’16%
19‐37‘Gen Y’27%
38‐47‘Gen X’14%
48‐67‘Boomers’28%
68+‘GI’14%
Source: Statistics Canada – Census 2011
5.7 9.4 4.7 9.8 5.0 Millions
Copyrig
ht ©
2012
The
Nielse
n Co
mpany. Con
fiden
tial and
proprietary.
40
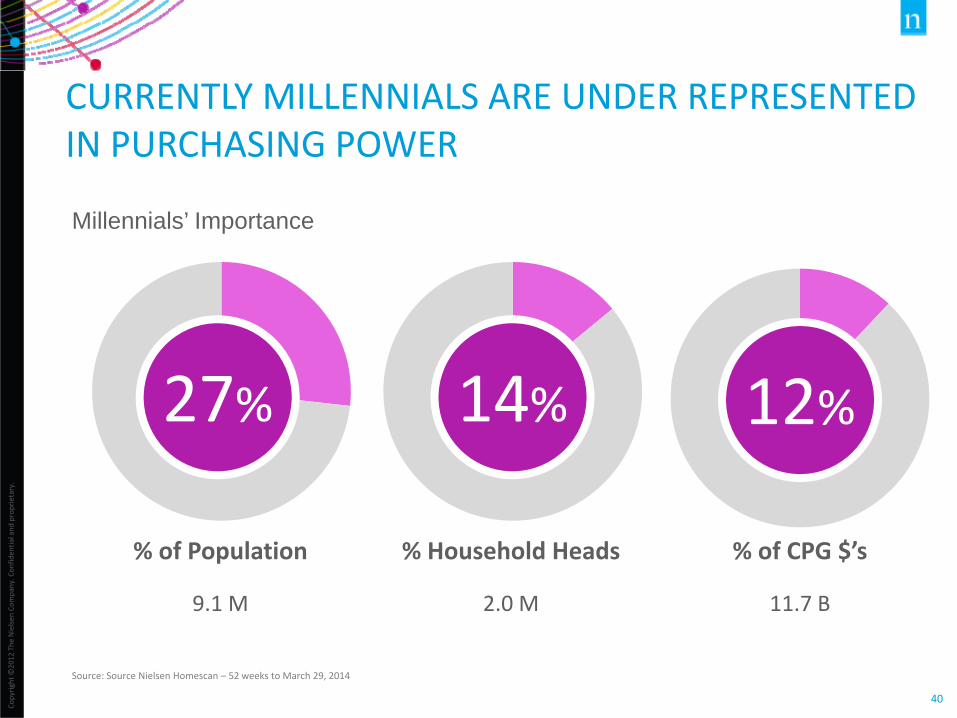
CURRENTLY MILLENNIALS ARE UNDER REPRESENTED IN PURCHASING POWER
Millennials’ Importance
27%
Source: Source Nielsen Homescan – 52 weeks to March 29, 2014
14% 12%
% of Population
9.1 M
% Household Heads
2.0 M
% of CPG $’s
11.7 B

Copyrig
ht ©
2012
The
Nielse
n Co
mpany. Con
fiden
tial and
proprietary.
41Source: Statistics Canada M: Millions
2010 2020 2030
Millennials Boomers
MILLENNIALS WILL SURPASS BOOMERS BY 2020
26%
28%
8.9 M9.7 M
26%
24%
10.0 M9.4 M
26%
20%
11.0 M8.3 M
34.2 M 38.4 M 42.1 MTotal Canada

Copyrig
ht ©
2012
The
Nielse
n Co
mpany. Con
fiden
tial and
proprietary.
42
THE CPG GROWTH ENGINE WILL SWITCH GEARS
By 2020…
Source: Nielsen Homescan 52 weeks to March 29, 2014 – HH <35 years – Based on older generation spend
MILLENNIALS BOOMERS
+$12.6 B
+207%
‐$4.3 B
‐9%

Copyrig
ht ©
2012
The
Nielse
n Co
mpany. Con
fiden
tial and
proprietary.
43
WHICH HABA DEPARTMENTS ARE MOST COMMONLY FOUND IN A MILLENNIALS’ SHOPPING BASKET?
Nielsen Homescan – Dollar Consumption Index – 52 wks to December 28, 2013 – Consumer Facts CPG Departments Relative Index (82 for total)
Relative Dollar Index <35 years
Baby Care 384Body Care 122
Hair Care 120Cosmetics 109
Oral Hygiene 97OTC 67
Copyrig
ht ©
2012
The
Nielse
n Co
mpany. Con
fiden
tial and
proprietary.
44
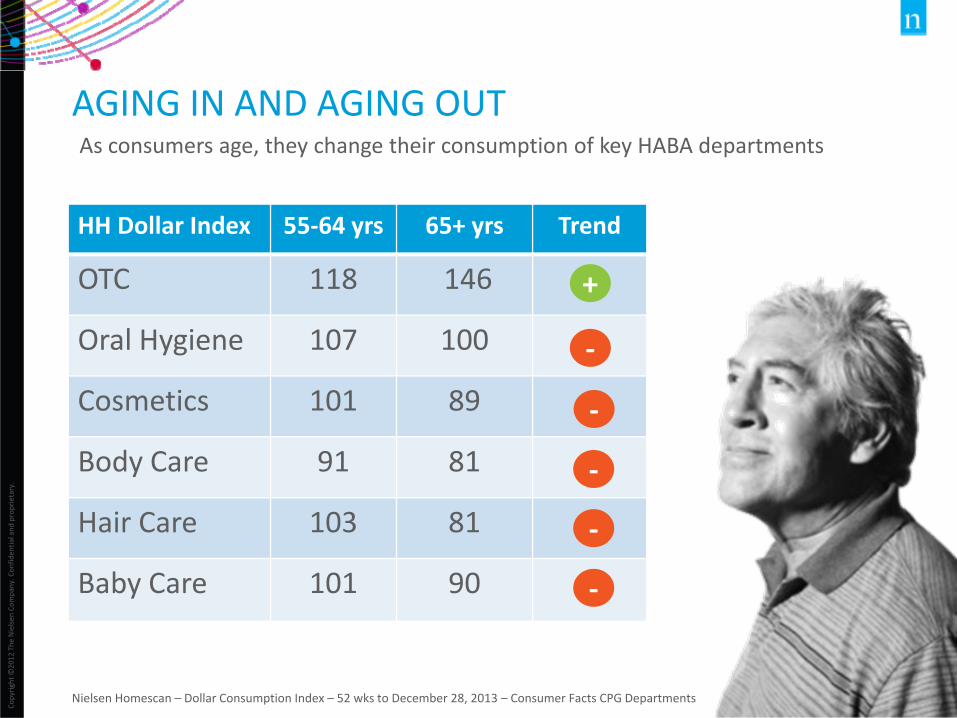
AGING IN AND AGING OUT
Nielsen Homescan – Dollar Consumption Index – 52 wks to December 28, 2013 – Consumer Facts CPG Departments
HH Dollar Index 55‐64 yrs 65+ yrs Trend
OTC 118 146
Oral Hygiene 107 100
Cosmetics 101 89
Body Care 91 81
Hair Care 103 81
Baby Care 101 90
As consumers age, they change their consumption of key HABA departments
+
‐
‐
‐
‐
‐

Copyrig
ht ©
2012
The
Nielse
n Co
mpany. Con
fiden
tial and
proprietary.
45
I want to watch what I want, when I want… and for free.

Copyrig
ht ©
2012
The
Nielse
n Co
mpany. Con
fiden
tial and
proprietary.
46
Media Usage
MEDIA HABITS DIFFER BETWEEN GENERATIONS
Source: Nielsen Spectra, PMB , January 2014
BoomersMillennial
TV
Internet
Magazines
Newspaper
Radio
LIGHT HEAVYMEDIUM

Copyrig
ht ©
2012
The
Nielse
n Co
mpany. Con
fiden
tial and
proprietary.
47Source: Nielsen Borealis; TV Data Source: BBM Canada
Millennials
Boomers
OVER THE PAST 3 YEARS, MILLENNIALS ARE WATCHING LESS TRADITIONAL TELEVISION
2012 2013 2014
22hr 48min
33hr 36min
22hr 29min
33hr 47min
20hr 52min
33hr 59min
4.9 hrs/day
3.0 hrs/day

Copyrig
ht ©
2012
The
Nielse
n Co
mpany. Con
fiden
tial and
proprietary.
48
TOP 10 TV SERIES AMONG MILLENNIALS IN 2013
Source: Nielsen Borealis; TV Data Source: BBM Canada – TV Series Excluding specials
1. Amazing Race Canada 12. Big Bang Theory 33. Masterchef 584. Stanley Cup Finals 55. Sochi 2014 66. La Voix 27. Agents of S.H.I.E.L.D 538. Under the Dome 49. Amazing Race 910.Grey’s Anatomy 22
Boomers
FEMALES:7 of 10 are reality shows
MALES:2 of 10 are reality shows

Copyrig
ht ©
2012
The
Nielse
n Co
mpany. Con
fiden
tial and
proprietary.
49
MILLENNIALS ARE CUTTING THE CORD
% with no cable or TV subscription
Millennials Boomers
26%
12%
Source: Nielsen Spectra, 2014 Mar

Copyrig
ht ©
2012
The
Nielse
n Co
mpany. Con
fiden
tial and
proprietary.
50
LESS CABLE BUT MORE ONLINE MEDIA
46% News Websites
34% Watch TV online
26% Newspapers Online
22% Radio Online
Boomers
23%
5%
14%
7%
Source: December 2013 Nielsen PanelViews Social Media Survey
Millennials

Copyrig
ht ©
2012
The
Nielse
n Co
mpany. Con
fiden
tial and
proprietary.
51
POWER AT THEIR FINGERTIPS
% Total Ownership
12% expected to buy in next year
63% potential ownership
Source: Nielsen PanelViews, Social Media Survey, 2013
51%
7% expected to buy in next year
86% potential ownership!
% Millennials Ownership
79%

Copyrig
ht ©
2012
The
Nielse
n Co
mpany. Con
fiden
tial and
proprietary.
52
65% have purchased or are willing to purchase via virtual store
70% have purchased from an
online store
E‐commerce M‐commerce
Nielsen, PanelViews, Social Media, survey 2013
LEADING TO ONLINE SALES

Copyrig
ht ©
2013
The
Nielse
n Co
mpany. Con
fiden
tial and
proprietary.
5353
KEY TAKEAWAYS
• Economic Divide: Economy remains sluggish; opportunities across the economic spectrum with polarizing growth ‐ Premium vs. Value
• Cyclical Changes: With time, the economy will improve along with consumer spending fueling growth
• Structure Changes: The face of the Canadian shopper continues to evolve changing the retail landscape. We need to align to these trends for sustainable growth.

Copyrig
ht ©
2013
The
Nielse
n Co
mpany. Con
fiden
tial and
proprietary.
54
THANK YOU!
Stay Connected to Consumer and Media Trends
For the latest insights, visit us nielsen.com
Download our app: Nielsen TOPTEN
Questions regarding the content of this presentation, contact:
Carman Allison, email [email protected]
@carman_allison
