retail market monitoring quarterly transparency report
TRANSCRIPT
RETAIL MARKET MONITORING
Quarterly Transparency Report
Quarter 1: January to March 2021
Published: 28 May 2021

Abstract
This paper is the latest of a series of Utility Regulator (UR) reports – the Quarterly Transparency Reports (QTRs) – that provide a
range of information about the retail energy market in Northern Ireland (NI).
The data relates mainly to market shares, market activity and domestic prices in the electricity and gas retail markets. The data also
includes information on non-domestic, or industrial and commercial (I&C), electricity prices.
We collect and monitor market information through the Retail Energy Market Monitoring (REMM) framework.
The information shown in this report comes from network companies, suppliers, BEIS1 and Eurostat. Some figures have been
calculated internally.
These reports are released at the end of the second month after each calendar quarter (in Feb, May, Aug and Nov).
Audience
Electricity and gas industry, associations of consumers, regulators, statistical bodies, suppliers, potential new market entrants,
consultants, researchers and journalists.
Consumer impact
The information used to produce these reports allows us to monitor the retail market, flag potential concerns and to inform
regulatory decisions. All of this directly impacts on consumers. This set of reports increases transparency for consumers on matters
of their direct interest, such as the active suppliers in each energy market sector, and NI prices compared against other jurisdictions.
1 From 01 January 2021, BEIS (Department for Business, Energy & Industrial Strategy), no longer provide pricing data to Eurostat. Therefore, the UK pricing figures reported have been obtained directly from BEIS publicised data.

Section 1 – Summary
Page | 1
Contents
1 Summary of key market indicators ...............................................................................................................2
1.1 Key developments during Quarter 1 2021 ...................................................................................................3
2 Introduction ......................................................................................................................................................4
2.1 Purpose, methodology and data sources ....................................................................................................4
2.2 Energy suppliers in NI energy market .........................................................................................................4
2.3 Electricity wholesale market monitoring data ...............................................................................................5
2.4 Northern Ireland gas market overview.........................................................................................................6
3 Electricity ..........................................................................................................................................................7
3.1 NI connections and total consumption.........................................................................................................8
3.2 Electricity Market shares ..........................................................................................................................10
3.3 Electricity market activity ..........................................................................................................................16
3.4 Electricity prices .......................................................................................................................................17
4 Gas in the Greater Belfast area (PNGL) .....................................................................................................20
4.1 Connections and consumption in the Greater Belfast area ........................................................................21
4.2 Gas market shares in the Greater Belfast area..........................................................................................23
4.3 Market activity in the Greater Belfast area.................................................................................................27
5 Gas in the Ten Towns area (FeDL)..............................................................................................................29
5.1 Connections and consumption in the Ten Towns area ..............................................................................30
5.2 Gas market shares in the Ten Towns area................................................................................................32
5.3 Market activity in the Ten Towns area .......................................................................................................36
6 Gas in the West Area (SGN NG) ..................................................................................................................37
6.1 Connections and consumption in the West area........................................................................................38
7 Gas prices .......................................................................................................................................................40
7.1 Comparison against EU prices .................................................................................................................40
Glossary ..................................................................................................................................................................42
Annex A: Supplier Entry to Retail Markets ........................................................................................................43

Section 1 – Summary
Page | 2
Summary of key market indicators

Section 1 – Summary
Page | 3
1.1 Key developments during Quarter 1 2021
1. The semester 2 (July to December) 2020 electricity pricing data is sourced from Eurostat and individual supplier’s submissions under the
REMM framework. The current pricing data illustrates the following:
NI domestic electricity prices (17.8 p/kWh) continue to rank below the EU median (19.5 p/kWh), UK (19.9 p/kWh) and are lower
than the Republic of Ireland (23.7 p/kWh).
The NI I&C electricity price for the Very Small connections (which represent c72% of I&C connections) is 15.6 p/kWh, which is
lower than the EU median (16.4 p/kWh), UK (17.1 p/kWh) and Republic of Ireland (21.4 p/kWh).
For Large and Very Large I&C customers (c0.02% of connections) NI prices (9.0p/kWh) are just above RoI (8.3p/kWh) but below
the UK (12.2 p/kWh).
2. The domestic gas prices in NI are amongst the lowest in Europe at 4.1 p/kWh. This is less than, UK (4.3 p/kWh), RoI (6.3 p/kWh) and EU
median (6.5 p/kWh).
3. Market activity in the electricity domestic and I&C sectors continues to illustrate a gradual change in the market dynamics. Power NI (the
incumbent price controlled electricity supplier) retain their dominant position with 55.0% of connections in the domestic market with
continued growth of the competing suppliers (representing 45.0% of domestic connections, an increase from 44.5% for the same period
last year).
4. Overall electricity switching activity in Q1 2021 decreased from the previous quarters. Domestic customers continue to engage in the
market with over 14,500 domestic switches completed during Q1 2021. In the I&C sector, electricity switching also saw a decrease in the
period with a switching rate of 1.0% (down from 1.6% in the previous quarter), with over 770 switches completed.
5. In the gas sector, I&C switching activity increased in Greater Belfast with an increase in the I&C switching rate from 0.6% in Q4 2020 to
3.4% in Q1 2021. The I&C switching rate for Ten Towns remained static with a switching rate of 0.4%.

Section 2 – Introduction
Page | 4
Introduction
2.1 Purpose, methodology and data sources
The purpose of this report is to deliver transparency for
stakeholders and consumers, providing readers with readily
accessible information on the evolution and performance of
Northern Ireland (NI) electricity and natural gas retail sectors.
The Quarterly Transparency Reports (QTRs) are one of the tools
we use to communicate some of the main indicators we monitor in
the retail energy markets. We protect consumers by promoting
effective competition wherever appropriate, and by monitoring the
markets. Therefore, monitoring the retail markets is key when
complying with our statutory duties.
The framework in which this set of quarterly reports lies is called
Retail Energy Market Monitoring (REMM), which was introduced in
July 2015. The ultimate objective of introducing this enhanced
framework was to develop the current monitoring of retail indicators,
and to provide increased transparency in the retail energy markets
in NI. Because of this framework, there have been a number of
changes made to the format of this publication and how some of the
indicators are presented. We will continue to make changes as
appropriate to represent the new indicators that we are monitoring
under REMM.
The main data sources for this QTR are as follows:
Connections and consumption, market shares and market
activity information is provided by the network companies:
2 It is anticipated that gas in the West distribution area will be developed as per Annex 2, Part 3 of the Scotia Gas Networks Northern Ireland licence.
o Northern Ireland Electricity Networks (NIEN) for electricity
data; and
o Phoenix Natural Gas Limited (PNGL), firmus energy
(Distribution) Limited (feDL) and Scotia Gas Networks
Northern Ireland (SGN NG) for gas data.
EU domestic and I&C electricity prices are from Eurostat. NI
domestic and I&C electricity prices are derived directly from
REMM data submitted by suppliers. NI domestic gas prices
are also derived from REMM data submitted by suppliers.
2.2 Energy suppliers in NI energy market
The electricity and gas (in the Greater Belfast area) markets have
been open to competition to domestic customers since 2007.
However, there were no competing suppliers in the domestic
market until 2010.
The Ten Towns area opened to gas competition for large I&C
customers (those consuming over 732,000 kWh per annum) in
October 2012, and to domestic and small I&C customers in April
2015. The first gas connection to the new West2 gas distribution
area was a large I&C user during Q1 2017.

Section 2 – Introduction
Page | 5
During the first quarter of 2021 there were nine
suppliers in the electricity market and six
suppliers in the gas market although not all of
these suppliers are certified to operate in all
sectors (or in all gas distribution areas).
The detail of the dates of entry for the suppliers
in each of the retail market segments is
available in Annex A. For more information
about the retail energy market in NI, please
visit: https://www.uregni.gov.uk/supply.
2.3 Electricity wholesale market
monitoring data Readers should also be aware of the Quarterly
Market Monitoring Report which provides an
overview of the SEM and sets out recent
trends in the market in relation to pricing,
demand, scheduling and contract prices. It
focuses in particular on the wholesale element
of electricity prices, which makes up roughly
60% of customers’ bills. These reports3 are
prepared by the Market Monitoring Unit (MMU)
within the UR in joint collaboration with the
Commission for Regulation of Utilities (CRU).
3 SEM Monitoring Report covering the period 01 January – 31 March 2021.
Table 2 Suppliers in the Retail Market End of Q1 2021
Network Operator
NIEN PNGL feDL SGN NG
Electricity Gas
Greater Belfast Gas
Ten Towns Gas West
Dom I&C Dom I&C Dom I&C Dom I&C
Budget Energy
Click Energy
Electric Ireland
firmus energy
Flogas
Go Power
Power NI
SSE Airtricity
Naturgy
3T Power
bright
Suppliers 7 8 2 6 1 6 1 5
Source: UR

Section 2 – Introduction
Page | 6
2.4 Northern Ireland gas market overview
The gas distribution network licensees are responsible for the
medium and low pressure mains that convey to the licensed areas
throughout Northern Ireland. There are three Distribution Network
Operators (DNOs) who operate in separate distribution areas as
illustrated on the map which follows:
firmus energy (Distribution) Ltd (feDL) from the North West
through the Central region to the Southern areas of Northern
Ireland;
Phoenix Natural Gas Ltd (PNGL) mainly Greater Belfast,
Larne and a recent extension into East Down; and
SGN Natural Gas Ltd (SGN NG) in the West of Northern
Ireland.
Each DNO owns and manages the natural gas distribution network
in their distribution area. Those companies who supply gas
(suppliers) pay the relevant DNO a fee to transport natural gas, and
then sell it straight to the consumer. Although a DNO is responsible
for making sure the natural gas reaches individual homes, it is the
responsibility of the gas supplier to bill consumers for the gas they
use.
Figure 1: Gas Distribution Licenced Areas

Section 3 – Electricity
Page | 7
Electricity

Section 3 – Electricity
Page | 8
3.1 NI connections and total consumption
The table below shows electricity customer numbers4 at end March 2021 and consumption from January to March 2021.
Table 3 Electricity connections and consumption per market segment
Of the total customers in Northern Ireland,
91.8% belong to the domestic sector, while
the remaining 8.2% are I&C customers. In
this quarter, this share translates into 42.2%
and 57.8% in terms of consumption.
Within the domestic sector, 45.1% of the
market use prepayment meters and 54.9%
pay by credit (by connections).
Within the I&C sector, more than 99.9% of
the customers are small and medium
enterprises (consuming less than 19,999
MWh), with 85.6% of the I&C consumption.
The remaining are Large Energy Users (LEU)
connections, that represent 8.3% of the total
NI volume in this quarter, and 14.4% of the
I&C consumption.
Source: NIEN
4 Note that long term vacant sites are not included in connection numbers, and that combined premises are included in the <20MWh category
Q1 2021
Customer groups Number of
connections
% share of connections in market sector
Consumption (GWh)
% share of consumption
in market sector
Domestic prepayment 372,166 45.1% 365.7 42.8% Domestic credit 452,914 54.9% 489.1 57.2%
Total Domestic 825,080 100% 854.8 100%
I&C < 20 MWh 52,917 71.4% 103.3 8.8%
I&C 20 – 49 MWh 11,801 15.9% 110.2 9.4% I&C 50 – 499 MWh 8,423 11.4% 294.8 25.2%
I&C 500 – 1,999 MWh 685 0.9% 178.8 15.3% I&C 2,000 – 19,999 MWh 232 0.3% 315.3 26.9%
I&C ≥ 20,000 MWh 18 0.02% 168.5 14.4% Total I&C 74,076 100% 1,170.9 100%
Total 899,156 2,025.7

Section 3 – Electricity
Page | 9

Section 3 – Electricity
Page | 10
3.2 Electricity Market shares
Electricity shares by connections5
During the quarter there were seven domestic electricity suppliers in NI, and eight active suppliers in the I&C electricity market. The total
number of domestic customers at the end of Q1 2021 was 825,080. As is evident from the table below a significant number of domestic
customers (55.0%) remain with the previously incumbent supplier Power NI.
Table 4 Domestic market shares by connections
Source: NIEN
The market shares in this quarter illustrate a similar position to the previous
quarter for Power NI. For Q1 2021 Power NI supplied 43.4% of the domestic
prepayment and 64.5% of the domestic credit market.
The slow growth of the new entrants in the domestic market is clear, given
that the non-incumbents now represent 45.0% of total domestic connections
in NI (an increase from 44.5% in the same period last year).
5 Market shares f igures do not include de-energised nor Long Term Vacant sites.
End of Q1 2021
Domestic Suppliers
Domestic Prepayment
Domestic Credit Domestic Total
Power NI 161,680 43.4% 291,925 64.5% 453,605 55.0% SSE Airtricity 62,365 16.8% 95,983 21.2% 158,348 19.2% Go Power - 0% 638 0.1% 638 0.1%
Electric Ireland 40,841 11.0% 48,439 10.7% 89,280 10.8% Budget Energy 79,746 21.4% 13,158 2.9% 92,904 11.3%
Click Energy 27,447 7.4% 2,612 0.6% 30,059 3.6% bright 87 0.02% 159 0.04% 246 0.03%
Dom Market 372,166 100% 452,914 100% 825,080 100%

Section 3 – Electricity
Page | 11
Table 5 I&C market shares by connections
I&C Suppliers I&C < 20 MWh I&C 20 – 49
MWh I&C 50 – 499
MWh I&C 500 – 1,999
MWh I&C 2,000 – 19,999 MWh
I&C ≥ 20,000 MWh
I&C Total
Power NI 31,361 59.3% 5,037 42.7% 3,176 37.7% 221 32.3% 77 33.2% 3 16.7% 39,875 53.8% SSE Airtricity 10,065 19.0% 2,868 24.3% 1,379 16.4% 93 13.6% 28 12.1% 5 27.8% 14,438 19.5% Go Power 4,986 9.4% 1,473 12.5% 1,188 14.1% 74 10.8% 30 12.9% 3 16.7% 7,754 10.5% Electric Ireland 5,726 10.8% 2,240 19.0% 2,354 27.9% 263 38.4% 89 38.4% 7 38.9% 10,679 14.4% Budget Energy 376 0.7% 103 0.9% 51 0.6% - 0% - 0% - 0% 530 0.7% Naturgy 21 0.1% 3 0.03% 14 0.2% 16 2.2% 3 1.3% - 0% 57 0.1% Click Energy 241 0.5% 36 0.3% 19 0.2% 2 0.3% 2 0.9% - 0% 300 0.4% 3T Power 141 0.3% 41 0.4% 242 2.9% 16 2.3% 3 1.3% - 0% 443 0.6% I&C Market 52,917 100% 11,801 100% 8,423 100% 685 100% 232 100% 18 100% 74,076 100%
Source: NIEN
The graph shows the trends in market shares (by customer numbers) for each
active I&C supplier in NI by market segment, for the previous six quarters.
Competition in the I&C market is more developed than the domestic sector,
and consequently market shares are much more dispersed. Out of the eight
active suppliers at the end of Q1 2021, based on customer numbers, four of
these suppliers have shares in excess of 10% in the total I&C market.
End of Q1 2021

Section 3 – Electricity
Page | 12
Table 6 Total NI market shares by connections
Source: NIEN
When looking at the electricity retail market as a whole by
connections (domestic and I&C customers), Power NI’s
leading position as the incumbent supplier has decreased
from 54.9% when compared to 55.9% for the same period in
Q1 2020.
The graph to the right shows the trends in market shares (by
customer numbers) for each active domestic and I&C supplier
in NI for the previous six quarters.
End of Q1 2021
Suppliers Total Power NI 493,480 54.9% SSE Airtricity 172,786 19.2% Electric Ireland 99,959 11.1% Budget Energy 93,434 10.4% Click Energy 30,359 3.4% Go Power 8,392 0.9% Naturgy 57 0.01% 3T Power 443 0.1% bright 246 0.03% Total Market 899,156 100%

Section 3 – Electricity
Page | 13
Electricity shares by consumption (GWh)
Table 7 Domestic market shares by consumption
Source NIEN
In Q1 2021, Power NI’s share of the market by consumption was 42.3%
for domestic prepayment and 60.6% for domestic credit, this is around
the same level when compared to Q1 2020 when Power NI’s domestic
prepayment market share was 42.3% and their domestic credit market
share was 61.6%.
The graph to the right shows the trends in market shares (by
consumption) for each active domestic supplier in NI for the previous six
quarters.
Q1 2021
Domestic Suppliers
Domestic Prepayment
Domestic credit Domestic Total
GWh % GWh % GWh %
Power NI 154.8 42.3% 296.5 60.6% 451.3 52.8% SSE Airtricity 61.3 16.8% 118.1 24.1% 179.4 21.0% Electric Ireland 43.1 11.8% 54.1 11.1% 97.2 11.4% Click Energy 27.5 7.5% 2.8 0.6% 30.3 3.5% Budget Energy 79.0 21.6% 15.6 3.2% 94.6 11.1% Go Power - 0% 1.8 0.4% 1.8 0.2% bright 0.04 0.01% 0.2 0.04% 0.2 0.02% Dom Market 365.7 100% 489.1 100% 854.8 100%

Section 3 – Electricity
Page | 14
Table 8 I&C market shares by consumption
Source: NIEN
The main suppliers by consumption in the I&C sector are Power NI
(33.9%), Electric Ireland (31.7%), SSE Airtricity (17.4%) and Go Power
(13.9%).
The graph to the right shows the trends in market shares (by
consumption) for each active I&C supplier in NI for the previous six
quarters.
Q1 2021
I&C Suppliers I&C < 20 MWh
I&C < 20 – 49 MWh
I&C 50 – 499 MWh
I&C 500 – 1,999 MWh
I&C 2,000 – 19,999 MWh
I&C ≥ 20,000 MWh
I&C Total
GWh % GWh % GWh % GWh % GWh % GWh % GWh % Power NI 55.5 53.7% 46.9 42.6% 105.1 35.7% 62.1 34.7% 108.7 34.5% 18.6 11.0% 396.9 33.9% SSE Airtricity 21.7 21.0% 26.7 24.2% 46.6 15.8% 23.7 13.3% 39.3 12.5% 46.0 27.3% 204.0 17.4% Go Power 10.9 10.6% 13.3 12.1% 38.7 13.1% 21.3 11.9% 29.7 9.4% 48.9 29.0% 162.8 13.9% Electric Ireland 13.4 13.0% 21.3 19.3% 88.0 29.9% 64.1 35.9% 129.9 41.2% 55.0 32.6% 371.7 31.7% Budget Energy 1.1 1.1% 1.5 1.4% 1.8 0.6% - 0.0% - 0.0% - 0.0% 4.4 0.4% Naturgy - 0.0% - 0.0% 0.9 0.3% 4.0 2.2% 3.1 1.0% - 0.0% 8.0 0.7% Click Energy 0.3 0.3% 0.2 0.2% 0.7 0.2% 0.4 0.2% 2.5 0.8% - 0.0% 4.1 0.4% 3T Power 0.4 0.4% 0.3 0.3% 13.0 4.4% 3.2 1.8% 2.1 0.7% - 0.0% 19.0 1.6% Total Market 103.3 100% 110.2 100% 294.8 100% 178.8 100% 315.3 100% 168.5 100% 1,170.9 100%

Section 3 – Electricity
Page | 15
Table 9 Total NI market shares by consumption
Source: NIEN
Electricity consumption in NI retail market for Q1 2021 was over
2,025 GWh, which indicates a year on year decrease when
compared to 2,082 GWh consumed in Q1 2020.
The graph to the right reflects the trends in market shares (by
total consumption) for each active domestic and I&C supplier in
NI for the previous six quarters.
Q1 2021
Total Market Total
GWh % Power NI 848.2 41.9% SSE Airtricity 383.4 18.9% Electric Ireland 468.9 23.1% Go Power 164.6 8.1% Click Energy 34.4 1.7% Budget Energy 99.0 4.9% Naturgy 8.0 0.4% 3T Power 19.0 0.9% bright 0.2 0.01% Total Market 2,025.7 100%

Section 3 – Electricity
Page | 16
3.3 Electricity market activity The line charts below reflect the change of customer numbers (gains per supplier), per market segment and anonymised supplier.

Section 3 – Electricity
Page | 17
The table below shows market activity through changes of supplier
(CoSs) on a quarterly basis in the whole NI market split by domestic
and I&C. These percentages are calculated using the number of
quarterly switches divided by the number of customers at the end of
the quarter in the relevant market.
Table 10 Electricity market activity
Source: NIEN
The number of domestic switches over this quarter decreased from
the previous quarter, with an average of c4,800 switches per month
compared to c8,900 switches per month for the previous quarter.
The percentage of domestic switching for Q1 2021 decreased from
3.3% to 1.8%.The I&C market activity also saw a decrease from
1.6% in Q4 2020 to 1.0% in Q1 2021.
3.4 Electricity prices For the electricity prices section, we follow Eurostat’s format and
methodology. As a result the average prices for NI are comparable
with prices in other EU countries (those published in the
6 https://w ww.gov.uk/government/collections/quarterly-energy-prices
Department for Business, Energy & Industrial Strategy’s (BEIS)
Quarterly Energy Prices reports6 and Eurostat data base7) once
these figures have been converted to GBP (Note: from 01 January
2021, BEIS no longer provide pricing data to Eurostat. Therefore,
the UK figures reported in the subsequent graphs have been
obtained directly from BEIS publicised data).
The base figures are all submitted on a quarterly basis by suppliers,
split by domestic and non-domestic (I&C). The UR performs a high
level reasonableness check of the base figures, but the suppliers
are responsible for the accuracy of the information that is provided
to the UR. The base figures are as follows:
Volume of electricity sold to consumers.
The value, or revenue gained from the sale, split into three
categories: excluding all taxes, excluding VAT, and including
all taxes.
The number of customers supplied in that particular size
category.
The volume and value are used to calculate a NI quarterly average
value per size band. This value per unit (per size band) is what we
refer to in this paper as “price”. For clarity we do not receive from
suppliers the actual price paid by their customers. Instead we
calculate the average value or revenue collected per unit in that
particular size category, as per the Eurostat methodology.
As the Eurostat figures are published on a semester basis
(semester 1 (S1) January to June and semester 2 (S2) July to
December) we therefore average the two relevant quarters to obtain
the comparable six-month period for NI.
7 http://ec.europa.eu/eurostat/w eb/energy/data/database
Q1 2021
Period Domestic Switching
I&C Switching
Total Switching
2019 Q4 33,895 4.2% 3,752 5.0% 37,647 4.2% 2020 Q1 27,061 3.3% 1,262 1.7% 28,323 3.2% 2020 Q2 10,919 1.3% 5,329 7.2% 16,248 1.8% 2020 Q3 18,287 2.2% 687 0.9% 18,974 2.1% 2020 Q4 26,938 3.3% 1,167 1.6% 28,105 3.1% 2021 Q1 14,512 1.8% 772 1.0% 15,284 1.7%

Section 3 – Electricity
Page | 18
It should be noted that the comparability of the derived NI
prices to the other Member States can be greatly affected by
fluctuations in the Euro GBP exchange rate. For the purposes
of tariff comparisons we convert the EU tariff data from Euro to GBP
using the monthly average exchange rate applicable for the
semester (published by Eurostat). Therefore tariff movements and
comparisons between NI and other Member States can be
impacted by both an increase and decrease in a tariff and/or also by
any variation in exchange rates.
The pricing data detailed in this QTR is for the semester 2 July
2020 to December 2020.
Domestic price comparison with EU
In the domestic graph shown below, we use unit prices that include
Climate Change Levy (CCL) and include VAT as this reflects the
final prices paid by domestic Customers. The medium sized
domestic customers (annual consumption of between 2,500 and
4,999 kWh) have been selected for the purpose of analysis, as this
consumption category reflects the majority of domestic customers in
NI.
In semester 2 2020 the NI price was below the EU median and
considerably less than RoI. At the time of publication, there was no
UK medium domestic figure available from BEIS and the UK figure
used is for semester 1 2020. This will be updated during the next
publication of the QTR (pending availability of data).
8 Some graphs do not include all 15 EU countries due to availability of data from
Eurostat.
I&C price comparison with EU
The following graphs show I&C electricity prices in the 15 EU8
countries (converted to GBP) and in NI, per consumption size
bands (following standard EU categorisation). The I&C graphs use
unit prices which include Climate Change Levy (CCL) but exclude
VAT, as VAT is a refundable expense for many businesses. This
reflects the final prices paid by I&C customers. We amalgamate the
two largest categories of annual consumption (large and very large
connections) to avoid any confidentiality issues in sectors where
there are a small number of customers and suppliers involved.
For the Very Small I&C Category9 the NI prices are lower than the
EU median, UK and significantly lower than RoI (c72% of I&C
connections in NI are in this size category). For large and very large
I&C customers (c0.02% of connections), NI prices are just above
RoI but at below the UK.

Section 3 – Electricity
Page | 19
Table 11 Electricity market % by I&C consumption band
10 The pricing data relates period end Q4 2020 (S2 July - December 2020) as opposed to Q1 2021. This is due to the availability of pricing data from Eurostat, BEIS and suppliers.
Source: NI electricity suppliers, Eurostat, BEIS and UR internal calculations
End of Q4 202010
Size of customer Annual
consumption bands (MWh)
% of I&C connections
% of I&C consumption
I&C
connection
numbers
Very small < 20 71.8% 8.0% 53,212
Small 20 – 499 26.9% 35.7% 19,889
Small / Medium 500 – 1,999 1.0% 15.5% 714
Medium 2,000 – 19,999 0.3% 26.8% 231
Large & Very Large >20,000 0.02% 14.0% 16
Source: NIEN

Section 4 – Gas in the Greater Belfast area
Page | 20
Gas in the Greater Belfast area (PNGL)

Section 4 – Gas in the Greater Belfast area
Page | 21
4.1 Connections and consumption in the Greater Belfast area
The table below shows gas connection numbers in the Greater Belfast area at the end of March 2021 and the consumption in this area during
January to March 2021
Table 12 Gas connections and consumption per market segment in the Greater Belfast area
At the end of March 2021, the domestic and small I&C connections represent 98.6% of the total connections and 63.4% by consumption. The
remaining 1.4% of connections are medium and large I&C which represent 36.6% of consumption.
Within the domestic sector, 63.9% of the connections use prepayment meters and 36.1% use credit meters to pay for their gas.
11 Gas consumption is presented in MWh (previously up to 2015 gas consumption w as presented in Therms in the QTRs. 12 The domestic and small I&C sector relates to any customers using less than 73,200 kWh per annum. The consumption information for domestic credit and small I&C are
combined as this information is not available separately. 13 The medium and large I&C sector relates to any customers w ith annual consumption that is greater than or equal to 73,200 kWh per annum.
Q1 2021
Market sector Number of
connections % share of
connections in sector Consumption
(MWh)11 % share of
consumption in sector
Domestic prepayment 141,527 61.6% 568,796 49.3%
Domestic credit 79,938 34.8% 584,713 50.7%
I&C < 73,200 kWh 8,294 3.6%
Total Domestic and Small I&C12 229,759 100% 1,153,509 100%
I&C 73,200 to 732,000 kWh 2,762 87.4% 219,007 32.9%
I&C 732,001 to 2,196,000 kWh 278 8.8% 126,182 18.9%
I&C > 2,196,000 kWh 121 3.8% 321,333 48.2%
Medium & Large I&C13 3,161 100% 666,522 100%
Total 232,920 1,820,031
Source: PNGL

Section 4 – Gas in the Greater Belfast area
Page | 22
The charts below show the numbers of gas connections in the Greater Belfast area at the end of March 2021 and the consumption in this area during January to March 2021.

Section 4 – Gas in the Greater Belfast area
Page | 23
4.2 Gas market shares in the Greater Belfast area This section provides information on the connection numbers and consumption, by supplier, in the Greater Belfast area. The market shares in
terms of connections are as at the end of March 2021 and the market shares in terms of consumption are for the period January to March
2021. There are five suppliers in the domestic and small I&C sector, although only two of these suppliers are active in the domestic market. In
the medium and large I&C market there are currently six active suppliers.
Gas shares by connections numbers
The table below shows the market shares for each supplier within the domestic and small I&C sector in the Greater Belfast are a. The market
shares are shown as number of connections per supplier and as a percentage share within the sector (as at the end of March 2021).
Table 13 Domestic and small I&C14 market shares by connections
In terms of market shares by connections, SSE Airtricity (the incumbent supplier) retains a significant share of the domestic and small I&C market of currently 77.5%.
14 The domestic and small I&C sector relates to any customers using less than 73,200 kWh per annum.
End of Q1 2021
Supplier Domestic
prepayment Domestic
Credit I&C
< 73,200 kWh Total for Domestic
and Small I&C
SSE Airtricity 106,254 75.1% 66,591 83.3% 5,284 63.7% 178,129 77.5%
firmus energy 35,273 24.9% 13,340 16.7% 1,316 15.9% 49,929 21.7%
Naturgy - 0% - 0% 5 0.1% 5 0.002%
Go Power - 0% 7 0.01% 752 9.1% 759 0.3%
Flogas - 0% - 0% 937 11.3% 937 0.4%
Total 141,527 100% 79,938 100% 8,294 100% 229,759 100%
Source: PNGL

Section 4 – Gas in the Greater Belfast area
Page | 24
The table below shows the market shares for each supplier within the medium and large I&C sector (i.e. I&Cs with consumption over 73,200
kWh per annum) in the Greater Belfast area at the end of March 2021. The corresponding graph shows the change in market shares by supplier within the same sector over the last eighteen months.
Table 14 Medium and large I&C15 market shares by connections
Competition in the medium and large I&C market is more active in the Greater Belfast area.
At the end of Q1 2021, SSE and firmus continue to have the majority share of the medium
and large I&C market, with 34.1% and 32.0% respectively. Out of the six active suppliers at
the end of Q1 2021, based on connections, four of these have market shares in excess of
15% of the total I&C market.
15 The medium and large I&C sector relates to any customers w ith annual consumption that is greater than or equal to 73,200 kWh per annum.
End of Q1 2021
Supplier I&C
73,200 to 732,000 kWh
I&C 732,001 to
2,196,000 kWh
I&C > 2,196,000 kWh
Total for Medium and Large I&C
SSE Airtricity 945 34.2% 99 35.6% 34 28.1% 1,078 34.1%
firmus energy 881 31.9% 91 32.7% 39 32.2% 1,011 32.0%
Naturgy 10 0.4% - 0% 2 1.7% 12 0.4%
Electric Ireland - 0% - 0% 7 5.8% 7 0.2%
Go Power 429 15.5% 62 22.3% 39 32.2% 530 16.8%
Flogas 497 18.0% 26 9.4% - 0% 523 16.5%
Total 2,762 100% 278 100% 121 100% 3,161 100%
Source: PNGL

Section 4 – Gas in the Greater Belfast area
Page | 25
Gas shares by consumption16
This section provides information on the consumption, by supplier, in the Greater Belfast area during Q1 2021. The table below shows the
market shares for each supplier within the domestic and small I&C sector in the Greater Belfast area.
Table 15 Domestic and small I&C17 market shares by consumption
SSE Airtricity has retained the majority of the domestic and small I&C market share in the Greater Belfast area. Based on consumption their
percentage market share in Q1 2021 was 75.6% compared with 74.8% in the same period last year. firmus energy’s market share for the
period Q1 2021 was 22.8% (compared with 23.6% for the same period the previous year).
The market share of the remaining suppliers based on consumption levels continues to be minimal as they are not active in the domestic
market and supply only to a limited number of small I&C customers.
16 Gas consumption is presented in this QTR in MWh. 17 The domestic and small I&C sector relates to any customers using less than 73,200 kWh per annum.
Q1 2021
Supplier
Total for Domestic and Small I&C Sector
(MWh) % share
SSE Airtricity 871,862 75.6%
firmus energy 263,528 22.8%
Naturgy 40 0.003%
Go Power 7,576 0.7%
Flogas 10,503 0.9%
Total 1,153,509 100%
Source: PNGL

Section 4 – Gas in the Greater Belfast area
Page | 26
The table below shows the market shares for each supplier within the medium and large I&C sector (i.e. those using at least 73,200 kWh per
annum) in the Greater Belfast area during Q1 2021. The corresponding graph shows the change in market shares by supplier within the same
sector over the last eighteen months.
Table 16 Medium and large I&C18 market shares by consumption
Market share by consumption fluctuates throughout the year due to the movement of
customers between suppliers, and also due to the amount of gas consumed by each
customer during different seasons (as gas usage can be weather dependent for many, but
not all, customers).
SSE Airtricity and firmus energy both have the majority share by consumption in the medium and large I&C market with 35.0% and 27.9%
respectively.
18 The medium and large I&C sector relates to any customers w ith annual consumption that is greater than or equal to 73,200 kWh per annum.
Q1 2021
Supplier
I&C 73,200 to
732,000 kWh
I&C 732,001 to
2,196,000 kWh
I&C > 2,196,000
kWh
Total for Medium and Large I&C
(MWh) %
share (MWh)
% share
(MWh) %
share (MWh)
% share
SSE Airtricity 77,773 35.5% 48,695 38.6% 106,702 33.2% 233,170 35.0%
firmus 76,288 34.8% 38,111 30.2% 71,583 22.3% 185,982 27.9%
Naturgy 815 0.4% - 0% 5,426 1.7% 6,241 0.9%
Electric Ireland
- 0% - 0% 43,395 13.5% 43,395 6.5%
Go Power 31,540 14.4% 28,435 22.5% 94,227 29.3% 154,202 23.1%
Flogas 32,591 14.9% 10,941 8.7% - 0% 43,532 6.5%
Total 219,007 100% 126,182 100% 321,333 100% 666,522 100%
Source: PNGL

Section 4 – Gas in the Greater Belfast area
Page | 27
4.3 Market activity in the Greater Belfast area
The line charts below reflect the number of switching gains per market sector in the Greater Belfast area. The switching gains are displayed by
supplier; however the supplier names have been anonymised. Note that prepayment switches, within the domestic sector, include switches
back to the previous supplier in cases where the customer has not taken the required action to complete their switch.

Section 4 – Gas in the Greater Belfast area
Page | 28
There are only two active suppliers in the domestic market. The I&C graphs above represent the split between the small and medium I&C
customers (i.e. customers consuming less than 732,000 kWh per annum) and large I&C consumers (i.e. consuming more than 732,000 kWh
per annum).
The table below shows market activity through the number of customer switches on a quarterly basis in the Greater Belfast gas market an d the
associated percentage switching rate. The switching rate percentages are calculated using the number of quarterly switches divided by the
number of customers at the end of the quarter in the relevant market.
Table 17 Quarterly market activity in the Greater Belfast area
The graph to the right represents the total number of switches
completed on a quarterly basis, split by the domestic and I&C markets.
With the exception of spikes in Q1 2020 and Q2 2021, the graph shows
that the overall level of switching has remained around 0.1%.
The domestic switching for the period Q1 2021 remained static at 0.1%. I&C switching saw an increase from 0.6% to 3.4% over the same
period.
Period Domestic Switching
I&C Switching
Total Switching
2019 Q4 258 0.1% 91 0.8% 349 0.2%
2020 Q1 399 0.2% 382 3.4% 781 0.4%
2020 Q2 184 0.1% 58 0.5% 242 0.1%
2020 Q3 110 0.1% 124 1.1% 234 0.1%
2020 Q4 165 0.1% 73 0.6% 238 0.1%
2021 Q1 235 0.1% 388 3.4% 623 0.3%
Source: PNGL

Section 5 – Gas in the Ten Towns area
Page | 29
Gas in the Ten Towns area (FeDL)

Section 5 – Gas in the Ten Towns area
Page | 30
5.1 Connections and consumption in the Ten Towns area
The table below shows gas connection numbers in the Ten Towns area at the end of March 2021 and the consumption in this area during
January to March 2021.
Table 18 Gas connections and consumption per market segment in the Ten Towns area
At the end of March 2021, the domestic and small I&C connections represent 97.8% of the total connections and 36.4% of consumption. The
remaining 2.2% are medium and large I&C connections and represent 63.6% of total consumption in this area.
Within the domestic sector, 81.5% of the domestic connections use prepayment meters and 18.5% use credit meters to pay for their gas.
The charts on the following page show the numbers of gas connections in the Ten Towns area at the end of March 2021 and the consumption in this area during January to March 2021.
19 Gas consumption is presented in this QTR in MWh. It is important to note that gas consumption w as presented in Therms in the QTRs for 2015 and previous years. 20 The domestic and small I&C sector relates to any customers using less than 73,200 kWh per annum. The consumption information for domestic credit and small I&C are
combined as this information is not available to us w ith a full split. 21 The medium and large I&C sector relates to any customers w ith annual consumption that is greater than or equal to 73,200 kWh per annum.
Q1 2021
Market segment Number of
connections % share of
connections in sector Consumption
(MWh)19 % share of
consumption in sector
Domestic prepayment 43,345 79.1% 173,578 71.0% Domestic credit 9,864 18.0% 70,959 29.0%
I&C < 73,200 kWh 1,588 2.9%
Total Domestic and Small I&C20 54,797 100% 244,537 100% I&C 73,200 to 732,000 kWh 981 79.6% 86,892 20.3%
I&C 732,001 to 2,196,000 kWh 165 13.4% 70,187 16.4% I&C > 2,196,000 kWh 87 7.1% 270,688 63.3% Medium & Large I&C21 1,233 100% 427,767 100%
Total 56,030 672,304
Source: feDL

Section 5 – Gas in the Ten Towns area
Page | 31

Section 5 – Gas in the Ten Towns area
Page | 32
5.2 Gas market shares in the Ten Towns area
This section provides information on the connection numbers and consumption, by supplier, in the Ten Towns area. The market shares in
terms of connections are as at the end of March 2021 and the market shares in terms of consumption are for the period January to March
2021.
Competition opened in the Ten Towns large I&C market (>732,000 kWh per annum) in October 2012. The remainder of the market op ened to
competition in April 2015. There were four suppliers in the domestic and small I&C sector during Q1 2021, although only one supplier was
active in the domestic market (the incumbent supplier). In the medium and large I&C market there were six active suppliers.
Gas shares by connections numbers
The table below shows the market shares for each supplier within the domestic and small I&C sector in the Ten Towns area.
Table 19 Domestic and small I&C22 market shares by connections
firmus energy, the incumbent supplier, is the only domestic supplier in the Ten Towns area. In terms of market share by connections, firmus
energy retains the majority of the small I&C market with 64.0% share at the end of Q1 2021. The competing suppliers in the small I&C market,
SSE Airtricity, Go Power and Flogas have been steadily increasing their market shares since entering the I&C market. At the end of Q1 2021,
the collective market share of these three suppliers was 36.0%.
22 The domestic and small I&C sector relates to any customers using less than 73,200 kWh per annum.
End of Q1 2021
Supplier Domestic
prepayment Domestic
credit I&C
< 73,200 kWh Total for Domestic
and Small I&C
SSE Airtricity - 0% - 0% 104 6.5% 104 0.2%
firmus energy 43,345 100% 9,864 100% 1,017 64.0% 54,226 98.9% Go Power - 0% - 0% 138 8.7% 138 0.3%
Flogas - 0% - 0% 329 20.7% 329 0.6%
Total 43,345 100% 9,864 100% 1,588 100% 54,797 100%
Source: feDL

Section 5 – Gas in the Ten Towns area
Page | 33
The following table shows the market shares for each supplier within the medium and large I&C sector (i.e. I&Cs with consumption over 73,200
kWh per annum) in the Ten Towns area at the end of Q1 2021. The corresponding graph shows the change in market shares by supplier within
the same sector over the last eighteen months.
Table 20 Medium and large I&C23 market shares by connections
Competing suppliers are more active in the medium and large I&C market than the small
I&C market in the Ten Towns area.
Overall in the medium and large sector market shares of SSE Airtricity, Flogas and Go
Power were 20.4%, 16.9% and 12.6% respectively at the end of March 2021. The market
share of firmus energy, the incumbent supplier, stands at 49.6%.
23 The medium and large I&C sector relates to any customers w ith annual consumption that is greater than or equal to 73,200 kWh per annum.
End of Q1 2021
Supplier I&C
73,200 to 732,000 kWh
I&C 732,001 to
2,196,000 kWh
I&C > 2,196,000
kWh
Total for Medium and Large I&C
SSE Airtricity 183 18.7% 47 28.5% 21 24.1% 251 20.4%
firmus energy 486 49.5% 82 49.7% 44 50.6% 612 49.6%
Naturgy - 0% - 0% - 0% - 0%
Go Power 117 11.9% 23 13.9% 15 17.2% 155 12.6%
Flogas 195 19.9% 13 7.9% - 0.0% 208 16.9%
Electric Ireland - 0% - 0% 7 8.1% 7 0.6%
Total 981 100% 165 100% 87 100% 1,233 100%
Source: feDL

Section 5 – Gas in the Ten Towns area
Page | 34
Gas shares by consumption (MWh24)
This section provides information on the consumption, by supplier, in the Ten Towns area. The market shares in terms of consumption are for
the period from January to March 2021.
Table 21 Domestic and small I&C25 market shares by consumption
As firmus energy is the only supplier in the domestic market they hold the large majority of the market share by consumption in the domestic
and small I&C sector.
The other competing suppliers in the small I&C section of this market (SSE Airtricity, Go Power and Flogas) have been active since Q3 2015.
During Q1 2021 their combined market share in terms of consumption in the domestic and small I&C market was 2.8%. This is a similar level
when compared to the same quarter last year (2.6%).
24 Gas consumption is presented in this QTR in MWh. It is important to note that gas consumption w as presented in Therms in the QTRs for 2015 and previous years. 25 The domestic and small I&C sector relates to any customers using less than 73,200 kWh per annum.
Q1 2021
Supplier Total for Domestic and Small I&C
Sector
(MWh) % share
SSE Airtricity 1,340 0.6%
firmus energy 237,811 97.2%
Go Power 1,528 0.6%
Flogas 3,857 1.6%
Total 244,537 100%
Source: feDL

Section 5 – Gas in the Ten Towns area
Page | 35
The table below shows the market shares for each supplier within the medium and large I&C sector (I&Cs using more than 73,200 kWh per
annum) in the Ten Towns area during Q1 2021.
Table 22 Medium and large I&C26 market shares by consumption
In terms of market share by consumption, firmus energy retains the largest share of the
medium and large I&C sector. At the end of Q1 2021, firmus energy has 52.0% share of this
market sector, which is a decrease when compared to Q1 2020 (55.2%).
26 The medium and large I&C sector relates to any customers w ith annual consumption that is greater than or equal to 73,200 kWh per annum.
Q1 2021
Supplier
I&C 73,200 to
732,000 kWh
I&C 732,001 to
2,196,000 kWh
I&C > 2,196,000
kWh
Total for Medium and Large I&C
(MWh) %
share (MWh)
% share
(MWh) %
share (MWh)
% share
SSE Airtricity 18,906 21.8% 21,798 31.1% 70,872 26.2% 111,576 26.1%
firmus energy 42,603 49.0% 35,366 50.4% 144,374 53.3% 222,343 52.0%
Naturgy - 0% - 0% 316 0.1% 316 0.1%
Go Power 11,182 12.9% 8,335 11.9% 19,845 7.3% 39,362 9.2%
Flogas 14,184 16.3% 4,688 6.7% 56 0.02% 18,928 4.4%
Electric Ireland 17 0.02% - 0% 35,225 13.0% 35,242 8.2%
Total 86,892 100% 70,187 100% 270,688 100% 427,767 100%
Source: feDL

Section 5 – Gas in the Ten Towns area
Page | 36
5.3 Market activity in the Ten Towns area
The line graphs below reflect the number of switching gains in the
I&C market sector in the Ten Towns area. The switching gains are
displayed by supplier; however the supplier names have been
anonymised. There is no information provided on domestic
switching in the Ten Towns area as there are no competing
suppliers in the domestic market.
The table below shows market activity through the number of
switches on a quarterly basis in the Ten Towns gas market and the
associated percentage switching rate. The switching rate
percentages are calculated using the number of quarterly switches
divided by the number of customers at the end of the quarter in the
relevant market.
Table 23 I&C activity in the Ten Towns area
2019 Q4 36 1.3%
2020 Q1 26 0.9%
2020 Q2 117 4.2% 2020 Q3 32 1.1%
2020 Q4 12 0.4%
2021 Q1 11 0.4%
Source: feDL
The overall level of switching has been consistently low in the Ten
Towns and following an increase in I&C switches during Q2 2020,
the level of switching has continued to decrease and in the current
quarter switching levels are at their lowest for the last six quarters at
0.4%.

Section 6 - West
Page | 37
Gas in the West Area (SGN NG)

Section 6 - West
Page | 38
6.1 Connections and consumption in the West area
The table below shows gas connection numbers in the West area at the end of March 2021 and the consumption in this area during January to
March 2021
Table 24 Gas connections and consumption per market segment in the West area
At the end of March 2021, the domestic and small I&C connections represent 98.1% of the total connections and 4.3% of consumption. The
remaining 1.9% are medium and large I&C connections and represent 95.7% of total consumption in this area. Within the domestic sector,
66.8% use prepayment meters and 33.2% use credit meters to pay for their gas.
There are now 5 active suppliers in the West area, namely SSE Airtricity Gas NI (as the commissioning domestic supplier), with Electric Ireland,
firmus energy, Flogas and Go Power active in the I&C market.
28 The domestic and small I&C sector relates to any customers using less than 73,200 kWh per annum. The consumption information for domestic credit and small I&C are
combined as this information is not available to us w ith a full split. 29 The medium and large I&C sector relates to any customers w ith annual consumption that is greater than or equal to 73,200 kWh per annum.
Q1 2021
Market segment Number of
connections
% share of connections
in sector
Consumption (MWh)27
% share of consumption
in sector Domestic prepayment 1,011 66.1% 4,291 63.4%
Domestic credit 503 32.9% 2,477 36.6%
I&C < 73,200 kWh 16 1.0% Total Domestic and Small I&C28 1,530 100% 6,769 100% I&C 73,200 to 732,000 kWh 11 36.7% 1,151 0.8% I&C 732,001 to 2,196,000 kWh 5 16.7% 1,870 1.2% I&C > 2,196,000 kWh 14 46.7% 147,756 98.0%
Medium & Large I&C29 30 100% 150,777 100%
Total 1,560 157,546
Source: SGN NG

Section 6 - West
Page | 39

Section 7 – Gas Prices
Page | 40
Gas prices 7.1 Comparison against EU prices
The gas prices section, also follows the Eurostat format and
methodology (as outlined in section 3.4 electricity prices). As a
result the average prices for NI are comparable with prices in other
EU countries (those published in BEIS’s Quarterly Energy Prices
reports30 and Eurostat data base31) once these figures have been
converted to GBP.
The pricing data detailed in this QTR is for the semester July to
December 2020 (semester 2). In the domestic graph show below,
we use unit prices which include Climate Change Levy (CCL) and
includes VAT, as this reflects the final prices paid by domestic
customers. The medium sized domestic customers (annual
consumption between 5,557 - 55,557 kWh) have been selected for
the purpose of analysis, as this consumption category reflects the
majority of domestic customers in NI.
30 https://w ww.gov.uk/government/collections/quarterly-energy-prices
Source: Eurostat and NI gas suppliers collated by UR
The NI unit price is the average pence per kWh for medium
customers for the Greater Belfast, Ten Towns and West network
areas. The NI domestic gas prices still rank among the lowest in the
EU. The NI gas prices is less than RoI and the EU median. It should
be noted that the vast majority of NI domestic gas connections are
customers of the relevant network incumbent suppliers and are
therefore subject to their regulated tariffs.
At the time of publication, there was no UK medium domestic figure
available from BEIS (and the semester 1 2020 prices are used).
This will be updated during the next publication of the QTR
(pending availability of data).
31 http://ec.europa.eu/eurostat/w eb/energy/data/database

Section 7 – Gas Prices
Page | 41
During the period illustrated in the graph (Semester 2: July to December 2020), there was a decrease to the regulated tariff within the Ten
Towns area. Further detail on these regulated tariffs are available in the UR tariff review briefing notes32. The table below illustrates the
regulated tariffs for S2 2020 period.
Table 25 Regulated Gas Supply Tariffs
32 Firmus energy (Supply) Ltd October 2020 UR tariff review for the Ten Tow ns is available here. Latest SSE Airtricity Gas Supply (NI) Ltd UR tariff review for Greater Belfast &
West April 2020 is available here.
01 April to 30 September Greater Belfast SSE Airtricity
Ten Towns firmus energy
Domestic Regulated Tariff Usage for first 2,000 kWh
5.291 p/kWh 5.760p/kWh
Domestic Regulated Tariff Usage >2,000 kWh
3.626 p/kWh 3.880 p/kWh
Following Regulated Tariff Reviews: 01 October to Present Greater Belfast
& West SSE Airtricity
Ten Towns firmus energy
Domestic Regulated Tariff Usage for first 2,000 kWh
5.291 p/kWh 5.04 p/kWh
Domestic Regulated Tariff Usage >2,000 kWh
3.626 p/kWh 3.40 p/kWh

Page | 42
Glossary
CCL The Climate Change Levy (CCL) is a tax on electricity,
gas and solid fuels delivered to I&C consumers. Its
objective is to encourage businesses to reduce their
energy consumption or use energy from renewable
sources. The rate changes every year.
CoS Change of supplier
EU European Union
Eurostat Statistical office of the EU. Its task is to provide the EU
with statistics at European level that enable
comparisons between countries and regions
feDL firmus energy (Distribution) Limited
firmus
energy
firmus energy (Supply) Limited
GB Great Britain
GBP Great British Pound
I&C Industrial and Commercial
kWh Kilowatt hour. Unit of energy equivalent to one kilowatt
(1kW) of power expended for one hour (1h) of time.
1,000kWh = 1MWh. 1,000MWh = 1GWh.
NI Northern Ireland
NIEN Northern Ireland Electricity Networks
LEU Large Energy Users
Ofgem Office of the Gas and Electricity Markets
PNGL Phoenix Natural Gas Limited
Q Quarter. In this report, Q refers to the calendar year
(i.e. Q1 refers to the quarter January-March).
QTRs Quarterly Transparency Reports published by the UR
at the end of the second month after each calendar
quarter (at the end of Feb, May, Aug and Nov).
REMM Retail Energy Market Monitoring
RoI Republic of Ireland
SGN NG SGN Natural Gas
S1 Semester 1
S2 Semester 2
UR Utility Regulator
VAT Value Added Tax
UK United Kingdom
Page | 43
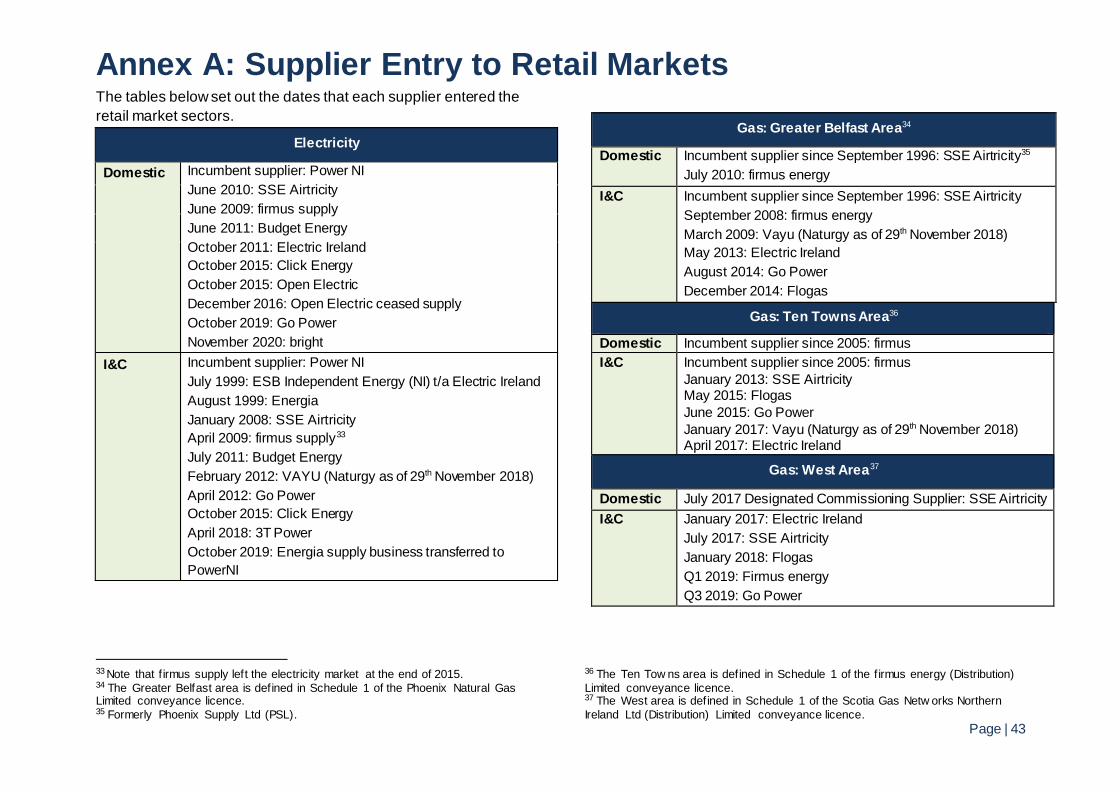
Annex A: Supplier Entry to Retail Markets The tables below set out the dates that each supplier entered the
retail market sectors.
Electricity
Domestic Incumbent supplier: Power NI
June 2010: SSE Airtricity
June 2009: firmus supply
June 2011: Budget Energy
October 2011: Electric Ireland
October 2015: Click Energy
October 2015: Open Electric
December 2016: Open Electric ceased supply
October 2019: Go Power
November 2020: bright
I&C Incumbent supplier: Power NI
July 1999: ESB Independent Energy (NI) t/a Electric Ireland
August 1999: Energia
January 2008: SSE Airtricity
April 2009: firmus supply33
July 2011: Budget Energy
February 2012: VAYU (Naturgy as of 29th November 2018)
April 2012: Go Power
October 2015: Click Energy
April 2018: 3T Power
October 2019: Energia supply business transferred to
PowerNI
33 Note that f irmus supply left the electricity market at the end of 2015. 34 The Greater Belfast area is defined in Schedule 1 of the Phoenix Natural Gas Limited conveyance licence. 35 Formerly Phoenix Supply Ltd (PSL).
Gas: Greater Belfast Area34
Domestic Incumbent supplier since September 1996: SSE Airtricity35
July 2010: firmus energy
I&C Incumbent supplier since September 1996: SSE Airtricity
September 2008: firmus energy
March 2009: Vayu (Naturgy as of 29th November 2018)
May 2013: Electric Ireland
August 2014: Go Power
December 2014: Flogas
Gas: Ten Towns Area36
Domestic Incumbent supplier since 2005: firmus
I&C Incumbent supplier since 2005: firmus
January 2013: SSE Airtricity May 2015: Flogas
June 2015: Go Power
January 2017: Vayu (Naturgy as of 29th November 2018) April 2017: Electric Ireland
Gas: West Area37
Domestic July 2017 Designated Commissioning Supplier: SSE Airtricity
I&C January 2017: Electric Ireland
July 2017: SSE Airtricity
January 2018: Flogas
Q1 2019: Firmus energy
Q3 2019: Go Power
36 The Ten Tow ns area is defined in Schedule 1 of the f irmus energy (Distribution)
Limited conveyance licence. 37 The West area is defined in Schedule 1 of the Scotia Gas Netw orks Northern
Ireland Ltd (Distribution) Limited conveyance licence.