retail prices after 1850 - the national bureau of economic research
TRANSCRIPT

This PDF is a selection from an out-of-print volume from the NationalBureau of Economic Research
Volume Title: Trends in the American Economy in the Nineteenth Century
Volume Author/Editor: The Conference on Research in Income andWealth
Volume Publisher: Princeton University Press
Volume ISBN: 0-870-14180-5
Volume URL: http://www.nber.org/books/unkn60-1
Publication Date: 1960
Chapter Title: Retail Prices after 1850
Chapter Author: Ethel D. Hoover
Chapter URL: http://www.nber.org/chapters/c2476
Chapter pages in book: (p. 141 - 190)

Retail Prices after I8soETHEL D. HOOVER
DEPARTMENT OF LABOR, BUREAU OF LABOR STATISTICS
MEASUREMENTS of price changes during the nineteenth century havebeen needed for many purposes, especially for studies of business cyclesand purchasing power. However, most attempts to determine relation-ships between price changes and other variables revealed wide gaps inthe available price data. Differences in commodity coverage, methodsof calculation, and the adequacy of prices and weights affected thetiming and amplitude of the changes recorded.
Valuable additions to our knowledge of this period have beendeveloped through individual or group research in surviving pricerecords. The reservoir of price statistics now available for the develop-ment of annual estimates of national income back to 1800 has beenreviewed and summarized elsewhere by the author.1
The most serious inadequacies are the sparseness of measures at theretail level and the lack of coverage of manufactured products at bothwholesale and retail. This paper adds to the available evidence onretail price movements by presenting consumer price indexes for 1851to 1880, with fairly crude estimates for the next ten ycars, to provide alink with similar indexes from 1890 to date. Improvements to the esti-mates will undoubtedly be made sometime in the future; but, for thepresent, the quantity and quality of the basic price and weighting dataimpose limitations on precision that cannot be removed by refinementsin calculation techniques. A description of the materials and methodsused to obtain summary figures is presented below along with a com-parison of the index with earlier estimates.
Consumer Price Indexes, 1851—1880Consumer price indexes were computed for the years 1851 to 1880,
utilizing most of the retail price data available and employing currently' Sources of prices and weights, methods employed for averaging, and other details
provided by investigators, along with some comments on probable validity, are presentedin Ethel D. Hoover, "Wholesale and Retail Prices in the Nineteenth Century," in theSeptember 1958 issue of the Journal of Economic History. This article was originallypresented to the conference as part of the discussion on price changes in the nineteenthcentury.
Note: The consumer price indexes presented in this paper are not to be consideredofficial indexes of the Bureau of Labor Statistics. The author wishes to express her appre-ciation to the BLS for the assistance of Mrs. Margaret W. Smith and others in the tabulatingand computing stages and to Dr. Dorothy S. Brady for her helpful suggestions.
141

OUTPUT GROWTH AND PRICE TRENDS: U.S.
accepted calculation techniques. These indexes for all items, for majorgroups, and for special groups are presented in Tables 1 and 2. Chart 1shows the movement of selected major groups compared with the allitems index.
There were few major changes in retail prices between 1851 and 1860.Foods, and fuel and light increased moderately, probably reflecting thedemand for food for Europe during the Crimean War, the gold dis-coveries in California, and a building boom which tapered off by themid-fifties. The financial difficulties of 1857 brought only minor priceadjustments.
TABLE IConsumer Price Indexes for the United States, by Major Group, 1851—1880
(1860 = 100)
A/I Fuel andYear items Food Clothing Rent Light Other
1851 92 86 100 100 951852 93 87 101 100 99 951853 93 88 100 100 102 951854 101 100 100 102 113 961855 104 105 99 103 109 971856 102 102 100 103 106 961857 105 108 100 100 109 981858 99 99 99 100 103 981859 100 102 98 100 98 99
1860 100 100 100 100 100 1001861 101 99 110 95 103 1021862 113 107 143 101 112 105
1863 139 129 197 113 136 115
1864 176 167 261 130 155 141
1865 175 170 238 134 159 1471866 167 169 194 138 152 1461867 157 163 166 135 140 1441868 154 1164 148 138 133 1441869 147 151 148 [41 132 145
1870 141 143 141 142 126 1431871 135 137 128 144 125 1421872 135 136 126 144 122 141
1873 133 136 122 139 120 1421874 129 134 115 133 114 141
1875 123 129 105 129 110 1401876 119 124 104 123 106 138
1877 118 125 99 123 98 138
1878 III 113 95 124 93 1351879 108 110 94 122 92 134
1880 110 111 94 127 95 133
Price indexes for the individual commodities and services included in these summaryfigures are given in Appendix A. The sources of the figures in this and the followingtables are described in the text and the text footnotes.
142

RETAIL PRICES AFTER 1850
TABLE 2Consumer Price Indexes for the United States, by Special Group, 1851—1880
(1860 = 100)
All ItemsYear All lienis Less Food
All ItemsLess Rent
All Items LessFood and Rent
1851 92 99 90 991852 93 100 91 1001853 93 100 92 1001854 101 103 101 103
1855 104 102 104 1021856 102 102 102 101
1857 105 102 106 1021858 99 100 99 1001859 100 99 101 98
1860 100 100 100 1001861 101 103 102 1071862 113 120 115 131
1863 139 151 144 1731864 176 187 185 222
1865 175 181 183 2091866 167 163 172 1781867 157 149 161 157
1868 154 141 157 143
1869 147 141 148 141
1870 141 137 141 135
1871 135 133 134 127
1872 135 132 133 125
1873 133 128 131 1221874 129 122 128 116
1875 123 116 122 108
1876 119 113 118 106
1877 118 109 117 101
1878 111 107 108 961879 108 105 105 95
1880 110 108 106 96
inflation during the Civil War and the protracted declinethereafter affected all the major groups. Clothing prices reached a peakin 1864, at a level 161 per cent higher than in 1860, but declined sharplythe following year. Retail clothing prices showed slightly more rise thanprices of textile products at wholesale, probably because of shortages ofshoes and dry goods for civilians (or inadequacies in the data). Thepeak levels for all other groups except rents were reached in 1865. Rentscontinued rising until 1872 when they too joined the general decline.Rents and the "other" group (made up primarily of medical care andnewspapers) exhibited the slower upward and downward movements
143

260
250
240
230
220
210
200
190
180
170
160
150
140
130
120
110
100
90
80
OUTPUT GROWTH AND PRiCE TRENDS: U.S.
CHART 1
Consumer Prices Indexes for All Items, Food, Clothing, Rent,and Fuel and Light, 1851—1880
144
Index270
1850 1855 1860 1865 1870 1875 I 880

RETAIL PRICES AFTER 1850
CHART I continued
1880
characteristic of these items. The percentage changes by periods for allitems and for major groups are shown in Table 3.
TABLE 3Changes in Consumer Price Indexes, by Major Group, Selected Periods, 1851—1880
(per cent)
PeriodAll
Items Food Clothing RentFuel and
Light Other
1851—55 +13 +22 — I + 3 +10 + 21855—60 —4 —5 + 1 —3 —8 +31860-65 +75 +70 +138 +34 +59 +471865—70 —19 —16 — 41 + 6 —21 — 31870—75 —13 —10 — 26 — 9 —13 — 21875—80 —11 —14 — 10 — 2 —14 — 5
Sources of Data and Methods of CalculationSOURCES OF PRICES
Retail price data employed in the construction of these indexes weretaken almost entirely from the "Report on the Average Retail Prices of
145
Index
1860 1865 1870 1875
OUTPUT GROWTH AND PRICE TRENDS: U.S.
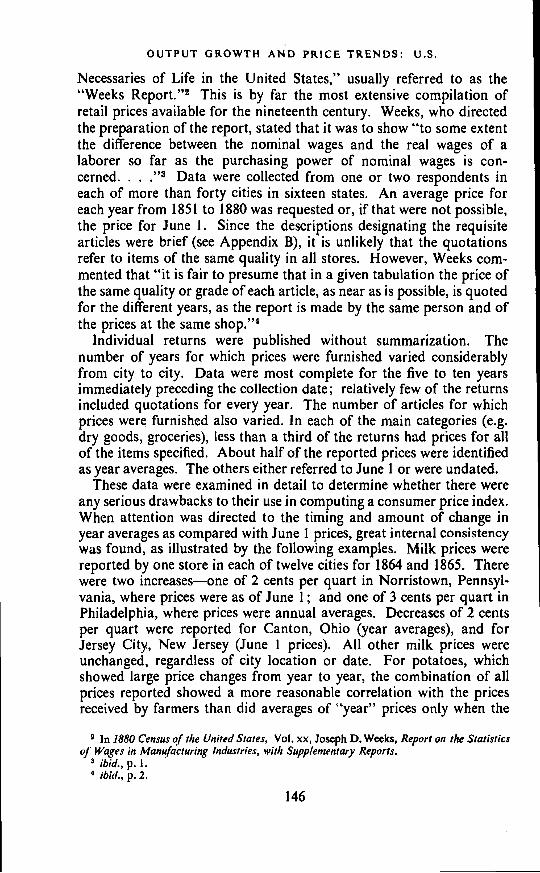
Necessaries of Life in the United States," usually referred to as the"Weeks Report."2 This is by far the most extensive compilation ofretail prices available for the nineteenth century. Weeks, who directedthe preparation of the report, stated that it was to show "to some extentthe difference between the nominal wages and the real wages of alaborer so far as the purchasing power of nominal wages is con-cerned. .
. Data were collected from one or two respondents ineach of more than forty cities in sixteen states. An average price foreach year from 1851 to 1880 was requested or, if that were not possible,the price for June 1. Since the descriptions designating the requisitearticles were brief (see Appendix B), it is unlikely that the quotationsrefer to items of the same quality in all stores. However, Weeks com-mented that "it is fair to presume that in a given tabulation the price ofthe same quality or grade of each article, as near as is possible, is quotedfor the different years, as the report is made by the same person and ofthe prices at the same shop."4
individual returns were published without summarization. Thenumber of years for which prices were furnished varied considerablyfrom city to city. Data were most complete for the five to ten yearsimmediately preceding the collection date; relatively few of the returnsincluded quotations for every year. The number of articles for whichprices were furnished also varied. In each of the main categories (e.g.dry goods, groceries), less than a third of the returns had prices for allof the items specified. About half of the reported prices were identifiedas year averages. The others either referred to June 1 or were undated.
These data were examined in detail to determine whether there wereany serious drawbacks to their use in computing a consumer price index.When attention was directed to the timing and amount of change inyear averages as compared with June 1 prices, great internal consistencywas found, as illustrated by the following examples. Milk prices werereported by one store in each of twelve cities for 1864 and 1865. Therewere two increases—one of 2 cents per quart in Norristown, Pennsyl-vania, where prices were as of June 1; and one of 3 cents per quart inPhiladelphia, where prices were annual averages. Decreases of 2 centsper quart were reported for Canton, Ohio (year averages), and forJersey City, New Jersey (June 1 prices). All other milk prices wereunchanged, regardless of city location or date. For potatoes, whichshowed large price changes from year to year, the combination of allprices reported showed a more reasonable correlation with the pricesreceived by farmers than did averages of "year" prices only when the
2 In 1880 Census of the United States, Vol. xx, Joseph D. Weeks, Report on the Statisticsof Wages in Manufacturing Industries, with Supplementary Reports.
ibid., p. 1.
ibid., p. 2.
146

RETAIL PRICES AFTER 1850
lag from the farm to retail store sales was taken into account. Con-sidering the labor necessary to secure annual averages for thirty years,it is likely that retailers reported as annual averages either estimates orfigures for one or more representative months.
When the possibility of major quality differences among stores wasexplored, insofar as this could be determined from price level compari-sons, the doubtful cases were far fewer than expected. Arrays of pricesshowed definite clustering, and when extremes were deleted, the rangewas not much greater than for a specified quality today. Differencesamong cities did not appear excessive, in view of the price differentialsbetween large and small cities common before World War II. Thisreview indicated that an average of the prices for each item wouldprovide a better measure of price changes than an average of city rela-tives, since the former would eliminate the heavy implicit weighting of alarge change in one small city. Several examples of the relatively smallprice differentials among cities, as well as the correspondence of changesin June 1 prices and year averages are given in Appendix C.
The final step in the examination was a review of the size and geo-graphical distribution of cities. Small cities predominated but largecities were adequately represented. However, coverage was generallylimited to New England and the North Atlantic and North Centralstates. The use of city weights to obtain averages was considered anundue refinement, so simple averages of the prices were calculated.5
The distribution of items covered by the Weeks Report, by majorgroups, was as follows:
Group Number of ItemsFood 39Clothing ioaRents 2bFuel and light 5Other 4
a includes dry goods and shoes.b Reported by room size. One report was for 3
rooms, one for 7 all others were for 4 or6 rooms.
Family purchases were generally well represented, judging from thesparse expenditure data for the period. The list of "necessaries" ispractically identical with similar lists used for cost of living studies inMassachusetts and other areas of the United States.6 However, servicesand other "slow movers" were not included. Iii order to reduce the
The only exception was bituminous coal, for which there were few returns, mostlyfrom large cities. Average prices were computed separately for large and small cities andcombined by weighting large cities 25 per cent and small cities 75 per cent.
6 See particularly Edward Young's study of the cost of living in Labor in Europe andAmerica, Treasury Dept., Report of the Bureau of Statistics, 1876. Retail prices for 1867,
147

OUTPUT GROWTH AND PRICE TRENDS: U.S.
possible error arising from these omissions, prices for certain goods andservices were estimated from other sources, as follows:
FoodThe only important food category not included in the Weeks Report
was fruit. Estimates of the changes in retail prices for five fruits werederived from wholesale prices, using the relationship between changes atretail and wholesale for potatoes and beans.7
Clothing
Because "store-bought" clothing was not especially important duringthis period, the list of yard goods and men's boots in the Weeks Reportwas considered generally adequate except for shoe repairs and someminor representation of ready-made garments after the Civil War.Estimates for shoe repairs and overalls were derived from a study ofprices paid by Vermont farmers.8 The only evidence to support the useof Vermont prices for all localities was a general similarity between theVermont data and the Weeks data for some commodities that could becompared.
Medical CareNo data for medical care were included in the Weeks Report, and
outlays for such services were large enough to warrant attention.Physicians' fees were included in the study of prices paid by Vermontfarmers. When the Vermont index was compared with an unpublishedmedical care index of the Bureau of Labor Statistics for large cities for1926 to 1940, neither index showed any significant change. Therefore,the Vermont data were considered a reasonable approximation for theperiod under review.
NewspapersContemporary accounts indicate that newspapers and periodicals
were a regular and substantial budget item regardless of income level.
1869, and 1874 for this same list of articles were obtained in towns in thirty-seven statesand eight territories and published as state, regional, and United States averages (pp.796—810). A summary report of family expenditures in 1874 is also included.
Wholesale prices for lemons, currants, raisins, prunes, and dried apples, were obtainedfrom Wholesale Prices in Philadelphia, 1852—1896: Series of Relative Monthly Prices (byAnne Bezanson, Marjorie C. Denison, Miriam Hussey, and Elsa Kiemp, Industrial Re-search Department, Wharton School of Finance and Commerce, University of Pennsylvania,1954, pp. 99, 192, 266, 270 and 271) and from Wholesale Prices, Wages, and Transportation(Senate Committee on Finance, 52d Cong., 2d sess., S. Rept. 1394, March 3, 1893, Part 2,pp. 81—84), usually referred to as the Aldrich Report; the other Aldrich Report was on retailprices and wages.
S T. M. Adams, Prices Paid by Vermont Farmers for Goods and Services and Received byThem for Farm Products, 1790—1940; Wages of Vermont Farm Labor, 1780—1940, StatisticalSupplement, Vermont Agricultural Experiment Station, Bull. 507, February 1944.
148

RETAIL PRICES AFTER 1850
Accordingly, the prices of local newspapers in eight cities were obtainedfrom files in the Library of Congress.° Most of the cities were large, butthere was considerable consistency in the timing and amount of pricechange. For example, rates increased during the war and remained atthis higher level in all cities except Charleston, South Carolina.
OtherPrice changes for furniture and other household equipment were not
estimated because of the minor importance of these items in familyexpenditures.
The only price series included in the Weeks Report not used for theindex was "board" for men and women. The expenditure studies forthe period do not show a breakdown of this outlay, nor do they indicatewhether services such as laundry and light were included. Similarly,the description of the price series does not indicate what is covered bythe quotations. Relative prices for "board" were calculated for supple-mentary information (see Appendix A), but in the summary indexes, itwas assumed that costs for the relatively small number of boardingfamilies were represented by the movement of prices for all other itemscombined.
DERIVATION OF THE WEIGHTSFamily expenditure data for 1851 to 1880 leave much to be desired
from the standpoint of weight derivation for an index of retail prices.'0The largest samples of families and localities were covered in an 1890—91expenditure study conducted for the Senate Committee on Finance, butcomparisons with more limited studies for earlier dates, particularly theseventies and eighties, revealed differences in the distribution of ex-penditures among major groups as between the two periods. Foodexpenses, for example, accounted for 50 per cent or more of totalexpenses in 1875 compared with 41 per cent in 1890—91. In 1893, theNew York Bureau of Statistics of Labor surveyed the evolving expendi-ture pattern and concluded that "In the smallest income in 1891 thepercentage for subsistence (food) is sensibly smaller than for the largestincome in 1875 and 1884; while for incomes of about the same size thedifference is considerable . . . on the other hand, there is a markedincrease in the percentage for clothing and especially in those for rentand sundries."
Baltimore, Md.; Boston, Mass.; Charleston, S.C.; Cincinnati, Ohio; Frankfort,Ky.; Hartford, Conn.; New York, N.Y.; and Philadelphia, Pa.
10 A convenient reference to all the studies that could be considered for this purposewas compiled by Faith M. Williams and Carle C. Zimmerman, Studies of Family Living inthe United States and Other Countries: An Analysis of Material and Method, Dept. of Agri-culture, Misc. Pub. 223, December 1935.
11 From the tenth annual report of the New York Bureau of Statistics of Labor, asreported in the Williams-Zimmerman bibliography, p. 145.
149
OUTPUT GROWTH AND PRICE TRENDS: U.S.
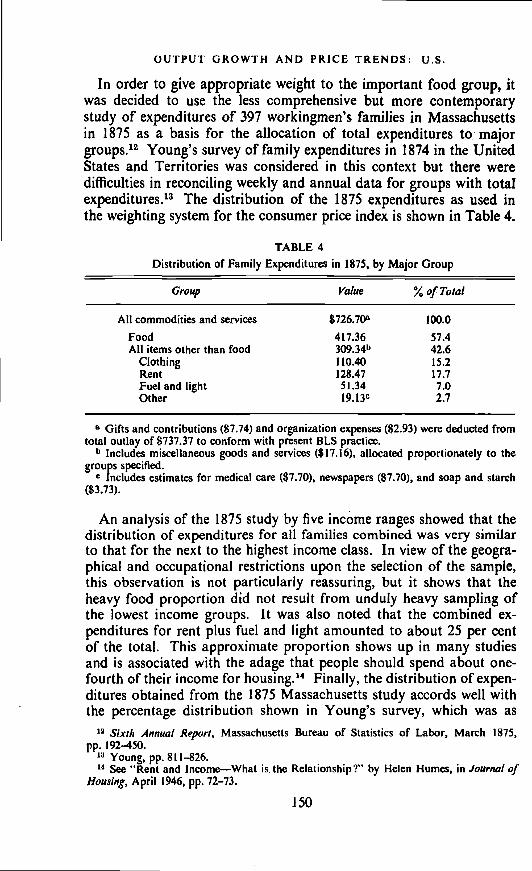
In order to give appropriate weight to the important food group, itwas decided to use the less comprehensive but more contemporarystudy of expenditures of 397 workingmen's families in Massachusettsin 1875 as a basis for the allocation of total expenditures to: majorgroups.'2 Young's survey of family expenditures in 1874 in the UnitedStates and Territories was considered in this context but there weredifficulties in reconciling weekly and annual data for groups with totalexpenditures.'3 The distribution of the 1875 expenditures as used inthe weighting system for the consumer price index is shown in Table 4.
TABLE 4Distribution of Family Expenditures in 1875, by Major Group
Group Value % of Total
All commodities and services $726.70a 100.0
Food 417.36 57.4All items other than food 309.34b 42.6
Clothing 110.40 15.2Rent 128.47 17.7Fuel and light 51.34 7.0Other 19.13C 2.7
Gifts and contributions ($7.74) and organization expenses ($2.93) were deducted fromtotal outlay of $737.37 to conform with present BLS practice.
b Includes miscellaneous goods and services ($17.16), allocated proportionately to thegroups specified.
C Includes estimates for medical care ($7.70), newspapers ($7.70), and soap and starch($3.73).
An analysis of the 1875 study by five income ranges showed that thedistribution of expenditures for all families combined was very similarto that for the next to the highest income class. In view of the geogra-phical and occupational restrictions upon the selection of the sample,this observation is not particularly reassuring, but it shows that theheavy food proportion did not result from unduly heavy sampling ofthe lowest income groups. It was also noted that the combined ex-penditures for rent plus fuel and light amounted to about 25 per centof the total. This approximate proportion shows up in many studiesand is associated with the adage that people should spend about one-fourth of their income for housing.'4 Finally, the distribution of expen-ditures obtained from the 1875 Massachusetts study accords well withthe percentage distribution shown in Young's survey, which was as
12 Sixth Annual Report, Massachusetts Bureau of Statistics of Labor, March 1875,pp. 192—450.
Young, pp. 811—826.See "Rent and Income—What is. the Relationship!" by Helen Humes, in Journal of
Housing, April 1946, pp. 72—73.
150

RETAIL PRICES AFTER 1850
follows: food, 50; clothing, 16, fuel and light, 8, rent, 18; other, 8.These food and fuel proportions may be understated and rents and"other" overstated because of the method used to obtain an annualU.S. average.
Although some expenditure data were available in the Massachusettsstudy for items below the major group level, generally it was necessaryto weight individual items on the basis of the distribution of expendi-tures for 232 families in 1890—91 as shown in the Aldrich Reports.15This is the only study made during the century that provides the detailnecessary for an index weighting system. Even so, some arbitraryestimates were necessary for items in subcategories.
In determining the final weights, expenditures for unpriced items wereallocated to priced items in the same group, on the assumption thatsimilar goods would tend to have similar price movements; for ex-ample, unpriced foods are more likely to move with priced foods thanwith some combination of foods and nonfoods. The actual derivationof 1875 expenditure weights is described in Appendix D. The per-centage distributions of the weights for the priced items are shown inAppendix B.
Expenditure values for 1860 were estimated by applying individualitem price indexes to the derived 1875 values. This procedure assumesthat the quantity purchased remained the same over the years. Probablysome shifts in consumption occurred from pre-Civil War to post-Civil War years, but since there are no data for the earlier period, noadjustments were possible. In continuing the indexes forward from1880 it would be more appropriate to employ a new weighting systembased on the 1890—91 or 1901 expenditure studies than to continue withthe 1875 pattern.
BASE PERIOD
1860 was adopted as a base period to facilitate comparison withWesley C. Mitchell's cost of living indexes for 1860 to 1880.
METHOD OF CALCULATION
FormulaThe algebraic equivalent o the fixed quantity weighted index was
used:
—
(&)]
15 These data are summarized in Reiail Prices and Wages, Senate Committee on Financc,52d Cong., 1st sess., S. Rept. 986, July 19, 1892, Part I, pp. xlii and xliii, and given in detailin Part 3, pp. 2040—2096, referred to also as the Aldrich Report. (Cf. footnote 7.)
151

OUTI'UT GROWTH AND PRICE TRENDS: U.S.
where p0 are prices in the base year and p, are prices in a given year, andqa are the quantities purchased by families in 1875. This is in line withthe calculation procedures now used by BLS for its Consumer Priceindex.
Price Indexes for Each ItemAn index for each item was calculated by using a comparability
procedure. This involved computing two averages of the prices foreach item for each year—the first composed of prices from firmsreporting for both the preceding year and the given year and the secondfor firms reporting for the given year and the following year. Year-to-year relatives were based on these comparable average prices and anindex on the 1860 base obtained by chaining together the year-to-yearrelatives.
Group and All Items IndexesTo combine the individual, items, estimated 1860 values for the
individual items were multiplied by index numbers for the correspondingitems to secure the costs for each year. These were summed by yearsand divided by the sum of the base year values. For overalls, the onlyitem for which data were not available for the full period, the linkingprocedure was used with weights redistributed within the clothing group.
Comparison with Earlier EstimatesMITCHELL
The weighted cost of living index compiled by Wesley C. Mitchell forhis study of Gold, Prices, and Wages under the Greenback Standard wasthe result of manifest care and attention to every detail and his pricerelatives have been used in many studies as evidence of changes inretail prices from 1860 to 1880.16 Initially, the intention was to extendMitchell's index back to 1851 if the source materials permitted. How-ever, since Mitchell's report appeared, much experience has been gainedin index making and price collection. The continuous changes in thekinds and qualities of goods in our mass markets and the discontinuitiesin sample data have given rise to new techniques for handling retailprice statistics. Another consideration was that the Mitchell indexesare based on less than half of the available data. Hence, the decisionwas made to retabulate the basic price data from the Weeks Report forthe full period, evaluate them, and to calculate a new index using thedata to the maximum extent, utilizing methods now employed by BLSin index number construction so far as feasible.
i6 University of California Publications in Economics, Vol. 1, March 27, 1908, pp. 63—91.
152

RETAIL PRICES AFTER 1850
A comparison of the present consumer price index (CPI) withMitchell's figures for the twenty-one years common to both is providedin Table 5 and Chart 2. (The chart also shows Falkner's weighted
TABLE 5Comparison of the Consumer Price index with Mitchell's
Cost of Living Index, 1860—1880
Year CPI Mitchella
YEAR TO YEAR CHANGE
CPI Miechell(1860 = 100) (per cent)
1860 100 1001861 101 104 +1 +41862 113 117 +12 +121863 139 140 +23 +201864 176 170 +27 +21
1865 175 179 —1 +51866 167 177 —5 —11867 157 169 —6 —51868 154 168 —2 —11869 147 161 —5 —41870 141 156 —4 —31871 135 149 —4 —41872 135 148 0 — I1873 133 145 —1 —21874 129 142 —3 —2
1875 123 138 —s —31876 11.9 134 — 3 — 31877 118 132 — 1 — 11878 111 128 —6 —31879 108 126 —3 —2
1880 110 128 +2 +2
a Mitchell, p. 91.
relative price series, discussed below.) Immediately apparent is thedifference in the timing of the Civil War peak. In the new index thehigh point on an annual basis was in 1864 with a very small declinerecorded in 1865. Mitchell's peak was in 1865. To pinpoint the turningpoint accurately, monthly data would be required. The Warren andPearson index indicates that wholesale prices reached their peak duringthe third quarter of 1864 and that the 1864 year average for all com-modities was 4 per cent higher than the average for At theretail level, there was a sharp downturn for clothing after 1864 but
17 0. F. Warren and F. A. Pearson, Wholesale Prices for 213 Years, 1720 to 1932,Cornell University Agricultural Experiment Station, Memoir 142, November 1932, PP. 7—10.
153

OUTPUT GROWTH AND PRICE TRENDS: U.S.
CHART 2
Comparison pf the Consumer Price Index, All Items, with Mitchell'sCost of Living Index, 1860—1880, and with Falkner's Weighted
Relative Price Series, All Items, 1851—1880
Index (1860=100)240
230
220
210
200
190
180
170
160
150
140
130
120
110
100
90
801850 1855 1860 1865 1870 1875 1880
Source: CPI data from Table 1, Col. 1; Falkner data from Wholesale Prices, Wages andTransportation, Report by Sen. Aldrich from the Committee on Finance, March 3, 1893,52 Cong., 2d sess4, Pt. 1, page 93.
154

RETAIL PRICES AFTER 1850
continued increases for the other major groups. The new index in-cludes a food price increase of about 2 per cent from 1864 to 1865,while Mitchell's index includes a rise of over 9 per cent in this mostimportant component (see Appendix E). The difference in these esti-mates accounts in part for the difference in the timing of the war peak.However, from 1865 to 1880, the present index for all items declined37 per cent, or at the rate of about 3 per cent per year, while Mitchell'sindex declined 28 per cent, or just over 2 per cent per year. Further-more, the contrast in the movements of the two series is far greater formost individual articles than for all items combined. Differences in thebehavior of the two indexes are attributable to the price and expenditurematerials used as well as to the methods of computation employed.
Comparisons for the fifty-eight items common to both indexes aregiven in Appendix A. If personal consumption expenditures weredeflated by individual price series, the choice of price series wouldproduce significant differences in the results.
Choice of Data from the Weeks .Report
With few exceptions Mitchell selected series that were continuous forall years from 1860 to 1880, provided they were expressly designated asyear averages. These restrictions, imposed partly by his method ofcalculation and partly to avoid using June 1 data as representative ofthe year, made more than half of the available data ineligible for thisindex. In the present case, all of the series were utilized, provided theycovered at least three consecutive years. This criterion made three tofive times as much data eligible for the new index. The use of single-month quotations may be questioned, but detailed comparisons indicatedthat this consideration was less important than securing a broader cityselection.
Combination of City Prices for Each Item
Mitchell computed a relative price for each city for each item andmade an arithmetic average of the relatives. For the new index, itemrelatives were computed from averages of quoted prices by a compara-bility procedure. Averages of relatives have implicit weighting by sizeof price change, while relatives of averages have implicit weighting byprice level. The price averages probably include quotations for a rangeof qualities, but the larger sample tends to minimize the effect of a fewaberrants. Furthermore, where it was obviously necessary, extremelyhigh or extremely low prices were discarded. Test calculations showedthat differences for individual items were rarely caused by the methodof averaging. The major differences stem from the inclusion of morequotations, a factor which reduces the effect of large price changes in afew cities.
155

OUTPUT GROWTH AND PRICE TRENDS: U.S.
Method of Imputing Unpriced ItemsMitchell assumed that price changes for all unpriced items averaged
the same as price changes for all priced items combined. For the CPI,unpriced items in each group were assumed to have the same averageprice change as priced items in the same group, an assumption nowused generally for the major price indexes. Differences in the importanceof the major groups resulting from these two assumptions are shownin Table 6.
TABLE 6Comparison of Distributions of Family Expenditures and Weights in the
Consumer Price indexes and in Mitchell's Cost of Living index,by Major Group
(per cent)
Group
CPI MITCHELL
Distribution ofExpendituresfrom whichWeights Were
Derived
RelativeImportance
in
Distribution of Expenditures
Weight
from whichWeigh Is Were for Priced
Derivedb
FoodClothingRentFuel and lightOther
57.414.316.7
6.74.9
57.415.217.77.02.7
42.5 31.614.9 3.116.0 16.0
5.3 4.721.3 0.3
56.75.6
28.78.50.5
100.0 100.0 100.0 55.7 100.0
See Appendix D. These relative importance figures change to some extent from yearto year depending on differential price changes.
b Mitchell, p. 85.Represents the weights used by Mitchell redistributed to 100 per cent as total, thereby
including imputed values automatically.
Dffferences in WeightsMitchell derived his weights from the BLS study of family expendi-
tures in 1901 for both items and groups. For the new index, the 1875Massachusetts study was used for groups and the 1890—91 study fordistribution within groups. The importance of food is about the samein both indexes, but for clothing and rents the differences are striking.Clothing showed the largest increase of all the groups from 1860 to1864 and 1865 while rent showed the least. From the Civil War peakto 1880, the largest decline was for clothing and the smallest for rent.If it were not for the heavy weighting of rent and the light weighting ofclothing by Mitchell, the differences between his all items index and thenew CPI would be more pronounced.
156

RETAIL PRICES AFTER 1850
Within the groups, the distributions of the weights differ greatly. Themeat category represents almost 40 per cent of total food in Mitchell'sweighting system compared to 24 per cent for the present index. Therewere also important differences among the item weights.
Additions to the Weeks ReportNo additions were made by Mitchell, and only relatively minor ones
by the present author, because of the difficulty of securing data.
Index Calculation Method
Mitchell used fixed percentage weights for combining item relativeswhile the equivalent of a combination of average prices with fixedquantity weights was used in the new index.
In order to determine whether the variations between the two indexesresult primarily from differences in the weights or from differences in.the price relatives, two special indexes for all items and several groupswere calculated for five selected years. Index A was based on Mitchell'sweights and the new item relatives, and Index B on Mitchell's relativeswith the 1875 weights used for the CPI. Table 7 shows the results ofthese calculations.
Although indexes A and B are not precisely comparable with the newindex (weights and price relatives were missing in the Mitchell data forthe additional items in the CPI), column 5 provides a rough measureof the effect of the two sets of weights, and column 6 of the differentprice relatives, in most instances, varying the weights produced smallerdifferences than varying the price relatives.
OTHERS
Various statisticians besides Mitchell have derived estimates for partsof the nineteenth century. Most of these estimates have been based onthe more prolific data available at the wholesale level and the authorshave usually qualified their conclusions by stating that lesser fluctuationcould be expected at the retail level, or else they have made roughadjustments to approximate this result. However, allowances haveseldom been made for changes in rents and services.
Two of the indexes used most frequently are discussed below. Theindexes have been identified by the author's name.
Roland P. Falkner, Aldrich Reports
The most widely known and quoted reports were issued by theSenate Committee on Finance in 1892 and 1893 (i.e. the AldrichReports).'8 The statistician for the Subcommittee, Roland P. Falkner,summarized wholesale and retail prices for more than two hundred
The summary indexes referred to appear in Wholesale Prices, Part I, pp. 91, 93, 94.
157

OUTPUT GROWTH AND PRICE TRENDS: U.S.
TABLE 7Comparison of the Consumer Price indexes with Mitchell's Cost of Living index,
and with indexes Formed by Shifting Their Relatives and Weights,Selected Years, 1864—1880
(1860 = 100)
Group andYear
('P1(I)
Mi,chella(2)
Index(3)
Index(4)
BC
Dij/è
Index
rencCFIA
e betweandIndex
en
B
(3) —(5)
(I) —
(6)(1)
All items1864 176 170 162 179 —14 + 31865 175 179 166 186 — 9 +111870 141 156 144 153 + 3 +121875 13 138 128 133 + 5 +101880 110 128 114 122 + 4 +12
Food1864 167 171 163 169 — 4 + 21865 170 187 169 183 — I +131870 143 164 147 158 + 4 +151875 129 141 129 135 0 + 61880 111 131 111 126 0 +15
Meats and fish1864 142 158 149 153 + 7 +111865 161 175 166 168 + 5 + 71870 154 155 157 152 + 3 — 2
1875 134 135 133 133 — 1 — 1
1880 116 122 115 119 — I + 3Clothing
1864 261 355 314 294 +53 +331865 238 324 278 275 +40 +371870 141 153 139 142 — 2 + I1875 105 113 107 110 + 2 + 51880 94 96 90 95 —4 +1
Rent1864 130 130 tI e 01865 134 135 (1 e + 1
1870 142 144 e +21875 129 141 e +121880 127 133 e + 6
Fuel and light1864 155 177 171 174 +16 +191865 159 179 173 178 +14 +191870 126 147 136 162 +10 +361875 110 134 123 143 +13 +331880 95 117 107 122 +12 +27
a Group indexes calculated by author from ii Same as col. 1.Mitchell data (see Appendix E). e Same as cal. 2.
" CPI item relatives with Mitchell's weights.c Mitchell's item relatives with CPI weights.
158

RETAIL PRICES AFTER 1850
commodities in the form of relative prices for individual items and, inthe case of wholesale prices, as index numbers for groups and all items.The retail price data cover a twenty-eight month period and thus havesuch limited usefulness that they are referred to infrequently. However,the wholesale price information extends over fifty years—from 1840 to1891—and is a valuable source of information.
Indexes based on wholesale prices for January of each year were usedby Falkner and by many later investigators as estimates of annualchanges in the cost of living. Three "all items" indexes were computed.One was a simple average of relatives for all articles, while two wereweighted according to family expenditures in 1890—91 (from the studyconducted concurrently with the price collection). One weighted indexassumed that prices for all unpriced articles remained unchanged whilethe other assumed that the average price change for all unpriced itemswas the same as for all priced items. Indexes for major groups wereobtained as unweighted averages of relatives but weighted indexes forfood and clothing were also compiled.
The indexes have some obvious deficiencies, particularly as measuresof cost of living. Relative prices were averaged without taking accountof gaps in the series, either by interpolation or linking. Althoughquarterly data were available, January prices were used to represent theyear. For some commodities in some years, especially 1865, the Januaryprices differed materially from annual averages estimated from fourquarterly prices. The timing and amplitude of changes at wholesaleprobably did not correspond with retail changes, and no adjustmentswere made for this factor. The principal limitations on commoditycoverage for cost-of-living estimates were the lack of data for rent andservices.
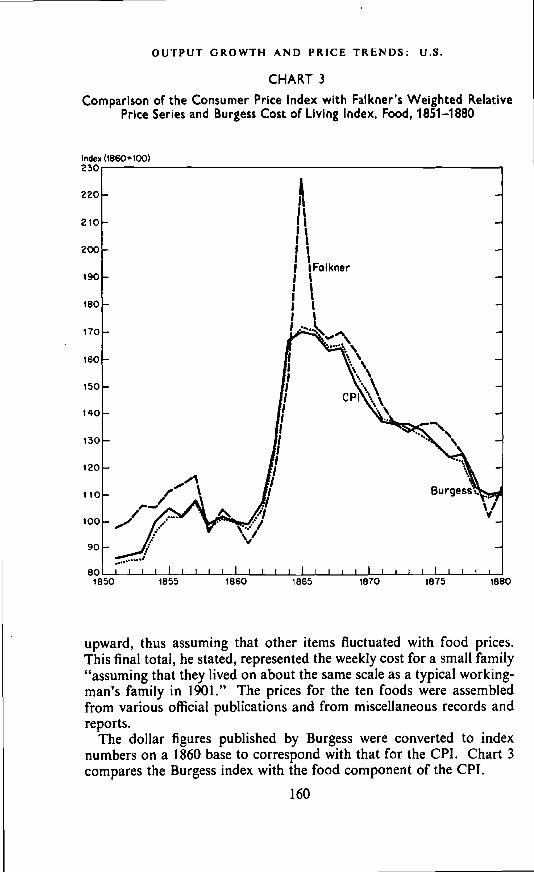
In Charts 2 (above), 3, and 4, Falkner weighted indexes for all items;food and clothing are compared with the corresponding components ofthe CPI from 1851 to 1880.
W. Randolph BurgessIn order to determine the purchasing power of teachers' salaries,
Burgess constructed a "cost of living" index, after searching the litera-ture and failing to "discover any adequate index of the cost of living fora long period of time."9 He decided that the best index would be onemeasuring changes in retail prices of food.
His cost of living measure is expressed in dollars and covers the years1841 to 1920. Prices for ten commodities important in wage earners'food budgets were combined with quantity weights. The total weeklyexpenditure by a typical wage earner's family of four for food, shelter,clothing, and incidentals was obtained by adjusting the food cost
"I w• Randolph Burgess, Trends of School Costs, Russell Sage Foundation, 1920.
159
OUTPUT GROWTH AND PRICE TRENDS: U.S.
CHART 3
ComparisonPrice
Index (1860u 100)230
220
210
200
190
180
170
160
150
140
130
120
110
100
90
801850
of the Consumer Price Index with Falkner's Weighted RelativeSeries and Burgess Cost of Living Index, Food, 1851—1 880
1880
upward, thus assuming that other items fluctuated with food prices.This final total, he stated, represented the weekly cost for a small family"assuming that they lived on about the same scale as a typical working-man's family in 1901." The prices for the ten foods were assembledfrom various official publications and from miscellaneous records andreports.
The dollarnumbers on acompares the
160
1855 1860 1865 1870 1875
figures published by Burgess were converted to index1860 base to correspond with that for the CPI. Chart 3Burgess index with the food component of the CPI.

CD
CD 0 CD
CD Ci'
CD -'I Cii
CD
CD 0
C) 0
rn-U
—.r
n
rn3
Cfl(
Drn
-,-' — C
)rn
a-, t#1
CD
01 0
——
——
—.
——
NN
)N
)N
N)
NN
)C
D0
-N
)LM
Cii
CD
CD
CD
0-
NU
'C
D
00
00
00
00
00
00
00
00
00
CD Ci'
C)'
CD 8
0\
CD -J 0
C) I > -1
rn -4 — r rn -4 m — 00 0

OUTPUT GROWTH AND PRICE TRENDS: U.S.
Consumer Price Indexes, 1880—19 14Estimates of changes in consumer prices were derived for the years
1880 to 1914 to tie in the present index with the Consumer Price Index ofthe Bureau of Labor Statistics. These estimates are given in Table 8.
TABLE 8Estimated Consumer Price Indexes, 1880 to 1914
(1860 = 100)
Year Index Year Index
18801881188218831884
110111112107104
19001901190219031904
959697
100101
18851886188718881889
102102102104104
19051906190719081909
101102106104103
18901891189218931894
10310410310297
19101911191219131914
108108110112113
18951896189718981899
9595949494
Because of the scarcity of retail price data for the years from 1881 to1890, most estimates of changes in the cost of living during this periodrely heavily on the movement of wholesale prices. The estimatespresented here are no exception.
Three indexes were combined using group weights from the 1890—91study of family expenditures. For the food component, the Burgessindex was used since it corresponds closely with the present index forfood from 1860 to 1880. The weighted index of wholesale prices ofclothing prepared by Roland Falkner for the Aldrich Committee wasadopted for clothing. Its correspondence with the clothing componentof the new index for earlier years is only fair and it probably overstatesthe fluctuations that actually occurred at the retail level but it was theonly series available. Rents were assumed to be constant, as estimated
162

RETAIL PRICES AFTER 1850
by Snyder.2° The remaining items were assumed to have the same aver-age movement as food, clothing, and rent combined.
Although the resulting estimates are crude, they derive some supportfrom Rees's revision of Douglas's "Most Probable Index of the Move-ment of the Total Cost of Living for Workingmen." The Douglas indexshowed a decline of about 3 per cent from 1890 to 1891 while Rees'sfigures show an increase of about 1 per cent. An estimate of this yearlyprice change derived by combining the three indexes specified abovealso shows an increase of about I per cent.
From 1890 to 1914, Rees's figures have been spliced to the estimatesfor the earlier years.2'
20 Snyder, Business Cycles and Business Measureinenis, Russell Sage Foundation,1927, pp. 137 and 291.
21 The preliminary indexes obtained by Rees are contained in Investing in EconomicKnowledge, 38th Annual Report. National Bureau of Economic Research, May 1958, p. 59.The Douglas indexes are included in Real Wages in the United States, 1890—1926, by PaulH. Douglas, 1-loughton Muffin, 1930, p. 60.
163.

OUTPUT GROWTH AND PRICE TRENDS: U.S.
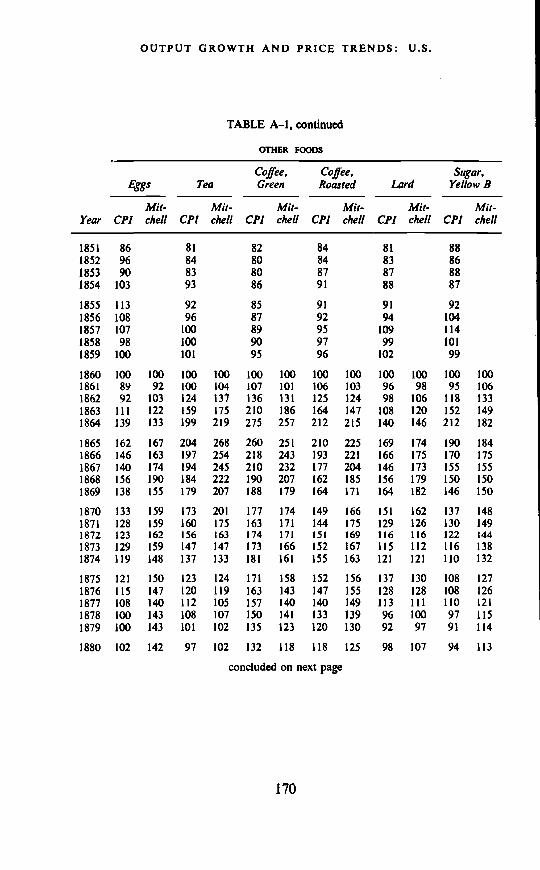
APPENDIX AIndex Numbers for Individual Items Included in the Consumer
Price Indexes, 1851—1880, and in Mitchell's Cost of LivingIndex, 1860—1880
TABLE A-iFood
(1860 = 100)
CEREALS AND BAKERY PRODUCTS
Flour, Wheat, Flour, WheatSuperfine Extra Family Flour, Rye Corn Meal Rice
Year CPI Mitchell CPI Mitchell CPI Mitchell CFI Mitchell CPI Mitchell
1851 93 84 83 79 911852 83 76 82 80 901853 88 83 90 85 951854 120 110 112 96 100
1855 129 122 125 104 1071856 108 107 106 92 1061857 112 113 116 111 1081858 91 93 95 93 961859 107 105 102 104 95
1860 100 100 100 100 100 100 100 100 100 1001861 106 111 105 106 96 103 98 111 113 1131862 111 117 110 112 106 109 102 118 137 1591863 137 162 136 157 129 157 131 143 161 1871864 172 189 169 186 178 198 177 174 202 220
1865 179 208 178 203 186 215 184 190 201 2171866 199 225 200 212 191 217 177 183 189 2111867 206 218 209 209 200 210 178 188 180 1911868 182 188 186 180 188 188 172 174 176 1961869 146 179 152 173 156 179 155 168 166 188
1870 135 170 138 168 142 172 154 167 146 1771871 137 149 137 152 131 152 134 146 150 169
1872 152 154 155 157 134 144 132 136 150 1651873 148 150 150 152 131 146 126 134 145 1611874 138 142 141 146 134 147 138 140 142 157
1875 127 140 129 136 124 145 131 140 136 141
1876 130 148 129 147 121 148 124 137 130 1411877 144 147 146 146 130 150 128 136 125 1391878 118 137 119 139 109 13! 112 128 124 1381879 112 127 113 125 104 129 109 125 123 130
1880 112 129 113 125 106 132 110 129 122 133
continued on next page
164

RETAIL PRICES AFTER 1850
TABLE A-i, continued
MEATS AND FISH
Beef, Fresh,Roasting Beef; Fresh, Beef, Fresh,Pieces Rump Steaks Soup Pieces Beef, Corned Fork, Fresh
Year CPI Mitchell CPI Mitchell CPI Mitchell CPI Mitchell CPI Mitchell
1851 85 84 77 80 861852 85 83 79 78 931853 89 85 84 921854 92 87 86 88 90
1855 99 93 93 98 94
1856 101 95 93 99 981857 103 101 100 100 1071858 100 101 100 102 991859 102 103 102 103 95
1860 100 100 100 100 100 100 100 100 100 1001861 99 106 97 105 99 118 99 103 103 1151862 103 109 102 106 104 121 104 103 102 1201863 118 130 117 127 115 131 116 117 119 1341864 146 156 146 153 150 158 142 134 161 186
1865 164 169 160 165 164 170 157 147 185 2161866 168 169 164 165 168 175 155 147 179 2281867 163 171 162 166 158 166 148 135 170 2231868 162 167 161 156 156 150 154 148 174 2171869 159 162 160 157 152 148 150 138 174 204
1870 157 155 159 151 150 144 147 128 168 1761871 147 142 151 135 137 132 138 121 144 1521872 146 141 148 135 138 132 134 117 133 1501873 145 142 146 135 132 130 129 112 132 156
1874 141 137 144 132 127 125 126 111 131 160
1875 137 135 141 127 123 121 127 109 133 1631876 137 136 137 129 122 123 122 111 129 1591877 129 130 130 126 115 120 118 109 122 152
1878 126 123 126 124 114 119 114 104 110 1401879 120 120 122 124 109 120 110 103 107 142
1880 121 118 121 118 110 119 112 105 110 143
continued on next page
165

OUTPUT GROWTH AND PRICE TRENDS: U.S.
TABLE A—I, continued
Pork, Corned Pork, Smoked Pork Porkand Salted Pork, Bacon Hams Shoulders Sausage
Year CPI Mitchell CFI Mitchell CPI Mitchell CPI Mitchell CPI Mitchell
1851 84 88 91 89 881852 102 92 92 87 88
1853 92 88 93 90 901854 94 87 94 92 92
1855 95 89 97 95 99
1856 102 92 98 98 100
1857 108 107 106 111 104
1858 101 99 100 101 102
1859 99 99 101 103 102
1860 100 100 100 100 100 100 100 100 100 1001861 103 112 102 105 93 104 112 128 99 107
1862 104 117 104 113 95 107 118 138 101 114
1863 121 141 117 120 106 122 127 152 109 1241864 168 176 152 153 144 157 167 185 136 139
1865 196 210 168 166 174 186 189 204 160 1651866 186 208 156 161 167 183 183 200 153 168
1867 173 201 152 175 154 171 173 202 147 164
1868 179 210 159 168 158 174 179 205 147 160
1869 180 205 159 157 157 168 184 203 152 159
1870 174 185 156 150 154 158 185 190 146 148
1871 147 160 134 140 136 145 152 155 135 130
1872 134 151 125 139 126 137 140 152 127 129
1873 131 145 121 130 125 130 139 148 122 1301874 132 157 123 130 121 134 142 153 121 128
1875 139 163 130 131 124 135 144 154 123 122
1876 136 153 133 130 122 137 142 152 116 12!
1877 127 148 121 134 111 125 126 144 109 1181878 109 128 106 128 100 117 113 137 98 112
1879 104 124 101 123 96 114 108 130 94 110
1880 112 128 110 128 101 115 114 124 95 110
continued on next page
166

RETAIL PRICES AFTER 1850
TABLE A—I, continued
Veal Veal Veal Mutton MuttonFore quarters Hindquarters Cutlets Fore quarters Leg
Year CFJ Mitchell CPI Mitchell CPI Mitchell CFI Mitchell CPI Mitchell
1851 81 69 89 77 831852 82 70 83 78 861853 85 73 87 86 871854 92 78 95 88 89
1855 92 91 95 93 921856 99 95 98 102 991857 98 94 98 100 981858 102 97 99 99 961859 104 104 103 100 96
1860 100 100 100 100 100 100 100 100 100 1001861 101 111 100 110 99 102 101 110 98 1081862 103 106 105 110 100 102 102 111 102 1131863 117 124 116 123 106 104 118 131 112 1211864 144 146 139 138 129 125 142 146 133 132
1865 159 162 150 144 142 136 153 162 149 1541866 161 162 153 144 143 136 154 160 147 1571867 158 163 153 146 146 141 152 163 147 1551868 157 152 154 146 149 144 151 161 15! 1871869 155 152 152 147 148 140 149 157 144 154
1870 152 147 147 140 144 132 146 147 141 1451871 141 128 140 138 138 123 139 138 135 1391872 137 128 136 136 135 123 138 136 134 135
1873 140 125 137 131 136 123 140 135 135 131
1874 136 128 134 133 132 121 136 132 132 129
1875 135 123 133 129 132 115 136 127 130 1251876 I33 125 131 128 130 117 132 128 127 1251877 127 114 126 121 123 114 128 120 123 1261878 121 113 122 121 120 111 125 123 119 1241879 116 112 118 118 116 111 117 121 116 120
1880 118 112 120 118 117 111 118 118 114 116
continued on next page
167

OUTPUT GROWTH AND PRICE U.S.
TABLE A-I, continued
Mutton Chops Mackerel, Pickled Codfish, Dry
Year CPI Mitchell CPI Mitchell CPI Mitchell
1851 81 92 821852 85 100 891853 85 98 891854 88 111 94
1855 92 106 971856 98 101 981857 98 107 951858 97 100 931859 100 100 100
1860 100 100 100 100 100 1001861 96 106 83 93 97 1021862 98 108 92 111 104 1121863 116 117 106 125 121 1281864 135 124 127 153 149 147
1865 148 144 130 149 160 1611866 147 146 132 152 151 1661867 150 147 121 149 143 1631868 150 153 116 147 145 1611869 145 141 124 150 152 160
1870 145 136 132 142 148 1561871 142 134 135 152 144 1501872 138 131 126 147 142 149
1873 140 128 131 149 140 1471874 139 128 127 144 139 143
1875 143 124 122 147 136 1391876 140 130 120 142 135 1361877 136 127 116 131 131 129
1878 131 121 113 130 122 1261879 126 115 109 118 122 121
1880 128 121 110 116 123 115
continued on next page
168

RETAIL PRICES AFTER 1850
TABLE A-i, continued
DAIRY PRODUCTS FRUITh AND VEGETABLES
Milk Butter Cheese Potatoes Beans
Mit- Mit- Mit- Mit- Mit-Year CF) chef! CF) chef! CF) chell C?! chef! CF) chef! Cr!
1851 97 84 79 89 95 911852 100 84 82 100 98 841853 102 85 84 78 97 991854 100 94 92 120 108 111
1855 104 102 101 126 112 1031856 102 101 101 98 119 1071857 104 109 101 118 122 1121858 98 100 94 108 103 1021859 102 104 97 107 96 102
1860 100 100 100 100 100 100 100 100 100 100 1001861 115 122 88 93 88 90 97 103 92 104 1031862 120 132 92 110 91 97 109 129 103 122 1101863 137 154 109 129 105 113 122 144 124 142 121
1864 153 174 164 188 139 153 169 170 131 156 132
1865 154 172 155 218 155 175 155 173 135 156 137
1866 145 170 162 215 151 180 170 207 138 160 1281867 145 171 140 210 141 177 152 166 148 172 1301868 144 168 162 232 135 168 177 184 169 185 1241869 141 164 150 203 143 164 137 161 155 179 127
1870 137 156 141 203 127 154 131 150 132 163 1241871 117 131 133 194 120 139 151 164 127 157 1201872 116 131 131 193 128 144 136 163 129 155 1191873 115 126 137 187 124 137 142 165 129 158 1161874 116 127 140 181 126 136 163 162 124 154 114
1875 115 127 130 169 122 134 136 150 120 146 121
1876 114 127 120 165 109 124 111 142 110 134 1201877 111 131 111 163 113 127 149 171 113 152 1121878 111 131 100 156 102 122 118 144 107 140 1121879 114 131 96 162 98 118 140 145 108 145 105
1880 112 131 106 167 106 135 121 157 108 150 112
continued on next page
169
OUTPUT GROWTH AND PRICE TRENDS: U.S.
TABLE A-i, continued
OTHER FOODS
Coffee, Coffee, Sugar,Eggs Tea Green Roasted Lard Yellow B
Mit— Mit— lviit— lviii— Mit— Mit—Year CPI chell CFI c/tell CPI chell CPI chell CPI c/tell CPI chell
1851 86 81 82 84 81 881852 96 84 80 84 83 861853 90 83 80 87 87 881854 103 93 86 91 88 87
1855 113 92 85 91 91 921856 108 96 87 92 94 1041857 107 100 89 95 109 1141858 98 100 90 97 99 1011859 100 101 95 96 102 99
1860 100 100 100 100 100 100 100 100 100 100 100 1001861 89 92 100 104 107 101 106 103 96 98 95 1061862 92 103 124 137 136 131 125 124 98 106 118 133
1863 111 122 159 175 210 186 164 147 108 120 152 1491864 139 133 199 219 275 257 212 215 140 146 212 182
1865 162 167 204 268 260 251 210 225 169 174 190 1841866 146 163 197 254 218 243 193 221 166 175 170 175
1867 140 174 194 245 210 232 177 204 146 173 155 1551868 156 190 184 222 190 207 162 185 156 179 150 1501869 138 155 179 207 188 179 164 171 164 182 146 150
1870 133 159 173 201 177 174 149 166 151 162 137 148
1871 128 159 160 175 163 171 144 175 129 126 130 1491872 123 162 156 163 174 171 151 169 116 116 122 1441873 129 159 147 147 173 166 152 167 115 112 116 138
1874 119 148 137 133 181 161 155 163 121 121 110 132
1875 121 150 123 124 171 158 152 156 137 130 108 127
1876 115 147 120 119 163 143 147 155 128 128 108 126
1877 108 140 112 105 157 140 140 149 113 111 110 1211878 100 143 108 107 150 141 133 139 96 100 97 115
1879 100 143 101 102 135 123 120 130 92 97 91 114
1880 102 142 97 102 132 118 118 125 98 107 94 113
concluded on next page
170
RETAIL PRICES AFTER 1850
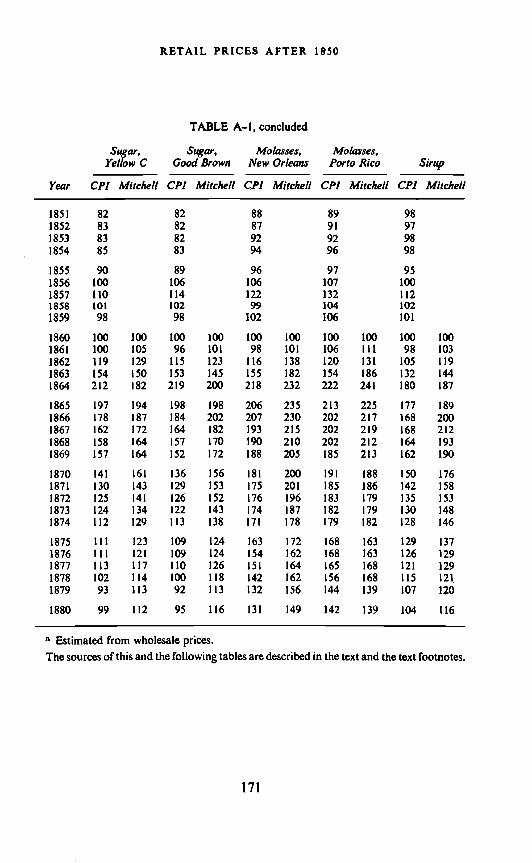
TABLE A—i, concluded
Sugar, Sugar, Molasses, Molasses,Yellow C Good Brown New Orleans Forto Rico Sirup
Year CM Mitchell CPI Mitchell CPI Mitchell CPI Mitchell CFI Mitchell
1851 82 82 88 89 98
1852 83 82 87 91 97
1853 83 82 92 92 981854 85 83 94 96 98
1855 90 89 96 97 95
1856 100 106 106 107 1001857 110 114 122 132 112
1858 101 102 99 104 1021859 98 98 102 106 101
1860 100 100 100 100 100 100 100 100 100 1001861 100 105 96 101 98 101 106 111 98 103
1862 119 129 115 123 116 138 120 131 105 119
1863 154 150 153 145 155 182 154 186 132 144
1864 212 182 219 200 218 232 222 241 180 187
1865 197 194 198 198 206 235 213 225 177 189
1866 178 187 184 202 207 230 202 217 168 200
1867 162 172 164 182 193 215 202 219 168 212
1868 158 164 157 170 190 210 202 212 164 1931869 157 164 152 172 188 205 185 213 162 190
1870 141 161 136 156 181 200 191 188 150 176
1871 130 143 129 153 175 201 185 186 142 158
1872 125 141 126 152 176 196 183 179 135 153
1873 124 134 122 143 174 187 182 179 130 148
1874 112 129 113 138 171 178 179 182 128 146
1875 III 123 109 124 163 172 168 163 129 137
1876 III 121 109 124 154 162 168 163 126 129
1877 113 117 110 126 .151 164 165 168 121 129
1878 102 114 100 118 142 162 156 168 115 121.
1879 93 113 92 113 132 156 144 139 107 120
1880 99 112 95 116 131 149 142 139 104 116
a Estimated from wholesale prices.The sources of this and the following tables are described in the text and the text footnotes.
171

OUTPUT GROWTH AND PRICE TRENDS: U.S.
TABLE A-2Clothing
(1860 = 100w)
Mousselines Cotton Shirtings, Shirtings, She etings,de Lame Satinets Flannel Bleached Brown Bleached
Al it— it— Alit— Mit— Mit— Alit—Year Cr! chell CP! chell CFI chell CPI chell CFI chell CPI die!!
1851 104 105 101 107 97 1041852 104 106 103 107 96 1041853 101 105 103 104 97 1021854 101 104 102 104 96 103
1855 101 104 101 104 95 1031856 101 102 101 104 96 1031857 101 101 102 100 99 1011858 95 102 101 101 101 1001859 94 100 101 99 99 100
1860 100 100 100 100 100 100 100 100 100 100 100 1001861 114 128 105 117 123 137 111 123 121 130 115 1241862 133 150 132 156 187 215 179 207 210 250 180 2281863 178 185 166 188 288 305 288 335 396 465 260 3201864 224 238 203 205 396 448 416 511 548 651 369 422
1865 201 206 180 192 368 441 355 447 455 563 318 3811866 158 170 158 157 283 355 277 366 328 444 265 3211867 135 134 145 138 231 280 216 266 249 342 226 2741868 124 121 133 126 191 225 182 234 213 286 191 2281869 117 113 129 121 174 198 156 176 184 225 171 189
1870 110 110 124 118 170 186 138 160 162 194 153 171
1871 102 99 116 112 146 155 129 158 143 176 134 1441872 101 97 113 108 145 153 127 147 144 168 133 1301873 97 97 110 106 137 151 118 136 135 152 129 1241874 95 94 105 106 126 136 111 126 122 142 120 118
1875 90 92 103 104 121 130 103 116 113 129 115 111
1876 87 87 102 101 110 118 95 109 106 121 107 1041877 82 85 100 97 104 113 91 103 100 113 102 1001878 78 80 96 95 99 107 82 94 94 103 96 931879 75 80 96 95 99 107 83 95 93 100 95 91
1880 75 81 96 95 98 101 84 96 93 98 96 92
continued on next page
172
RETAIL PRICES AFTER 1850
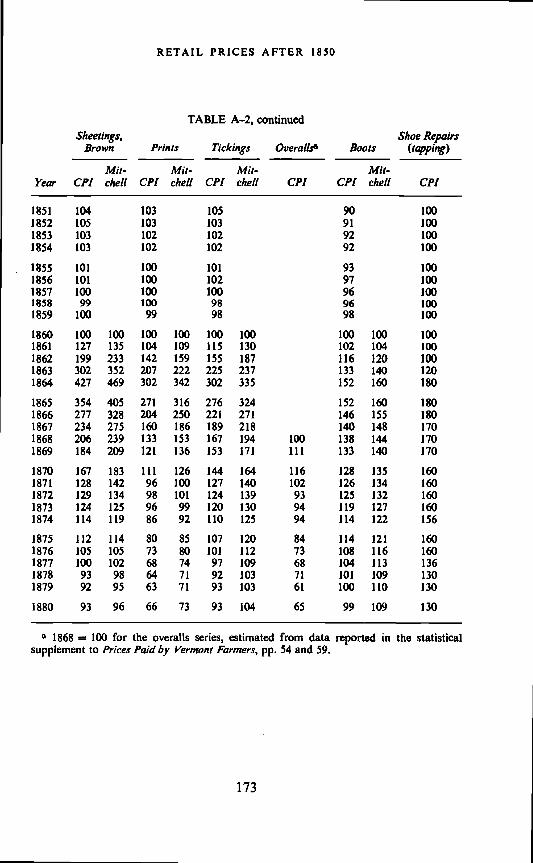
TABLE A-2, continuedSheetings, Shoe Repairs
Brown Prints Tickings Boots (tapping)
Mit- Mit- Mit- Mit-Year Cr! chell CFI chef! C?! chef! CPI C?! chell C?!
1851 104 103 105 90 1001852 105 103 103 91 1001853 103 102 102 92 1001854 103 102 102 92 100
1855 101 100 101 93 1001856 101 100 102 97 1001857 100 100 100 96 1001858 99 100 98 96 1001859 100 99 98 98 100
1860 100 100 100 100 100 100 100 100 1001861 127 135 104 109 115 130 102 104 1001862 199 233 142 159 155 187 116 120 1001863 302 352 207 222 225 237 133 140 1201864 427 469 302 342 302 335 152 160 180
1865 354 405 271 316 276 324 152 160 1801866 277 328 204 250 221 271 146 155 1801867 234 275 160 186 189 218 140 148 1701868 206 239 133 153 167 194 100 138 144 1701869 184 209 121 136 153 171 111 133 140 170
1870 167 183 111 126 144 164 116 128 135 1601871 128 142 96 100 127 140 102 126 134 1601872 129 134 98 101 124 139 93 125 132 1601873 124 125 96 99 120 130 94 119 127 1601874 114 119 86 92 110 125 94 114 122 156
1875 112 114 80 85 107 120 84 114 121 1601876 105 105 73 80 101 112 73 108 116 1601877 100 102 68 74 97 109 68 104 113 1361878 93 98 64 71 92 103 71 101 109 1301879 92 95 63 71 93 103 61 100 110 130
1880 93 96 66 73 93 104 65 99 109 130
a 1868 = 100 for the overalls series, estimated from data reported in the statisticalsupplement to Prices Paid by Vermont Farmers, pp. 54 and 59.
173

OUTPUT GROWTH AND PRICE TRENDS: U.S.
TABLE A-3Rent and Board
(1860 = 100)
Four RoomsSix to Seven
Rooms Board, Men's Board, Womena
CPI MitchellYear CF! Mitchell CPJ Mitchell CPI Mitchell
1851 99 100 89 831852 99 100 89 831853 99 100 90 851854 102 102 91 86
1855 103 103 94 901856 103 103 98 971857 100 100 99 981858 100 100 101 101
1859 100 100 101 101
1860 100 100 100 100 100 100 100 1001861 94 98 96 97 110 108 116 lii1862 102 106 101 102 119 118 128 1201863 114 115 112 112 136 135 142 1.61864 125 125 135 134 155 155 159 156
1865 129 131 139 138 159 160 164 162
1866 1.32 133 143 142 154 156 159 1591867 131 129 138 138 150 149 154 1531868 132 131 146 146 153 153 156 1551869 133 134 149 150 152 152 155 153
1870 135 138 148 149 151 148 150 1501871 136 143 152 151 151 153 144 143
1872 137 145 152 150 151 153 144 143
1873 134 142 146 147 145 150 139 1431874 127 140 141 155 142 148 136 138
1875 123 138 136 144 139 149 133 1391876 120 133 128 133 138 147 131 1371877 120 132 126 132 137 146 132 1381878 123 132 125 132 135 143 129 1351879 121 129 123 130 134 144 129 138
1880 127 132 127 134 138 146 131 138
a Not included in the "all items" indexes.
174

RETAIL PRICES AFTER 1850
TABLE A-4Fuel and Light(1860 = 100)
Coal,Anthracite
Coal,Wood, Hard Wood, Pine Coal Oil
Year CPI Mitchell CFI Mitchell CPI Mitchell CPI Mitchell CFI Mitchell
1851 104 85 87 101 1141852 101 85 89 101 1141853 111 85 95 107 1141854 134 93 104 121 120
1855 122 87 105 131 1141856 118 89 107 113 1091857 118 96 112 119 1091858 105 93 105 114 1051859 97 90 100 105 100
1860 100 100 100 100 100 100 100 100 100 1001861 107 103 106 105 104 103 124 125 85 941862 118 115 120 115 124 120 138 144 81 1001863 174 167 145 151 136 135 158 169 97 154
1864 209 205 153 154 149 146 187 193 112 171
1865 218 216 144 144 164 166 183 185 124 174
1866 202 200 137 143 170 168 203 206 99 141
1867 171 172 134 139 159 161 198 203 85 127
1868 170 172 126 133 161 163 182 192 77 116
1869 172 170 124 133 160 166 193 208 67 98
1870 159 157 118 130 156 165 191 223 63 91
1871 162 159 120 135 161 167 182 189 57 691872 156 152 119 135 159 164 182 182 53 661873 160 158 114 130 158 166 181 188 49 61
1874 156 154 107 129 153 160 177 186 42 55
1875 155 155 100 126 150 155 167 174 39 51
1876 146 135 97 127 148 155 162 173 38 491877 129 122 97 122 135 139 143 151 36 50
1878 128 127 91 119 130 135 134 138 32 41
1879 119 114 90 118 132 135 143 137 29 36
1880 132 130 93 121 133 138 143 137 28 35
a Based on weighted averages of prices in large and small cities with large city weightsapproximately 25 per cent and small city weights approximately 75 per cent.
175

OUTPUT GROWTH AND PRICE TRENDS: U.S.
TABLE A-SOther
(1860 = 100)
MedicaI
News-papers Soap Starch
CPI CPI Mitchell CPI Mitchell
OfficeVisits
Year CPI
Home Visits
Delivery
CPI
NoMileage
CPI
FiveMiles
CPI
1851 100 100 100 100 93 88 1051852 100 100 100 100 93 86 1051853 100 100 100 100 93 88 106
1854 100 100 100 100 93 89 106
1855 100 100 100 100 93 96 1071856 100 100 100 100 93 92 1051857 100 100 100 100 93 99 1081858 100 100 100 100 93 101 1021859 100 100 100 100 96 101 105
1860 100 100 100 100 100 100 100 100 1001861 119 100 100 108 100 96 96 99 1021862 119 112 100 117 100 103 111 104 1131863 119 112 100 122 114 120 139 117 1351864 133 124 100 117 156 142 154 138 161
1865 152 162 175 156 136 148 164 146 1781866 152 162 175 156 133 150 180 143 1741867 152 166 175 167 133 136 165 137 1771868 160 166 175 167 133 130 167 140 1781869 160 166 175 167 137 128 164 135 171
1870 160 166 175 167 137 119 146 127 158
1871 160 166 175 167 137 118 145 121 1391872 160 166 175 167 137 114 145 119 139
1873 164 162 167 167 140 112 132 123 1331874 164 162 167 167 140 107 126 118 127
1875 164 162 167 167 140 105 124 115 125
1876 160 150 150 167 147 98 115 106 1191877 160 150 150 167 148 96 115 103 113
1878 148 150 150 167 148 91 108 98 104
1879 148 150 150 167 148 88 104 94 103
1880 148 150 150 167 148 85 102 90 99
a Estimated from data reported in the statistical supplement to Prices Paid by VermontFarmers, pp. 48, 49.
176
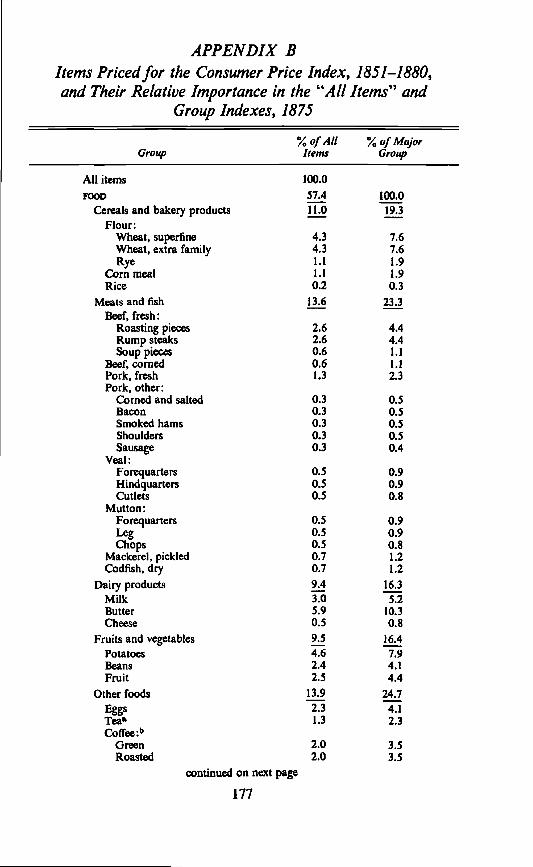
APPENDIX BItems Priced for the Consumer Price Index, 1851—1880,and Their Relative Importance in the "A ii items" and
Group Indexes, 1875
% of All %of MajorGroup Items Group
All items 100.0FOOD 57.4 100.0
Cereals and bakery products 11.0 19.3Flour:
Wheat, superfine 4.3 7.6Wheat, extra family 4.3 7.6Rye 1.1 1.9
Cornmeal 1.1 1.9Rice 0.2 0.3
Meats and fish 13.6 23.3Beef, fresh:
Roasting pieces 2.6 4.4Rump steaks 2.6 4.4Soup 0.6 1.1
Beef, corned 0.6 1.1Pork, fresh 1.3 2.3Pork, other:
Corned and salted 0.3 0.5Bacon 0.3 0.5Smoked hams 0.3 0.5Shoulders 0.3 0.5Sausage 0.3 0.4
Veal:Forequarters 0.5 0.9Hindquarters 0.5 0.9Cutlets 0.5 0.8
Mutton:Forequarters 0.5 0.9Leg 0.5 0.9Chops 0.5 0.8
Mackerel, pickled 0.7 1.2Codfish, dry 0.7 1.2
Dairy products 16.3Milk 3.0 5.2Butter 5.9 10.3Cheese 0.5 0.8
Fruits and vegetables 9.5 16.4Potatoes 4.6 7.9Beans 2.4 4.1Fruit 2.5 4.4
Other foods 13.9 24.7Eggs 2.3 4.1Tea° 1.3 2.3Coffee :b
Green 2.0 3.5Roasted 2.0 3.5
continued on next page
177
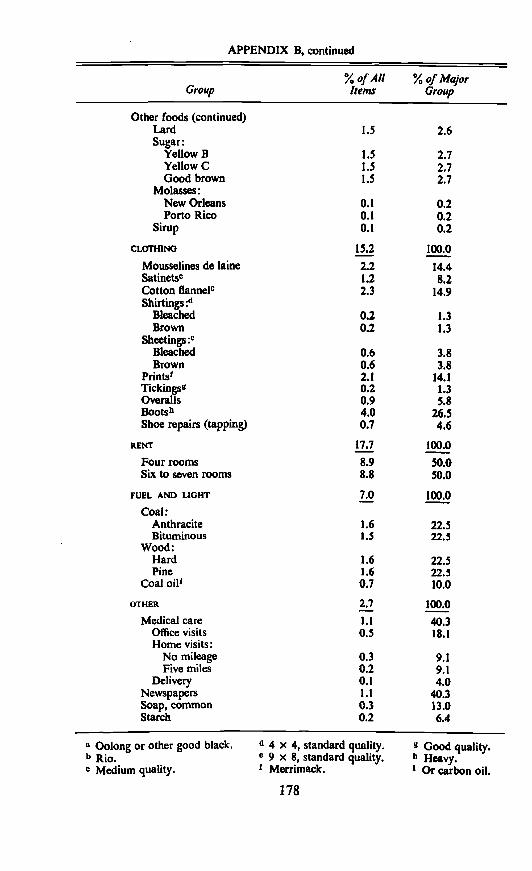
APPENDIX B, continued
% of All %of MajorGroup Items Group
Other foods (continued)Lard 1.5 2.6Sugar:
Yellow B 1.5 2.7Yellow C 1.5 2.7
• Good brown Ii 2.7Molasses:
New Orleans 0.1 0.2Porto Rico 0.1 0.2
Sirup 0.1 0.2
CLOTHING 15.2 100.0Mousselines de lame 2.2 14.4Satinetsc 1.2 8.2Cotton flanneic 2.3 14.9Shirtings :d
Bleached 0.2 1.3Brown 0.2 1.3
Sheetings :eBleached 0.6 3.8Brown 0.6 3.8
Prints 21 14.1Tickingss 0.2 1.3Overalls 0.9 5.8Bootsh 4.0Shoe repairs (tapping) 0.7 4.6
RENT 17.7 100.0Four rooms 8.9 50.0Six to seven rooms 8.8 50.0
FUEL AND LIGHT 7.0 100.0Coal:
Anthracite 1.6 22.5Bituminous 1.5 22.5
Wood:Hard 1.6 22.5Pine 1.6 22.5
Coal 0.7 10.0
OTHER 2.7 100.0Medical care 1.1 403
Office visits 0.5 18.1Home visits:
No mileage 0.3 9.1Five miles 0.2 9.1
Delivery 0.1 4.0Newspapers 1.1 40.3Soap, common 0.3 13.0Starch 0.2 6.4
a Oolong or other good black. (14 x 4, standard quality. g Good quality.b Rio. e 9 x 8, standard quality. h Heavy.C Medium quality. Merrimack. I Or carbon oil.
178

RETAIL PRICES AFTER 1850
APPENDIX CExamples of Individual City Data for Selected
Commodities Taken from the Weeks Report
TABLE C-iButter: Retail Prices in Six Selected Cities, 1860—1880
(cents per pound)
Connecticut Massachusetts Ohio
Danielsonville Jeweti City Boston Springfield Canton HamiltonYear (June 1) (yr. av.) (yr. av.) (unspecified) (yr. av.) (June 1)
1860 25 23 23 25 12 181S61 22 22 20 24 8 12.5
1862 20 21 21 23 10 15
1863 22 25 24 25 18 25
1864 32 28 37 32 40 45
1865 35 33 42 40 3-5 251866 48 45 46 42 35 351867 35 36 36 40 30 251868 42 42 44 45 25 201869 40 45 44 45 20 15
1870 40 40 44 40 17 251871 35 42 36 40 25 25
1872 35 40 35 42 25 25
1873 38 40 37 43 20 30
1874 38 42 40 42 20 30
1875 35 38 36 38 20 25
1876 35 37.5 34 35 20 201877 28 32 33 33 20 20
1878 28 30 25 25 18 181879 25 27 28 25 16 20
1880 25 28 31 33 20 20
179
OUTPUT GROWTH AND PRICE TRENDS: U.S.
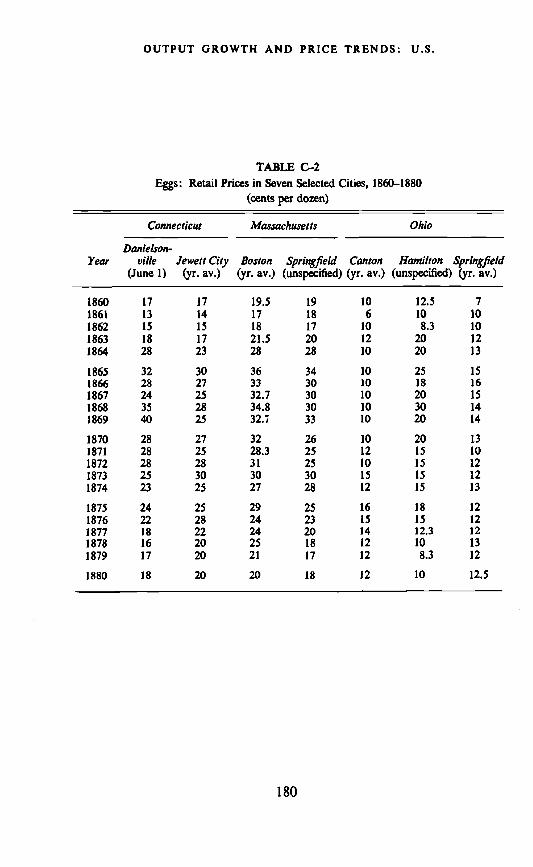
TABLE C-2Eggs: Retail Prices in Seven Selected Cities, 1860—1880
(cents per dozen)
Connecticut Massachusetts Ohio
YearDanielson-
yule(June 1)
Jewett City(yr. av.)
Boston(yr. av.)
Springfield(unspecified)
Canton(yr. av.)
Hamilton(unspecified)
Springfield(yr. av.)
18601861186218631864
171315
1828
171415
1723
19.51718
21.528
191817
2028
106
101210
12.5108.3
2020
710101213
18651866186718681869
3228243540
3027252825
363332.734.832.7
3430303033
1010101010
2518203020
1516
151414
18701871187218731874
2828282523
2725283025
3228.3313027
2625253028
1012101512
2015151515
1.3
10121213
18751876187718781879
2422181617
2528222020
2924242521
2523201817
1615141212
181512.3108.3
1212121312
1880 18 20 20 18 12 10 12.5
180

RETAIL PRICES AFTER 1850
TABLE C-3Cotton Flannel, Medium Quality: Retail Prices in Four Selected
Cities, 1860—1880(cents per yard)
Year
Illinois Pennsylvania
Bloomington(yr. av.)
Peoria(unspecified)
New(yr.
Castleav.)
Sharon(June 1)
1860 12.5 15 12.5 12.51861 15 15 15 12.51862 25 20 25 161863 40 30 45 301864 65 40 55 60
1865 90 60 50 501866 65 50 30 351867 40 30 28 301868 30 20 28 251869 30 15 25 20
1870 25 15 20 201871 25 15 16 201872 25 15 15 201873 25 15 16 18
1874 20 16 15 16
1875 20 16 15 16
1876 20 16 12.5 141877 15 15 12.5 12.51878 12.5 16 12.5 12.51879 12.5 15 12.5 12.5
1880 12.5 16 12.5 12.5
181

TABLE C-4Satinets, Medium Quality: Retail Prices in Nine Selected Cities, 1860-1880
(cents per yard)
Year
Ohio
Canton(yr. av.)
Cincinnati(yr. av.)
Springfield(unspecified)
Zane.sville(yr. av.)
18601861186218631864
7575
100125150
7575808590
7575
100125125
404060
10085
18651866186718681869
12510010010090
100100858075
125125125100100
6560606060
18701871187218731874
9075
757070
7075756565
10087.587.587.587.5
6560606060
18751876187718781879
7575757575
6060605555
87.587.587.587.587.5
6060505050
1880 80 55 87.5 50
Indiana
(yr. av.)Lawrenceburg
(yr. av.)New Albany
(yr. av.)Terre Haute(unspecified)
Vincennes(unspecified)
Year
18601861186218631864
75100100100100
7075
125125150
62.562.575
102.5102.5
n.a.6590
125175
n.a.6075
100200
18651866186718681869
100100100100100
100100908075
9090907070
1401001008575
1501251009587.5
18701871187218731874
10075757575
7575757570
62.550505050
7575756565
7590909085
18751876187718781879
7575757575
6560606060
42.542.542.542.542.5
6565655050
8585757575
1880 75 60 42.5 60 75
182

RETAIL PRICES AFTER 1850
APPENDIX DDerivation of Weights
DISTRIBUTION OF EXPENDITURES AMONG MAJOR CATEGORIES
The distribution of expenditures of 397 families in Massachusetts in1875 was used as the basic distribution for the derivation of the weights.The original figures appear in the Sixth Annual Report for Massachu-setts (pp. 192-450), as averages for families that reported expendituresfor the specified category. The data shown below are these averagesadjusted to reflect the distribution for all families as well as certain minoradjustments for classification purposes.
Expenditures Per cent of TotalTotal expenditures $726. 100.0Food 417.36 57.4
Meat 81.48Fish 9.68Milk 20.38Groceries 305.82b
Clothing, dry goods,boots and shoes 104.28 14.3
Clothing 59.59Dry goods 21.22Boots and shoes 23.47
Rent 121.35 16.7Fuel and light 48.49 6.7
Fuel 43.69Light 4.80
All other 35.22c 49a Excluded gifts and contributions ($7.74) and organization expenses ($2.93) to conform
with BLS practice.b Estimate for kerosene ($4.80) deducted from "groceries" (see p. 413 of Sixth Annual
Report).Incomplete reports show largest items of expenditure in this category probably were
reading matter, liquor, and tobacco.
Expenditures for soap and starch were estimated as 10 per cent of the"all other" total, or $3.52. For reading matter and medical care, alsoincluded in "all other" expenditures were estimated at 1 per cent of totalexpenditures, or $7.27. The remainder of the "all other" was dis-tributed proportionately to all categories other than food.
DISTRIBUTION OF EXPENDITURES FOR INDIVIDUAL ITEMS
The major study used to estimate family expenditures for individualitems was the detailed statement of the expenditures of 232 families in
183

OUTPUT GROWTH AND PRICE TRENDS: U.S.
1890—91 as published in the Aldrich Report (pp. 2088—2093). In manycases, however, it was necessary to make rough estimates of the expen-ditures for the priced items. These rough estimates were obtained eitherfrom later expenditure studies, from text references, or from productionfigures, but in a few cases arbitrary assignments of values were made.
The following distributions for foods illustrate the methods used toderive weighting factors:
Expenditures Expenditures Estimatedof 397 Families of 232 Families Expenditures
in Massachusetts in U.S.a in1875 1890—91 1875
Meat $81.48 $77.03 100.0% $81.48
Beef 40.95 53.2 43.32Hog products 17.20 22.3 18.19Poultry 2.78 3.6 2.94Not specified 16.10 20.9 17.03
Fish 9.68 9.68Milk 20.38 20.38Butter 40.OOb 4ØØØb
Other groceries andprovisions 265.82 138.35 100.0 265.82
Cheese 1.73 1.2 3.19Eggs 8.28 6.0 15.95Tea 4.51 3.3 8.77Coffee 13.97 10.1 26.85Sugar 16.69 12.1 32.17Molasses 1.44 1.0 2.66Lard 5.27 3.8 10.10Flour 26.82 19.4 51.57Bread 11.42 8.3 22.06Rice 0.62 0.4 1.06Fruit 8.80 6.4 17.01Potatoes 11.92 8.6 22.86Vegetables not
specified 12.55 9.1 24.19Vinegar, pickles
and condiments 1.86 1.3 3.46Other foods 12.47 9.0 23.92a Minor differences in dollar amount from summary figures in Aldrich Report due to
adjustments to obtain average expenditures for all families.b Estimated on basis of 130 Lbs. of butter at 30 cents per lb. (See p. 417 of Sixth Annual
Report.)
The first step in allocating expenditures for unpriced items was"direct imputation," that is, the addition of the value of an unpriceditem to a priced item which is assumed to have similar price movements.
184

RETAIL PRICES AFTER i850
The only example of this step in the food group is flour and bread.Since prices for bread were not available, the weight for flour wasincreased from $51.57 to $73.63.
The second step was "indirect imputation," that is, the proportionalallocation of unpriced values to all the priced items in the group. Inthe case of food, the values of $3.46 for vinegar, pickles, and condimentsand $23.92 for other foods were distributed proportionately to theother food categories which were represented by price series. Theshare for flour was $5.18 (18.9 per cent of $27.38) making the finalweight for all flOur and meal $78.81.
The final step was the distribution of these values to the individualitems priced. It was at this stage that most of the allocations were basedon rough estimates. To continue the example of flour, there were fourprice series available—two qualities of wheat flour, rye flour, and cornmeal. Of the total value of $78.81, 80 per cent was assigned to wheatflour (40 per cent to each type), 10 per cent to rye flour, and 10 per centto corn meal. Similar breakdowns were made for other values repre-senting combinations of priced items.
The clothing group presented the greatest difficulty since expendituredata referred to finished articles while price series (other than boots andshoes) were all for yard goods. The value for each type of garment wasdivided among the priced series for the types of goods most probablyused or those made of the same fiber as these goods. For example, theone wool series—mousseline de lame—was assigned 50 per cent of thecombined value of men's overcoats, coats, vests, and trousers; women'scloaks and shawls; and children's overcoats, coats, vests, trousers,cloaks, and shawls. The remainder of this value was assumed to bemade up of 30 per cent cotton flannel and 20 per cent satinets. Shoerepairs were estimated at 5 per cent of expenditures for dry goods andclothing.
In the fuel and light group, coal expenditures were estimated as halfof the fuel total and divided evenly between anthracite and bituminous.The remainder was likewise divided between the two series for wood.
For rents, equal weight was given to the four-room and six- toseven-room dwellings.
For medical care, 90 per cent of the total was divided evenly betweenhouse and office visits and 10 per cent was assigned to obstetrical care.
The percentage distributions of the final value weights for 1875 whichresulted from the estimates and calculations are given in Appendix B.
185

OUTPUT GROWTH AND PRICE TRENDS: U.S.
APPENDIX EMitchell's Cost of Living Index, 1860—1880,
Estimated by Ma/or GroupsThe detailed relative price data for individual items included in
Mitchell's index were recombined to obtain indexes for major groupscorresponding to those in the new consumer price index, 185 1—1880.These group estimates for Mitchell's index are given in the followingtable for selected years (1860 = 100):
FuelAll and
Year Items Food Clothing Rent Light Othera1860 100 100 100 100 100 1001864 170 171 355 130 177 1571865 179 187 324 135 179 1701870 156 164 153 144 147 1511875 138 141 113 141 134 1241880 128 131 96 133 117 101
Soap and starch only.
COMMENTJOHN W. KENDRICK, The George Washington University
Ethel D. Hoover has made a major contribution in reworking earlyretail price data to form a new consumer price index for 1850 to 1880.Her index is superior to Mitchell's because it is based on currentBureau of Labor Statistics procedures and uses several times as muchof the Weeks Report data plus some supplementary material. Theearlier and lower Civil War price peak, and the subsequent greaterdecline now revealed seem to accord better with other evidence and willnecessitate some reinterpretation of this price era.
Hoover's index for 1880—90 is less satisfactory because it is basedlargely on wholesale data but it should not be too difficult to devise abetter index to bridge this gap. The Aldrich Report retail price data for1889—91 might be used in conjunction with the Weeks Report data for1880 to establish decadal changes for certain commodities, while the31st Annual Report of the Massachusetts Bureau of the Statistics ofLabor and the Vermont study might provide data on movements duringthe decade, particularly for food. Further research of the type done byRees, especially for rents, could augment this material.
The CPI could not profitably be pushed back earlier than 1850 with-out extensive research—although the Vermont study and the earlierMassachusetts data provide a starting point.
The new consumer price index is valuable not only in its own right,186

RETAiL PRICES AFTER 1850
but as a demonstration of what can be done with other early price data.For example, a sufficient quantity of data has now been collected towarrant the construction of a new comprehensive wholesale price indexfor the United States. Data include: the wholesale price indexes forsix cities from 1700 to 1861 constructed under the auspices of theInternational Scientific Committee on Price History, three of whichhave been extended to later decades; the wholesale price data in theAldrich Report covering an extensive list of commodities in one to fivemarkets for 1840 to 1891, and later extended by the Department ofLabor; and the producers' prices available in the 10th and later censusesgoing back in some instances to 1830. There are also available specialstudies of prices of particular commodities or groups of commodities invarious periods. An index based on existing materials would be subjectto revision in the light of further research but this fact should not act asa deterrent to the project.
Construction of a national wholesale price index for the nineteenthcentury is no small task. Existing indexes are not uniform with respectto weights, methods of averaging, or in other ways. It would benecessary to go behind the indexes to the basic commodity data orindex numbers, and build up groups according to modern methods ofindex number construction. Mrs. Hoover has pointed the way to sucha reconstruction.
Mrs. Hoover has carefully pointed out the limitations of the availableprice data. Yet one wonders if these early statistics are really muchinferior to the data underlying modern indexes. Although the Bureauof Labor Statistics sometimes adjusts price series for quality changes,when these are associated with changes in unit costs, no really satis-factory method has been devised to isolate the "pure" price factor.Since quality change was probably less important in the nineteenthcentury than today, this problem was less serious for intertemporal andinterproduct comparisons in that period—also the problem of linkingin new products. While the specifications for many of the commoditiesfor which historical price data exist are so vague that supposedlyidentical products may differ over time, the Department of Agriculturedeliberately allows the product types included in its index of prices paidby farmers to vary so that changes in product mix will show up as pricechanges. The Interstate Commerce Commission has never published adetailed description of its methods of preparing indexes of prices paidby the railroads for equipment and other items—so that as much asthese series are used, one cannot be sure how consistent the underlyingcommodity specifications are over time.
I have been asked to comment on the possible use of nineteenthcentury price indexes for deflation of the gross national product. Forthis purpose, the price indexes should be made available in at least as
187
OUTPUT GROWTH AND PRICE TRENDS: U.S.
much group detail as are the current value national product estimates.If one deflates in product detail, and then divides the current by theconstant dollar aggregates, the implicit deflator has, in effect, changingquantity weights. The individual price indexes underlying the com-modity group indexes should also be combined by the Paasche formulaif a true Lespeyre quantity measure is desired. However, occasionallychanging weights as suggested by Mrs. Hoover should provide anadequate approximation to this result.
Since the product estimates are national in scope,, the price deflatorsshould be as geographically representative as possible. Existing whole-sale price indexes tend to overweight eastern and seaboard cities. Berryfound that with respect to Cincinnati and the Ohio Valley, as the regiondeveloped, farm prices rose and nonfarm prices fell relative to prices ineastern markets.' If this pattern is typical, more data for developingwestern markets should be incorporated in wholesale price measures.
The new consumer price index is based on city prices. However, aswe move back in time, the relative importance of consumer outlays inrural areas increases. Price series based on records of country stores, orrecords of prices paid by farmers for family living, such as were exploitedby T. S. Adams in his study of Vermont prices, would importantlysupplement the data on urban prices.
If national product estimates are built up by the commodity flowmethod, retail price indexes can be used to deflate the consumer com-modity groups and, alternatively, wholesale price indexes can be appliedto the estimates at the level of producer values, prior to adjustment fordistributive margins.2 Unless one price index is clearly superior to theother, both methods might be tried and the constant dollar series adoptedwhich seems most reasonable in the light of external checks.
Consumer outlays for services can only be deflated by the appropriateconsumer price indexes. The same household account books that willbe an important source of service price data may also provide the basisfor the service expenditure estimates themselves. Kuznets used theratios of service to commodity outlays from family budget studies toderive this segment of his national product estimates in the earlydecades. Possibly data in household accounting records could servethe same purpose.
To deflate new construction expenditures, it would be relatively easyto construct averages of appropriate wage-rates and materials prices,weighted in combinations appropriate to the various types of newconstruction. The present construction deflator is based in part on thisapproach. This type of cost index does not reflect productivity increases,
1 Thomas S. Berry, Western Prices before 1861, Harvard University Press, 1943.2 See Henry Shavell, "Price Deflators for Consumer Commodities and Capital Equip-
ment, 1929—42." Survey of Current Business, May 1943.
188

RETAIL PRICES AFTER 1850
but the latter have long been insignificant in building. While advancehas been important in heavy construction in recent decades, this wasprobably not the case in the nineteenth century.
Mrs. Hoover has pointed to the gaps in price data for producers'durable equipment. The Census unit value data and special studies offarm equipment prices and railway equipment prices beginning in 1889deserve attention.3 Probably farm equipment manufacturers' recordsand the records of certain railroads are still available for years before1889; if so, they might yield valuable data. Further price research isclearly indicated in the equipment field in view of its key role in economicdevelopment.
Wholesale price indexes fill the need for inventory deflators; theproblem here will be the derivation of measures of net change in currentvalues.
For deflation of net foreign investment (assuming use of the Com-merce Department's method), there will soon be available comprehen-sive indexes of the prices of exports and imports prepared from Customsvalue and quantity data for the years 1800 to 1860 by Douglass North,and from 1879 forward on a quarterly basis by Robert Lipsey. TheNational Bureau will probably also sponsor the work necessary tobridge the 1860—79 gap. North and Lipsey have compared their unitvalue series with domestic wholesale price series for certain com-modities. The movements of the two series were so similar, in mostcases, that the compiler of a wholesale price index might look to theexport or import price data on those commodities for which domesticprice data are not available!
The Commerce Department currently uses wholesale price indexesto deflate government purchases of commodities. While governmentbuying prices may parallel the wholesale prices of the same commodities,it would be useful to test this assumption by constructing indexes basedon the records of the Army, Navy, and certain civilian agencies.
Finally, in order to deflate the gross national product by industry oforigin, we need wholesale price indexes grouped and weighted accordingto primary product production, and regrouped and reweighted in termsof the intermediate products purchased by each of the industries. Thishas been done for agriculture by Towne and Rasmussen, followingprocedures established by the Department of Commerce for the periodsince
George K. Holmes, Course of Prices of Farm Implements and Machinery for a Series ofYears, Dept. of Agriculture, Misc. Series Bulletin 18, 1901; and the reports of the RailroadPresidents' Cost Committees, referred to by William H. Shaw, Value of C'ominodity Outputsince 1869, National Bureau of Economic Research, 1947.
Marvin W. Towne and Wayne D. Rasmussen, "Gross Farm Product and Investmentin the Nineteenth Century" (this volume); also the August 1951 and September 1954issues of the Survey of Current Business.
189

OUTPUT GROWTH AND PRICE TRENDS: U.S.
Once reasonably good economy-wide and industry-wide pricedeflators have been constructed, the analyst will wish to check themovements of the price series for consistency with related variables inthe national accounts. For example: Are the movements of thequotient of average product prices and average factor prices reasonablyconsistent with movements in productivity ratios? Are relative changesin prices among industries inversely correlated with relative changes inproductivity over periods long enough for price changes to tend toapproximate changes in unit costs? Are the relative movements ofprices at wholesale and at retail consistent with data on distributivemargins? When reasonable consistency is achieved in the estimates ofprices and related variables, the way is clear for quantitative analysis ofthe processes of economic change.
Nineteenth century price history opens up vital analytical problems.In contrast to the situation in the twentieth century the trend of priceswas down, wartime inflations being succeeded by adjustments thateventually carried prices below prewar levels. What changes in themonetary system and in the pricing policies of firms and of labororganizations account for this divergent experience? Study of nine-teenth century price determinants might help in the formulation ofpolicies to achieve greater price flexibility and stability today, althoughI am not suggesting pragmatic considerations as a prime reason forhistorical study.
More than twenty years ago F. C. Mills, in an excellent review of thestatus of price data and price research in the thirties, wrote:
Finally, we should note the need of non-price series coordinate with ourprice records. We study price changes for the light they throw on the work-ing attributes of contemporary economic systems. * . . A beginning hasbeen made in the formulation of fruitful hypotheses and the building upof accurate and comparable measurements for the study of economicchange. The betterment of price records must go hand in hand with theimprovement of measures defining changes in other elements of theeconomic system.5
In the same vein, analysts of nineteenth century price statistics mustbe regarded as providing building stones for an integrated set of nationaleconomic accounts in that period.
Frederick C. Mills, "Price Data and the Problems of Price Research," Econometrica,October 1936, p. 309.
190