retail research template - altech chemicals limited dj carmichael...distinguishing feature of...
TRANSCRIPT

D J Carmichael Pty Limited ABN 26 003 058 857 AFSL 232571
Telephone: 08 9263 5200 Facsimile: 08 9263 5283 Email: [email protected] Webpage: http://www.djcarmichael.com.au
RESEARCH
Industrials
Altech Chemicals Ltd (ATC-AU)
Analyst
Paul Adams
Director, Head of Natural Resources
+61 89 263 5200

2 19 February 2016
RESEARCH
Industrials
Table of Contents
1. Front Page-Key Points
2. Corporate Summary
3. Valuation and Recommendation
3.1. Valuation Summary
3.2. WACC Analysis
3.3. Comparable Analysis
Summary
Orbite Technologies Inc
Recent transactions
Sensitivity Analysis
4. Summary Financials Sheet
5. Share Price Catalysts
6. SWOT Analysis
7. Risks and Mitigating Actions
8. Progress on project financing
8.1. Mandate executed with Kfw-IPEX Bank
8.2. What is ECA Cover and how does ATC benefit?
9. ATC Sales & Marketing Strategy
9.1. Agreement with Mitsubishi, Japan
9.2. Marketing Manager, China
10. Bankable Feasibility Study outcomes
10.1. Summary conclusions
10.2. Major Assumptions
10.3. Production ramp-up schedule
10.4. Capital cost estimates
10.5. Operating costs
10.6. Selling price assumptions
10.7. Discount rate and NPV
11. Corporate Summary
11.1. Corporate Structure
11.2. Capital Structure & Shareholders
12. Upstream Items
12.1. Meckering Aluminous Clay Resources
12.2. Approvals
12.3. Second kaolin deposit at Kerrigan
12.4. Mining Rights to Dana

19 February 2016 3
RESEARCH
Industrials
13. Downstream Items
13.1. HPA Plant Site, Tanjung Landsat Industrial Park, Johor
13.2. Major consumables from sister industrial Park
13.3. ATC’s HPA processing facility
13.4. Design philosophy
13.5. Patented process steps
13.6. Optimisation study
13.7. Major Processing Steps
13.8. Process Plant Flow Diagram
14. Macro-economic Considerations for HPA
14.1. Background
14.2. Policy initiatives to drive growth
14.3. HPA Demand
14.4. HPA Supply
14.5. Sapphire glass market
14.6. Potential influence of Apple Inc.
15. HPA Industry Analysis
15.1. Industry attractiveness
15.2. Bargaining power of buyers
15.3. Bargaining power of sellers
15.4. Threat of new entrants
15.5. Threat of substitutes
15.6. Industry rivalry
15.7. ATC’s sustainable competitive advantage
16. Project Schedule
17. Board and Management

4 19 February 2016
RESEARCH
Industrials
Altech Chemicals Ltd (ATC) Speculative Buy
Unique opportunity in high-tech chemicals
Altech Chemicals Ltd (ATC. ASX) is a speciality chemicals company developing a
vertically integrated High Purity Alumina (HPA) project. ATC is unique in that it uses a
process to convert aluminous clay, sourced from its own quarry in Western Australia
(WA), to HPA in a simple, highly cost effective process with operating costs a fraction of
its larger, more established peers. ATC follow a conservative development strategy,
using management’s extensive experience in building chemical plants, with the aim to
be one of the world’s largest producers of HPA. HPA is being used in a growing number
of high tech applications and is set to have a CAGR of 19.7% to 2021.
Key Points
HPA. What is it and what is it used for? HPA (99.99% Al2O3) is sold as a white powder and
is the base material for the manufacture of sapphire substrates, scratch proof sapphire glass
and as a coating on separators used in lithium-ion batteries. Most HPA is used in the
manufacture of LED’s, alumina semi-conductors and phosphor TV screens but it is
experiencing a wider and growing use in smartphones and Li-ion battery applications amongst
others (aerospace, medical, defence). Government Policy and public awareness on energy
saving is, in part, driving the increased usage of these products. ATC is developing a large
HPA project with its own source of feedstock from a quarry in WA and its own HPA plant based
in Malaysia. The Asia–Pacific region is expected to see the highest growth in use of HPA over
the coming years.
Most competitors are using old processes: Most existing producers of HPA exist as small
business units in very large industrial conglomerates, using processing routes that re-refine
aluminium metal that was produced from bauxite via the Bayer Process, to produce HPA. This
is expensive and very energy intensive. High labour costs also add to operating costs. More
recently, aluminium waste products are being used as a feedstock, but ATC has a sustainable
competitive advantage in that it will use an inexpensive, white, very pure aluminous clay as a
feed source.
Project financing: ATC executed an exclusive mandate with Kfw IPEX-Bank GmbH for the
provision of services relating to project financing of its HPA project. The mandate contemplates
the arrangement of senior debt project financing aimed at utilising, to the maximum extent, an
Export Credit Agency (ECA) insurance cover under German-backed project finance export
guarantees. ATC estimate that approximately US$40m of the estimated total US$77m project
capital cost will qualify for ECA cover. An additional $15m of senior debt financing will be
required.
Very robust financial metrics: The current macroeconomic environment in the medium term
favour ATC’s strategic intent. Global 4N HPA demand is set to increase significantly with a
forecast CAGR of 19.7%. This fact and new market developments support ATC’s projected
operating margins. ATC’s planned production facility operates with an attractive contribution
margin generating sustainable gross operating margins of between 60-80% and EBIT margins
of 50%. Unlevered free cash flows are robust with the HPA project generating an IRR of 29%
with a payback period of 5 years.
Recommendation and Valuation: We place a Speculative Buy recommendation and our
risked valuation of $0.41 a share.
12 Month Performance
Source: FactSet
ATC-AU
Current Share Price 0.09$
Current Market Cap $m 14$
Base Case Valuation ($Mcap m) 302.8$
Base Case Valuation ($/sh) 0.81$
Project Stage Risk Discount 50%
Target Price Current Stage ($/sh) 0.41$
Altech Chemicals Ltd

19 February 2016 5
RESEARCH
Industrials
2. Corporate Summary
ATC is a specialty chemicals company, focused on the development of a processing plant that
has the capacity to produce up to 4,000 tonnes of high purity alumina (HPA) per annum for
delivery into the high tech manufacturing industries. Under full capacity, ATC would rank in the
top 3 producers of HPA globally, but more importantly, one of the lowest cost producers. The
distinguishing feature of ATC’s operations is the one-step processing route from aluminous clay
to HPA using hydrochloric acid, rather than having to derive HPA by re-refining aluminium metal
that has been produced from bauxite via the Bayer process.
HPA is an essential component for the manufacture of LED lighting – currently providing 55%
of global HPA demand – and a number of other applications in the high tech space including
the manufacture of sapphire glass, the glass currently employed for high quality watch faces
and mobile phone camera lenses and home button, and soon, the facing glass for new mobile
phone releases. Other applications lie in phosphors (16%) and semi-conductors (22%). Lithium-
ion battery separators could also be a large, growing market for products derived from HPA.
ATC has two upstream sources of high grade aluminous clay from its 100% owned JORC
complaint deposits in WA. Current resources would supply many decades of feedstock at
anticipated mining rates. ATC has also secured a ~4Ha plot of land in a major industrial park in
Johor, Malaysia, where it will build its HPA processing plant. Total capital costs are anticipated
to be ~US$77m.
ATC has already completed a Bankable Feasibility Study (BFS) for the project. Approximately
50% of the plant and equipment is of German or European origin, and consequently ATC has
received an LOI from Euler Hermes Aktiengesellschaft (“Hermes”) in Hamburg, Germany
confirming in-principle support under the export credit insurance guarantee scheme (ECA) from
the Federal Republic of Germany (subject to due diligence), potentially covering 73% of the total
project debt financing. ATC has also executed a mandate with German bank Kfw IPEX-Bank in
relation to securing senior debt project financing.
ATC expect to close project financing by Q4 2016 and begin construction early 2017.
ATC is a specialty chemicals company aimed at providing high purity alumina (HPA) to high tech manufacturing industries
6 19 February 2016
RESEARCH
Industrials
3. Valuation and Recommendation
The financial analysis and valuation of ATC was undertaken after the completion of a thorough
economic and strategic evaluation of the HPA market and ATC’s strategic position. We
completed a Porters Five Forces strategic analysis to review ATC’s sustainable competitive
advantage and developed a level of subjective confidence in relation to ATC’s operating
margins and determined them to be defendable for purposes of the valuation process. We
believe that we have applied a level of risk adjustment to the valuation model to accommodate
the short to medium term economic forces in the HPA industry.
Valuation Summary
The valuation process involved a combination of techniques involving the review of comparable
companies and precedent transactions in order to determine the most appropriate
benchmarked exit multiple for ATC within the Specialist Chemical industry sector.
With the appropriate exit multiple established a WACC analysis was completed initially using a
number of variables from the BFS to establish managements predicted valuation. DJC then
developed a list of comparable companies, de-levered then re-levered the WACC then applied
a series of adjustments to de-risk the financing elements of the HPA project making allowance
for the enterprise size and its position within its life cycle.
The number of industry participants involved in the HPA market is relatively small, yet the
industry concentration is not strong. ATC are unique in terms of their focused strategy and as
a result identifying comparable companies was challenging. Most HPA producers are
established diversified groups. The closest comparable we identified was Orbite Technologies
Inc, in Canada. However it does not have an operating financial history for comparison
purposes and so it was evaluated against ATC as outlined below in Table 6.
The DCF analysis was performed with a downside, upside and base case scenario analysis.
Furthermore, a thorough sensitivity analysis was complete on key outputs as outlined in Table
8 & 9. In our base case analysis we applied a significant discount to current HPA prices being
achieved by Sasol (≈ €36/kg). Note that prices vary according to the product quality.
An exchange rate of AU$0.70 is maintained throughout the model. The future operating
margins are diminished by escalating costs at a faster rate than price rises (negative jaws). For
the debt assumptions we ignored any financing benefits that may be derived from the potential
financing deal from Kfw IPEX-Bank GmbH Germany utilising ECA cover.
In terms of future potential dilution, new equity issues were assumed on the basis of a rising
share price with the first tranche of shares will be issued at AU$0.10, March/April 2016 and the
second tranche issued at AU$0.20 October/November 2016.
The Malaysian corporate tax rate is 25% and there is no withholding tax on dividends back to
Australia. In addition no allowance has been given in this model for the 60% uplift on total
Capex value for calculating depreciation deductions in Malaysia which can be offset against
70% of the operating profits for the first five (5) years of operations. Management have
indicated that this depreciation allowance may possibly extend for another five (5) years
suggesting a very low corporate tax rate in at least the first five years, and possibly ten years,
of operations.

19 February 2016 7
RESEARCH
Industrials
Table 1. Valuation scenario table Source: DJC research
Recommendation and Valuation: We place a Speculative Buy recommendation and our
risked valuation of $0.41 a share.
Variables Management Downside Base Upside
Currency $AU $AU $AU $AU
Exchange Rate 0.90$ 1.00$ 0.70$ 0.70$
Price Inflator 0% 0% 2% 5%
Cost Inflator 0% 3% 5% 2.5%
Prices
Price Change Assumptions 0% -15% 0% 20%
HPA SGA Price 0.44$ 0.37$ 0.44$ 0.53$
HPA 3N Price 10.00$ 8.50$ 10.00$ 12.00$
HPA 4N Price 25.56$ 21.73$ 25.56$ 30.67$
Cost of Capital
WACC (After Tax) 7.4% 12% 10% 6.5%
Percentage Debt Funded by KfW 80% 0 0% 80%
Debt to Equity 70% 70% 70% 70%
Cost of Debt After Tax 3.4% 10% 7.2% 3%
Size Premium 5% 7% 6% 3%
Levered Beta 1.85 1.85 1.85 1.85
Risk Free Rate 3% 3% 3% 3%
Market Risk Premium 5% 5% 5% 5%
Capital Structure
Shares on issue (undiluted) 152,612,782 152,612,782 152,612,782 152,612,782
First Tranche Issue Price 0.10$ 0.08$ 0.10$ 0.15$
Second Tranch Issue Price 0.45$ 0.10$ 0.20$ 0.50$
New Issues & Options
First Tranche Shares Issued 40,000,000 50,000,000 40,000,000 26,666,667
Second Tranche Shares Issued 68,888,889 310,000,000 155,000,000 62,000,000
Options 25,350,000 25,350,000 25,350,000 25,350,000
Total Shares on Issue Fully Diluted 286,851,671 537,965,782 372,965,782 279,965,782
Valuation
EV/EBITDA Exit Multiple 9 5 7 11
IRR 28% 24% 28% 34%
Payback Period (Years) 5 7 5 5
Terminal Value/EV % 56% 46% 49% 62%
Enterprise Value ($m) 521,246$ 168,069$ 379,359$ 882,454$
Implied Equity Value ($m) 444,212$ 91,036$ 302,325$ 805,420$
Indicative Share Price ($/sh) 1.55$ 0.17$ 0.81$ 2.88$
Assumptions
Managements cost of debt asssumes KfW funding at Libor +2%.
Median/ Mean Median/Mean
LTM EV/EBITDA ($10m EV) 6.1/ 11.6 15$ $92/$174 0.25$ 0.46$
2016E EV/EBITDA ($50M EV) 6.7/10.1 50$ $333/506 0.89$ 1.36$
2017E EV/EBITDA ($100 EM) 7.9/8.0 100$ $794/$797 2.14$ 2.13$
Median/ Mean 15$ Median/Mean
2015-2016 LTM EV/EBITDA 10.1/10 15$ $101/$100 0.41$ 0.40$
Precedent Transactions Specialist Chemicals Sector Inidicative Pricing
EV/EBITDA Exit
Multiple
EV (estimated
$m)
Ent Value
(estimated $m)
Indicative
Share Price
($/Sh)
Indicative
Share Price
($/Sh)
EV/EBITDA Exit
Multiple
EV (estimated
$m)
Ent Value
(estimated $m)
Public Company Comparables Specialist Chemicals Sector Indicative Pricing
Altech Chemicals Ltd Valuation Scenarios and Comparisons for HPA
Project Meckering & Johor Summary
DJC Modeling Assumptions
Discounted Cash Flow Input Variables
ATC

8 19 February 2016
RESEARCH
Industrials
DJC applied a number of discount factors to capture a risk adjusted indicative share price as
outlined below.
Table 2. Risk Adjusted Valuation table Source: DJC research
Further risk adjustments were made with a higher discount rate of 10% with an average post-tax
cost of debt of 7.2%, An exchange rate of AU/USD:0.70 and an average 4N HPA price of
AU$25.56/kg were applied. The base case pricing reflects a 45%-56% discount on current prices
paid by European buyers for 4N HPA. The indicative share price is based an enterprise value
of AU$345.6m with an implied equity value of AU$302.3m and a fully diluted share capital of
372,965,782 shares.
Based upon these assumptions, ATC’s HPA project generated an IRR of 29% with a payback of
6 years (full year analysis only) with a reasonable exit EV/EBITDA multiple of 7. Given the long
term nature of this project we considered a terminal value of 52% reasonable.
3.2 WACC Analysis
ATC intend to fund 80% of its debt via Kfw IPEX-Bank GmbH facility with the remainder from
alternative commercial sources. Indications from potential funders is that debt supported by ECA
cover will be offered at around LIBOR plus 2% and the terms and conditions of these potential
loans offer greater flexibility to ATC in terms of future repayment schedules. For the purposes of
the WACC calculation we applied general commercial rates of between 9-12% to all components
of the debt and added a significant size premium to account for current stage of development of
the project.
As the debt will be issued to fund the Malaysian plant development, a 25% tax rate was applied.
In terms of the beta we developed a list of comparable entities unlevered the beta then re-levered
to establish a levered beta of 1.85.
The risk free rate was interpolated from a 10 year AUD Treasury Bond as this rate more than
covers the period of time of the debt funding as outlined in the project. In this process we applied
a WACC of 10%.
Variable Risk Adjusted Impact Comments
4N HPA Sales Included in model 45% HPA price reduction built into DCF
Depreciation Included in model 15% share price inflation from Capex uplift disallow ed
Financing Risk 10% Additional Risk Factor
Execution Risk 25% Additional Risk Factor
Operation Risk 15% Additional Risk Factor
50%
Current Indicative Price 0.81$
Less Risk Discount 0.41$
Target Price 0.41$
Total Added Risk
Discount
Altech Chemicals Ltd: Risk Adjusted Implied Valuation

19 February 2016 9
RESEARCH
Industrials
Table 3. WACC calculation summary Source: DJC research
3.3 Comparable Analysis
Summary
A universe of comparable companies to ATC acts as the foundation of the trading comparisons
valuation methodology. This was developed in order to identify companies with similar business
strategies and financial characteristics to that of ATC.
Orbite Technologies Inc, is a comparable technical competitor listed on the TSX-listed which is
intending to move into production this quarter. As it has not yet generated sustainable earnings
it was not included in the comparable list, instead it was evaluated on a stand-alone basis as
outlined below.
This universe of comparables was interesting as no particular entity mirrored ATC in size, sector
positioning nor strategic focus. Furthermore, a significant number of the identified market
participants are private and non-reporting companies based in China. Outlined below are the list
of selected companies.
Altech Chemicals Ltd Weighted Average Cost of Capital Analysis
($ in millions)
Target Capital Structure Predicted Market Market Debt/ Marginal Unlevered
Debt-to-Total Capitalization 70.0% Company Levered Beta(4) Value of Debt Value of Equity Equity Tax Rate Beta
Equity-to-Total Capitalization 30.0% Mersen SA 0.51 265.70$ 455.20$ 58.4% 30.0% 0.36
Toyo Tanso Co., Ltd. 0.87 5,046.96$ 59,179.60$ 8.5% 30.0% 0.82
Norsk Hydro ASA 0.94 11,167.00$ 74,030.00$ 15.1% 30.0% 0.85
Cost of Debt SEC Carbon Ltd. 0.53 1,626.00$ 34,784.00$ 4.7% 30.0% 0.52
Cost of Debt 9.55% Alcoa Inc. 1.23 9,103.00$ 12,244.00$ 74.3% 30.0% 0.81
Tax Rate 25.0%
After-tax Cost of Debt 7.2% Mean 0.82 32.2% 0.67
Median 0.87 15.1% 0.81
Cost of Equity
Risk-free Rate(1) 2.72% Mean Target Target
Market Risk Premium(2) 4.8% Unlevered Debt/ Marginal Relevered
Levered Beta 1.85 Beta Equity Tax Rate Beta
Size Premium(3) 6.00% Relevered Beta 0.67 233.3% 25.0% 1.85
Cost of Equity 17.6%
WACC 10% 10.3% 8.6% 9.1% 9.6% 10.1% 10.6%
50.0% 10.4% 10.6% 10.8% 10.9% 11.1%
60.0% 10.1% 10.3% 10.5% 10.7% 11.0%
70.0% 9.8% 10.0% 10.3% 10.6% 10.8%
80.0% 9.5% 9.8% 10.1% 10.4% 10.7%
90.0% 9.1% 9.5% 9.8% 10.2% 10.5%
(1) Interpolated y ield on 10-year AUD Treasury Bond Issued Jan 2015
(2) Obtained from www.Market-Risk-Premia.com-Dec 2015
(3) Micro-Cap size premium based on market capitalization Brand.
(4) Sourced from Factset
(5) Libor plus 2% as issued by German bank KFW and approved by ECA (Germany)
(6) Libor 1 month USD 0.42 _Factset
Deb
t-to
-To
tal
Cap
ital
izat
ion
WACC Calculation Comparable Companies Unlevered Beta
WACC Sensitivity Analysis
Pre-tax Cost of Debt

10 19 February 2016
RESEARCH
Industrials
Table 4. Comparable companies operating in Speciality Chemicals Source: DJC research
In terms of the analysis, each companies five (5) year historic financial data and key financial
metrics were reviewed. Growth rate assumptions of each entity were derived and projected
forecasts were applied two (2) years ahead based upon collected data.
Each entities general information, reported and adjusted income statements, balance sheet,
cash flow statement, trading multiples, selected market data, issued capital, LTM return on
investment ratios, and LTM credit statistics were analysed.
Based upon the analysis of the historic financial data 1 year, 2 year and 5 year CAGR’s were
determined where possible and estimated forward looking growth rates for 1 and 2 year out.
The list of companies was summarised into two benchmarking worksheets, comparing market
valuation, LTM statistics, profitability margins, growth rates, ROI, LTM leverage and coverage
ratios. This information was tiered into large cap, mid cap and small cap companies.
Two key output worksheets were derived from this information comparing historic LTM EV, price
and exit multiple analysis.
The final step was to establish industry sector minimum, maximum, median and mean values for
key financial metric outputs. This analysis allowed us to determine the most reasonable
EV/EBITDA exit multiples that would be applied to the DCF model.
The results, outlined in the table below, indicate the mean and median exit multiple for 2016E is
5.9-7.9x EV/EBITDA.
Equity Enterprise LTM
Value ($m) Value ($m) Sales ($m)
Altech Chemicals Limited Prov ides mineral ex ploration serv ices 15$ 14$ -$
Sasol Limited Manufactures industrial chemicals 17,127$ 16,368$ 2,802-$
Alcoa Inc. Manufactures aluminum products, fabricated aluminum and other alloy s 9,551$ 18,819$ 21,442$
Sumitomo Chemical Co., Ltd. Manufactures and distributes basic chemicals, petrochemicals, fine and agrichemicals 8,245$ 17,373$ 29,860-$
Norsk Hydro ASA Manufactures aluminum products and produces renew able energy 6,799$ 7,037$ 14,251$
United Co. RUSAL Plc Produces aluminum, alloy and related products 4,334$ 12,724$ 6,227$
Aluminum Corporation of China Limited Class H Engages in the manufacturing and distribution of alumina, primary aluminum and aluminum fabricated products 1,181$ 7,336$ 15,268$
Shenzhen Desay Battery Technology Co., Ltd. Class A Manufactures alkaline manganese, alkaline and lithium batteries; produces battery chargers and adapters 1,142$ 983$ 1,494$
Vedanta Resources plc Engages in mining of copper, zinc, aluminum and iron ore metals 933$ 27,120$ 12,793$
Nippon Light Metal Holdings Co., Ltd. Manufactures aluminum products 928$ 1,706$ 11,080$
Blue Solutions SA Engages in the production and marketing of electricity storage components and solutions 536$ 558$ 146$
Mersen SA Manufactures and distributes materials and electrical components for the industrial sector 300$ 546$ 1,004$
Toyo Tanso Co., Ltd. Engages in the production and sale of isotropic graphite and other specialized carbon products 286$ 220$ 790$
Tokai Carbon Korea Co., Ltd. Manufactures carbon fibers including silicon w afers and semiconductor materials 263$ 257$ 6,380$
SEC Carbon Ltd. Manufactures and sells graphite and steel products 96$ 98$ 740-$
Ultralife Corporation Produces and sells dry cell batteries 86$ 68$ 70$
Company Business Description
Altech Chemicals List of Comparable Companies ($US m)

19 February 2016 11
RESEARCH
Industrials
Table 5. Comparable company analysis Source: FactSet / DJC research
Alt
ech
Ch
em
icals
Ltd
C
om
pa
rab
le C
om
pa
nie
s A
na
lys
is($
in m
illions,
except
per
share
data
)
Alte
ch
Ch
em
ica
ls
Cu
rre
nt
% o
f2016
LT
ML
TM
LT
Sh
are
52-w
k.
Eq
uit
y
En
terp
rise
EB
ITD
AD
eb
t /
Int
Ex
p /
EP
SD
iv
Co
mp
an
yT
icke
rP
rice
Hig
hV
alu
eV
alu
e2016E
2017E
Ma
rgin
EB
ITD
AE
BIT
DA
2016E
2017E
Gro
wth
Yie
ld
2016E
2017E
Alt
ech
Ch
em
ica
ls L
imit
ed
AT
C-A
U$0.0
7
$0.7
5
$10.5
8
$10.1
4
N
AN
AN
A-
($19.7
2)
N
AN
AN
/AN
AN
AN
A
Sasol Lim
ited
SO
L-Z
A$25.4
5
61%
16,5
80.9
4$
15,8
22.2
3$
5.7
x4.5
x32%
1.6
.x20.2
12.0
.x10.1
.x-1
.3%
25.4
%-1
7.4
%-1
7.3
%
Alc
oa Inc.
AA
-US
7.9
0$
49%
10,3
50.2
6$
19,6
18.2
6$
7.0
x5.9
x14%
1.6
.x4.0
22.7
.x13.3
.x9.6
%6.1
%1%
7%
Sum
itom
o C
hem
ical C
o.,
Ltd
.4005-J
P4.7
9$
75%
7,9
35.2
6$
17,0
62.8
8$
6.4
x6.1
x17%
1.6
.x0.0
11.1
.x9.2
.x30.0
%6.8
%N
AN
A
Nors
k H
ydro
AS
AN
HY
-NO
3.3
8$
54%
6,9
98.7
4$
7,2
36.9
5$
4.5
x5.7
x13%
1.6
.x19.0
11.2
.x16.7
.x8.0
%18.8
%14%
3%
United C
o.
RU
SA
L P
lc486-H
K0.3
0$
38%
4,4
86.2
6$
12,8
76.2
6$
5.5
x8.9
x25%
1.6
.x2.8
3.7
.x5.9
.x44.2
%0.0
%27%
10%
0.0
Me
an
5.8
x6.2
x19%
11.1
13.8
x11.8
x10.8
x18%
11%
Me
dia
n5.8
x5.6
x14%
12.5
13.8
x11.5
x10.0
x10%
7%
Alu
min
um
Corp
ora
tion o
f C
hin
a L
imited C
lass H2600-H
K0.3
2$
46%
1,2
70.9
2$
7,4
26.6
6$
6.6
x8.0
x2%
1.6
.x2.8
.x-1
0.6
x-9
.5x
-76%
0%
NA
NA
Shenzhen D
esay B
att
ery
Technolo
gy C
o.,
Ltd
. C
lass A
000049-C
N5.7
8$
54%
1,1
85.9
4$
1,0
27.6
0$
N
AN
A5%
1.6
.x0.0
.x25.9
x18.7
xN
/A2%
NA
NA
Vedanta
Resourc
es p
lcV
ED
-GB
3.5
1$
33%
944.7
3$
27,1
32.5
3$
10.4
x8.8
x23%
1.6
.x1.9
.x-3
.5x
-5.8
x-6
3%
75%
66%
18%
Nip
pon L
ight
Meta
l H
old
ings C
o.,
Ltd
.5703-J
P1.6
0$
86%
872.5
8$
1,6
51.3
3$
N
AN
A12%
1.6
.x0.0
.xN
AN
AN
/A11%
NA
NA
Blu
e S
olu
tions S
AB
LU
E-F
R18.0
6$
56%
520.7
9$
543.1
1$
29.5
x13.2
x9%
1.6
.x22.9
.x-1
20.9
x46.5
xN
/A0%
NA
NA
Me
an
15.4
x10.6
x11%
5.5
x5.5
x-2
8.2
x13.4
x-3
3%
18%
Me
dia
n12.4
x10.3
x8%
4.2
x1.9
x-6
.8x
6.5
x-3
3%
2%
Tokai C
arb
on K
ore
a C
o.,
Ltd
.064760-K
R25.8
9$
100%
302.2
5$
296.0
6$
17.5
x10.2
x33%
1.6
.x0.0
.x31.3
x14.8
x74%
1.7
6%
NA
NA
Toyo T
anso C
o.,
Ltd
.5310-J
P14.5
0$
72%
300.9
1$
235.0
3$
NA
NA
13%
1.6
.x137.2
.x51.6
x19.9
x36%
6%
NA
NA
Mers
en S
AM
RN
-FR
13.7
1$
48%
283.4
4$
529.0
8$
5.2
x4.9
x13%
1.6
.x9.9
.x15.4
x7.9
x5%
19%
3%
16%
SE
C C
arb
on L
td.
5304-J
P2.2
8$
72%
94.5
4$
96.8
0$
N
AN
A14%
1.6
.x777.0
.xN
AN
AN
/A16%
NA
NA
Ultra
life
Corp
ora
tion
ULB
I-U
S5.0
7$
68%
77.1
7$
59.1
9$
N
AN
A8%
1.6
.x22.4
.xN
AN
AN
/A0%
NA
NA
Me
an
7.9
x7.0
x16%
1.8
x189.3
.x30.4
x13.7
x38%
9%
Me
dia
n5.9
x7.0
x13%
1.7
x22.4
.x25.8
x12.8
x34%
6%
Me
an
10.1
x8.0
x16%
6.1
x68.0
x3.1
x12.4
x14%
13%
Me
dia
n6.7
x7.9
x13%
2.5
x4.0
x11.9
x11.2
x10%
6%
Hig
h30.3
x14.0
x33%
21.8
x777.0
x49.1
x49.3
x75%
75%
Lo
w4.3
x4.6
x2%
0.0
x0.0
x-1
24.4
x-8
.8x
-76%
0%
So
urc
e: C
om
pa
ny f
ilin
gs
, Fa
cs
et,
Co
ns
en
su
s E
sti
ma
tes
No
te: L
as
t tw
elv
e m
on
ths
da
ta b
as
ed
on
De
ce
mb
er
20
15
. E
sti
ma
ted
an
nu
al fi
na
nc
ial d
ata
ba
se
d o
n a
fin
an
cia
l ye
ar.
Tie
r I:
La
rge
-Ca
p D
ive
rsif
ied
Sp
ecia
lia
lity
Ch
em
ica
l C
om
pa
nie
s
Tie
r II
: M
id-C
ap
Div
ers
ifie
d S
pe
cia
lia
lity
Ch
em
ica
ls
Tie
r II
I: S
ma
ll-C
ap
-D
ive
risif
ied
Sp
ecia
lia
lity
Ch
em
ica
ls
Ove
rall
EV
/EB
ITD
AP
/EF
CF
Yie
ld

12 19 February 2016
RESEARCH
Industrials
3.4 Orbite Technologies Inc is ATC’s closest technical competitor
Orbite Technologies Inc. (ORT.TSX) is a Canadian company whose processes are expected to
produce alumina and other high-value products, such as rare earth and rare metal oxides, at one
of the lowest costs in the industry, using feedstocks that include aluminous clay, kaolin,
nepheline, bauxite, red mud, fly ash as well as serpentine residues from chrysotile processing
sites. Orbite is currently in the process of finalising its first commercial high-purity alumina (HPA)
production plant in Cap-Chat, Quebec and has completed the basic engineering for a proposed
smelter-grade alumina (SGA) production plant, which would use clay mined from its Grande-
Vallee deposit (Source: Orbite Technologies Inc website).
Therefore, ORT intend to recover a number of products from a variety of feedstocks, which in
our view, adds a level of complexity to recovery operations. The kaolin feed into the ORT plant
also has a high iron content of around 8% which therefore needs to be removed during the
process.
Existing producers, apart from ORT, commonly use a very expensive and highly processed
feedstock material such as aluminium metal to produce HPA product. Although ORT announced
they would produce product in 2015 a dispute with a contractor on site resulted in a delay in
construction. ORT now expect to start production in 1Q 2016.
ORT intend commissioning a plant with a capacity of 3 tonnes per day, or 1,095 tonnes per year.
The company intended to make an expansion decision to 5 tpd, or 1,825 tpa, in 2016. However,
given the delay in construction completion, we believe this timetable may be pushed back into
2017.
Capital costs for the plant is estimated at US$117m. ORT has a market capitalisation of $152.8m
and in 4Q ORT completed a US$22m debt facility with MidCap Financial at Libor plus 6.5%.
The reason that we believe ATC capital is considerably less than ORT is the simple one-step
process for the manufacture of HPA that ATC will adopt, and the low cost environment afforded
by Malaysia, compared to Canada.
Table 6. Comparison between ORT.TSX and ATC. ASX Source: DJC research, Factset
Shares on Issue (m)
Share Price $
Market Cap ($m)
Cash + Investments ($m)
Debt ($m)
Enterprise value ($m)
Feedstock
By-products
Anticipated HPA production (tpa)
Product range
Year in production (FY)
CAPEX costs (A$m)
Capital intensity ($/t)
Altech Chemical Ltd: Comparitive Evaluation to Orbite Technologies Inc
Orbite Technologies Inc
(ORT.CA)
Altech Chemicals Ltd
(ATC.AU) Metric
Fly ash, kaolin, waste Al, red
mud, SGA
haematite, Mg oxides, REO,
silica
White aluminous clay (kaolin)
Silica
377.51
0.28
105.7
28.5
35.6
112.8
152.6
0.10
15.3
0.5
0
14.8
1825
4N, 5N, 6N
4000
4N
2019
110
27,500
2016
117
64,110

19 February 2016 13
RESEARCH
Industrials
ORT has provided samples to potential purchasers of 5N HPA product (99.999%) for testing
together with other products, such as gamma HPA, which may provide additional opportunities
to include a higher volume customer base.
Figure 1. Price and volume chart for Orbite Technologies Inc (ORT-TSE) Source: FactSet
3.5 Precedent Transactions
A world review of the recent precedent transactions identified a small but meaningful sample of
merger and acquisition transactions. This list of precedent transactions was created by
identifying transaction type, consideration paid, and acquirer in the specialist chemicals sector.
We then spread out the financial metric of each transaction and compared the LTM sales,
EBITDA, EBIT and LTM EBITDA margins. Lastly, we analysed the equity value to LTM net
income. The range of exit multiples was calculated for this sample.
The transactions identified as relevant date back to 2004. The calculated mean and median
EV/EBITDA multiple from the last twelve months (LTM) is 10.1x-10.0x.
Table 7. Precedent transactions Source: FactSet / DJC Research
Altech Chemicals Ltd Precedent Transactions Analysis($ in millions)
E16 E12 E7 E18 E19 E30 E37 E40 E42 E44 O41 E46 ##
Enterprise Value / LTM Equity Value / Premiums Paid
Date Transaction Purchase Equity Enterprise LTM LTM LTM EBITDA LTM Days Prior to Unaffected
Announced Acquirer Target Type Consideration Value Value Sales EBITDA EBIT Margin Net Income
511733MM
20090430 Platinum Equity LLC Alcoa, Inc. /Wire Harness & Electrical Distribution Bus/Acquisition / Merger Combo 175 175 0.2x
465198MM
20080318 Nippon Oil Corp. Kyushu Oil Co., Ltd. Acquisition /
Merger
Cash 152 1,538 0.2x 15.1x 15.1x 1% 26.7x
452402MM
20071223 Rank Group Holdings Ltd. Alcoa, Inc. /Packaging &
Consumer Division/
Acquisition /
Merger
Cash 2,700 2,700 0.8x 28.4x
428675MM
20070521 Ineos Group Holdings Plc Kerling ASA Acquisition /
Merger
908 908 0.8x 10.1x 10.1x 8% 13.6x
409498MM
20070202 Tanabe Seiyaku Co., Ltd. Mitsubishi Pharma Corp. Acquisition /
Merger
Stock 4,357 4,357 2.2x 25.4x
329410MM
20050228 Orkla ASA Elkem AS Acquisition /
Merger
Cash 899 2,537 0.8x 6.1x 10.1x 13% 20.2x
320835MM
20041125 Dainippon Sumitomo Pharma
Co., Ltd.
Sumitomo Pharmaceuticals
Co., Ltd.
Acquisition /
Merger
Stock 2,207 2,207 1.7x 11.1x 11.1x 15% 18.8x
317839MM
20041027 Ryerson Tull, Inc. Integris Metals Corp. Acquisition /
Merger
Cash 410 653 0.4x 7.6x 9.4x 5% 16.9x
Mean 0.9x 10.0x 11.2x 8% 21.4x
Median 0.8x 10.1x 10.1x 8% 20.2x
High 2.2x 15.1x 15.1x 15% 28.4x
Low 0.2x 6.1x 9.4x 1% 13.6x
14 19 February 2016
RESEARCH
Industrials
3.6 Sensitivity Analysis
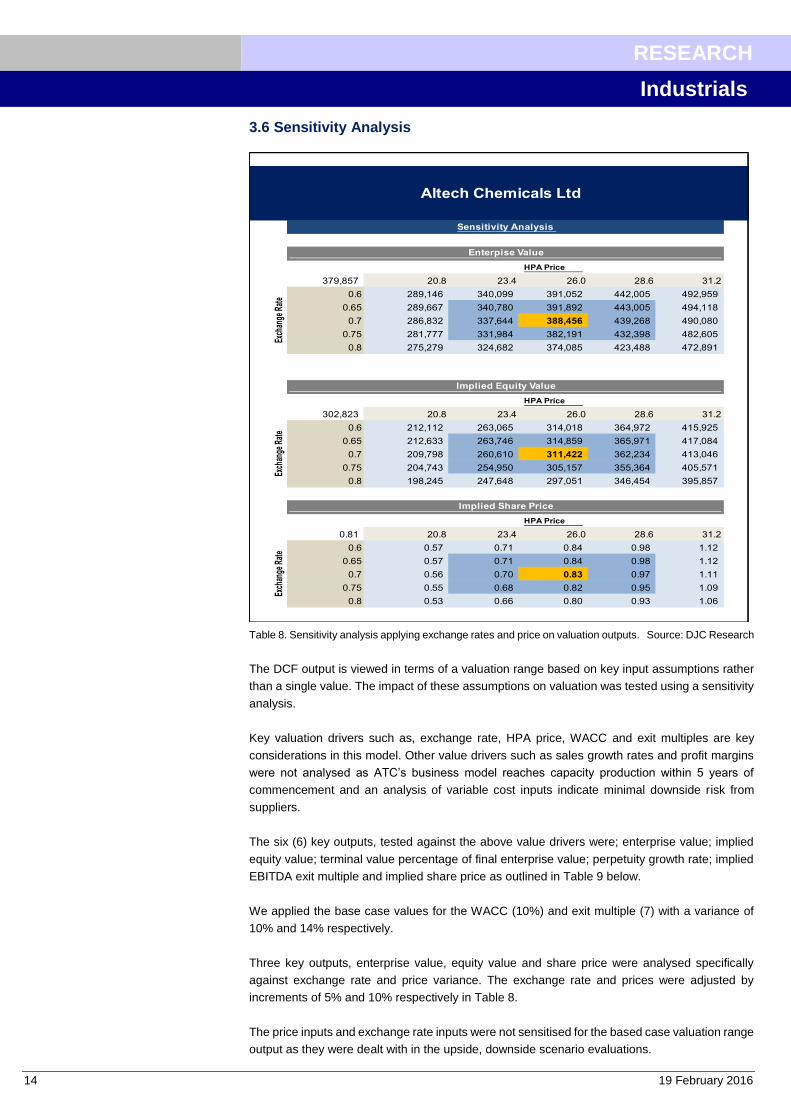
Table 8. Sensitivity analysis applying exchange rates and price on valuation outputs. Source: DJC Research
The DCF output is viewed in terms of a valuation range based on key input assumptions rather
than a single value. The impact of these assumptions on valuation was tested using a sensitivity
analysis.
Key valuation drivers such as, exchange rate, HPA price, WACC and exit multiples are key
considerations in this model. Other value drivers such as sales growth rates and profit margins
were not analysed as ATC’s business model reaches capacity production within 5 years of
commencement and an analysis of variable cost inputs indicate minimal downside risk from
suppliers.
The six (6) key outputs, tested against the above value drivers were; enterprise value; implied
equity value; terminal value percentage of final enterprise value; perpetuity growth rate; implied
EBITDA exit multiple and implied share price as outlined in Table 9 below.
We applied the base case values for the WACC (10%) and exit multiple (7) with a variance of
10% and 14% respectively.
Three key outputs, enterprise value, equity value and share price were analysed specifically
against exchange rate and price variance. The exchange rate and prices were adjusted by
increments of 5% and 10% respectively in Table 8.
The price inputs and exchange rate inputs were not sensitised for the based case valuation range
output as they were dealt with in the upside, downside scenario evaluations.
HPA Price
379,857 20.8 23.4 26.0 28.6 31.2
0.6 289,146 340,099 391,052 442,005 492,959
0.65 289,667 340,780 391,892 443,005 494,118
0.7 286,832 337,644 388,456 439,268 490,080
0.75 281,777 331,984 382,191 432,398 482,605
0.8 275,279 324,682 374,085 423,488 472,891
HPA Price
302,823 20.8 23.4 26.0 28.6 31.2
0.6 212,112 263,065 314,018 364,972 415,925
0.65 212,633 263,746 314,859 365,971 417,084
0.7 209,798 260,610 311,422 362,234 413,046
0.75 204,743 254,950 305,157 355,364 405,571
0.8 198,245 247,648 297,051 346,454 395,857
HPA Price
0.81 20.8 23.4 26.0 28.6 31.2
0.6 0.57 0.71 0.84 0.98 1.12
0.65 0.57 0.71 0.84 0.98 1.12
0.7 0.56 0.70 0.83 0.97 1.11
0.75 0.55 0.68 0.82 0.95 1.09
0.8 0.53 0.66 0.80 0.93 1.06
Sensitivity Analysis
Enterpise Value
Exch
ange
Rat
e
Implied Equity Value
Exch
ange
Rat
e
Implied Share Price
Exch
ange
Rat
e
Altech Chemicals Ltd

19 February 2016 15
RESEARCH
Industrials
Table 9. Sensitivity analysis using WACC and exit multiple on various financial metrics Source: DJC Research
Exit Multiple Exit Multiple
379,857 6.0 6.5 7.0 7.5 8.0 -8% 6.0 6.5 7.0 7.5 8.0
9.0% 390,075 405,858 421,641 437,425 453,208 9.0% -9.34% -8.69% -8.12% -7.62% -7.17%
9.5% 370,335 385,274 400,214 415,154 430,094 9.5% -9.30% -8.65% -8.08% -7.58% -7.14%
10.0% 351,567 365,712 379,857 394,002 408,147 10.0% -9.26% -8.61% -8.05% -7.55% -7.11%
10.5% 333,718 347,113 360,509 373,905 387,300 10.5% -9.23% -8.58% -8.01% -7.52% -7.08%
11.0% 316,734 329,424 342,113 354,802 367,492 11.0% -9.19% -8.54% -7.98% -7.49% -7.05%
Exit Multiple Exit Multiple
302,823 6.0 6.5 7.0 7.5 8.0 4 6.0 6.5 7.0 7.5 8.0
9.0% 313,041 328,824 344,608 360,391 376,174 9.0% 4.5 4.7 4.8 5.0 5.2
9.5% 293,301 308,241 323,180 338,120 353,060 9.5% 4.3 4.4 4.6 4.8 4.9
10.0% 274,533 288,678 302,823 316,968 331,113 10.0% 4.0 4.2 4.4 4.5 4.7
10.5% 256,684 270,079 283,475 296,871 310,267 10.5% 3.8 4.0 4.1 4.3 4.4
11.0% 239,701 252,390 265,079 277,768 290,458 11.0% 3.6 3.8 3.9 4.1 4.2
Exit Multiple Exit Multiple
52% 6.0 6.5 7.0 7.5 8.0 0.81$ 6.0 6.5 7.0 7.5 8.0
9.0% 48.6% 50.6% 52.4% 54.1% 55.7% 9.0% 0.84 0.88 0.92 0.97 1.01
9.5% 48.4% 50.4% 52.3% 54.0% 55.6% 9.5% 0.79 0.83 0.87 0.91 0.95
10.0% 48.3% 50.3% 52.1% 53.9% 55.5% 10.0% 0.74 0.77 0.81 0.85 0.89
10.5% 48.2% 50.2% 52.0% 53.7% 55.3% 10.5% 0.69 0.72 0.76 0.80 0.83
11.0% 48.1% 50.1% 51.9% 53.6% 55.2% 11.0% 0.64 0.68 0.71 0.74 0.78
WA
CC
WA
CC
Implied Perpetuity Growth Rate Enterprise Value
Sensitivity Analysis
WA
CC
WA
CC
Implied Equity Value Implied Enterprise Value/EBITDA (Yr 5)
WA
CC
WA
CC
PV of Terminal Value % of Enterprise Value Implied Share Price
Altech Chemicals Ltd

16 19 February 2016
RESEARCH
Industrials
4. Financial Summary Sheets
Altech Chemicals Ltd Balance Sheet
2015a 2016e 2017e 2018e 2019e 2020e 2021e 2022e 2023e
Cash 575 3,300 821 315 431 3,512 7,886 13,135 63,996
Current Assets 1,549 3,320 841 335 8,233 14,372 22,014 31,350 84,460
Total Assets 3,780 9,159 61,342 120,514 109,750 104,303 102,640 124,752 173,137
Debt 815 0 20,297 76,635 70,481 48,917 14,574 0 0
Other Liabilities 228 228 0 0 0 0 0 0 0
Total Liabilities 1,043 1,215 20,697 79,873 92,920 83,123 62,751 26,111 12,430
Total Shareholders' Equity 2,736 7,944 40,645 40,641 23,730 28,310 47,543 107,168 160,678
Full Year Summary (A$m)
Altech Chemicals Ltd Income Statement
2015a 2016e 2017e 2018e 2019e 2020e 2021e 2022e 2023e
Sales Revenue 0 0 0 0 38,911 54,200 70,538 90,978 102,222
EBITDA (1,293) 0 65 3 15,844 31,099 45,631 65,215 76,650
Depreciation & Amortisation (8) 0 0 0 (17,955) (10,928) (9,713) (8,866) (7,895)
EBIT (1,301) 0 59 (4) (11,066) 10,283 25,328 45,773 58,191
Net Interest Expense (66) 0 0 0 (5,845) (5,451) (4,101) (1,829) (197)
Profit Before Tax (1,367) 0 59 (4) (5,220) 15,735 29,429 47,602 58,389
Income Tax Expense 0 0 0 0 0 (252) (1,995) (3,553) (4,485)
Underlying NPAT (1,392) 0 59 (4) (16,911) 4,581 19,233 59,625 53,510
Abnormal Items 0.00 0.00 0.00 0.00 0.00 0.00 0.00 0.00 0.00
Minority Interests 0.00 0.00 0.00 0.00 0.00 0.00 0.00 0.00 0.00
Reported NPAT (1,392) 0 59 (4) (16,911) 4,581 19,233 59,625 53,510
Normalised Earnings (1,392) 0 59 (4) (16,911) 4,581 19,233 59,625 53,510
Full Year Summary (A$m)
Altech Chemicals Ltd Cash Flows
2015a 2016e 2017e 2018e 2019e 2020e 2021e 2022e 2023e
Cash Flow Operations
Sales 0 0 0 0 38,911 54,200 70,538 90,978 102,222
Other Items 8 (1,629) 500 0 (13,329) (7,238) (11,906) (17,366) (13,219)
Operating Cash Flow 8.40 (1,629.00) 500.00 0.00 25,582.29 46,961.85 58,632.17 73,611.47 89,003.26
Cash Flow Investing
Capital Expenditure (49,195.02) (49,400.96) (999.97) (1,999.96) (2,999.96) (3,999.96) (3,999.96) (4,999.95) (4,999.95)
Free Cash Flow (49,186.62) (51,029.96) (499.97) (1,999.96) 22,582.34 42,961.89 54,632.20 68,611.52 84,003.31
Cash From Financing
Equity Raised 0 5,450 31,250 0 0 0 0 0 0
Dividends Paid 0 0 0 0 0 0 0 0 0
Inc/(Dec) in Borrowings 0 20,297 58,938 0 0 0 0 0 0
Less Debt Repayment 0 0 0 (2,600) (12,000) (27,300) (41,500) (15,100) 0
Financing Cash Flow 0 25,747 90,188 (2,600) (12,000) (27,300) (41,500) (15,100) 0
Movement in Net Cash (49,187) 464 179,877 (7,200) (1,418) (11,638) (28,368) 38,412 84,003
Full Year Summary (A$m)
19 February 2016 17
RESEARCH
Industrials
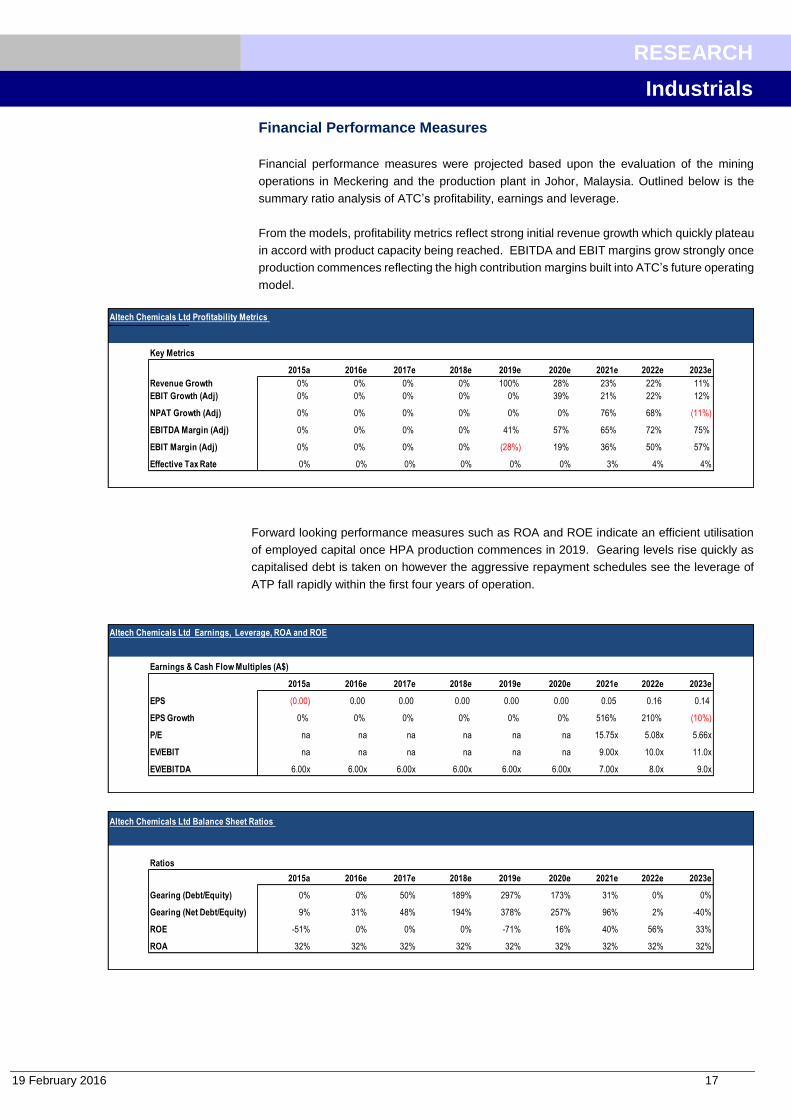
Financial Performance Measures
Financial performance measures were projected based upon the evaluation of the mining
operations in Meckering and the production plant in Johor, Malaysia. Outlined below is the
summary ratio analysis of ATC’s profitability, earnings and leverage.
From the models, profitability metrics reflect strong initial revenue growth which quickly plateau
in accord with product capacity being reached. EBITDA and EBIT margins grow strongly once
production commences reflecting the high contribution margins built into ATC’s future operating
model.
Forward looking performance measures such as ROA and ROE indicate an efficient utilisation
of employed capital once HPA production commences in 2019. Gearing levels rise quickly as
capitalised debt is taken on however the aggressive repayment schedules see the leverage of
ATP fall rapidly within the first four years of operation.
Altech Chemicals Ltd Profitability Metrics
Key Metrics
2015a 2016e 2017e 2018e 2019e 2020e 2021e 2022e 2023e
Revenue Growth 0% 0% 0% 0% 100% 28% 23% 22% 11%
EBIT Growth (Adj) 0% 0% 0% 0% 0% 39% 21% 22% 12%
NPAT Growth (Adj) 0% 0% 0% 0% 0% 0% 76% 68% (11%)
EBITDA Margin (Adj) 0% 0% 0% 0% 41% 57% 65% 72% 75%
EBIT Margin (Adj) 0% 0% 0% 0% (28%) 19% 36% 50% 57%
Effective Tax Rate 0% 0% 0% 0% 0% 0% 3% 4% 4%
Altech Chemicals Ltd Earnings, Leverage, ROA and ROE
Earnings & Cash Flow Multiples (A$)
2015a 2016e 2017e 2018e 2019e 2020e 2021e 2022e 2023e
EPS (0.00) 0.00 0.00 0.00 0.00 0.00 0.05 0.16 0.14
EPS Growth 0% 0% 0% 0% 0% 0% 516% 210% (10%)
P/E na na na na na na 15.75x 5.08x 5.66x
EV/EBIT na na na na na na 9.00x 10.0x 11.0x
EV/EBITDA 6.00x 6.00x 6.00x 6.00x 6.00x 6.00x 7.00x 8.0x 9.0x
Ratios
2015a 2016e 2017e 2018e 2019e 2020e 2021e 2022e 2023e
Gearing (Debt/Equity) 0% 0% 50% 189% 297% 173% 31% 0% 0%
Gearing (Net Debt/Equity) 9% 31% 48% 194% 378% 257% 96% 2% -40%
ROE -51% 0% 0% 0% -71% 16% 40% 56% 33%
ROA 32% 32% 32% 32% 32% 32% 32% 32% 32%
Altech Chemicals Ltd Balance Sheet Ratios

18 19 February 2016
RESEARCH
Industrials
Table 10. Revenue, Cash Flow, Margin and Tax Analysis Source: DJC Research
Supporting the financial statements above are the graphs for revenue, cash flow, EBITDA, EBIT
and Tax. Note the tax rate applied does not include the capex allowance and hence the graphs
potentially overestimate the tax paid.
The gradual increase in revenues is reflective of the staged plant development and the shift from
SGC, 3N & 4N production in 2019 to entirely 4N production by 2022. Once full production
capacity is reached revenues plateau.
Cash flow charting show traditional project financing cash flow impacts which will be funded by
the debt and equity raises proposed in FY2016 and FY2017.
Altech Chemicals Ltd Financial Analysis Graphs
-
20,000
40,000
60,000
80,000
100,000
120,000
140,000
2016e 2017e 2018e 2019e 2020e 2021e 2022e 2023e 2024e 2025e 2026e 2027e 2028e 2029e 2030e
Rev
enue
s A
U$(
m)
Production Year
HPA Revenues
Series1
Linear (Series1)
-20,000
-10,000
-
10,000
20,000
30,000
40,000
50,000
60,000
70,000
80,000
90,000
2016e 2017e 2018e 2019e 2020e 2021e 2022e 2023e 2024e 2025e 2026e 2027e 2028e 2029e 2030e
$AU
(m
)
Production Year
EBITDA, EBIT and EFFECTIVE TAX
EBITDA EBIT Tax
-60000
-40000
-20000
0
20000
40000
60000
80000
2016e 2017e 2018e 2019e 2020e 2021e 2022e 2023e 2024e 2025e 2026e 2027e 2028e 2029e 2030e
Cas
h Fl
ow $
AU(m
)
Production Year
Cash Flows
Cash Flows

19 February 2016 19
RESEARCH
Industrials
5. Share Price Catalysts
Successful grant of ECA cover: Positive conclusion of Export Credit Agency cover will mitigate
risk for German-based debt providers and will mean that financing terms for the project debt
component will be very favourable. This in turn reduces the financing costs and WACC.
Successful financial due diligence: Kfw IPEX-Bank are currently mandated to source primary
debt funding for the project. As part of this process Kfw IPEX Bank are making extensive Due
Diligence enquiries. Successful DD paves the way for project financing negotiations with debt
providers.
Further off-take or distribution agreements: Similar to the Mitsubishi Agreement for Japan,
where Mitsubishi will act as exclusive seller and distributor of HPA to the Japanese markets, we
would expect to see further off-take and/or distribution MOU’s or Agreements for other Asian
countries. ATC recently appointed an experienced Chinese-based Sales and Marketing Manager
to establish off-take agreements in that jurisdiction.
Meckering and Malaysian approvals: Mining approval for Meckering and Malaysia
environmental and construction approvals will also be an important risk mitigation step but
unlikely to be major price catalysts in themselves.
Completion of project debt funding: Arrangements for project debt (execution of a financing
terms sheet) through Kfw IPEX-Bank or another lender. We see a successful conclusion to debt
funding as a major milestone for the project, which will effectively mitigate much of the financing
risk. We envisage successful debt funding to be the precursor to an equity issue to obtain the
remainder of the project financing. We have assumed a debt:equity ratio of 70:30.
Commissioning of process plant: Commissioning of the process plant is likely to take at least
6 months. First 4N product will be used as samples to establish permanent supply contracts as
buyers will have to be satisfied with the quality of the product and the consistency of supply.
Satisfactory specifications on sample 4N product should be another major operational milestone
and confirm that the plant is operating as expected.
First commercial HPA production: First production and ramp up in sales will provide cash flow
and establish ATC as a major player in the global HPA market. This will be a major price catalyst
as they will be the only company globally to provide a focused exposure to the HPA market with
one of the lowest production costs in the world.
Potential corporate activity: We believe that ATC, once in full scale operation, could be a prime
takeover target for a larger company. Suitors would likely to come from established, large-scale
specialist chemical providers who already have an exposure to HPA production. The more
established industrial HPA producers will likely have older, higher cost operations and would
seek to get further down the cost curve and gain market share in this fast growing sector.

20 19 February 2016
RESEARCH
Industrials
6. SWOT Analysis
Focused on HPA production only Currency exposure
Patented process Reliance on HPA sales agreements
Low operating costs Project Execution Risk
Established Japanese distribution New entrant to established market
Upstream kaolin supply
Located close to markets in Asia
Growing demand for HPA Global competition
Exposed to Li Fe battery sector Variation in feedstock impurities
Policy drivers Changes to Malaysian business conditions
Industry consolidation Project financing
New technologies
Future Takeover taget
S W
O T
Significant Malaysian
shareholder already on register
Access to cheap project
financing at attractive terms

19 February 2016 21
RESEARCH
Industrials
7. Risks and Mitigating Actions
Lower grade kaolin feed
There is a risk that kaolin of lower grade will be fed into the plant, thereby effecting the
ability of the processing plant to produce 4N quality product as a result of high
contaminants. ATC will now construct the kaolin beneficiation plant to Malaysia. Initially
we thought this could present a grade control issue in Malaysia.
Mitigation step: However, mining over the 2 month period will produce enough raw
product for 3 years of supply. The kaolin will be grade controlled at site and stored in a
number of grade fingers where grade is significantly different. Ongoing sampling on site
will ensure that grades are blended (if required) and managed to produce the right
balance of kaolin grade and contaminants.
Not achieving 4000tpa of 4N production or meeting 4N specification
There is a risk that ATC will not be able to ramp up production to 4,000t of 4N HPA
(design capacity). This would potentially affect revenues, operating costs and payback.
Mitigation step: ATC has built in a relatively slow ramp up in their BFS financial model,
assuming that full design capacity will only be reached in Year 5. This allows time for
fine tuning the process if required and takes a measured approach to delivery of 4N
product into a market commensurate with increasing demand. ATC has assumed that
initial sales will consist of a variety of products, from a lower value SGA (Smelter Grade
Alumina) through 3N HPA and, increasingly, 4N HPA until an envisaged 4,000 tonnes
per annum of 4N HPA is produced.
Price war on too much supply
The CAGR on the value of the HPA market is anticipated to be 16.3% from 2015 to
2021. In volume terms the global HPA market is expected to expand at a CAGR of
19.7%. A supply response from existing producers, and potentially new entrants, is
expected. Downward pressure on prices could be exerted if new supply is excess to
demand.
Mitigation step: ATC are likely to be operating in the lower third of the cost curve for
production of HPA. This is due to their process using kaolin as a feedstock and the use
of HCl in a closed recovery circuit reducing reagent costs. It would be unlikely that a
price war by largely, higher cost producers would affect ATC production as competitor
margins and capacity are constrained by old production facilities.
Lack of future capital raising to achieve detailed design
Just like any other listed company in a development phase ATC are required to find
funds for the completion of studies. ATC need to find enough funds to complete
outstanding work and to fund working capital prior to project funding completion.
Mitigation step: ATC has already completed its bankable feasibility Study and has
embarked on the detailed design phase prior to construction. Even so, optimisation
work post BFS completion has identified at least one change to the process design
which will have operational benefits. Other requirements involve continuing permitting
activity, none of which will make large draws on cash. Support from its major Malaysian
domiciled shareholder – Melewar International Investment Company should likely be
available.
22 19 February 2016
RESEARCH
Industrials
Plant utilisation, HPA recovery and bottle-necks
With any new plant, there are likely to be some issues identified during the
commissioning process. Bottle-necks and design faults could reduce plant utilisation,
recoveries and affect production levels.
Mitigation steps: ATC has designed its plant to use off-the-shelf components as much
as possible, with no new technology employed in the processing route. Additionally,
ATC has built in conservative estimates for utilisation and recovery into its financial
model in anticipation of these issues. Recoveries are conservatively assumed at 80%
and plant utilisation has been assumed at 77% in the model, including planned
maintenance.
Project financing
ATC need to secure debt and equity financing during 2016. In uncertain capital markets,
this could be challenging.
Mitigation Step: The recent financing proposals from Kfw-IPEX Bank in Germany and
a successful application to access the ECA cover will mitigate some financial risk. The
guarantee under the scheme will mean financing for that portion covered under the
scheme will be at very attractive rates and be of low risk to lenders. Kfw-IPEX Bank has
arranged project finance for a number of similar speciality chemical projects in the
region and is well placed to arrange project financing. Debt is to be held at the project
level.
19 February 2016 23
RESEARCH
Industrials
8. Progress on Project Financing
Mandate executed with Kfw IPEX-Bank
Following several meetings late last year, ATC received a Letter of Interest (LOI) from Kfw IPEX-
Bank and on 2 December 2015, executed an exclusive mandate with the bank for the provision
of services relating to project financing of the Company’s HPA project.
Kfw IPEX-Bank is a wholly owned subsidiary of the promotional bank Kfw and will provide
advisory and structuring services to ATC. The subsidiary is a leading German export and project
finance group with significant experience in mining and chemicals projects globally, including in
Asia, where the bank has advised on projects similar to ATC’s HPA plant.
The mandate contemplates the arrangement of senior debt project financing that is aimed at
utilising, to the maximum extent, an Export Credit Agency (ECA) insurance cover under German-
backed project finance export guarantees.
The Kfw IPEX-Bank is the largest subsidiary of the Kfw Banking Group and unlike the parent
bank, competes directly with commercial banks and is therefore legally and financially
independent of its parent. Kfw-IPEX Bank’s balance sheet amounted to €26.3 billion in 2014.
What is ECA cover and why would ATC qualify for its use?
ECA cover is an instrument for the promotion of German exports. Essentially it is a cover facility
to bank lenders to insure against risk of an export loan and is administered by Euler Hermes, the
German Export Credit Agency. As a result of the insurance cover for lenders, the interest rate on
that part of the project financing covered by the ECA is at very attractive rates, given that the risk
on that portion is mitigated for the lender. The term of debt covered is also long term.
On 10 December 2015, ATC received an LOI for German export credit cover. Whilst still subject
to due diligence, the receipt of the letter is a major step in advancing ATC’s project financing, as
Hermes would have already undertaken its preliminary evaluation of the HPA project. ATC need
to now submit a detailed application with supporting documentation to obtain the ECA cover.
ATC estimate that approximately US$40m of the total US$77m project capital cost will qualify for
ECA cover. An additional $15m of senior debt financing will be required to total around US$55m
of project debt.
ATC qualify under the German ECA scheme as the majority of the plant componentry and the
EPC contractor, M+W Group, originate from Germany or other EU countries. This goes back to
the design philosophy behind the plant which would utilise as much as possible, top quality, off-
the-shelf components. Many of the component suppliers chosen by ATC happen to be German,
or EU based and it is for this reason that ATC qualify for ECA cover.
Kfw IPEX-Bank has an operational base in Singapore as do ATC’s EPC contractor, M+W.
Remainder of Project financing likely through equity
Much of the remaining project finance for the HPA project would likely come from equity
representing an approximate 70:30 debt:equity split.
Kfw is a German government-owned development bank that supports and promotes German manufacturing and innovation in export projects globally
ECA insurance cover significantly reduces the risk to lenders and therefore secures very low interest rates for borrowers

24 19 February 2016
RESEARCH
Industrials
9. Altech’s HPA Sales and Marketing Strategy Sales and Distribution Agreement with Mitsubishi
On 24 September 2015, ATC announced the execution of a Sales and Distribution Agreement
with Mitsubishi Australia Ltd (“Mitsubishi”), a corporate subsidiary of Mitsubishi Corporation,
Japan. In 2014, Japan was estimated to represent 21% of the estimated global demand for HPA,
equivalent to approximately 4,000 tonnes of demand, or coincidently, ATC’s annual output at full
capacity.
The agreement appoints Mitsubishi as exclusive seller and distributer of ATC’s HPA product into
the Japanese market. ATC would benefit from the extensive industrial reach of Mitsubishi which
operates across a variety of industries, including the chemicals industry. Mitsubishi has agreed
not to purchase or resell any HPA from a third party supplier. Mitsubishi will only buy and resell
ATC’s HPA within Japan.
ATC appoints Sales and Marketing Manager, China
On 14 January 2016, ATC announced the appointment of a Sales and Marketing Manager, Mr
Martin Ma, for China. Given ATC’s strategy to focus on the Asia-Pacific Region, the appointment
of a Sales and Marketing Manager for China will complement the Mitsubishi Agreement for Japan
and will facilitate ATC to gain market share in both these important jurisdictions, where HPA is
already in use for the manufacture of high tech items.
The incumbent has extensive experience in sales management of high purity feedstock to
Chinese industries such as lithium battery and electrical vehicle industries. There is growing
demand for HPA to be incorporated in batteries as coatings on battery separators as it increases
discharge rates, lowers self-discharge and lengthens battery life cycles. The increasing
deployment of electric vehicles in China and rapid growth in battery manufacture and increasing
use of LED’s makes China an important market for HPA.
Mr Ma has previously been involved in sales and marketing of lithium carbonate into north and
central China with Galaxy Lithium.
We expect to see other appointments in the Asia-Pacific Region as ATC gets closer to HPA
production.
The strategic agreement brings one of the most influential Japanese industrial giants to act as ATC’s exclusive seller in japan, which represents over 20% of the global market for HPA
19 February 2016 25
RESEARCH
Industrials
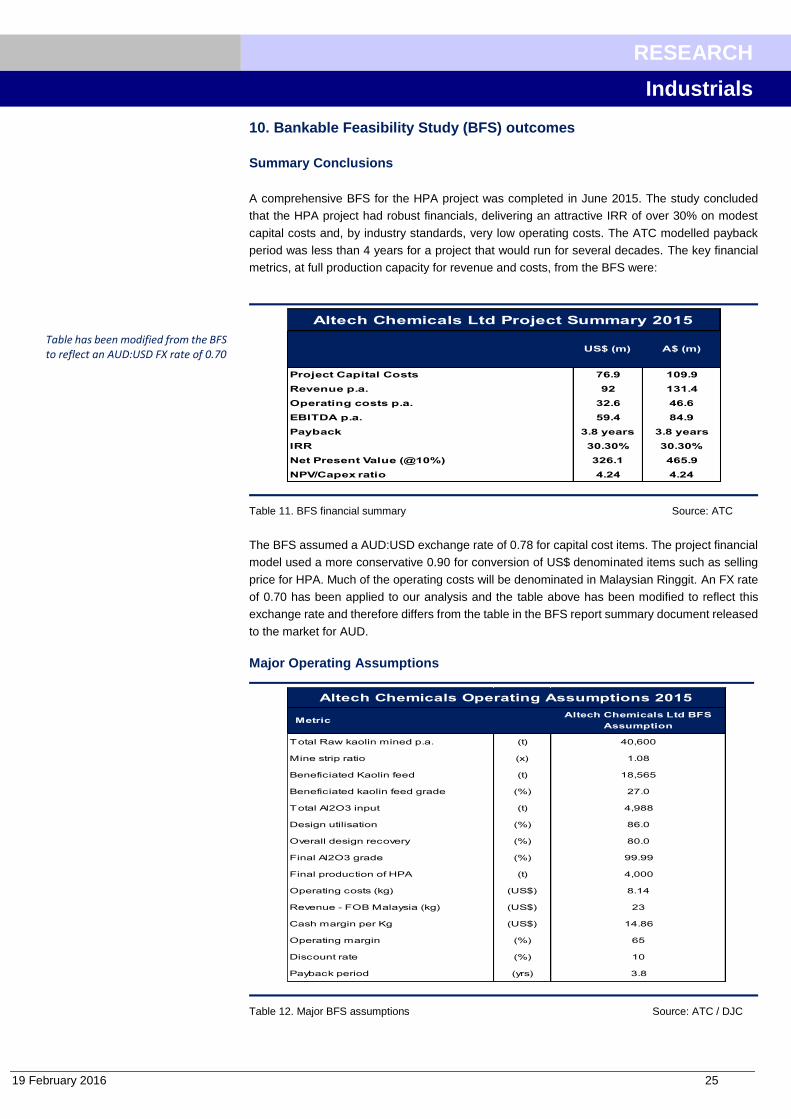
10. Bankable Feasibility Study (BFS) outcomes
Summary Conclusions
A comprehensive BFS for the HPA project was completed in June 2015. The study concluded
that the HPA project had robust financials, delivering an attractive IRR of over 30% on modest
capital costs and, by industry standards, very low operating costs. The ATC modelled payback
period was less than 4 years for a project that would run for several decades. The key financial
metrics, at full production capacity for revenue and costs, from the BFS were:
Table 11. BFS financial summary Source: ATC
The BFS assumed a AUD:USD exchange rate of 0.78 for capital cost items. The project financial
model used a more conservative 0.90 for conversion of US$ denominated items such as selling
price for HPA. Much of the operating costs will be denominated in Malaysian Ringgit. An FX rate
of 0.70 has been applied to our analysis and the table above has been modified to reflect this
exchange rate and therefore differs from the table in the BFS report summary document released
to the market for AUD.
Major Operating Assumptions
Table 12. Major BFS assumptions Source: ATC / DJC
Project Capital Costs 76.9 109.9
Revenue p.a. 92 131.4
Operating costs p.a. 32.6 46.6
EBITDA p.a. 59.4 84.9
Payback 3.8 years 3.8 years
IRR 30.30% 30.30%
Net Present Value (@10%) 326.1 465.9
NPV/Capex ratio 4.24 4.24
Altech Chemicals Ltd Project Summary 2015
US$ (m) A$ (m)
Total Raw kaolin mined p.a. (t) 40,600
Mine strip ratio (x) 1.08
Beneficiated Kaolin feed (t) 18,565
Beneficiated kaolin feed grade (%) 27.0
Total Al2O3 input (t) 4,988
Design utilisation (%) 86.0
Overall design recovery (%) 80.0
Final Al2O3 grade (%) 99.99
Final production of HPA (t) 4,000
Operating costs (kg) (US$) 8.14
Revenue - FOB Malaysia (kg) (US$) 23
Cash margin per Kg (US$) 14.86
Operating margin (%) 65
Discount rate (%) 10
Payback period (yrs) 3.8
MetricAltech Chemicals Ltd BFS
Assumption
Altech Chemicals Operating Assumptions 2015
Table has been modified from the BFS to reflect an AUD:USD FX rate of 0.70

26 19 February 2016
RESEARCH
Industrials
Measured approach to production ramp up
The HPA plant will have a design capacity of 4,000tpa but the BFS has assumed a conservative
approach to the commissioning and ramp up phase. During the first 12 months, ATC has assumed
an output of 2,000 tonnes (50% of design capacity) and only 70% of that output will be HPA. The
remaining 30% will be 3N alumina (99.9% alumina) and SGA (smelter grade alumina).
The above product mix reflects the likelihood that on commission and start up some of the product
will not meet 4N specification. The slow ramp up allows for this but maintains a product line that
can be marketed and sold to lower specification customers.
Table 13. Production tonnage ramp up Source: ATC
Full production capacity has been assumed from Year 5 onwards. The latent capacity allows for
an increase in production above the assumed ramp up rate, should the demand be there. The
ramp up also incorporates a 6 month period of product qualification and acceptance by major
customers and has been reflected in the BFS financial model.
Capital cost estimates
Capital cost estimates in the BFS were undertaken by Simulus Group, one of Australia’s leading
boutique hydrometallurgy and mineral processing service groups with experience in process plant
engineering and design similar to the HPA plant. Capital costs have been estimated to a precision
of around ±15%.
Capital cost estimates in the BFS were chunked into Meckering and Johor. In the BFS, the
beneficiation plant was to be constructed at the Meckering site with an estimated total capital of
US$16.047m with an additional US$1.145m in contingency. This now equates to A$22.9m plus
contingency at current FX rates.
However, the optimised design, with the beneficiation plant being in Malaysia, has the potential
to save capital costs from installation of a smaller plant, as it will be operated 24 hours per day
rather than day shift only if in Australia.
Capex in Malaysia was estimated at US$54.6m, or A$70m at an FX rate of 0.78. At current FX
rates, this has climbed to A$78m. An additional US$3.848m was placed in contingency.

19 February 2016 27
RESEARCH
Industrials
* at current AUD:USD exchange rate of 0.7
Table 14. Capex allocation in BFS Source: ATC
Operating costs
ATC has estimated that the sighting of the HPA plant in Malaysia may save up to 40% on
operating costs compared with a similar plant located in Australia.
The BFS operating costs are based on actual quotation from suppliers in every aspect of the
process route, from mining through to final production of 4N HPA. Labour rates, where large
savings can be made, are based on recent market survey data, with overhead costs based on
experience.
Total operating costs were estimated at US$32.6m per annum or US$8,140 of finished HPA
product, at full design capacity. This is now equivalent to A$11,600 per tonne at current FX rates.
In US$ terms, ATC estimated a gross operating margin of approximately 65% at the time of writing
(June 2015).
* at current AUD:USD exchange rate of 0.7
Table 15. Opex allocation in BFS Source: ATC
Selling price assumptions
A long term selling price of US$23 per Kg (A$32.86 at current exchange rates) was set for the
BFS financial model, FOB Malaysia.
Meckering 16.0 22.9
HPA Plant (Tanjung Langset) 54.6 78.0
Insurances 1.3 1.8
Contingency 5.0 7.1
Total 76.9 109.9
Altech Chemicals Ltd Capex 2015
US$ (m) A$ (m) Capital Cost Area
Meckering Mining 0.11 0.16
Meckering Beneficiation 1.26 1.80
Transport (Meckering to Malaysia) 0.69 0.99
WA State Royalty 0.09 0.13
HPA Manufacturing 3.76 5.37
HPA selling Costs etc 0.76 1.09
Corporate (Aust) 0.98 1.40
Corporate (Malaysia) 0.5 0.71
Total per Kg 8.15 11.64
US$ (kg) A$ (kg)* OPEX Activity
Altech Chemicals Ltd Opex 2015

28 19 February 2016
RESEARCH
Industrials
Discount rate and NPV sensitivity
ATC employed a discount rate of 10% in the BFS. Australia and Malaysia are relatively low risk
jurisdictions and the current cost of equity and debt are favourable for project funding. We see a
10% discount rate as appropriate given that execution risk on construction and commissioning
are still present. In the BFS, ATC estimated that at an 8% discount rate, NPV increased by ~30%
to US$423m.
The NPV is most sensitive to USD:AUD exchange rates and movement in the HPA selling price,
as this is denominated in USD. In the tables above we have modified the A$ conversion to show
the equivalent amount in A$ at an FX rate of 0.7, more reflective of current rates than that used
in the BFS. This also gives a better estimate of the A$ capital expenditure requirements and
therefore capital raising requirements. The NPV is not as sensitive to capital and operating costs.

19 February 2016 29
RESEARCH
Industrials
11. Corporate and capital structure
Altech Chemicals Australia Pty Ltd is ATC’s wholly-owned subsidiary that holds the HPA
business. Under this holding company are two further wholly-owned subsidiaries - Altech
Meckering Pty Ltd, as the registered holder of the Meckering asset and tenure, and Altech
Chemicals Sdn Bhd that holds the company’s assets in Malaysia.
Figure 2. Company structure under Altech Chemicals Ltd Source: ATC
Capital structure and Shareholders
The capital structure in the table below reflects the lapse of listed 10c options (ASX:ATCO) that
were convertible up to 31 December 2015.
Table 15. Share capital of ATC Source: ATC filing
The Top 20 shareholders are tabulated below. A recent Top 20 shareholder is the Melewar Khyra
Group of Companies (Melewar), a Malaysian base diversified financial and industrial services
group. Melewar recently invested $1.0m through a two-stage share placement completed on 20
October 2015 of 16.95m shares. Melewar owns 11.98% of the undiluted issued capital of ATC.
Tunku Dato’ Ya’acob bin Tunku Tan Sri Abdullah, who is the Executive Chairman of Melewar,
was subsequently appointed to the board.
Fully Paid Ordianry Shares (ATC)
Unlisted Options
Unlisted Performance Rights
Share Capital Structure No. of Securities
152,615,782
Altech Chemicals Ltd Capital Structure 2015
6,100,000
19,050,000
30 19 February 2016
RESEARCH
Industrials
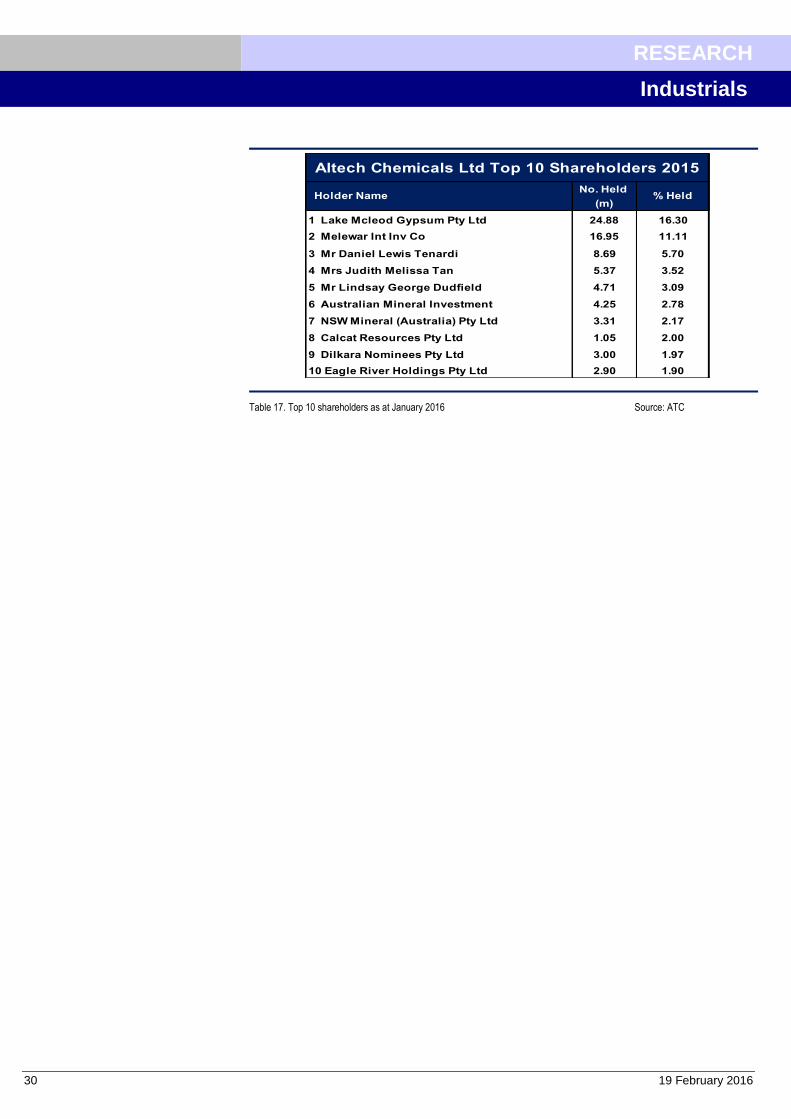
Table 17. Top 10 shareholders as at January 2016 Source: ATC
No. Held
(m)
1 Lake Mcleod Gypsum Pty Ltd 24.88 16.30
2 Melewar Int Inv Co 16.95 11.11
3 Mr Daniel Lewis Tenardi 8.69 5.70
4 Mrs Judith Melissa Tan 5.37 3.52
5 Mr Lindsay George Dudfield 4.71 3.09
6 Australian Mineral Investment 4.25 2.78
7 NSW Mineral (Australia) Pty Ltd 3.31 2.17
8 Calcat Resources Pty Ltd 1.05 2.00
9 Dilkara Nominees Pty Ltd 3.00 1.97
10 Eagle River Holdings Pty Ltd 2.90 1.90
Holder Name
Altech Chemicals Ltd Top 10 Shareholders 2015
% Held

19 February 2016 31
RESEARCH
Industrials
12. Upstream Items
The Meckering aluminous clay resource
ATC owns 100% of the Meckering aluminous clay (kaolin) resource in Western Australia, just
130km east of the port of Fremantle.
Geologically, the aluminous clay deposit, currently estimated at 65Mt at a brightness value of
85.3% (<45 micron) is a weathered granitoid, where almost all of the constituent minerals, other
than quartz, have been weathered to a white aluminous clay. Total impurities in the Meckering
deposit are a fraction of other aluminous clay deposits with an Fe2O3 content of just 0.7% and
K2O and NaO contents of just 0.1% in typical analysis. This analysis is comparable to the
composition of ceramic-grade kaolins used in tableware (ECC Grolleg)
The Meckering aluminous clay deposit is primary in nature. The nature of the parent rock will
define the level of impurities in the resultant clays, with iron, titanium and sodium content being
particularly important.
Table 18. Mineral resources for Meckering Aluminous clay deposit Source: ATC
The deposit is outcropping at surface and lies within below 2m of ‘soil’ cover. A transition or
mottled zone is present over most of the deposit to a depth of around 4m, under which lies the
white aluminous clay with residual quartz. The water table will not be intersected in mining. The
water in the photograph below is rain water accumulating in the historic trial pit.
Figure 3. Location map of the Meckering aluminous clay deposit Source: ATC
Indicated 16,770,000 42.3 83.2
Inferred 48,280,000 41.8 83.5
Total Mineral Resources 65,000,000 41.9 83.4
Note 1. The -45 micron precentage was measured by wet screening
Note 2. Brightness is the ISO brightness of the -45 micron fraction
Altech Chemicals Ltd JORC Compliant Resource Table 2015
Classification
Mineral Resources (JORC 2004)
as at 30 June 2015
Tonnes -45 micron (%) 1 Brightness 2
Definition of Brightness Brightness is defined as the ratio, expressed as a percentage, of the radiation reflected by a body to that reflected by a perfectly reflecting ISO-approved BaSO4 standard measured at an effective wavelength of 457nm with a Carl Zeiss photoelectric reflection photometer
Source: British Geological Survey

32 19 February 2016
RESEARCH
Industrials
Due to the size and density contrast between the clay and the remnant quartz grains, the quartz
can be relatively easily separated from the clay. Due to the low level of impurities, especially iron,
titanium and sodium, further reduction of deleterious elements is not as difficult as in many other
deposits.
Small-scale, upstream mining operation at Meckering
ATC proposes an upstream mining operation at Meckering, mining approximately 144,000
tonnes in each mining campaign which is envisaged to be conducted over a 2 month period with
an anticipated strip ratio of just over 1:1. Each mining campaign would provide for 3 years of
downstream feed at 48,000 tonnes per annum. A proposed 30 year life-of mine would mine 1.3Mt
of bulk aluminous clay from a 65Mt resource. Equipment required for the operation would be a
backo-style excavator and two or three small moxy-style trucks, a water truck and rubber-tyred
loader. A water stand-pipe is located within a kilometre of the proposed open pit, tapping into the
Perth-Kalgoorlie pipeline.
After each mining campaign, the small-scale, shallow, open-pit operations would be placed on
care and maintenance until the next campaign. ROM bulk kaolin would be delivered to a loading
pad on site and then transported in sea containers to the port loading facilities at Fremantle to
be shipped to ATC’s HPA processing facility in Johor, Malaysia.
Figure 4. Historic kaolin pit at Meckering with hand specimen Source: DJC
ATC is not a mining company. Mining is on such a small scale that it is almost incidental to the main focus of the company. The fact that ATC also controls the upstream resource means that it can control the supply of aluminous clay feedstock to its plant.
Top: Approximately 2-4m of soil and ferricrete overburden overlays a mottled zone, down to 10m, which in turn overlays the white, high grade aluminous clay horizon (pallid zone). The water is accumulated rain water, not the intersection of the water table. Bottom: Hand specimen of the high grade kaolin. Remnant quart can be seen as interstitially distributed grey coloured grains.

19 February 2016 33
RESEARCH
Industrials
Approvals already submitted
ATC submitted a project application to the WA Dept. of Environment Regulation (DER) for the
Meckering project in July 2015. Construction of infrastructure can commence after receipt of a
Works Approval, also assessed by the DER. Access compensation agreements are also being
finalised with local land owners. A Mining Lease application to the DMP have also been submitted
to the WA DMP.
Second Kaolin deposit secured at Kerrigan
ATC has recently secured a second kaolin deposit in WA, proximal to established transport
infrastructure. The project is located 20km south of the Wheatbelt town of Hyden and is 335km
south east of Perth. Road and existing rail infrastructure, 15km away provides a rail transport
route to the nearby port at Albany.
Exploration Licence E70/4718 (Kerrigan) has been granted and includes an existing JORC
resource of 85Mt at a brightness of 85.1%. Kerrigan represents an opportunity to provide a
second, high grade feedstock of aluminous clay to the HPA plant in Malaysia, and in our view,
provides a back-up plan should supply from Meckering be disrupted.
Figure 5. Location map for the Kerrigan Kaolin deposit, WA Source: ATC
Mining Right Agreement with Dana
ATC has granted Dana shipping and Trading S.A., a Greece-based shipping company, an
exclusive mining right to 10Mt of Kaolin resources at Meckering for $1m in cash. ATC will also
receive a 2% gross sales royalty on kaolin sold by Dana.
Subject to completion of this transaction, ATC has provided an option to Dana to mine an
additional 20Mt for an additional $2m in cash. Should the conditions of the first transaction not
be satisfied by the end date (9 months after the date of agreement) both parties can negotiate
access to kaolin from ATC’s other kaolin project in Kerrigan.
The bulk kaolin that Dana will mine would be used in the manufacture of ceramics, paper, rubber
and paint but ATC’s mining will take priority over Dana.

34 19 February 2016
RESEARCH
Industrials
13. Downstream Items HPA plant site, Johor, Malaysia
ATC has secured a site for construction of an HPA plant at the Tanjung Langsat Industrial
Complex, Johor, Malaysia. ATC chose the location as operating costs are estimated by ATC to
be up to 40% cheaper than in Australia. The 4 Ha site is in a section of the park reserved for
industrial chemical plants. Gas reticulation is at site. Bulk kaolin would be landed at the port of
Tanjung Pelepas, 90km by road from the HPA plant and transported by road to the site.
ATC secured the site with a non-refundable MYR300,000 (A$98,000) deposit and upon
execution of an option to lease agreement, will have a term of 30 years with an option to renew.
The deposit is credited against the 30-year lease payment, which at current exchange rates
would cost A$4.2m.
The industrial park is relatively new at just 5 years old and covers an area of 2,000Ha, but already
several large industrial scale processing plants are well established. The park lies adjacent to
the older and more established Pasir Gudang Industrial Park.
Companies that have already established industrial plants at the park include Vance Bioenergy
which is located next door to the ATC reserved site, who produce fatty acid methyl ester and
pharmaceutical grade glycerine. The CP Group lies opposite, and is one of Malaysia’s major
construction firms. Adeka, a polymer and specialised chemical manufacturer, is also located
adjacent to the ATC site.
Other companies with facilities in the park include a number involved in the oil & gas sector and
include pipeline fabrication companies, off-shore engineering and umbilical manufacturing
companies.
Figure 6. Land site reserved for HPA plant and HCL processing plant owned by CCM Chemicals
Source: DJC and CCM
Top: Photograph taken from ATC’s reserved 4Ha site at Tanjung Langsat Industrial park, looking towards the adjacent complex owned by CP Group. Bottom: Aerial view of CCM Chemicals’ chlor-alkali manufacturing plant at Pasir Gudant Industrial Park, approximately 5km from ATC’s plant site.

19 February 2016 35
RESEARCH
Industrials
Major Consumables from sister Industrial park
During a visit to Malaysia, DJC visited the Pasir Gudang Industrial Park where we found a
hydrochloric acid manufacturing plant operated by CCM Chemicals. Hydrochloric acid will be a
key consumable to the HPA plant. CCM Chemicals manufacture a range of chlor-alkali products
with a capacity of 200,000 metric tonnes per annum, which include PROCHLOR A33
(Hydrochloric Acid). These products are marketed to major industrial sectors such as
oleochemicals, soap and detergent, metal, electronic, textile, petrochemicals and rubber. We
noted that there was a Turkish soap manufacturer in the Tanjung Langsat Industrial Complex,
that may well get its HCL requirements from CCM Chemicals, located only 5 km away.
Figure 7. Site plan for the Tanjung Langsat and Pasir Gudang industrial parks Source: ATC
HPA Processing facility
ATC intend to construct a HPA production facility at the 4Ha site in the Tanjung Langsat Industrial
Park with an annual production capacity of 4,000 tonnes per annum. The choice of sighting the
HPA plant in Malaysia was taken after consideration of a variety of logistical and economic
parameters. Ultimately, ATC estimated that the location of the plant in Malaysia would save
approximately 40% on operating costs compared to an equivalent plant located in Western
Australia. From a logistical point of view the site is closer to end markets and the production of
the necessary reagents used to manufacture the product.
Design philosophy
At each stage the design of the plant has been focused towards reducing technology risk by
utilising off-the-shelf componentry. The design has also been focused producing a 99.99% (4N)
product whilst keeping a mind on operability.
The HPA plant will utilise a well-known, conventional and robust mineral processing route that
has been in existence since the early 1980’s and which involves the reaction of kaolin with
hydrochloric acid (HCl), with a closed acid recovery circuit, reducing operation costs by recycling
major reagents. ATC’s high-quality upstream feedstock ensure low impurity levels and a high
alumina content, which offers a competitive advantage to other HPA producers.
Building the plant in Malaysia is estimated to reduce operating costs by 40% on an Australian based operation
The design philosophy has been to use as much as possible, existing, off-the-shelf componentry to mitigate risk
36 19 February 2016
RESEARCH
Industrials
Processing steps
ATC has patented its process specific to the production of alumina from a low impurity kaolin
feedstock with very low iron content of <1.5% Fe. The granted patent, as submitted in October
2014, essentially covers the steps as outlined in the “Major Process Route Steps” section below.
Optimisation study places beneficiation plant in Malaysia
Optimisation of the logistics of the upstream operations at Meckering deduced that capital and
operating cost savings could be made by shipping the bulk material from site, rather than
construction of a beneficiation processing plant at Meckering, as was contemplated in the original
BFS.
The increased cost of transportation of the bulk un-beneficiated kaolin is more than off-set by the
capital cost savings and operational efficiencies of placing the beneficiation plant at the front end
of the HPA plant in Johor, as:
1. Fabrication costs are lower in Johor.
2. The beneficiation plant can be run on a 24-hour basis, reducing capital costs as the plant
can be smaller.
3. Power and labour costs are much lower in Malaysia.
4. A dryer, bagging and associated infrastructure will not be required as a dried, bagged
beneficiated product is not required for transportation.
5. An added benefit come from streamlining the approvals process for the Meckering
operation.
The beneficiation plant will consist of a hopper to receive the raw feedstock, to a drum scrubber
followed by a set of wet screens where the clay material will be separated from coarser fractions.
A fine kaolin beneficiated product will then enter the HPA plant
Major processing route steps
Calcination: Beneficiated kaolin will enter a rotary kiln, fed indirectly by natural gas, and
calcined at 600 to convert the clay crystal structure to one that is more reactive.
Calcined kaolin will be cooled and screened to <500. Oversize to be crushed to <500
Leaching: Calcined product leached with HCl at 36% w/w where oxides (except silica) are
converted to chlorides, producing a high concentration of AlCl3 in solution.
Water cooled condensers condense HCl vapours and return condensate to the leach tanks.
Leached slurry is pumped to leach residue filtration where silica filter cake is discharged,
re-slurried and neutralised with milled limestone and hydrated lime.
The resulting pregnant liquor solution, or PLS, is filtered to remove ultra-fine silica solids.
First stage crystallisation: HCl gas is bubbled through the PLS solution to reduce the pH.
AlCl3 is unique in that its solubility decreases with increasing acidity, driving further and
final precipitation of aluminium hexahydrate, or “ACH” (AlCl3.6H2O).
ACH crystals are filtered and washed with ACH wash liquor to remove impurities and
residual acid and the filter cake then dissolved in pure water, to remove any residual
impurities, and fed to the second crystallisation unit, after being filtered.
Second and third stage crystallisation: Again, HCl gas is bubbled through the ACH
filtrate, washed and crystallised in a repeat process. The third stage is identical to the
second.
The process flow sheet can be divided into five major processes:
1. Calcination 2. Leaching 3. Crystallisation 4. Heat treatment 5. Cooling and grinding
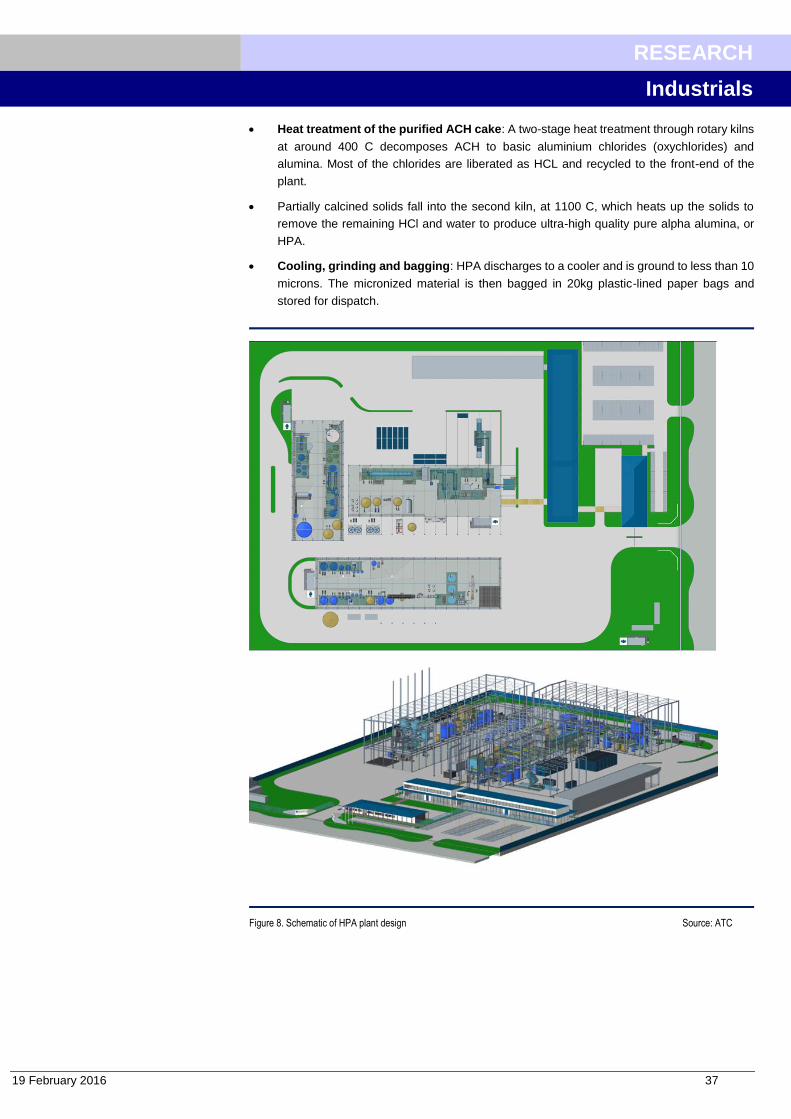
19 February 2016 37
RESEARCH
Industrials
Heat treatment of the purified ACH cake: A two-stage heat treatment through rotary kilns
at around 400 C decomposes ACH to basic aluminium chlorides (oxychlorides) and
alumina. Most of the chlorides are liberated as HCL and recycled to the front-end of the
plant.
Partially calcined solids fall into the second kiln, at 1100 C, which heats up the solids to
remove the remaining HCl and water to produce ultra-high quality pure alpha alumina, or
HPA.
Cooling, grinding and bagging: HPA discharges to a cooler and is ground to less than 10
microns. The micronized material is then bagged in 20kg plastic-lined paper bags and
stored for dispatch.
Figure 8. Schematic of HPA plant design Source: ATC

38 19 February 2016
RESEARCH
Industrials
Figure 9. Process Flow Diagram
Only 5 major reagents used:
1. Hydrochloric acid 2. Sulphuric acid 3. Limestone 4. Slaked lime 5. Flocculant
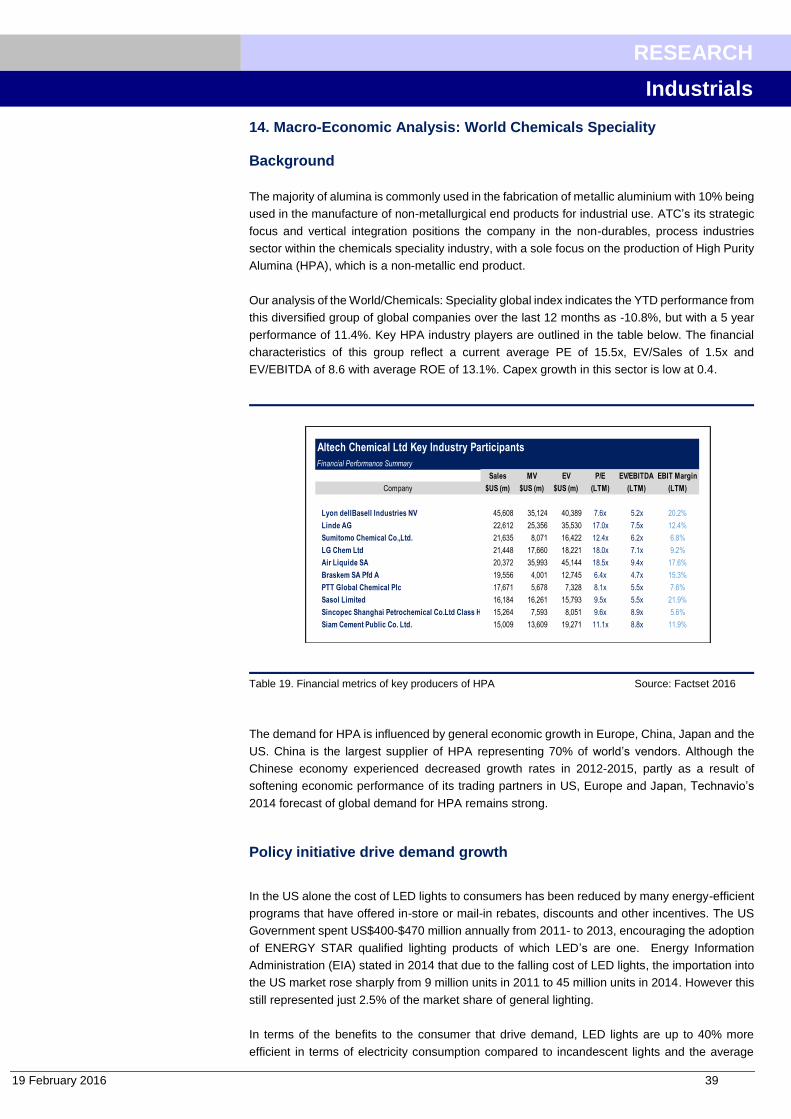
19 February 2016 39
RESEARCH
Industrials
14. Macro-Economic Analysis: World Chemicals Speciality Background
The majority of alumina is commonly used in the fabrication of metallic aluminium with 10% being
used in the manufacture of non-metallurgical end products for industrial use. ATC’s its strategic
focus and vertical integration positions the company in the non-durables, process industries
sector within the chemicals speciality industry, with a sole focus on the production of High Purity
Alumina (HPA), which is a non-metallic end product.
Our analysis of the World/Chemicals: Speciality global index indicates the YTD performance from
this diversified group of global companies over the last 12 months as -10.8%, but with a 5 year
performance of 11.4%. Key HPA industry players are outlined in the table below. The financial
characteristics of this group reflect a current average PE of 15.5x, EV/Sales of 1.5x and
EV/EBITDA of 8.6 with average ROE of 13.1%. Capex growth in this sector is low at 0.4.
Table 19. Financial metrics of key producers of HPA Source: Factset 2016
The demand for HPA is influenced by general economic growth in Europe, China, Japan and the
US. China is the largest supplier of HPA representing 70% of world’s vendors. Although the
Chinese economy experienced decreased growth rates in 2012-2015, partly as a result of
softening economic performance of its trading partners in US, Europe and Japan, Technavio’s
2014 forecast of global demand for HPA remains strong.
Policy initiative drive demand growth
In the US alone the cost of LED lights to consumers has been reduced by many energy-efficient
programs that have offered in-store or mail-in rebates, discounts and other incentives. The US
Government spent US$400-$470 million annually from 2011- to 2013, encouraging the adoption
of ENERGY STAR qualified lighting products of which LED’s are one. Energy Information
Administration (EIA) stated in 2014 that due to the falling cost of LED lights, the importation into
the US market rose sharply from 9 million units in 2011 to 45 million units in 2014. However this
still represented just 2.5% of the market share of general lighting.
In terms of the benefits to the consumer that drive demand, LED lights are up to 40% more
efficient in terms of electricity consumption compared to incandescent lights and the average
Altech Chemical Ltd Key Industry Participants
Financial Performance Summary
Company
Lyon dellBasell Industries NV 45,608 35,124 40,389 7.6x 5.2x 20.2%
Linde AG 22,612 25,356 35,530 17.0x 7.5x 12.4%
Sumitomo Chemical Co.,Ltd. 21,635 8,071 16,422 12.4x 6.2x 6.8%
LG Chem Ltd 21,448 17,660 18,221 18.0x 7.1x 9.2%
Air Liquide SA 20,372 35,993 45,144 18.5x 9.4x 17.6%
Braskem SA Pfd A 19,556 4,001 12,745 6.4x 4.7x 15.3%
PTT Global Chemical Plc 17,671 5,678 7,328 8.1x 5.5x 7.6%
Sasol Limited 16,184 16,261 15,793 9.5x 5.5x 21.9%
Sincopec Shanghai Petrochemical Co.Ltd Class H 15,264 7,593 8,051 9.6x 8.9x 5.6%
Siam Cement Public Co. Ltd. 15,009 13,609 19,271 11.1x 8.8x 11.9%
Sales
$US (m)
MV
$US (m)
EV
$US (m)
P/E
(LTM)
EV/EBITDA
(LTM)
EBIT Margin
(LTM)

40 19 February 2016
RESEARCH
Industrials
household will spend 10-15% of its electricity budget on lighting requirements annually.
Nationally this translates to annual energy savings of US$53 billion.
Similarly in China, policy initiatives have been developed to reduce the demand side
consumption of energy using new technologies such as LED’s with a result that led China to
record the fastest growth of more than 20% in terms of uptake in 2014.
HPA Demand
The market demand for HPA is increasing due to its significance in the production of high
performance electronics and growing at a reported CAGR or 27.89% which will see it grow from
14,000tpa in 2013 to 48,000tpa by 2018.
The demand for HPA is concentrated in the Asia Pacific (APEC) region with a share of 70% in
2013 which is where the majority of electrical manufacturing centres are located. The Americas
accounted for 14% of the global demand and the remaining 16% is driven by Europe, the Middle
East and the African region.
4N HPA is an essential and high-value material used by the aerospace, defence, medical and
electronic industries which requires a minimum purity of 99.99%.
Figure 10. Volume and growth rate of HPA globally Source: Technavio Analysis
The light emitting diode (LED) market represents 55% of the demand in HPA which is primarily
driven by government programs focused on incentives for renewables and energy efficiency
strategies. In 2015 the LED market will reach US$25.7 billion and market penetration will
increase to 31%. Europe has the largest share of the LED market at 23%, China 21%, USA 19%
and Japan 9%. An anticipated growth of 470% from 2015-2024 in the LED market will be driven
by lower prices and government initiatives.
Other industry sectors such as the rapidly growing lithium battery market in China is driving
demand for HPA. An expected growth in demand from 7,737 tpa in 2013 to 29,111 tpa, 2016 will
be driven from the Chinese domestic market alone.
The semiconductor market (tablets, computers, memory storage and smartphones) represents
22% of the demand for HPA and the phosphor market (plasma displays) represent 16% with the
remaining 7% being demanded by other applications used in the automotive industry (sensors),

19 February 2016 41
RESEARCH
Industrials
lithium battery manufactures, where HPA is increasingly being used as coatings on Li-ion battery
separators, and in the cosmetics industry.
Figure 11. Percentage HPA use in industry Source: ATC
HPA Supply
In 2014, global supply was dominated by the top 10 suppliers with a representative combined
total production of 23,700tpa, 80% of whom are Chinese vendors; 49% of all HPA producers are
based in China. 14 of a total 23 producing companies are Chinese with Sumitomo (Japanese)
being the largest producer of HPA which has a reported production capacity of 6,000tpa. Other
smaller HPA producers are located in Canada, Taiwan, France, Russia, South Africa and
Norway.
Table 20. Production of HPA from the top producers Source: ATC
ATC will position itself to be the second largest producer with 4,000tpa of HPA using a low cost
patented process.
Sumitomo Chemical 3020
Hebei Pengba 3000
Zibo Xinfumeng 2500
Sasol 1800
Xuancheng Jing Rui 1200
Baikowski 1200
Nipopn Light Metal 1100
Huantou 800
Dalian Rail 600
Others 3570
HPA (t)
HPA Key Industry Producers
Producers of HPA (2014)

42 19 February 2016
RESEARCH
Industrials
The Sapphire Glass Market
Sapphire glass is the synthetic variant of naturally occurring sapphire. Major commercial uses
occur in smartphone displays, watchmaking (as crystal faces), medical, mechanical and optical
equipment manufacture and as bulletproof and ballistic material in safety establishments.
In 2014 the sapphire glass market was valued at US$29.96m and is expected to grow at a CAGR
of 6.21% (Technavio Research, 2015), to reach US$40.5m by 2019. Due to the costs of
production most sapphire glass is used in high-end goods. Sapphire glass is technically superior
to the common substitute, Gorilla Glass, made by Corning, in terms of hardness, scratch
resistance, strength and performance. But Gorilla glass is cheaper to produce and has the
greatest market share.
The continued fall in smartphone pricing has hindered the adoption of sapphire glass in smart
phones beyond the camera lens and Corning have been continually upgrading the performance
of Gorilla glass to maintain its glass as the preferred option. For instance Corning intend to
combine the strength and hardness of Gorilla Glass with the scratch resistance of sapphire,
which could also slow the adoption of sapphire into the mobile device market.
In addition to Gorilla Glass, there are a number of other substitutes offering intense competition
such as Asahi Dragontrail and CHOTT Xensation.
Growth in production and consumption of sapphire glass is expected to be higher than market
growth as pricing is expected to fall with increased supply. With lower pricing on increased
supply, sapphire glass is expected to be used in an increasing number of applications.
Technological innovation should also reduce manufacturing costs.
The potential influence of Apple Inc
The smartphone market dominates the use of sapphire glass with a 30.4% share (2014). The
market share is expected to remain fairly constant over the next few years.
Apple is the single largest consumer for sapphire glass, estimated at 70% to 80%, used in the
manufacture of touch sensors and camera mirrors. Should Apple increase its use in devices,
particularly as facing screens in its mobile phones, it will drive growth. In 2016/17 this demand
will represent 52% of the global sapphire glass market (Yole Development). In 2018 Apples’
demand for HPA could represent 15,000tpa or approximately 30% of 2018 global demand.
Should Apple adopt the use of sapphire glass more widely it may also force other mobile phone
manufacturers to likewise use sapphire in their own devices.

19 February 2016 43
RESEARCH
Industrials
15. HPA Industry Analysis Attractiveness - Moderate
The HPA industry analysis outlined below indicates ATC is competing in an attractive, rapidly
changing industry that favours new entrants. The existing industry participants enjoy moderate
margins but they are earned in what appears to be a tough industry. The substantial margins are
attracting new entrants to the market with new technology, processes and alternative feedstock
which may afford them greater operating margins. Yet barriers to entry are evident such as
capital costs, limited standardised technology and access to quality feedstock.
Bargaining power of buyers is limited as there are only 19 key produces in the fragmented
market, moreover, in terms of volume, the global demand for 4N HPA is projected to increase at
a CAGR of 19.1% over the forecast period 2014-2021 or an increase of 350% of productive
output from 2014 levels. Although current capacity will meet industry demand in the near term,
currently not all producers of HPA are positioned as high quality producers which creates a
market opportunity for ATC.
In terms of value the global 4N HPA segment is projected to increase at a CAGR of 14.7% from
2014-2021 from US$651million in 2014 to US$1.78bn in 2021 or an increase of 270% in value
from 2014 levels, assuming the price dynamics remain as projected. With projected prices
lagging production demand it’s imperative that companies apply sound strategic financial
management to capture value. From the analysis below, ATC achieves this.
Production of HPA from existing participants is constrained by high costs of production, old plant
design, capacity and process bottlenecks. Furthermore stringent government regulations are set
to impose further constraints upon existing producers. These structural features limit industry
rivalry and the strategic options afforded to existing market participants when threatened by new
entrants.
The bargaining power of suppliers is limited to ATC as it has vertically integrated its business
model to control key elements of the value chain, namely the supply of very high quality
aluminous clay.
The analysis indicated ATC has a unique and enviable position of being a new entrant into this
rapidly changing industry. The analysis of current structure suggests that the proposed margins
ATC is seeking to make from its proposed operations are realistic and defendable.
Bargaining Power of Buyers – Low
The current buyers of HPA have limited choices from suppliers of 4N HPA, as the top eight
producers control almost 80% of the market. Buyers traditionally will rely upon 2-3 suppliers for
key raw material. The growth in demand in the 4N HPA is forecast to grow 19% per annum from
2014-2021 which motivates buyers to secure limited supply from an industry which demonstrates
capacity constraints. New entrants will address a portion of this capacity constraint but they will
not produce enough to meet 4N demand from 2018 onwards.
The buyers demand a high quality HPA product from suppliers as the end use for HPA is primarily
used in the electronics, semiconductor industries, defence, automotive and medical industries.
As a consequence the qualification period to supply to the buyers normally takes 6 months. Once
these relationships are established customers don’t switch easily to alternative sources due to
supply qualification times and the risk that inferior new supply potentially has upon final product
quality.
44 19 February 2016
RESEARCH
Industrials
Buyers are not concentrated in this market with approximately 130 buyers geographically spread
between 19 countries throughout the world. Japan, USA, Taiwan, Germany and China represent
the majority of international buyers. Although Chinese producers supply 49% of the worlds 4N
HPA, Chinese buyers purchase 90% of their 4N HPA needs from foreign suppliers. The reason
is that Chinese produced HPA lacks quality standards and cannot be used for high-end
applications.
The threat of backward integration is low in this industry as most large producers are diversified
well established conglomerates.
ATC will initially position itself as a second tier supplier due to fact the supply threat in this industry
will encourage incumbent buyers to secure alternative HPA supply. ATC will shift naturally to a
primary supplier if they successfully develop their reputation of producing quality 4N HPA
product. It is ATC strategic goal to produce 4000tpa in 2022 of 4N HPA representing
approximately 9% of global demand in 2021.
Bargaining Power of Suppliers – Low
ATC will initially position itself as a second tier supplier of HPA as a new entrant to the industry.
As HPA supply will be constrained participants will be required to secure alternative HPA supply.
As ATC ramps up production to 4000tpa of high quality HPA and develops industry relationships
they may shift to a reliable primary supplier of quality 4N HPA product.
In order to achieve this ATC will control the value chain from mine site production of aluminous
clay feedstock to HPA end product. By controlling the key input variable - alumina clay -
managing the efficient mining process creates a unique sustainable competitive advantage in
the HPA production process. However alumina clay is not the only variable cost impacting ATC
business model.
A review of ATC’s projected strategic financial management as it related to the bargaining power
of key suppliers was undertaken with an analysis of its projected operating leverage and
contribution margin. No allowance for cost of price inflation was made and future revenues were
based on ATC’s sales volume increase. This analysis allows one to consider any potential impact
of dominant suppliers to ATC’s profitability margins.
ATC projected financials are targeting an average contribution margin of 72% and a 96%
operating leverage over the next 30 years. This implies the bargaining power of suppliers is low
and they have a financial strategy focused on positioning the company to benefit from economic
uplifts and increased volume sales. This strategy is aligned with the broader long term
macroeconomic picture of the high demand for 4N HPA with a CAGR of 19.7%, 2014 to 2021.
Therefore for every dollar increase in sales ATC will receive an additional $0.72 in EBIT
Supplier’s power is further diminished by the fact that ATC control the nature of supply and mining
of the key input, alumina clay. The mining process adopted by ATC is simple and as a
consequence of the recent downturn in the mining sector competitive forces have swung in
favour of mine owners reducing the bargaining power of key suppliers to this element of ATC
value chain.
Furthermore, road and rail transportation costs within Australia have fallen along with the activity
in the resources sector as have international shipping rates with the Baltic Dry Index which is
currently at its 32 year low.
In terms of ATC HPA production process in Malaysia it is using standardised ‘off the shelf’
components with slight modification to a well-established processing technique adapted to
19 February 2016 45
RESEARCH
Industrials
account for the ATC’s low impurity kaolin feedstock. This reduces the bargaining power and
threat from equipment and plant equipment suppliers.
Aside from labour inputs there are only a few critical suppliers to ATC which could impact on the
variable costs (VC) of production of HPA; power (electricity & gas) represents 64% of VC’s,
hydrochloric acid (HCL), 11% and water, 3%. All other inputs are not specialist materials nor
rare. Major power utilities represent the majority of suppliers of VC’s and pose minimal threat to
ATC whilst HCL is a standard industrial chemical produced in abundance globally. The ATC plant
will be built within 5 Km from a HCL plant in Johor. These suppliers hold little bargaining power
and pose limited threat to the profit margins of ATC’s operations.
Threat of New Entrants – Low to Moderate
The profit margins in this industry are reasonably large (25-30%) for incumbent producers,
however many of the large diversified producers have old plants and processes using hydrolysis
of aluminium oxide, that are inefficient and expensive.
Existing industry participants are faced with the challenge of rising cost of production as the
existing practices of manufacturing of HPA involves huge labour and energy costs. Furthermore
the traditional production method is now the focus of new government regulation which will make
it harder for new entrants focused on old technologies. The stringent government regulation is
focused on the overall carbon footprint resulting from harmful emissions and environmental
impact related to larger aluminium smelters extraction process and energy use.
ATC is classified as a new entrant into this market and was established in 2007. Orbite
Technologies Inc. are the only other clearly identifiable recent entrant into the HPA market and
were established in 1988. Orbite, like ATC, claim to have developed a patented production
process, however its production process is designed around a feedstock that is of lower purity
than that of ATC. Oribite’s production process is designed for kaolin that contains 8% Fe hence
they need a rigorous Fe removal processes whereas ATC production process is simplified and
more efficient as it has a feedstock of low impurity kaolin with less than 0.7% Fe. The large
deposit and the unique high purity nature of its alumina clay creates another barrier to entry for
industry participants.
ATC has internally developed, researched and optimised the kaolin to alumina acid-based
processing technologies engaging qualified consultants and or considering JV partnership
options since 2010. More recently the improved materials for plant construction, the refinement
of process control procedures and the rapidly emerging market have encouraged development
for new entrants in this industry. ATC have researched and proved its specific extraction and
production process.
In the process of development ATC has leveraged the significant body of international research
to further improve established practices from registered prior art and patents to enhance its plant
and process design. Orbite Technologies are the only other entity identified with patents related
to process of aluminium extraction from aluminous ores, however this patent is applied across a
wide range of aluminiferous materials as opposed to ATC which is solely focused on producing
HPA from kaolin.
Threat of Substitutes- Low
There are no direct substitutes for high purity aluminous clay in the production of HPA, Nor is
there any substitute for 4N HPA as it is a fundamental element in a number of industry
manufacturing process within the high-performance electrical market such as LED,
semiconductor, lithium battery, aerospace, defence, and medical and other related industry
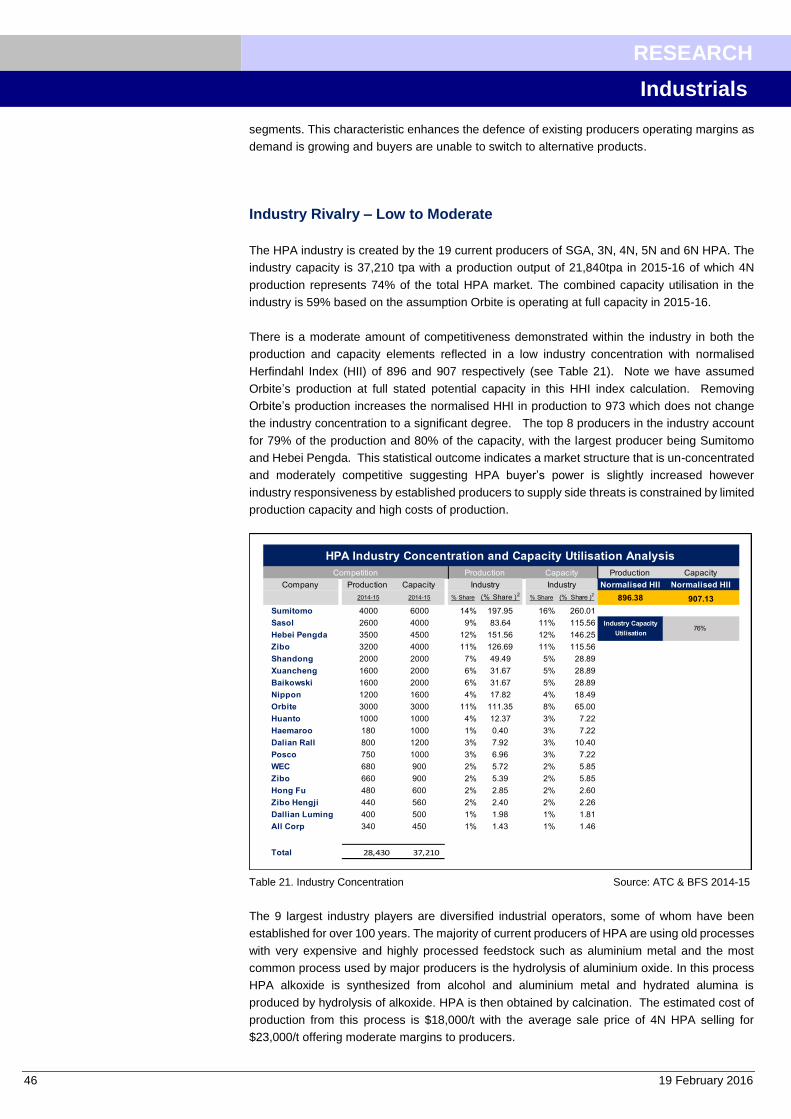
46 19 February 2016
RESEARCH
Industrials
segments. This characteristic enhances the defence of existing producers operating margins as
demand is growing and buyers are unable to switch to alternative products.
Industry Rivalry – Low to Moderate
The HPA industry is created by the 19 current producers of SGA, 3N, 4N, 5N and 6N HPA. The
industry capacity is 37,210 tpa with a production output of 21,840tpa in 2015-16 of which 4N
production represents 74% of the total HPA market. The combined capacity utilisation in the
industry is 59% based on the assumption Orbite is operating at full capacity in 2015-16.
There is a moderate amount of competitiveness demonstrated within the industry in both the
production and capacity elements reflected in a low industry concentration with normalised
Herfindahl Index (HII) of 896 and 907 respectively (see Table 21). Note we have assumed
Orbite’s production at full stated potential capacity in this HHI index calculation. Removing
Orbite’s production increases the normalised HHI in production to 973 which does not change
the industry concentration to a significant degree. The top 8 producers in the industry account
for 79% of the production and 80% of the capacity, with the largest producer being Sumitomo
and Hebei Pengda. This statistical outcome indicates a market structure that is un-concentrated
and moderately competitive suggesting HPA buyer’s power is slightly increased however
industry responsiveness by established producers to supply side threats is constrained by limited
production capacity and high costs of production.
Table 21. Industry Concentration Source: ATC & BFS 2014-15
The 9 largest industry players are diversified industrial operators, some of whom have been
established for over 100 years. The majority of current producers of HPA are using old processes
with very expensive and highly processed feedstock such as aluminium metal and the most
common process used by major producers is the hydrolysis of aluminium oxide. In this process
HPA alkoxide is synthesized from alcohol and aluminium metal and hydrated alumina is
produced by hydrolysis of alkoxide. HPA is then obtained by calcination. The estimated cost of
production from this process is $18,000/t with the average sale price of 4N HPA selling for
$23,000/t offering moderate margins to producers.
Production Capacity
Company Production Capacity Normalised HII Normalised HII
2014-15 2014-15 (% Share )2(% Share )
2896.38 907.13
Sumitomo 4000 6000 14% 197.95 16% 260.01
Sasol 2600 4000 9% 83.64 11% 115.56
Hebei Pengda 3500 4500 12% 151.56 12% 146.25
Zibo 3200 4000 11% 126.69 11% 115.56
Shandong 2000 2000 7% 49.49 5% 28.89
Xuancheng 1600 2000 6% 31.67 5% 28.89
Baikowski 1600 2000 6% 31.67 5% 28.89
Nippon 1200 1600 4% 17.82 4% 18.49
Orbite 3000 3000 11% 111.35 8% 65.00
Huanto 1000 1000 4% 12.37 3% 7.22
Haemaroo 180 1000 1% 0.40 3% 7.22
Dalian Rall 800 1200 3% 7.92 3% 10.40
Posco 750 1000 3% 6.96 3% 7.22
WEC 680 900 2% 5.72 2% 5.85
Zibo 660 900 2% 5.39 2% 5.85
Hong Fu 480 600 2% 2.85 2% 2.60
Zibo Hengji 440 560 2% 2.40 2% 2.26
Dallian Luming 400 500 1% 1.98 1% 1.81
All Corp 340 450 1% 1.43 1% 1.46
Total 28,430 37,210
HPA Industry Concentration and Capacity Utilisation Analysis
76%Industry Capacity
Utilisation
Competition Production Capacity
Industry Industry
% Share% Share

19 February 2016 47
RESEARCH
Industrials
The small players in the industry are fragmented and marginally economic with limited capacity
to pose any real market threat.
Upon completion of its plant in Malaysia and mine in Meckering ATC will the only company in the
world with a specialised activity system and overarching strategy focused on producing 4N HPA
from an efficient low cost ($8,000/t) patented process method using alumina clay as the primary
feed stock. Strategic Review-Sustainable Competitive Advantage
ATC has adopted a focused strategy specifically targeting the low cost mining and production of
4N HPA to meet the specific needs of growing industry demand. This demand is driven by
government policy, consumer preference and industrial need. The high quality product and new
processes adopted by ATC meet the current government regulations and position the company
to fit with market expectations.

48 19 February 2016
RESEARCH
Industrials
16. Project schedule
We estimate that ATC will achieve total project funding completion by the end of Q3 2016 or early
Q4, with site works will commence at both Meckering and Johor early 2017. As the beneficiation
plant will now unlikely be sited at Meckering, a smaller amount of site works will be required and
limited to mine and bulk kaolin loading infrastructure. ATC estimate a construction period of 18
months in Malaysia.
Annual production will commence at an annual rate of 2,000tpa and slowly increase towards
capacity at 4000tpa, with 4N HPA slowly increasing as a proportion of product.
Figure 12. Project timeline Source: ATC
ATC has estimated that ramp up to 4,000 tonnes per annum of 4N HPA would take 5 years,
however, should demand prove higher, there is a possibility that ATC could ramp up production
earlier to match supply to demand.
Q1 Q2 Q3 Q4 Q1 Q2 Q3 Q4 Q1 Q2 Q3 Q4
Debt Project Funding
Funding Due Diligence
Finalise BFS Design
Detailed Design
Final Project Funding
Order Long Lead Items
Site Clearing Commencement
Meckering Approvals
Meckering Campaign Mining
Meckering Construction
Malaysia Approvals
Malaysia Construction
Malaysia Commissioning
First HPA Product
2017 20182016 OVERALL PROJECT SCHEDULE

19 February 2016 49
RESEARCH
Industrials
17. Directors and Management
Board Members
Luke Frederick Atkins LLB, Non-Executive Chairman
Mr Atkins is a lawyer by profession and one of the founders of the company. Mr Atkins brings to
the board extensive experience in the areas of mining, exploration, and corporate governance.
Mr Atkins is also Non-Executive Director of the successful ASX listed mining and exploration
company, Bauxite Resources Ltd (BRL). Mr Atkins formerly held the role of Executive Chairman
of BRL after co-founding the company in 2007. He has played a key role in BRL third party
negotiations to successfully access funding, joint venture partnerships, land and infrastructure.
Mr Atkins has had extensive experience in capital raisings and has held a number of executive
and non-executive directorships of private and publicly listed companies including a number of
mining and exploration companies.
Iggy Tan BSc MBA GAICD, Managing Director
Mr Tan is a highly experienced mining and chemical executive with a number of significant
achievements in commercial mining projects such as capital raisings, funding, construction, start-
ups and operations. Mr Tan has over 30 years' chemical and mining experience and been an
executive director of a number of ASX-listed companies. He holds a Master of Business
Administration from the University of Southern Cross, a Bachelor of Science from the University
of Western Australia and is a Graduate of the Australian Institute of Company Directors. Mr Iggy
Tan became the Company's managing director in August 2014. He is responsible for managing
and implementing the next stage of the Company's strategic business objectives, which includes
the commercialisation of the high purity alumina (HPA) project. Having been involved in the
commissioning and start-up of seven resource projects in Australia and overseas, including high
purity technology projects, Mr Tan is an accomplished project builder and developer. Mr Tan
previously held the positions of managing director of Nickelore Limited, Galaxy Resources Limited
and Kogi Iron Limited. At Galaxy Mr Tan was responsible for the capital raising, construction and
start-up of the company's Mt Cattlin spodumene mine ($80m) and the Jiangsu lithium carbonate
plant ($100m), which resulted in Galaxy becoming the world's leading producer of high purity
lithium carbonate. The Jiangsu plant was eventually sold for US$175m in 2014.
Daniel Lewis Tenardi, Non-Executive Director
Mr Tenardi is a highly experienced mining executive with some 40 years in the industry, including
with a number of global resource industry leaders across a range of commodities, including iron
ore, gold, bauxite, and copper. Mr Tenardi previously spent 13 years with Alcoa, at its bauxite
mines in the Darling Range in Western Australia, and a further two years at Alcoa's Kwinana
refinery. He has substantial gold mining experience, including with Roche Mining at the Kalgoorlie
Superpit and at Anglo Gold Ashanti's Sunrise Dam. Mr Tenardi subsequently worked at executive
level for Rio Tinto's Robe River Iron Associates and their East Pilbara Division, and was appointed
as a Director of Robe River Iron Associates in the latter years of his employment with Rio Tinto.
Prior to this appointment, Mr Tenardi was Managing Director of Bauxite Resources Ltd, where he
led the rapid growth of the company from its initial exploration phase, expansion of land holdings,
to the commencement of trial shipments and securing supportive strategic partnerships with key
Chinese partners. Mr Tenardi also held the positions of General Manager of Operations and Chief
Operating Manager at CITIC Pacific Mining. Mr Tenardi is currently non-executive director of
Grange Resources Ltd.

50 19 February 2016
RESEARCH
Industrials
Peter Bailey, Non-Executive Director
Mr Bailey is a highly experienced and qualified engineer with over 40 years' experience in the
mining and industrial mineral production industry and has an electrical engineering degree from
the University of London. Mr Bailey spent the majority of his career in the iron ore mining, bauxite
mining, zinc-lead-copper mining, alumina refining and alumina chemicals industries respectively.
Mr Bailey was President of Alcoa Bauxite and Alumina in 1996, and was responsible for Alcoa's
eight alumina plants outside of Australia. He was also the chairman of the Alcoa Bauxite joint
venture in Guinea, Africa. In 1998, he was appointed President of Alcoa Worldwide Chemicals'
industrial chemicals department from 1998. He was responsible for Alcoa's worldwide chemicals
business, comprising 13 plants across eight countries, with an annual revenue of approximately
$700 million. Post Alcoa, Mr Bailey was chief executive officer of Sherwin Alumina, an alumina
refinery based in Texas, USA. The Sherwin alumina plant was capable of producing 1.4 mtpa of
smelter grade alumina and 300,000 tonnes of chemical grade or specialty alumina per year. The
Sherwin alumina plant was eventually sold to China Minmetals (51%) and then the remaining
49% to Glencore in 2007.
Tunku Dato’ Ya’acob bin Tunku Tan Sri Abdullah, Non-Executive Director
Tunku Dato’ Ya’acob bin Tunku Tan Sri Abdullah is the Executive Chairman of the Melewar Khyra
Group of Companies (Melewar), a Malaysian base diversified financial and industrial services
group. He is the major owner and shareholder of Melewar. Tunku Dato’ Ya’acob sits on the
Boards of Khyra Legacy Berhad, Mycron Steel Berhad, MAA Group Berhad, Melewar Industrial
Group Berhad, Ithmaar Bank B.S.C.( listed on Bahrain Stock Exchange) and several other private
companies. Tunku Dato’ Ya’acob graduated with a Bachelor of Science (Hons) Degree in
Economics and Accounting from City University, London. An accountant by training, he is a Fellow
of the Institute of Chartered Accountants in England & Wales and a member of the Malaysian
Institute of Accountants. He started his career as an Auditor with Price Waterhouse, London from
1982 to 1985 and subsequently joined Price Waterhouse Kuala Lumpur from 1986 to 1987. He
joined Malaysian Assurance Alliance Berhad in 1987 and retired as its Chief Executive Officer in
1999.
Uwe Ahrens, Alternate Director
Mr Uwe Ahrens is executive director of Melewar Industrial Group Berhad and managing director
of Melewar Integrated Engineering Sdn Bhd. He also sits on the Board of several other private
limited companies. Mr Ahrens holds Masters in both Mechanical Engineering and Business
Administration from the Technical University Darmstadt, Germany. Upon graduation, Mr Ahrens
joined the international engineering and industrial plant supplier, KOCH Transporttechnik GmbH
in Germany, now belonging to FLSmidth Group, where he held a senior management position for
12 years, working mainly in Germany, USA and South Africa. In 1997, he was based in Kuala
Lumpur as General Manager of KOCH in South East Asia and became its Managing Director in
1999. He joined Melewar Group in 2002 and is also currently chief technical officer of the Melewar
group of companies being responsible for engineering, upgrading, modification and extension of
machinery and plant as well as the overall maintenance.

19 February 2016 51
RESEARCH
Industrials
Management Team
Shane Volk BBus (Acc); GradDip (ACG); CSA, Company Secretary & CFO
Mr Shane Volk has extensive accounting and corporate governance experience in Australian and
international mining operations. Mr Volk is a qualified Chartered Secretary and has a Bachelor of
Business (Accounting) from the Royal Melbourne Institute of Technology. Mr Volk has previously
worked in Papua New Guinea, Indonesia and Australia across a diverse range of mining-related
capacities such as exploration, operations, business development and corporate governance. Mr
Volk was previously chief financial officer and company secretary for ASX listed companies
African Iron Limited, Kogi Iron Limited and Emerson Resources Limited.
Dr Jingyuan Liu, General Manager Operations
Dr Liu has over 20 years’ experience in project management, process and equipment design for
minerals processing and in the chemicals, non-ferrous metals, iron & steel and energy industries,
both in Australian and internationally. He was awarded a PhD in chemical engineering from The
University of Newcastle, Australia. He has worked in senior chemical engineering roles with
leading companies such as Hatch Engineering and Metso Minerals in Australia and Malaysia. Dr
Liu was previously General Manager, Development and Technologies with Galaxy Resources
Limited, a high purity lithium carbonate producer. Dr Liu’s extensive chemicals and processing
experience, including plant construction, commissioning and the manufacture of high purity
chemicals will be invaluable for Altech’s next phase of development.

52 19 February 2016
RESEARCH
Industrials
Disclosure Disclaimer RCAN1324
This Research report, accurately expresses the personal view of the Author. DJ Carmichael Pty Limited, members of the Research Team; including authors of this report, its directors and employees advise that they may hold securities, may have an interest in and/or earn brokerage and other benefits or advantages, either directly or indirectly from client transactions in stocks mentioned in this report. The analyst who wrote this report does not hold securities in Altech Chemicals Ltd. DJ Carmichael Pty Ltd provides corporate advice to Altech Chemicals Ltd and is paid a fee for these services. DJ Carmichael Pty Ltd is a wholly owned subsidiary of DJ Carmichael Group Pty Ltd ACN 114 921 247. In accordance with Section 949A of the Corporations Act 2001 D J Carmichael Pty Limited advise this email contains general financial advice only. In preparing this document D J Carmichael Pty Limited did not take into account the investment objectives, financial situation and particular needs (‘financial circumstances’) of any particular person. Accordingly, before acting on any advice contained in this document, you should assess whether the advice is appropriate in light of your own financial circumstances or contact your D J Carmichael Pty Limited adviser. D J Carmichael Pty Limited, its Directors employees and advisers may earn brokerage or commission from any transactions undertaken on your behalf as a result of acting upon this information. D J Carmichael Pty Limited, its directors and employees advise that they may hold securities, may have an interest in and/or earn brokerage and other benefits or advantages, either directly or indirectly, from client transactions. D J Carmichael Pty Limited believe that the advice herein is accurate however no warranty of accuracy or reliability is given in relation to any advice or information contained in this publication and no responsibility for any loss or damage whatsoever arising in any way for any representation, act or omission, whether express or implied (including responsibility to any persons by reason of negligence), is accepted by DJ Carmichael Pty Limited or any officer, agent or employee of D J Carmichael Pty Limited. This message is intended only for the use of the individual or entity to which it is addressed and may contain information that is privileged, confidential and exempt from disclosure under applicable law. If you are not the intended recipient or employee or agent responsible for delivering the message to the intended recipient, you are hereby notified that any dissemination, distribution or copying of this communication and its attachments is strictly prohibited. The Author of this report made contact with the Altech Chemicals Ltd for assistance with verification of facts, admittance to business sites, access to industry/company information. No inducements have been offered or accepted by the company. The recommendation made in this report is valid for four weeks from the stated date of issue. If in the event another report has been constructed and released on Altech Chemicals Ltd, the new recommendation supersedes this and therefore the recommendation in this report will become null and void. Recommendation Definitions SPECULATIVE BUY – 10% or more outperformance, high risk BUY – 10% or more outperformance HOLD – 10% underperformance to 10% over performance SELL – 10% or more underperformance Period: During the forthcoming 12 months, at any time during that period and not necessarily just at the end of those 12 months. Stocks included in this report have their expected performance measured relative to the ASX All Ordinaries index. DJ Carmichael Pty Limited’s recommendation is made on the basis of absolute performance. Recommendations are adjusted accordingly as and when the index changes. To elect not to receive any further direct marketing communications from us, please reply to this email and type 'opt out ' in the subject line. Please allow two weeks for request to be processed. © 2016 No part of this report may be reproduced or distributed in any manner without permission of DJ Carmichael Pty Limited.