retailer risk: the tipping point - rims handouts/rims 16/ind019... · · 2016-05-02•eliminating...
TRANSCRIPT
Retailer Risk: The Tipping Point
IND019
Speakers:
• Carol L. Murphy, Managing Director, Aon Risk Solutions
• Maggie Biggs, Director, Risk & Insurance, PetSmart
• Lé Andra Holly, Senior Manager, Risk Management, Staples, Inc.
• Dave Smith, Director, Risk Services, Advance Auto Parts
Learning Objectives
At the end of this session, you will:
• Understand new analytics available to help reduce TCOR
• Learn how specialty retailers address benchmarking and analytics and adapt to unique business models
• Understand the benefits of “big data” for operational improvement
• Cautionary insights
Carol MurphyManaging Director
Aon Risk Solutions
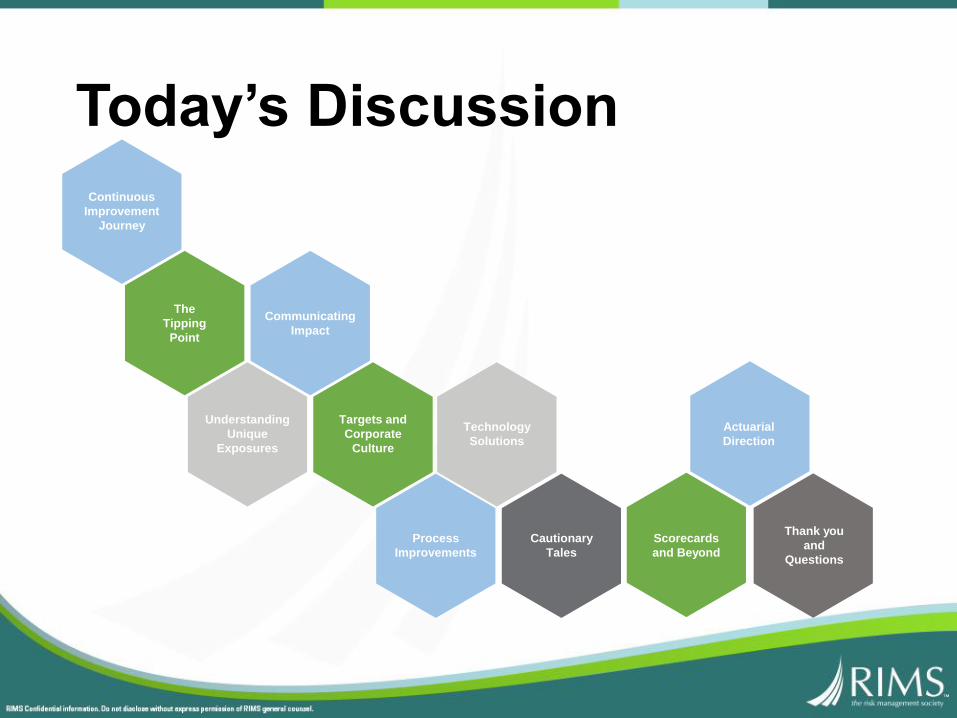
Today’s Discussion
Continuous
Improvement
Journey
The
Tipping
Point
Communicating
Impact
Understanding
Unique
Exposures
Technology
Solutions
Process
Improvements
Cautionary
Tales
Targets and
Corporate
Culture
Thank you
and
Questions
Actuarial
Direction
Scorecards
and Beyond
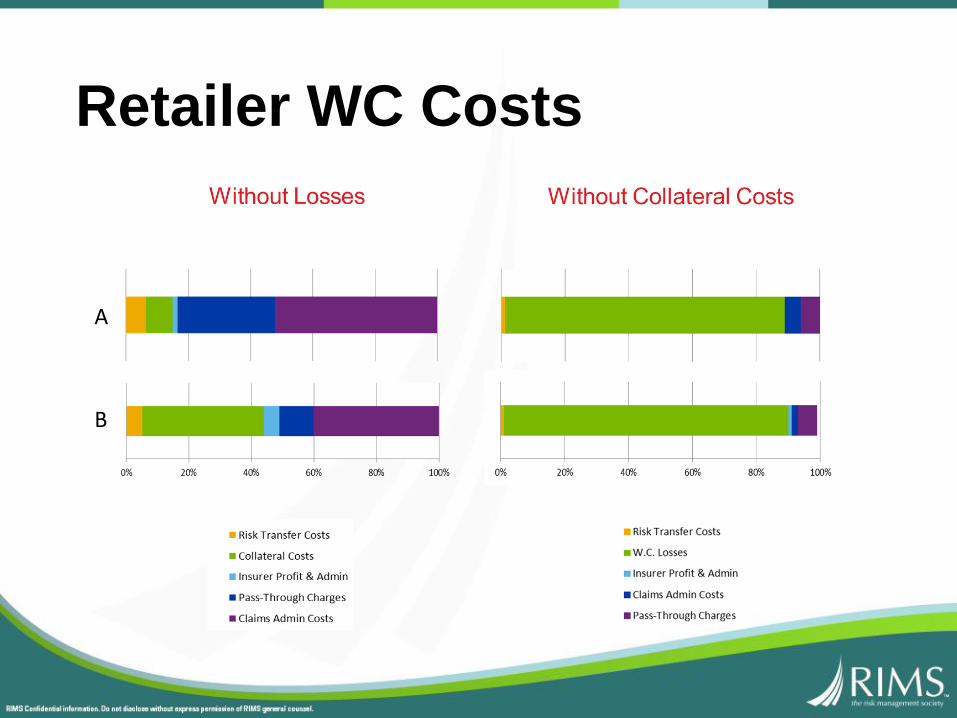
Retailer WC Costs
A
B
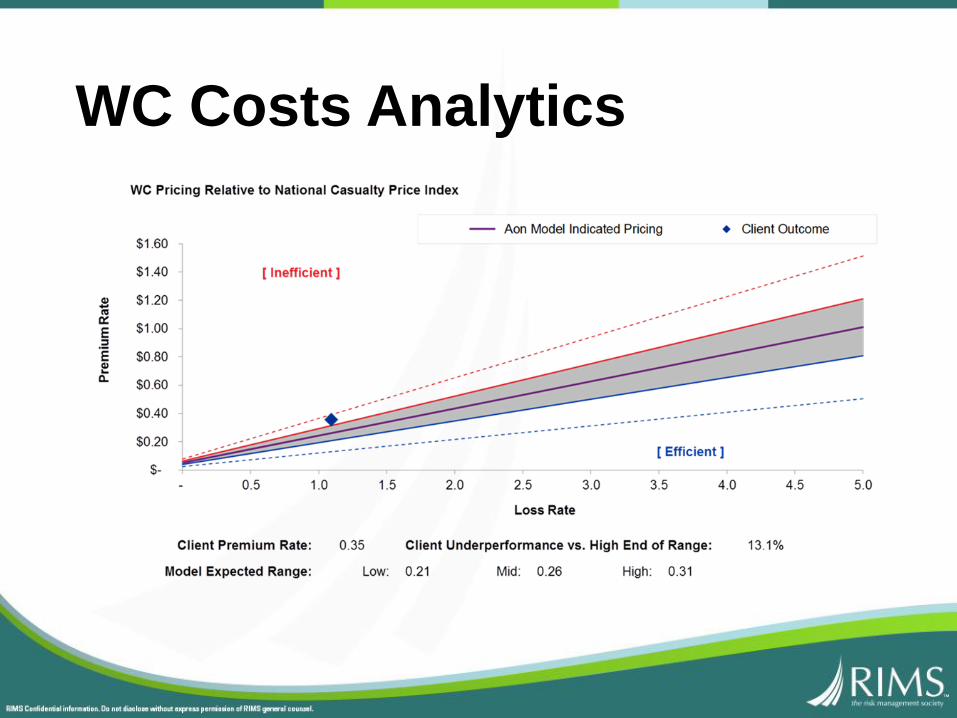
WC Costs Analytics
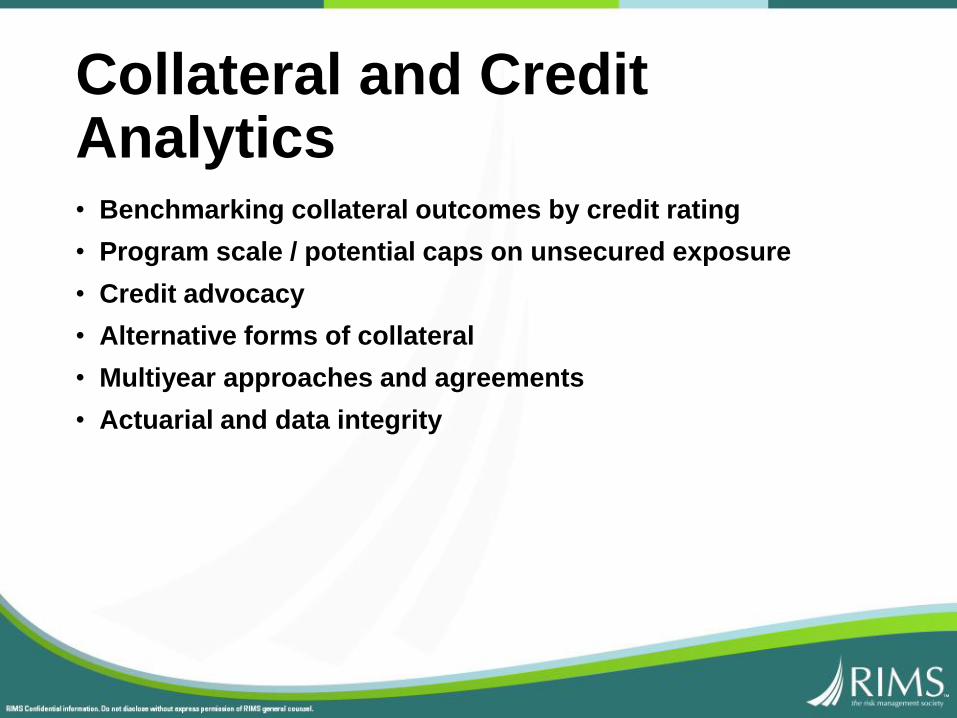
Collateral and Credit Analytics• Benchmarking collateral outcomes by credit rating
• Program scale / potential caps on unsecured exposure
• Credit advocacy
• Alternative forms of collateral
• Multiyear approaches and agreements
• Actuarial and data integrity
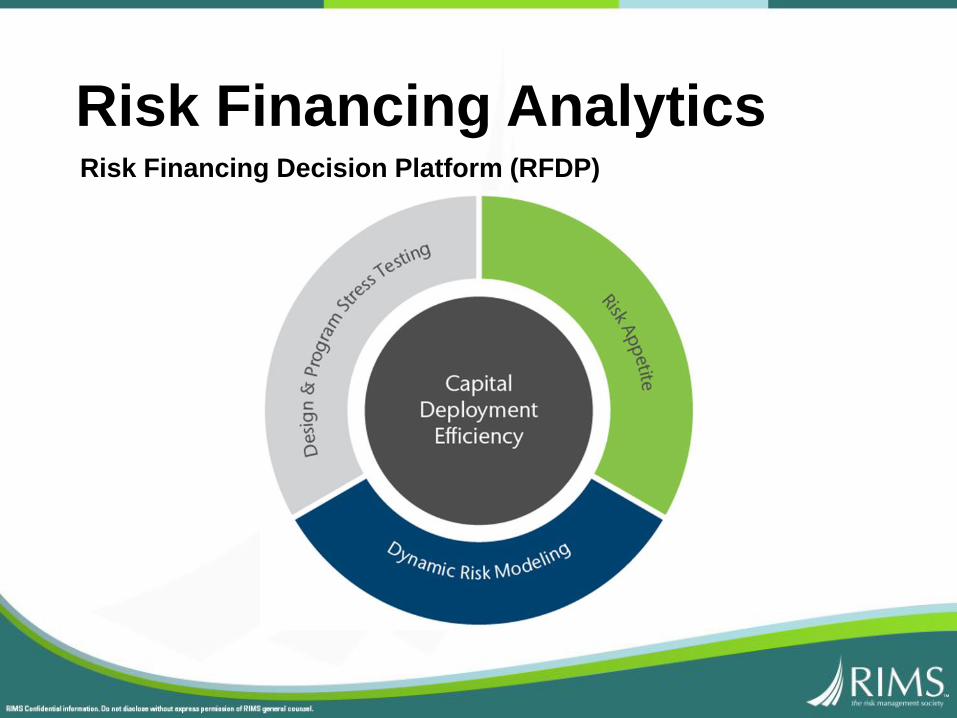
Risk Financing AnalyticsRisk Financing Decision Platform (RFDP)
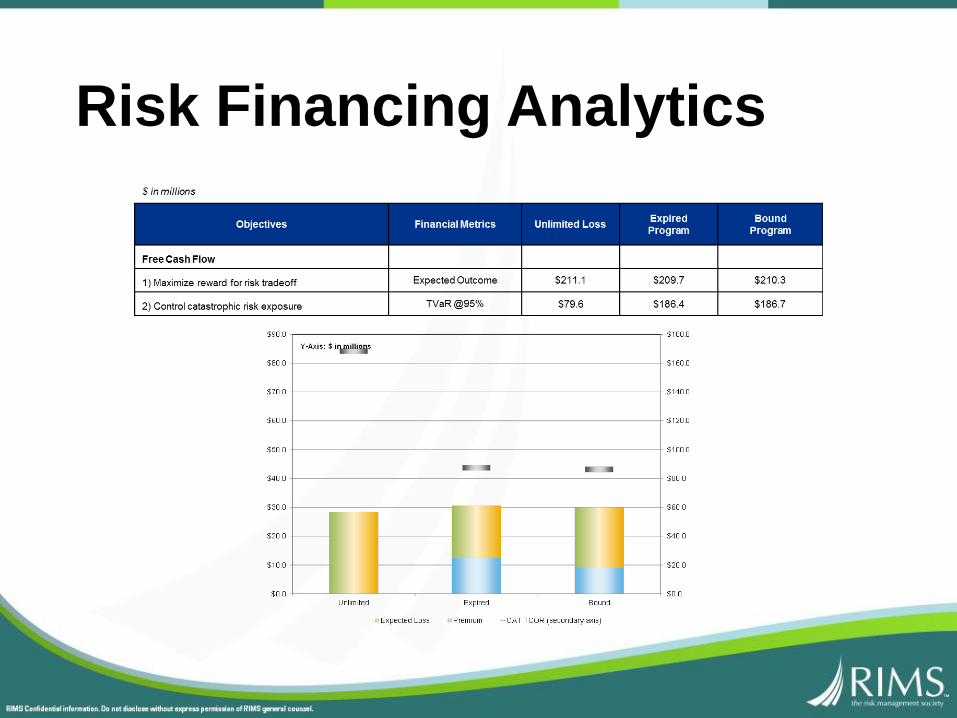
Risk Financing Analytics

TCOR Analytics

Retail WC Cost Drivers

Sample TCOR Strategy
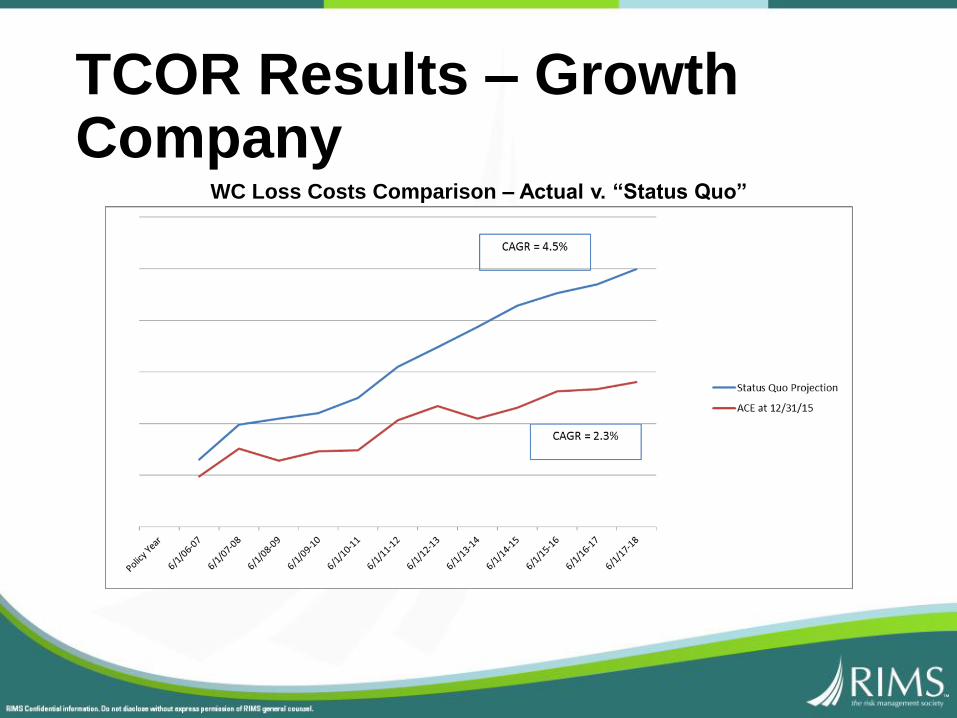
TCOR Results – Growth Company
WC Loss Costs Comparison – Actual v. “Status Quo”
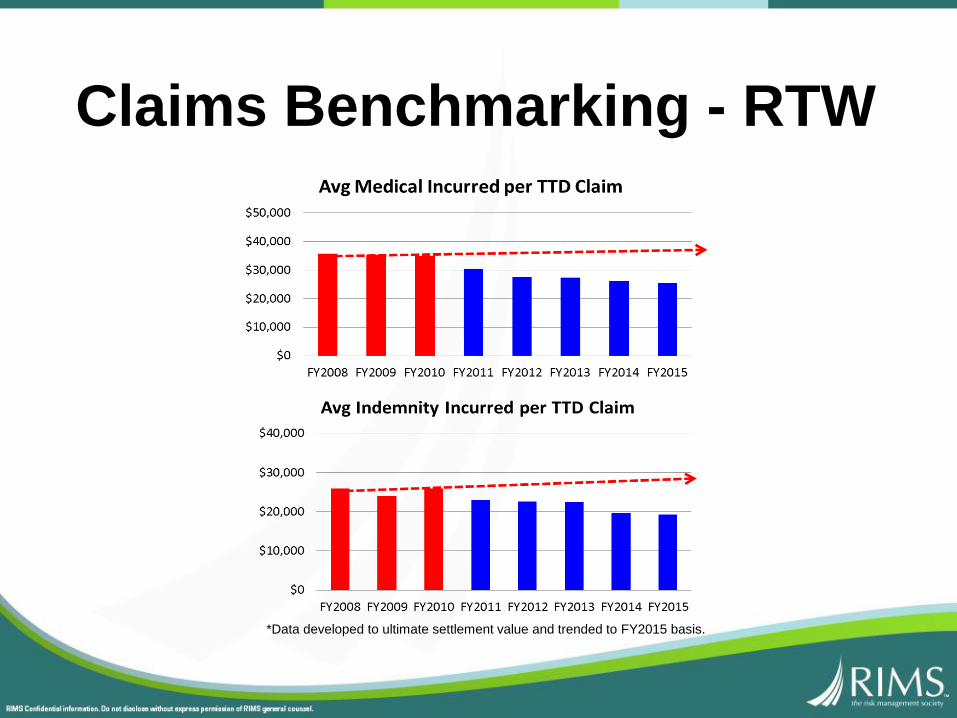
Claims Benchmarking - RTW
*Data developed to ultimate settlement value and trended to FY2015 basis.
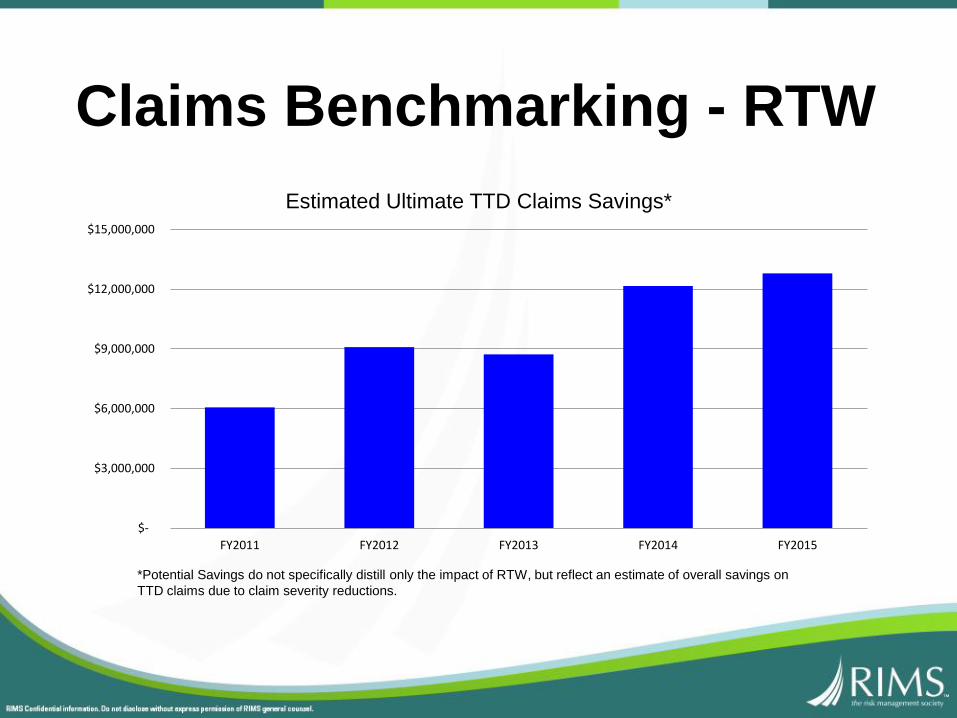
Claims Benchmarking - RTW
$-
$3,000,000
$6,000,000
$9,000,000
$12,000,000
$15,000,000
FY2011 FY2012 FY2013 FY2014 FY2015
Estimated Ultimate TTD Claims Savings*
*Potential Savings do not specifically distill only the impact of RTW, but reflect an estimate of overall savings on
TTD claims due to claim severity reductions.
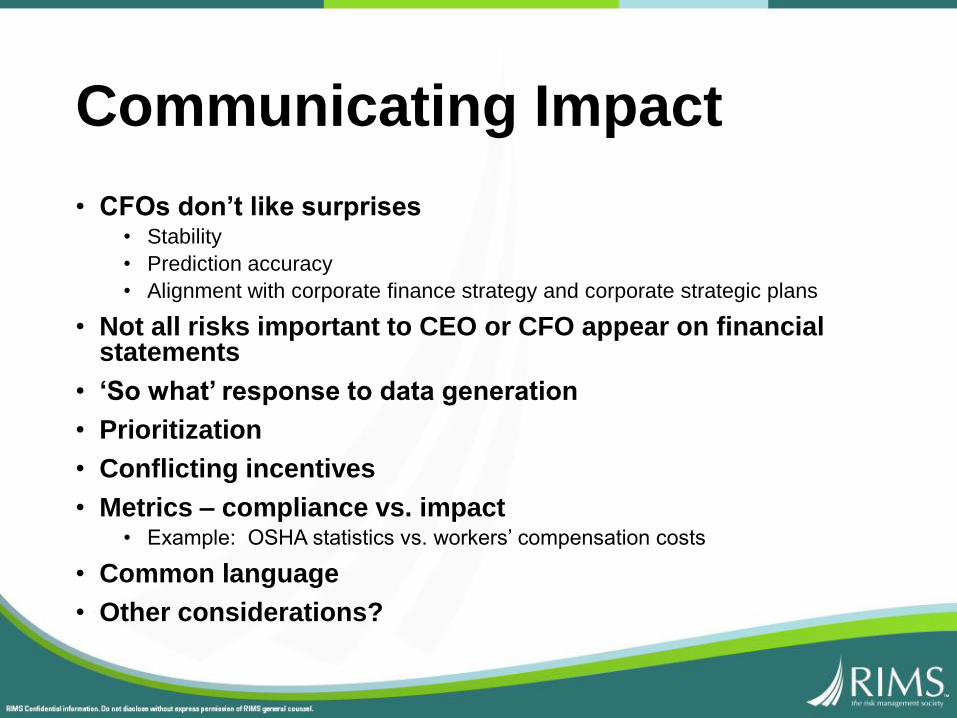
Communicating Impact
• CFOs don’t like surprises• Stability
• Prediction accuracy
• Alignment with corporate finance strategy and corporate strategic plans
• Not all risks important to CEO or CFO appear on financial statements
• ‘So what’ response to data generation
• Prioritization
• Conflicting incentives
• Metrics – compliance vs. impact• Example: OSHA statistics vs. workers’ compensation costs
• Common language
• Other considerations?

Maggie BiggsDirector, Risk & Insurance
PetSmart
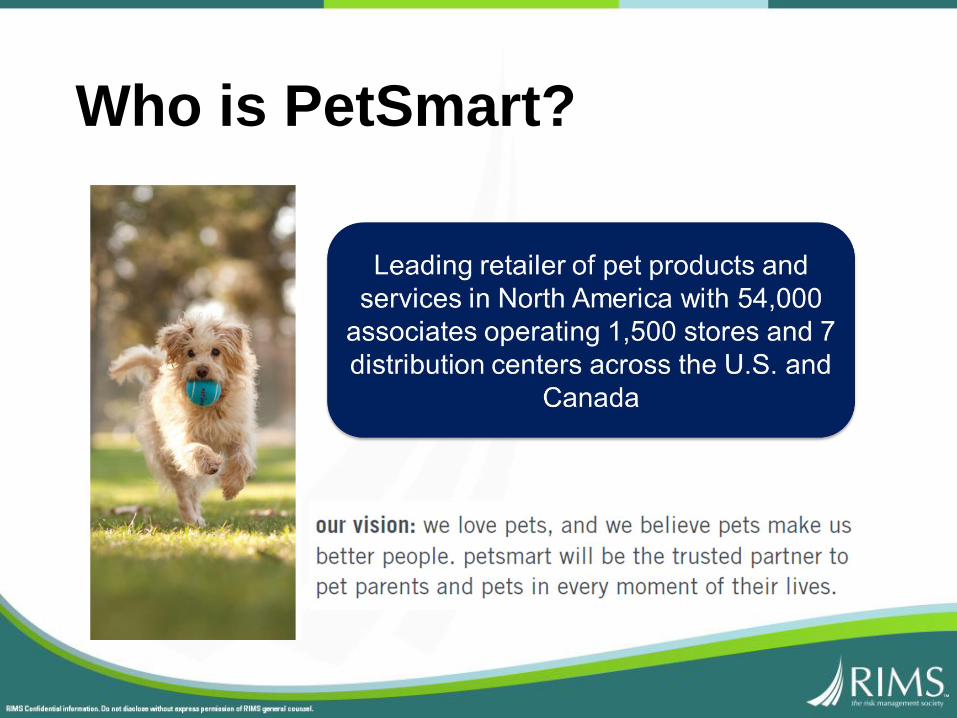
Who is PetSmart?
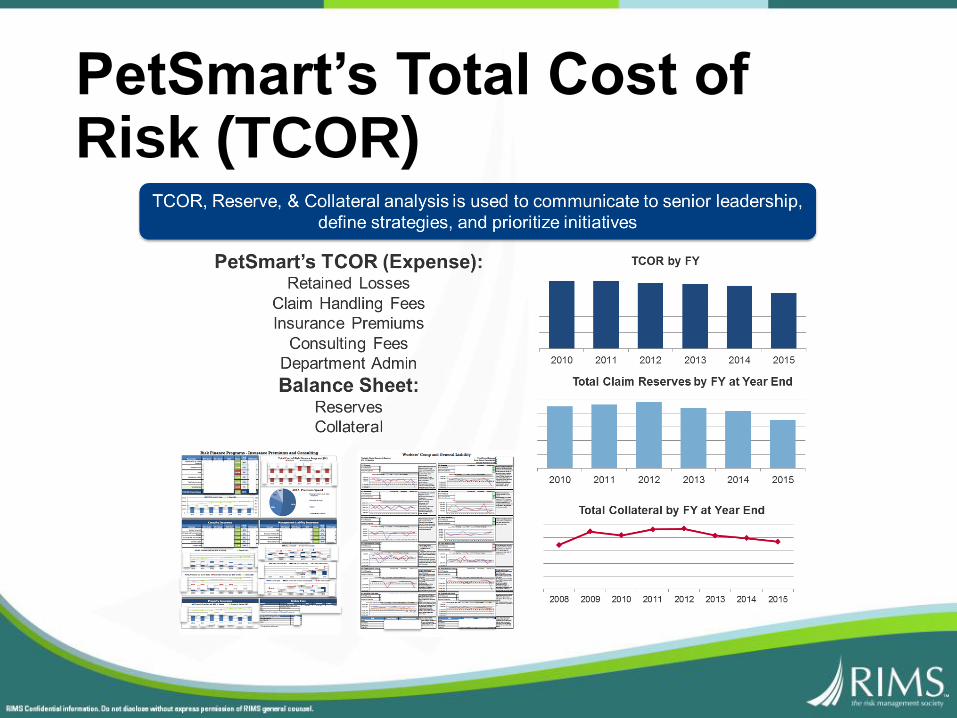
PetSmart’s Total Cost of Risk (TCOR)
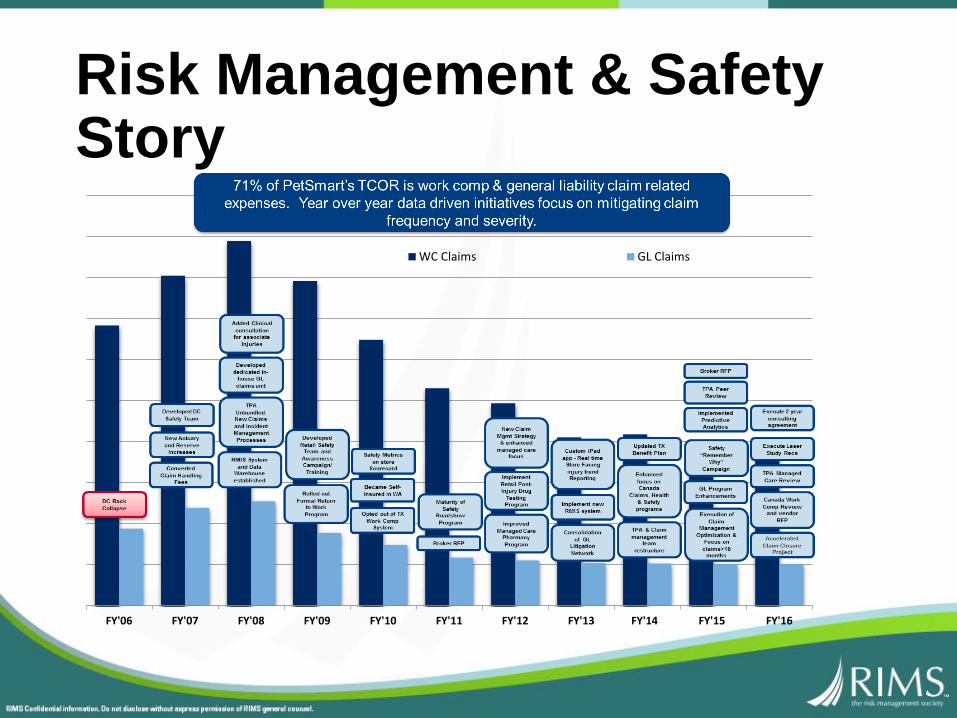
Risk Management & Safety Story
FY'06 FY'07 FY'08 FY'09 FY'10 FY'11 FY'12 FY'13 FY'14 FY'15 FY'16
WC Claims GL Claims
Pet Specialty Retail
• What do we do to understand and mitigate our unique exposures and non-traditional risks?
• How does this impact benchmarking and analysis?
Data Driven Risk Management• “You can’t impact what you can’t measure”
• Leverage existing internal and external capabilities
• Emerging Tools
• What is your priority / guiding light?

Lé Andra HollySenior Manager, Risk Management
Staples, Inc.

Staples Risk Management
MAKE MORE HAPPEN!
GET THE RIGHT INFORMATION TO THE RIGHT PEOPLE AT THE RIGHT TIME!
DRIVE LOSS AND SAFETY NUMBERS DOWN AND CORPORATE-WIDE KEY PERFORMANCE INDICATORS UP!

Primary Targets
• Direct Costs• Reduce Insurance Premiums & Collateral
• Reduce Claims Costs & Expenses
• Indirect Costs• Reduce Downtime & Decreased Quality
• Reduce Need to Replace Associates
• Reduce Need for Replacement Vehicles or Equipment
• Increase Morale
• Retail-Relevant• Increase Sales
• Reduce Shrinkage
• Increase Stock Turnover Rate
• Increase Customer Retention & Service Scores
• Remove Need for Unionization

Challenges
• Small Risk Management Department
• Inability to Efficiently Combine Data From Multiple Sources
• Inability to Efficiently Measure Processes, Programs & Mitigation Plans
• Information Flow Bottlenecks & Gaps
Solutions: Technology
• Risk Management Information System (Riskonnect)
• Increased Risk Management Visibility throughout Staples
• Eliminating Manual Processes & Streamline Risk Management Processes
• Improving Ability to Identify, Manage & Mitigate Risk in a Timely Fashion
• Ability to Share & Manage Multiple Sources of Data Efficiently
• Maximizing Cost-Saving Opportunities
• Efficient Use of Time & Risk Management Resources
• Proactive Risk Management
Data Integration
• Sources of Information• Insurance & Claims
• Disability Management
• Finance & Accounting
• Human Resources
• Learning & Development
• Loss Prevention
• Safety & Health
• Wellness
The Big PictureDOWN TO THE DETAILS & CIRCUMSTANCES
DRIVING THE TOTAL COST OF RISK
“What’s Really Going On?”

Proceed with Caution
• Meaningful Data
• Meaningful Tools & Functionality
• Data Integrity
• Audience
• Timing Of Integration & Information
Solutions: Processes
• Shift Claims Management Strategy
• Encourage Creative, Cost-Effective Claim Management Solutions Via Data Analytics, Team Engagement & Empowerment and Measurement Of Outcomes
• Claim Cost Analysis
• Identified Gaps Inherent in Traditional Claims Management Processes
• Developing & Implementing Various Cost Effective Solutions

Return on Investment
• Insurance Management
• Better Story to Tell Underwriters
• Reduce Insurance Premiums & Collateral Obligations
• Increase Carrier & Coverage Options
• Claims Management
• Performance Based Measurement of Internal Claims Partners & Service Providers
• Aggressive Integrated Return to Work Program
• Targeted Cost Saving Opportunities
• Pharmacy, Hospital, IMEs, PT, NCM, SIU, Legal & Managed Care Costs
Return on Investment
• Loss Prevention & Safety
• Culture of Wellness & Safety
• Focus on Quality, Execution & Associates’ Overall Health as an Investment in the Future of Staples
• Vendor Management
• Certificates for High Exposure Suppliers & Service Providers
• Technology, Medical, Distributors, Manufacturers, etc.
• Easily Identify Contingent Service Providers
• Cyber Liability & Property Programs

David Theron SmithDirector, Risk Services
Advance Auto Parts
Analytics & Metrics
The Strategic Payoff
Total Cost of Risk
Actuarial Management
• Analytics – Goals & Objectives
• The Basics
• The Buzz
• The Real Stuff
• Managing Your Actuary
David Theron Smith
Director-Risk
Services
Advance Auto Parts
Roanoke, VA
• Operational
• Financial
• Reduction in the Rate of Total Cost of Risk (TCOR)
• Reduction in Ultimate Liabilities
• Actuarial Management
Analytics – Goals & Objectives
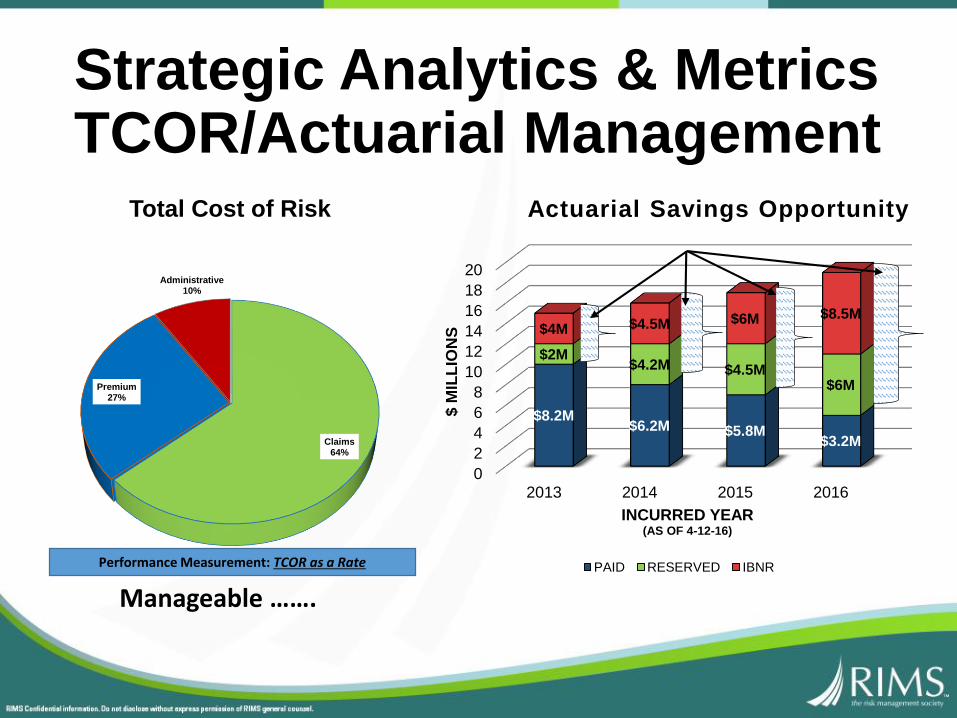
Strategic Analytics & MetricsTCOR/Actuarial Management
Claims64%
Premium27%
Administrative10%
Total Cost of Risk
Performance Measurement: TCOR as a Rate
Manageable …….
0
2
4
6
8
10
12
14
16
18
20
2013 2014 2015 2016
$8.2M$6.2M $5.8M
$3.2M
$2M$4.2M $4.5M
$6M
$4M $4.5M $6M $8.5M
$ M
ILL
ION
S
INCURRED YEAR (AS OF 4-12-16)
Actuarial Savings Opportunity
PAID RESERVED IBNR
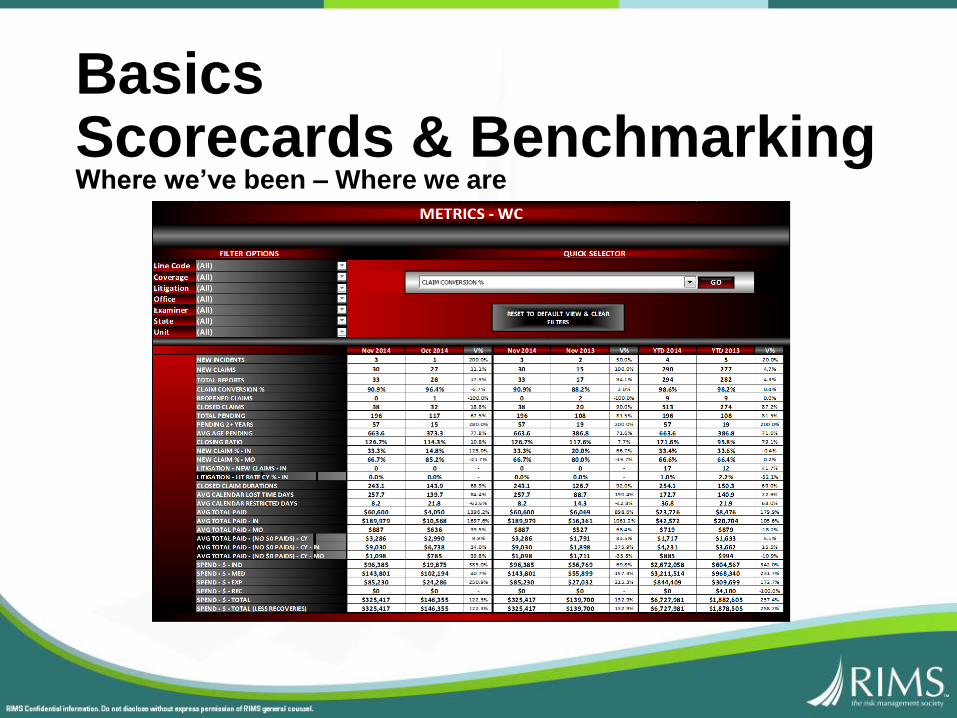
BasicsScorecards & BenchmarkingWhere we’ve been – Where we are

The Buzz – Where We’re Going• Predictive Modeling – What is it?
• An attempt to predict future outcomes based upon historic data or behavior.
• An attempt to forecast probabilities and trends based upon data mining of what has already happened
• An attempt to leverage statistics to predict theoretical outcomes.
• A tool on which to formulate strategic initiatives
• It’s a science, it’s Actuarial….
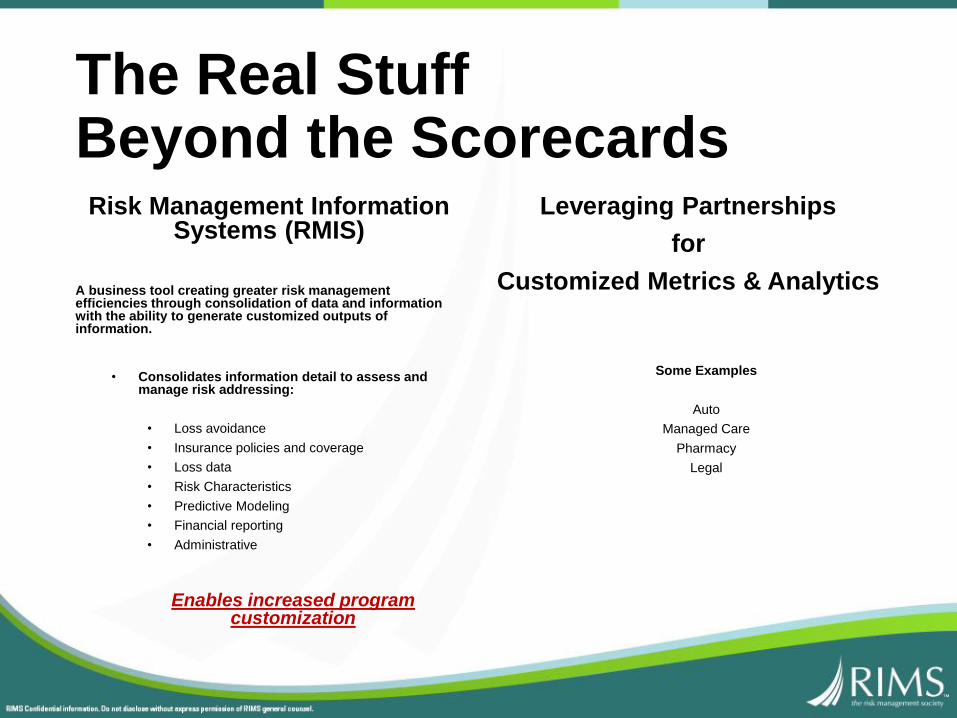
The Real Stuff Beyond the ScorecardsRisk Management Information
Systems (RMIS)
A business tool creating greater risk management efficiencies through consolidation of data and information with the ability to generate customized outputs of information.
• Consolidates information detail to assess and manage risk addressing:
• Loss avoidance
• Insurance policies and coverage
• Loss data
• Risk Characteristics
• Predictive Modeling
• Financial reporting
• Administrative
Enables increased program customization
Leveraging Partnerships
for
Customized Metrics & Analytics
Some Examples
Auto
Managed Care
Pharmacy
Legal

Accident Frequency Trending
YearTotal Claims
PMM
Controllable
Claims PMM
Preventable
Claims PMMMiles Driven
2011 11.79 5.91 2.95 31,811,304
2012 11.49 6.14 3.19 33,235,224
2013 10.70 5.80 3.26 43,278,828
2014 10.78 5.57 2.94 42,191,604
% Change
From 2011↓ -8.5% ↓ -5.8% ↓ -0.5% ↑ 32.6%
Fleet Data AnalyticsMillion Miles Analysis - PMM

Risk Level 4Total Damage Cost: $7,813.53
Technology-Driven Data AnalyticsTelematics-Integrated Administrator Solution
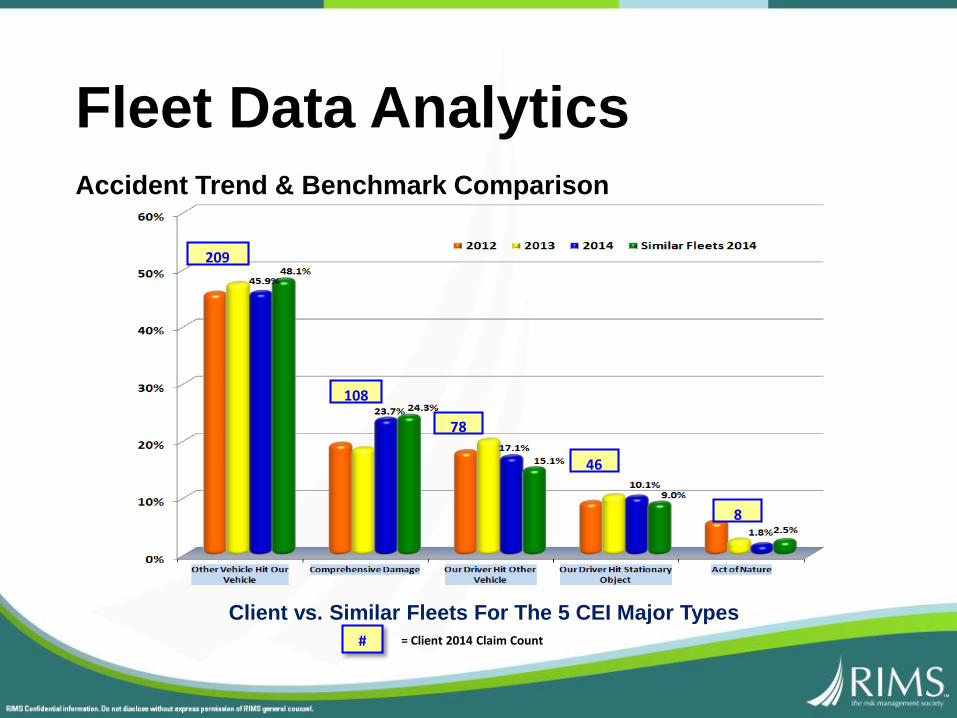
# = Client 2014 Claim Count
209
108
78
46
8
Client vs. Similar Fleets For The 5 CEI Major Types
Fleet Data AnalyticsAccident Trend & Benchmark Comparison
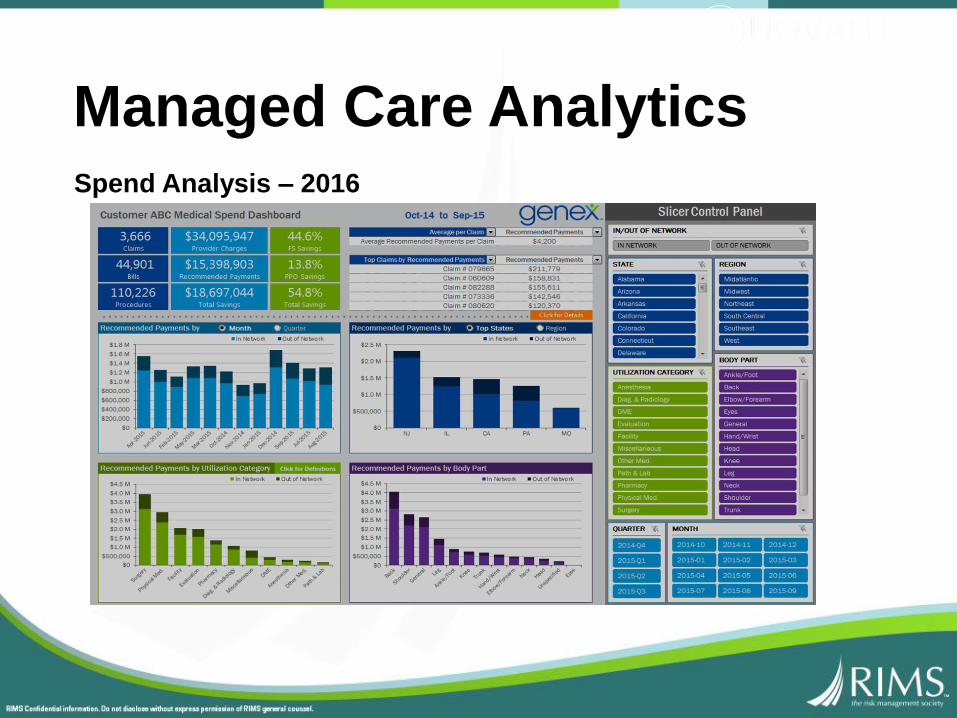
Spend Analysis – 2016
Managed Care Analytics
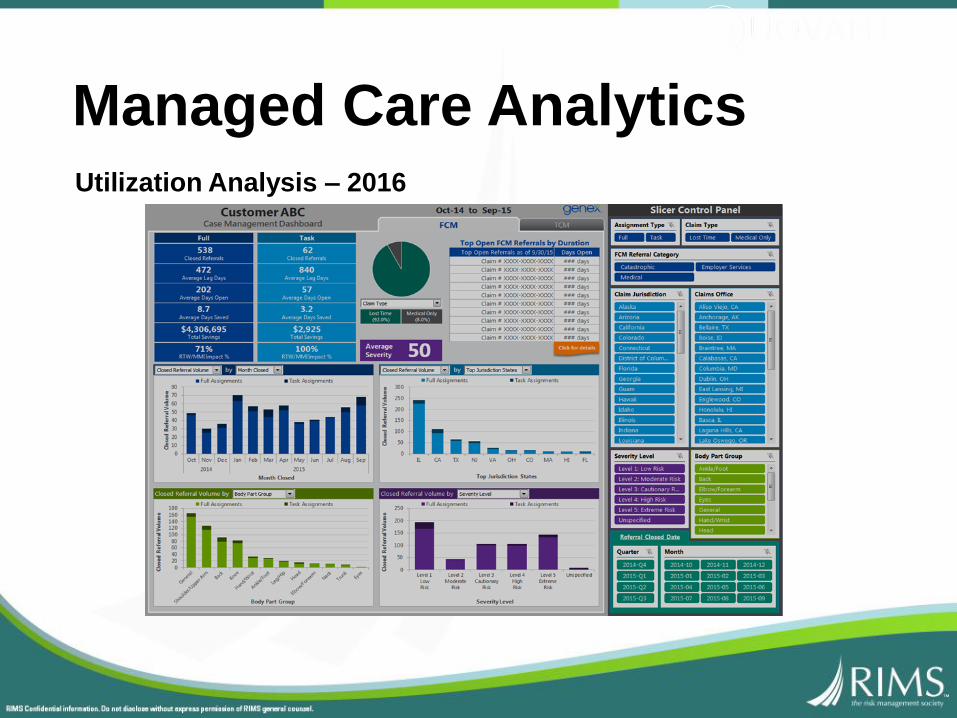
Utilization Analysis – 2016
Managed Care Analytics

PBM Reporting & Analytics
Pharmacy Analytics
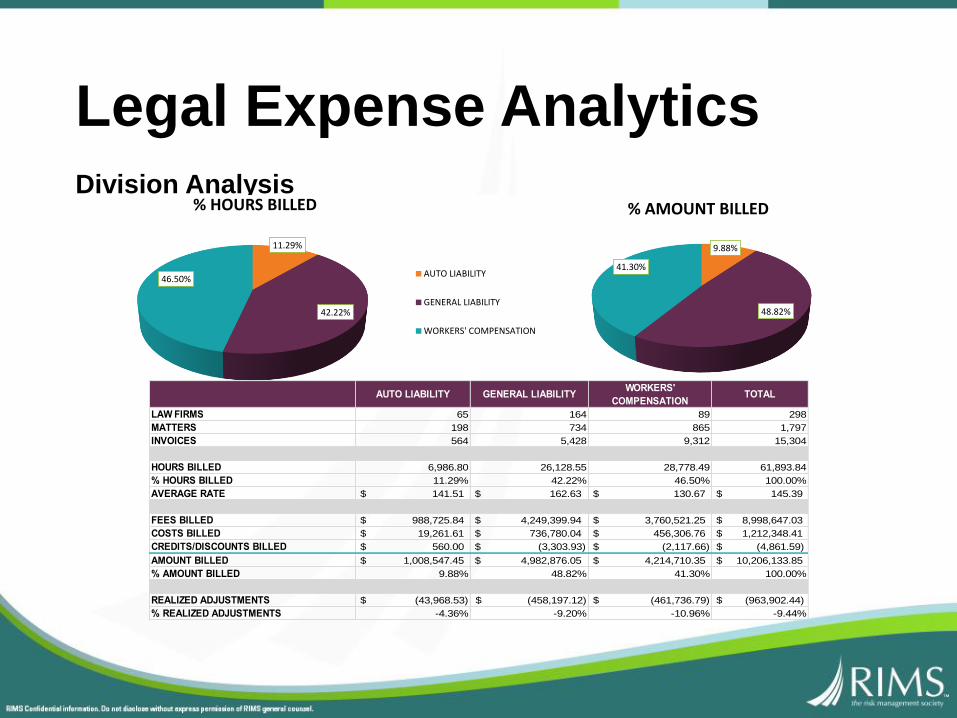
Legal Expense AnalyticsDivision Analysis
11.29%
42.22%
46.50%
% HOURS BILLED
AUTO LIABILITY
GENERAL LIABILITY
WORKERS' COMPENSATION
9.88%
48.82%
41.30%
% AMOUNT BILLED
AUTO LIABILITY GENERAL LIABILITYWORKERS'
COMPENSATIONTOTAL
LAW FIRMS 65 164 89 298
MATTERS 198 734 865 1,797
INVOICES 564 5,428 9,312 15,304
HOURS BILLED 6,986.80 26,128.55 28,778.49 61,893.84
% HOURS BILLED 11.29% 42.22% 46.50% 100.00%
AVERAGE RATE $ 141.51 $ 162.63 $ 130.67 $ 145.39
FEES BILLED $ 988,725.84 $ 4,249,399.94 $ 3,760,521.25 $ 8,998,647.03
COSTS BILLED $ 19,261.61 $ 736,780.04 $ 456,306.76 $ 1,212,348.41
CREDITS/DISCOUNTS BILLED $ 560.00 $ (3,303.93) $ (2,117.66) $ (4,861.59)
AMOUNT BILLED $ 1,008,547.45 $ 4,982,876.05 $ 4,214,710.35 $ 10,206,133.85
% AMOUNT BILLED 9.88% 48.82% 41.30% 100.00%
REALIZED ADJUSTMENTS $ (43,968.53) $ (458,197.12) $ (461,736.79) $ (963,902.44)
% REALIZED ADJUSTMENTS -4.36% -9.20% -10.96% -9.44%
$-
$50,000.00
$100,000.00
$150,000.00
$200,000.00
$250,000.00
$300,000.00
Am
ount
(USD
)
Recommended Adjustments
Realized Adjustments
Quovant Fee
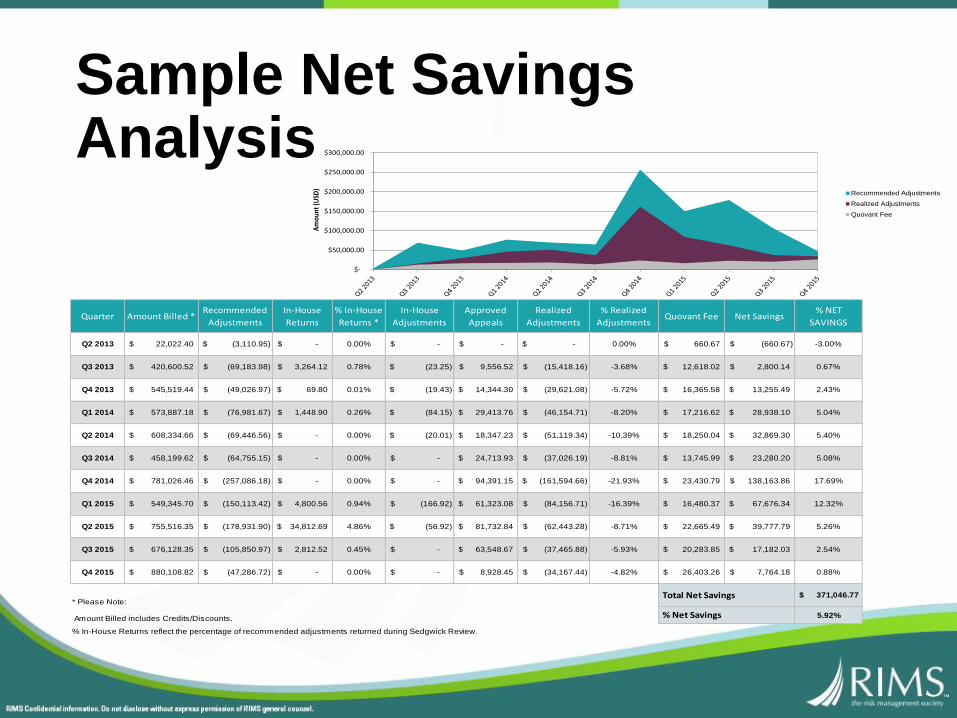
Sample Net Savings Analysis
Quarter Amount Billed *Recommended
Adjustments
In-House
Returns
% In-House
Returns *
In-House
Adjustments
Approved
Appeals
Realized
Adjustments
% Realized
AdjustmentsQuovant Fee Net Savings
% NET
SAVINGS
Q2 2013 22,022.40$ (3,110.95)$ -$ 0.00% -$ -$ -$ 0.00% 660.67$ (660.67)$ -3.00%
Q3 2013 420,600.52$ (69,183.98)$ 3,264.12$ 0.78% (23.25)$ 9,556.52$ (15,418.16)$ -3.68% 12,618.02$ 2,800.14$ 0.67%
Q4 2013 545,519.44$ (49,026.97)$ 69.80$ 0.01% (19.43)$ 14,344.30$ (29,621.08)$ -5.72% 16,365.58$ 13,255.49$ 2.43%
Q1 2014 573,887.18$ (76,981.67)$ 1,448.90$ 0.26% (84.15)$ 29,413.76$ (46,154.71)$ -8.20% 17,216.62$ 28,938.10$ 5.04%
Q2 2014 608,334.66$ (69,446.56)$ -$ 0.00% (20.01)$ 18,347.23$ (51,119.34)$ -10.39% 18,250.04$ 32,869.30$ 5.40%
Q3 2014 458,199.62$ (64,755.15)$ -$ 0.00% -$ 24,713.93$ (37,026.19)$ -8.81% 13,745.99$ 23,280.20$ 5.08%
Q4 2014 781,026.46$ (257,086.18)$ -$ 0.00% -$ 94,391.15$ (161,594.66)$ -21.93% 23,430.79$ 138,163.86$ 17.69%
Q1 2015 549,345.70$ (150,113.42)$ 4,800.56$ 0.94% (166.92)$ 61,323.08$ (84,156.71)$ -16.39% 16,480.37$ 67,676.34$ 12.32%
Q2 2015 755,516.35$ (178,931.90)$ 34,812.69$ 4.86% (56.92)$ 81,732.84$ (62,443.28)$ -8.71% 22,665.49$ 39,777.79$ 5.26%
Q3 2015 676,128.35$ (105,850.97)$ 2,812.52$ 0.45% -$ 63,548.67$ (37,465.88)$ -5.93% 20,283.85$ 17,182.03$ 2.54%
Q4 2015 880,108.82$ (47,286.72)$ -$ 0.00% -$ 8,928.45$ (34,167.44)$ -4.82% 26,403.26$ 7,764.18$ 0.88%
$ 371,046.77
5.92%
% In-House Returns reflect the percentage of recommended adjustments returned during Sedgwick Review.
* Please Note: Total Net Savings
Amount Billed includes Credits/Discounts. % Net Savings
Risk Analytics as Performance Drivers
• Identify and Manage Trends
• Red Flag Analytics
• Communicate, Drive & Manage Behavior
• Financial Reporting & Accounting
• Reduce TCOR
• Demonstrate Performance to Actuaries

Actuarial Management
Appendix
Carol Murphy
Managing Director and U.S. Casualty Growth Leader, Aon Broking
• Carol is our U.S. practice leader responsible for casualty business development. She serves as casualty broker for some of the largest and most complex clients in the firm, and also formed and leads our industry-leading Loss Portfolio Transactions practice and our Laser Broking platform.
• Carol’s areas of expertise include Analytics and Modeling, TCOR Strategy, Collateral, Umbrella & Excess Liability, Alternative Risk and Loss Portfolio Transactions.
Background:
• A leader in our Casualty Broking operations since 2001, she led our Central Region Broking team from 2007-2012, driving growth by building distinctive customer value through broking, accountability and service. She was promoted to Managing Director and Strategic Account Manager in 1997 and lead the Risk Management practice in San Francisco from 1999-2000.
• B.A., Economics, Bates College.
• M.B.A., The University of Chicago Booth Graduate School of Business.
• Carol has been recognized as a top “Power Broker” by Risk & Insurance for eight years and as a “Responsibility Leader” in 2012 and 2015. Ms. Murphy has also been honored as a “Woman to Watch” by Business Insurance, “Woman Worth Watching” by Diversity Journal and as one of the top 50 women in insurance by Reactions.
Maggie Biggs
Director, Risk & Insurance, PetSmart
• Maggie currently leads the Risk Finance / Insurance & Analytics, Claims Management, and Business Continuity teams for this $7B retailer with 54,000 associates, 1,400 stores, and 8 distribution centers in the US and Canada.
Background:
• Maggie received her MBA and a B.S. in Finance from Arizona State University.
• Prior to joining PetSmart, Maggie served in a Treasury function at Starwood Hotels & Resorts, a global hotel & hospitality company, and in an Executive Risk Client Advisory function for Marsh, a global provider of insurance & risk services
Lé Andra Holly
Senior Manager, Risk Management, Staples, Inc.
• Lé Andra manages key components of Staples’ Global Risk Management Program.
• Lé Andra has spearheaded several key risk management projects over the years, including the implementation of risk management information systems to turn big data into actionable data.
Background:
• Lé Andra brings over 14 years of experience in the risk management.
• She began her career as a multi-line Adjuster at Federated Mutual Insurance before moving into claims consulting with McGriff Seibels & Williams.
• Prior to Staples she managed the insurance and claims programs for Kenco Group, Inc., a privately-held third party logistics corporation.
David Theron Smith
Director, Risk Services, Advance Auto Parts
• David has more than 30 years of Diverse experience in the insurance sector.
Background:
• David has served as Vice President and Board Member for the Carolina’s Risk and Insurance Management Society (RIMS), has served on the Board of Directors for the South Carolina Captive Insurance Association (SCCIA), and served as Workplace Task Force Co-Chair & Executive Committee Member – National Action Alliance for Suicide Prevention, under former Secretary of Health and Human Services, Kathleen Sebelius, and former Secretary of the Army, John McHugh.
• Mr. Smith has been featured in Risk & Insurance, published in Claims Management, Risk & Insurance, and National Underwriter magazines. Mr. Smith has spoken on various Risk Management, Disability Management, Crisis Response, Business Continuity, Disaster Response, Workplace Violence, Litigation Management, ERM, Fraud, Pharmaceutical Abuse before multiple professional organizations, including the American Bar Association and the Risk and Insurance Management Society (RIMS). For his work in the development of successful post traumatic response to workplace violence and acceleration of return to work, Mr. Smith received Risk & Insurance Management Magazine’s Risk Innovator of the Year award and Liberty Mutual’s Responsibility Leader Award.

Thank you!
Questions?