retention and the first-year student experience of higher education in the uk bernard longden
TRANSCRIPT

Retention and the first-year student experience of higher
education in the UK
Bernard Longden

Where we are today
In the most recent year for which published public data is available (HESA, 2005: table 3a) there were 313,755 full time first degree new entrants in UK universities and colleges.
During that academic year 29,945 left and two years later were no longer in higher education (9.5% non completion rate for the UK).
The average across the UK university sector hides the wide variation between institutions which ranges from 1.6% to 26% of their intake deciding to leave in their first year of study.

Underpinning documents

Context
• The project– aspects of the first year full time home student experience of
higher education• Two phases:
– Phase 1 • 2005-06 base line student experience• Reflecting back to 1997 HEFCE report
– Phase 2• 2006-07 reflective experience of non completion students• Confidentiality restricted link between phase 1 and phase 2
• Conducted prior to introduction of variable student tuition fees
• Developed to encourage HEFCE, HEA, DIUS or anyone to consider establishing a trend analysis
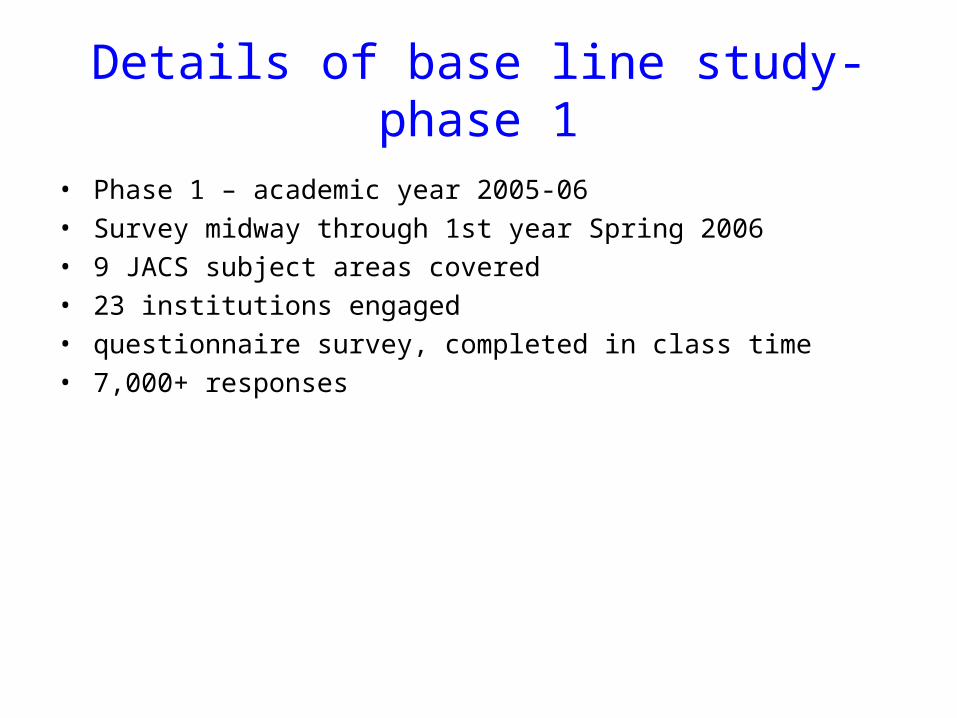
Details of base line study-phase 1
• Phase 1 – academic year 2005-06• Survey midway through 1st year Spring 2006• 9 JACS subject areas covered• 23 institutions engaged• questionnaire survey, completed in class time• 7,000+ responses

Details of non retention study -phase 2
• Phase 2 – academic year 2006-07• First year students in 2005-06• Survey of ‘withdrawn’ students at/before end academic
year 05-06• 25 institutions engaged• HEI not limited by previous JACS subjects• postal questionnaire survey, Spring 2007• 400+ responses• Anonymity prevents link back to phase 1

Focus on phase 1 data

Teaching and Learning
• Programmes generally stimulating • Supportive teaching• Good understanding of academic demand…• … but coping with it more of a problem• Feedback, esp. promptness, seen less positively• Low likelihood of ‘reading around’ the subject• Differences between subject areas• Differences between institutions

Risk factors –two main factors identified were:
• Poor appreciation of programme and/or institution • Worry about finance • Part-time employment may exert an influence, and is
differentially related to socio-economic grouping:those from lower socio-economic groups are more likely to take it up

Student pre-knowledge of an HEI considering withdrawing
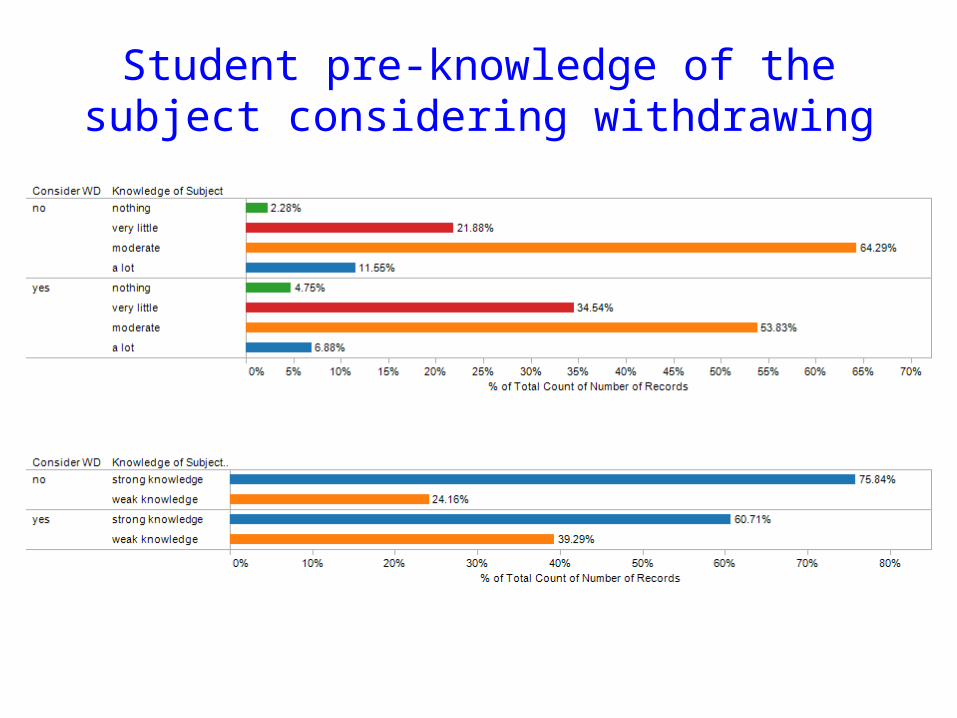
Student pre-knowledge of the subject considering withdrawing
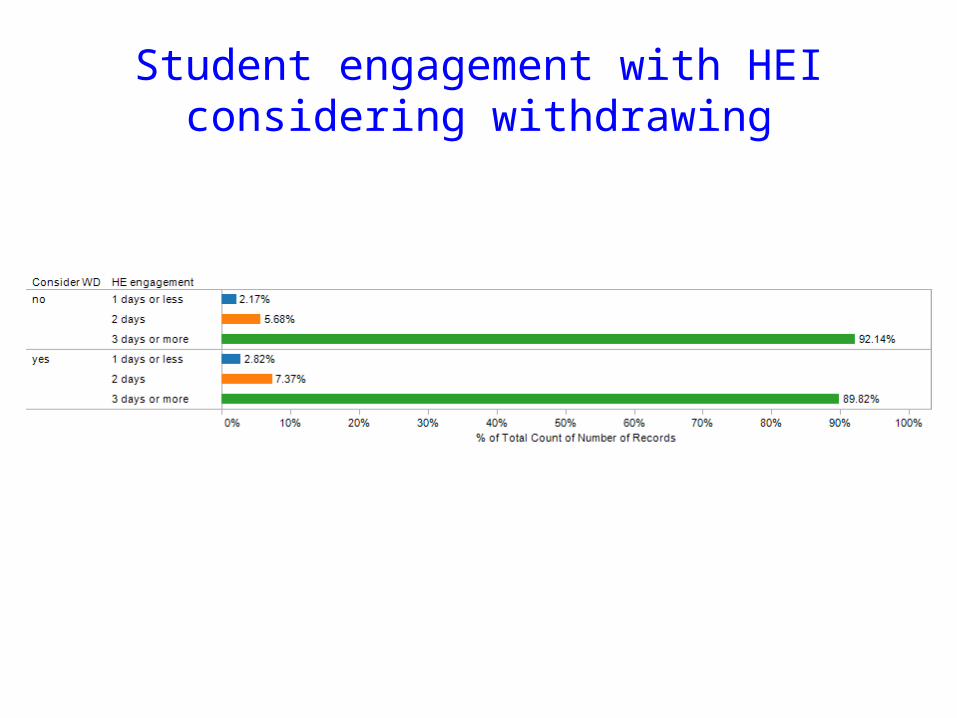
Student engagement with HEI considering withdrawing

Student private study commitment considering withdrawing

Student understanding the academic demand

Student acknowledgement of supportive teaching

Student ability to cope with academic demands

Free response – top ten coded worse experiences voiced by students
0.0% 2.0% 4.0% 6.0% 8.0% 10.0% 12.0% 14.0% 16.0% 18.0%
Percentage frequency of response reflecting the ' worst aspects of the first year experience'
Accommodation related (207)
I nduction process (222)
Personal matters (280)
Organisation & management (309)
Friendships/ Relationships (373)
Finance related (404)
Curriculum aspects (441)
Teaching related (523)
Feedback & assessment (624)
Workload & time management (832)

Focus on phase 2 data

Headlines from report
• Data reduction identified seven latent variables– Poor quality of learning experience– Not coping with academic demands– Wrong choice of field of study– Unhappy with location and environment– Dissatisfied with institutional resourcing– Problems with finance and employment– Problems with social integration
• Compared to 1997 HEFCE report little has changed

Non completion students’ pre-knowledge of HEI

Non completion students’ pre-knowledge of subject

student perception of influences

Distillation – some questions
• Knowledge of subject and university –why?– Do we spend too much on a glossy image?– Do we interview and select any more?– Do we provide the ‘right’ information to promote choice?
• Gap between marketing and the ‘life’ experienced by student– Is there a gap between expectation and experience?– If a gap exists where should the movement occur to close the
gap – student or university?• Pro active or laissez faire?
– What impact will the Public Accounts Committee have on HEFCE regarding applying their ‘clout’ at HEI with poor retention?
– Will HEFCE adopt the TDA funding methodology or funding on contract rather than registrations?