retention by expected family contribution...
TRANSCRIPT

1
Retention by Expected Family Contribution (EFC) 12/14/16
This report investigates 2nd Fall and 3rd Fall retention rates by Expected Family Contribution (EFC) for recent first-time,
full-time (FTFT) freshman cohorts. This report serves as an update to, and extension of, prior retention by EFC reports.
Analyses are conducted separately for Colorado resident freshmen and nonresident freshmen, and sub-groups of
interest including First Generation students and minority students are analyzed in addition to the full cohort population.
Executive Summary
Across the FA11-FA15 cohorts there is a positive association between EFC and both 2nd Fall and 3rd Fall retention.
o Low-income students persist at rates lower than the overall cohort rate.
o Middle-income students persist at rates that are similar to the overall cohort rate.
o Upper-income students persist at rates that exceed the overall cohort rate.
Low and middle income students make up over 75% of the recent Colorado resident cohort, and thus retention
rates among these groups significantly impact CSU’s overall retention rate.
o The distribution of students at each income range has remained relatively stable across the FA11-FA14
freshman cohorts.
o Nonresident freshmen are substantially more likely than Colorado resident freshmen to fall into the
upper income and non-filer groups.
For low-income students, there is a positive association between CTC receipt and retention.
o Low-income students who receive half- or full-CTC support persist at rates that are about 5 to 8
percentage points (PP) higher than Colorado low-income students who receive no CTC support.
o This effect is present across 2nd and 3rd Fall retention measures, and across the studied first generation
and minority subgroups.
Among nonresident freshmen, low-income students persist to both 2nd Fall and 3rd Fall at very low rates
compared to their middle-income, upper-income, and non-filer peers.
o For 2nd Fall retention, FA15 low-income nonresidents persist at a rate (74.9%) that is 7.8 PP lower than
the FA15 nonresident average.
o For 3rd Fall retention, FA14 low-income nonresidents persist at a rate (62.7%) that is 11.1 PP lower than
the FA14 nonresident average.
o Among these low-income nonresidents, 37.4% are first generation and 27.3% are minority students.
Among low-income first generation Colorado residents, receipt of CTC support corresponds with 2nd and 3rd fall
persistence rates that are similar to or greater than their middle-income and high-income peers.
o Low-income first generation Colorado residents who do not receive CTC support persist to both 2nd and
3rd fall at rates that are about 8 PP lower than similar students who do receive CTC support.
o These results reflecting the effectiveness of CTC support for low-income students are similar to findings
from prior iterations of this study.
2
Longitudinal Trends Throughout this report, students are categorized into groups based on their income and EFC. Broadly speaking,
freshmen can be categorized into one of four groups:
CTC income eligible includes all students who have an EFC and adjusted gross income (AGI) that renders them
eligible for CTC award (full or half), and also includes ASSET students regardless of whether they have an EFC or AGI
on record. Not all students in this group received the CTC for a variety of reasons, including nonresident status,
residents with need met by other grants/scholarships or veteran’s benefits, and students who did not meet other
financial aid deadlines or verification criteria.
Middle income includes students that are above CTC income eligibility but could be eligible for some types of need-
based aid (EFC between $15,000 and $55,000).
Upper income includes students who are generally not eligible for need based aid (EFC > $55,000).
Non-filers includes students who did not file a FAFSA. The income level for non-filers is unknown; however, without
completing the FAFSA these students are not eligible for need based aid.
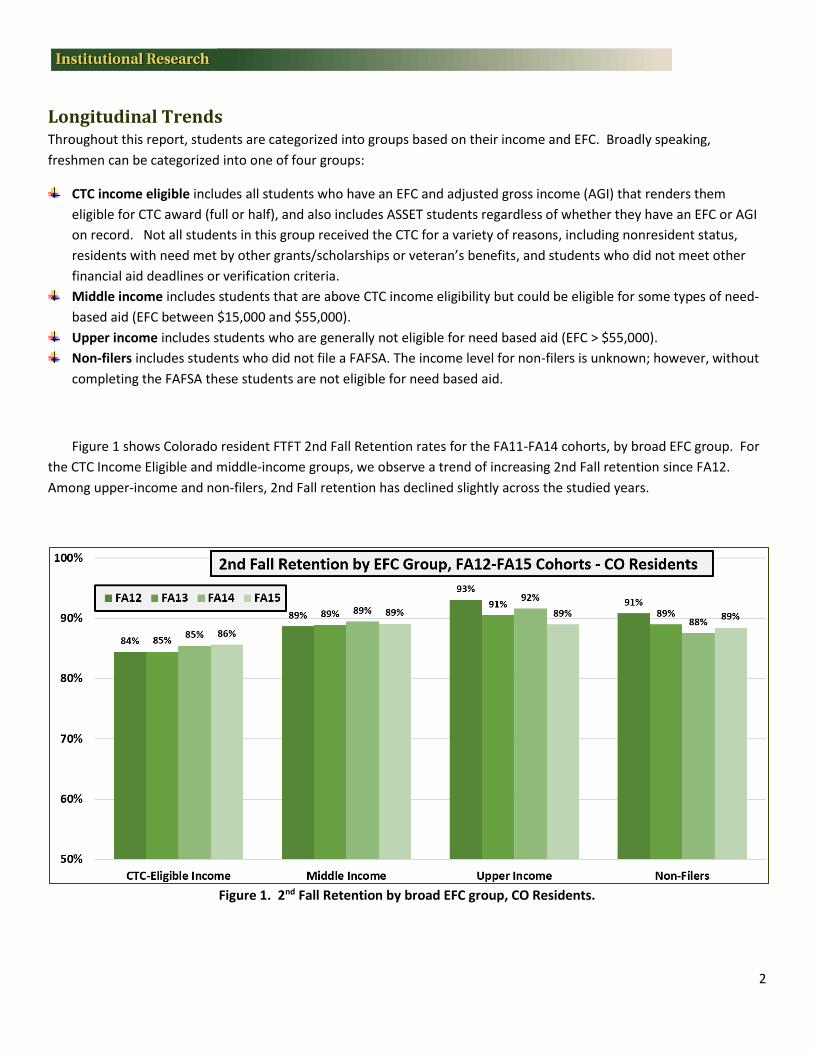
Figure 1 shows Colorado resident FTFT 2nd Fall Retention rates for the FA11-FA14 cohorts, by broad EFC group. For
the CTC Income Eligible and middle-income groups, we observe a trend of increasing 2nd Fall retention since FA12.
Among upper-income and non-filers, 2nd Fall retention has declined slightly across the studied years.
Figure 1. 2nd Fall Retention by broad EFC group, CO Residents.
3
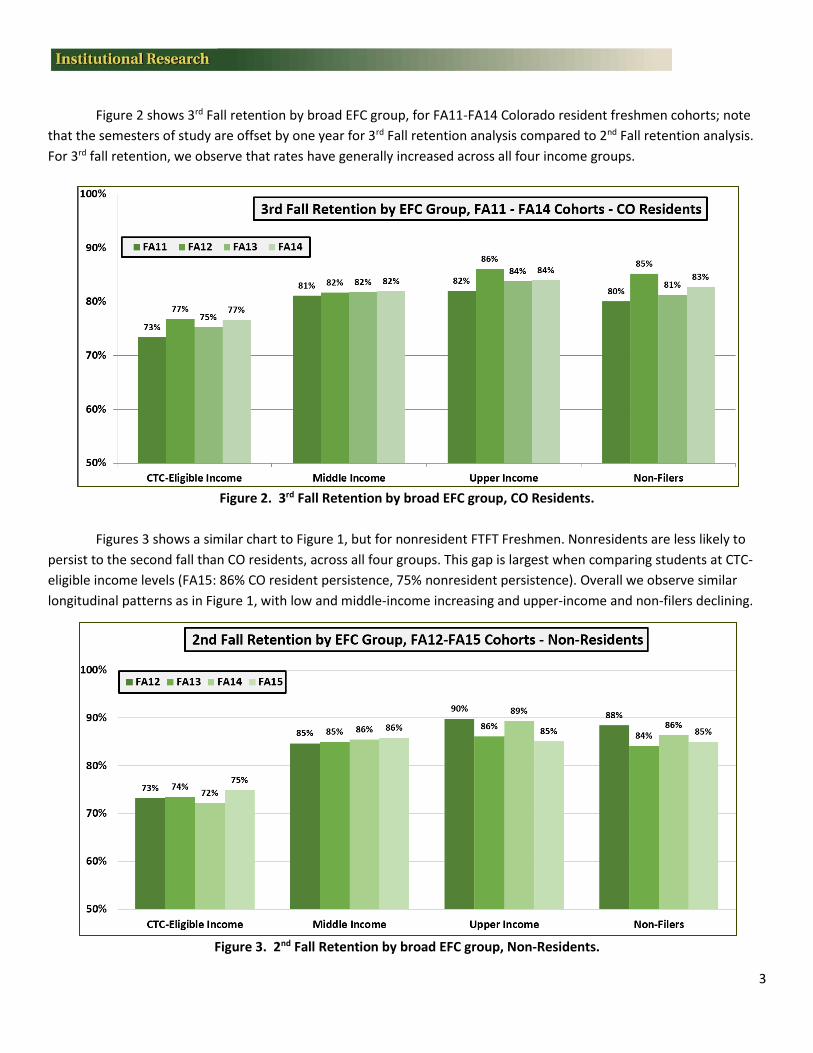
Figure 2 shows 3rd Fall retention by broad EFC group, for FA11-FA14 Colorado resident freshmen cohorts; note
that the semesters of study are offset by one year for 3rd Fall retention analysis compared to 2nd Fall retention analysis.
For 3rd fall retention, we observe that rates have generally increased across all four income groups.
Figure 2. 3rd Fall Retention by broad EFC group, CO Residents.
Figures 3 shows a similar chart to Figure 1, but for nonresident FTFT Freshmen. Nonresidents are less likely to
persist to the second fall than CO residents, across all four groups. This gap is largest when comparing students at CTC-
eligible income levels (FA15: 86% CO resident persistence, 75% nonresident persistence). Overall we observe similar
longitudinal patterns as in Figure 1, with low and middle-income increasing and upper-income and non-filers declining.
Figure 3. 2nd Fall Retention by broad EFC group, Non-Residents.

4
Figure 4 displays 3rd Fall retention by EFC group data for nonresidents. Again there are substantial differences
between 3rd Fall retention for residents and nonresidents, particularly at CTC-eligible income levels (FA14: CO residents
77%, nonresidents 63%). For this measure we observe increases over time in middle-income rates and decreases among
non-filer and CTC-eligible income level nonresidents. It is noteworthy that for the last two cohorts (FA13 and FA14)
nonresident middle-income FAFSA filers (EFC $15k-$55k) exhibit higher 3rd fall retention rates than non-filers.
Figure 4. 3rd Fall Retention by broad EFC group, Non-Residents.
Income Distribution by Cohort Observing the distribution of students at various EFC levels is important for assessing the impact of low and middle
income students’ retention on the overall population, and for assessing changes in income distribution over time. Figure
5 displays income distribution among FTFT Colorado residents, with the low income “CTC Income Eligible” group split
into students who did, and did not, receive CTC support.
Figure 5. Income Distribution by Cohort and broad EFC Group, CO Residents
5
Overall, in Figure 5 we observe subtle changes in the proportion of Colorado resident freshmen falling into each
EFC group over time. The proportion of non-filers has dropped slightly from 17% to 13%, while the proportion of upper-
income filers has increased from 8% to 13%. Middle and low-income group rates have remained relatively steady across
the FA12-FA15 time frame.
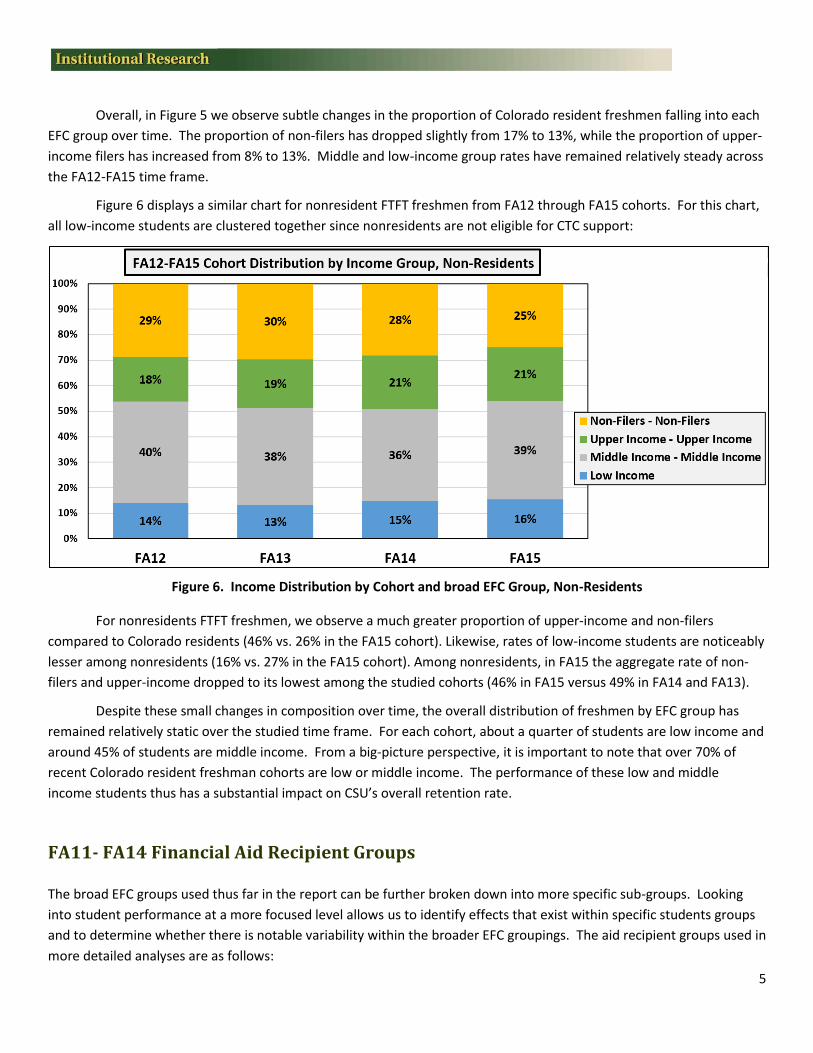
Figure 6 displays a similar chart for nonresident FTFT freshmen from FA12 through FA15 cohorts. For this chart,
all low-income students are clustered together since nonresidents are not eligible for CTC support:
Figure 6. Income Distribution by Cohort and broad EFC Group, Non-Residents
For nonresidents FTFT freshmen, we observe a much greater proportion of upper-income and non-filers
compared to Colorado residents (46% vs. 26% in the FA15 cohort). Likewise, rates of low-income students are noticeably
lesser among nonresidents (16% vs. 27% in the FA15 cohort). Among nonresidents, in FA15 the aggregate rate of non-
filers and upper-income dropped to its lowest among the studied cohorts (46% in FA15 versus 49% in FA14 and FA13).
Despite these small changes in composition over time, the overall distribution of freshmen by EFC group has
remained relatively static over the studied time frame. For each cohort, about a quarter of students are low income and
around 45% of students are middle income. From a big-picture perspective, it is important to note that over 70% of
recent Colorado resident freshman cohorts are low or middle income. The performance of these low and middle
income students thus has a substantial impact on CSU’s overall retention rate.
FA11- FA14 Financial Aid Recipient Groups
The broad EFC groups used thus far in the report can be further broken down into more specific sub-groups. Looking
into student performance at a more focused level allows us to identify effects that exist within specific students groups
and to determine whether there is notable variability within the broader EFC groupings. The aid recipient groups used in
more detailed analyses are as follows:
6
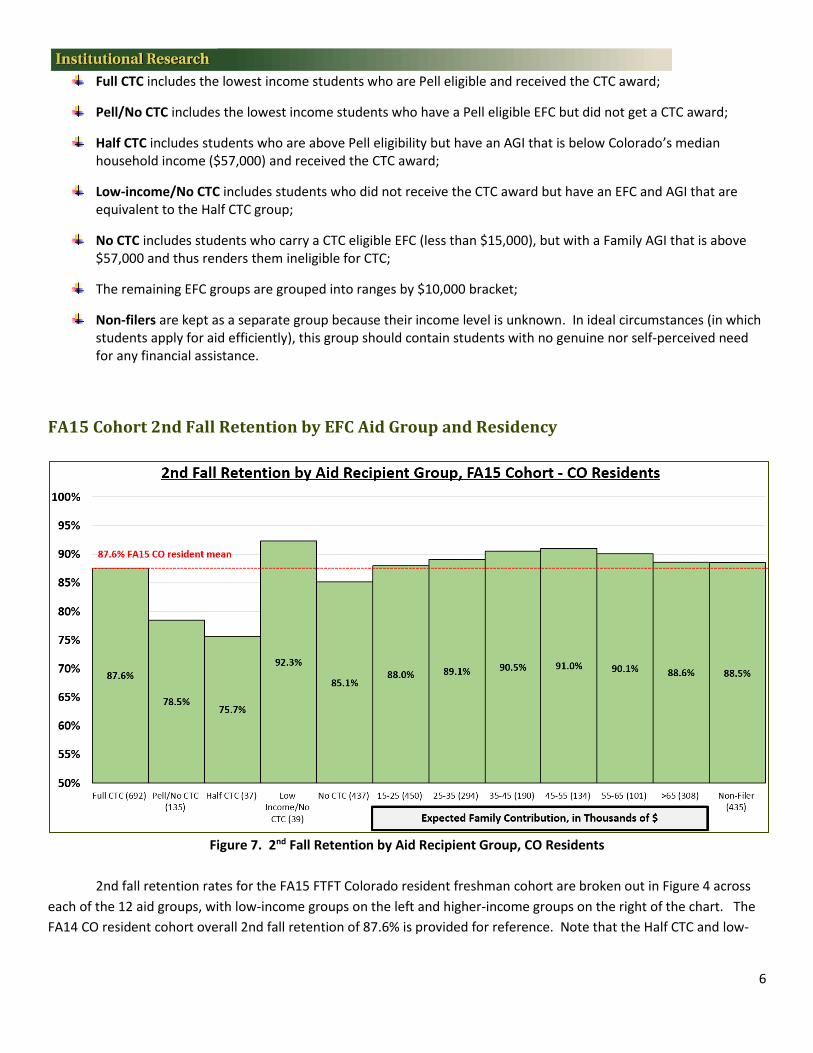
Full CTC includes the lowest income students who are Pell eligible and received the CTC award;
Pell/No CTC includes the lowest income students who have a Pell eligible EFC but did not get a CTC award;
Half CTC includes students who are above Pell eligibility but have an AGI that is below Colorado’s median household income ($57,000) and received the CTC award;
Low-income/No CTC includes students who did not receive the CTC award but have an EFC and AGI that are equivalent to the Half CTC group;
No CTC includes students who carry a CTC eligible EFC (less than $15,000), but with a Family AGI that is above $57,000 and thus renders them ineligible for CTC;
The remaining EFC groups are grouped into ranges by $10,000 bracket;
Non-filers are kept as a separate group because their income level is unknown. In ideal circumstances (in which students apply for aid efficiently), this group should contain students with no genuine nor self-perceived need for any financial assistance.
FA15 Cohort 2nd Fall Retention by EFC Aid Group and Residency
Figure 7. 2nd Fall Retention by Aid Recipient Group, CO Residents
2nd fall retention rates for the FA15 FTFT Colorado resident freshman cohort are broken out in Figure 4 across
each of the 12 aid groups, with low-income groups on the left and higher-income groups on the right of the chart. The
FA14 CO resident cohort overall 2nd fall retention of 87.6% is provided for reference. Note that the Half CTC and low-

7
income/No CTC groups represent a very small N in this and later analyses, and any effects observed for those groups
should be interpreted with extreme caution.
Overall, FA15 Full CTC students retain to the 2nd Fall at a rate that is identical to the CO resident average; by
contrast, the two larger sample size non-CTC low-EFC groups (Pell/No CTC, No CTC) both show substantial gaps in 2nd Fall
retention compared to the average CO resident freshman. For students in the middle income groups ($15k to $55k), we
observe that students at the lower middle-income bounds perform close to the mean while the remaining middle-
income students perform about one to four percentage points above the mean value. It may be surprising that non-
filers display 2nd Fall retention that is only slightly above the cohort mean, and substantially less than the middle-to-high
EFC groups. This finding suggests that a proportion of students in the non-filer group would likely benefit from filing for
financial aid.
Figure 8 displays a similar chart for FA15 nonresident FTFT freshmen. Given the lack of CTC support for
nonresidents, all low-income students are presented in a single bar.
Figure 8. 2nd Fall Retention by Aid Recipient Group, Non-Residents
For nonresidents, FTFT freshman at middle-income, High Income, and non-filer levels retain to 2nd Fall at similar
rates, with a less-than-two percentage point spread from the lowest (>65k, 84.9%) and the highest (15k-25k, 86.8%).
These group values are all lower but within a few percentage points of the FA15 CO resident average retention rate of
87.6%. On the other hand, low-income nonresident freshman retain to the 2nd Fall at very low rates (74.9%); this rate is
slightly lower than the 2nd Fall retention rates observed for the CO resident Pell/No CTC and Half CTC groups in Figure 7.
8
FA14 Cohort 3rd Fall Retention by EFC Aid Group and Residency
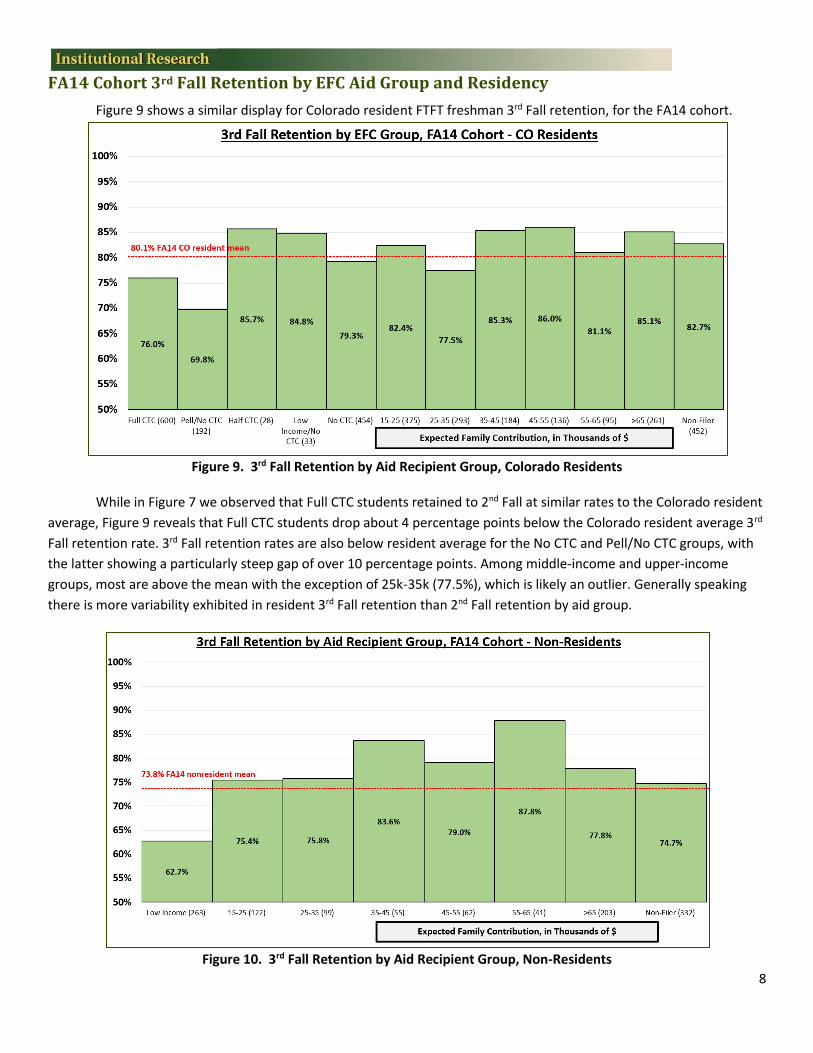
Figure 9 shows a similar display for Colorado resident FTFT freshman 3rd Fall retention, for the FA14 cohort.
Figure 9. 3rd Fall Retention by Aid Recipient Group, Colorado Residents
While in Figure 7 we observed that Full CTC students retained to 2nd Fall at similar rates to the Colorado resident
average, Figure 9 reveals that Full CTC students drop about 4 percentage points below the Colorado resident average 3rd
Fall retention rate. 3rd Fall retention rates are also below resident average for the No CTC and Pell/No CTC groups, with
the latter showing a particularly steep gap of over 10 percentage points. Among middle-income and upper-income
groups, most are above the mean with the exception of 25k-35k (77.5%), which is likely an outlier. Generally speaking
there is more variability exhibited in resident 3rd Fall retention than 2nd Fall retention by aid group.
Figure 10. 3rd Fall Retention by Aid Recipient Group, Non-Residents

9
For nonresident 3rd Fall retention (Figure 10) we observe a large gap (11.1 PP) between low-income retention
rate and the nonresident mean rate; this gap echoes the 10 PP gap between the resident Pell/No CTC group and the
resident average in Figure 9. Clearly this group of nonresident low-income students, whose sample size of 263 in the
FA14 cohort is substantial, face difficult financial challenges to successful persistence at CSU when compared to all other
FTFT freshmen. All other groups across middle, upper, and non-filer income levels show persistence that is slightly-to-
well above the nonresident mean of 73.8%. It may be of interest that nonresident non-filers persist at rates that are
lower than all comparable middle and upper income aid filer groups.
Recent Changes in Retention by EFC Aid Group, Colorado Residents This portion of the analysis seeks to evaluate whether there have been by-aid recipient group changes in 2nd Fall and 3rd
Fall retention for the most recently studied cohorts. Figure 11 below displays the percentage point change in 2nd Fall
retention rate for the CO resident FA15 cohort compared to the overall retention rates for the FA11-FA14 cohorts.
Figure 11. Change in 2nd Fall Retention by EFC Aid Group, FA14 vs. FA11-FA13 – CO Residents
Before assessing changes observed in Figure 6, note that the Half CTC group includes only 28 students and the
low-income/No CTC group includes just 37 students in FA15 and thus the apparently large changes in observed retention
are unlikely to be meaningful. This chart provides insight into which specific aid groups have seen recent relative
advantages in retention, possibly as a result in global changes to the structural relationship between EFC and retention
or as a result of change in CSU aid policies.
Overall, we observe that each of the low-EFC groups with N over 50, including the Full CTC group, has shown
improved 2nd Fall retention in FA15 relative to FA11-FA14. This finding matches observed improvements in retention for
the FA14 Low-EFC groups compared to FA11-FA13 in the most recent prior version of this analysis. This observation
suggests that recent changes in aid policy have improved short-term retention among the highest need students.
For the FA15 $15-$25k through $35k-$45k EFC ranges we observe slight retention improvements compared to
prior years, while for all EFC levels above $45k we observe decrements in FA15 retention compared to previous cohorts.

10
The decrement in 2nd Fall retention among non-filers is small but has now been observed in consecutive reports; these
two year-over-year decreases in non-filer retention suggest that either more aid-needy students are failing to file,
retention rates are dropping among students from the most wealthy families, or a combination of both.
Figure 12 shows a similar analysis comparing Colorado resident 3rd Fall retention rates for the most recently-
assessable FA14 cohort versus the FA11-FA13 cohorts. Once again, the Half CTC and low-income/No CTC groups each
represent a small N of students and thus single-year variation must be interpreted with extreme caution.
Figure 12. Change in 3rd Fall Retention by EFC Aid Group, FA13 vs. FA10-FA12 – CO Residents
We observe that Colorado resident 3rd Fall retention has increased in the most recent cohort for all Lower
Income (<15k EFC) aid groups, including those who receive limited or no CTC support. The increase for the FA14 Full CTC
group is modest (+0.2 PP) compared to the increase observed for the FA13 Full CTC group compared to prior cohorts
(+2.5 PP). Among middle-income and High Income aid filers, 4 out of 6 EFC groups show positive 3rd Fall retention
compared to past cohorts, although the 25k-35k band and 55k-65k band each show substantial decrements in 3rd Fall
retention compared to prior cohorts. Decrements were also present for these two groups only in the previous version of
this report, although the size of the PP gaps have increased substantially compared to the less than 1.0 PP gaps observed
in the FA13 3rd fall retention comparative analysis.
First Generation Student Retention by EFC Group, CO Residents
First generation students are among the most at-risk students for attrition, at each level of prior student
achievement and financial characteristics. This sub-analysis investigates 2nd and 3rd Fall retention rates for First
Generation students across EFC and Financial Aid groupings. Figure 13 displays 2nd Fall retention for FA15 CO resident
first generation cohort students, grouped by broad EFC range for sample size reasons.

11
Figure 13. FA15 First Generation 2nd Fall Retention, Colorado Residents
Among FA15 first generation Colorado freshmen, 2nd fall retention is roughly similar for CTC recipients, middle-
income students, and the small sample size upper-income and non-filer groups. The one group that lags substantially are
low-income (EFC <$15k) students who receive no CTC support; these students retain at rates that are 6.6 PP lower than
the FA15 CO first generation mean of 84.8% 2nd Fall retention.
Figure 14 is a similar display detailing FA14 first generation Colorado student retention to 3rd Fall.
Figure 14. FA14 First Generation 3rd Fall Retention, Colorado Residents
Figure 14 paints a slightly different story of 3rd Fall retention among Colorado first generation freshmen, at least
among the FA14 cohort. For this cohort 3rd Fall retention rates are very close to the CO first generation mean for middle-
income and non-filers, while middle-income is 3 PP lower than the group mean (though note the sample size of only 26).
Meanwhile, CTC recipients perform substantially above the mean (+4.1 PP) while low-income non-CTC recipients retain
at rates substantially below the mean (-4.6 PP). This analysis provides evidence that support like that provided by the

12
CTC program is critical for first generation student persistence to 3rd Fall, to the extent that CTC recipients persist to 3rd
Fall at higher rates than fellow CO first generation students who come from affluent families.
Figures 15 and 16 replicate this analysis for nonresident first generation students. Note that nonresident sample
sizes are very small enough among these broad EFC groupings:
Figure 15. FA15 First Generation 2nd Fall Retention by EFC Group, Nonresidents
Figure 16. FA14 First Generation 3rd Fall Retention by EFC group, Nonresidents
For 2nd Fall retention (Figure 15) FA15 nonresident first generation students exhibit a positive and roughly linear
relationship between broad EFC group and retention. As with the wider nonresident population, low-income first
generation students retain to both 2nd fall and 3rd fall at particularly low rates (71.1% and 54.1%, respectively). Retention
rates to 3rd Fall (Figure 16) also appear to be remarkably low for the upper-income (50.0%) and non-filer (60.5%) groups,
although these groups (plus middle-income) have very low population sizes < 50. Overall, 3rd Fall retention for FA14
nonresident first generation students comes in at a very low 58.7% rate collapsed cross all EFC ranges.
13
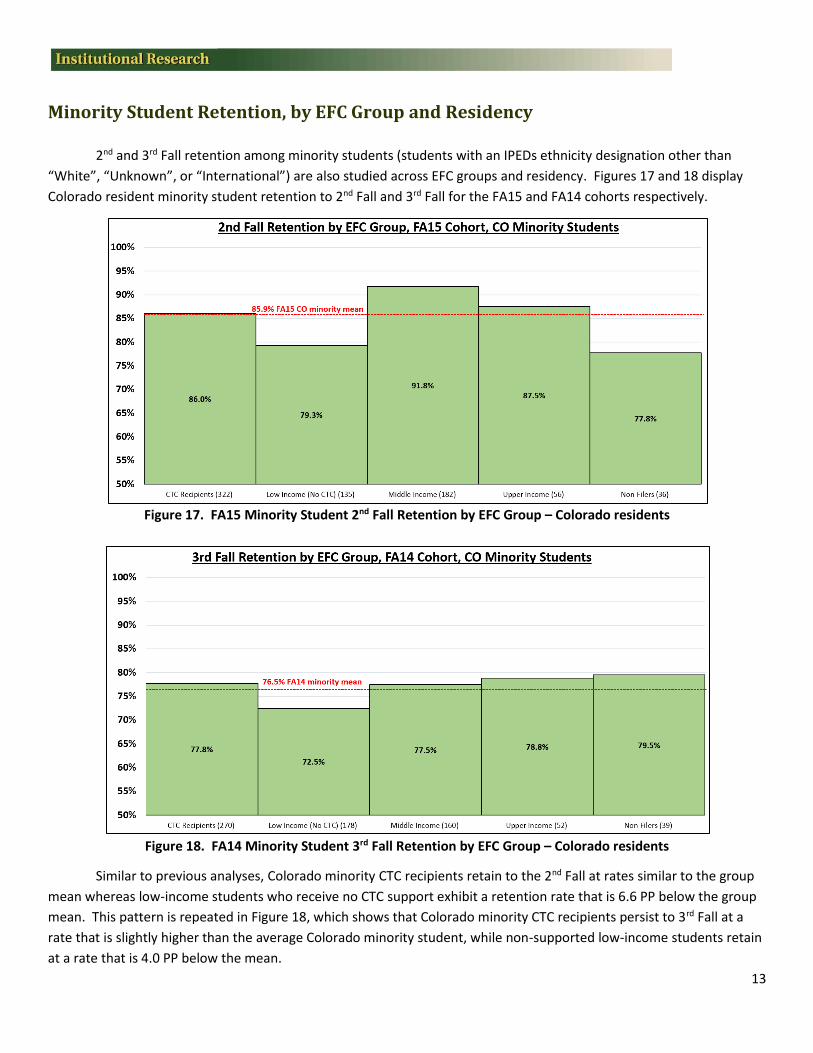
Minority Student Retention, by EFC Group and Residency
2nd and 3rd Fall retention among minority students (students with an IPEDs ethnicity designation other than
“White”, “Unknown”, or “International”) are also studied across EFC groups and residency. Figures 17 and 18 display
Colorado resident minority student retention to 2nd Fall and 3rd Fall for the FA15 and FA14 cohorts respectively.
Figure 17. FA15 Minority Student 2nd Fall Retention by EFC Group – Colorado residents
Figure 18. FA14 Minority Student 3rd Fall Retention by EFC Group – Colorado residents
Similar to previous analyses, Colorado minority CTC recipients retain to the 2nd Fall at rates similar to the group
mean whereas low-income students who receive no CTC support exhibit a retention rate that is 6.6 PP below the group
mean. This pattern is repeated in Figure 18, which shows that Colorado minority CTC recipients persist to 3rd Fall at a
rate that is slightly higher than the average Colorado minority student, while non-supported low-income students retain
at a rate that is 4.0 PP below the mean.
14
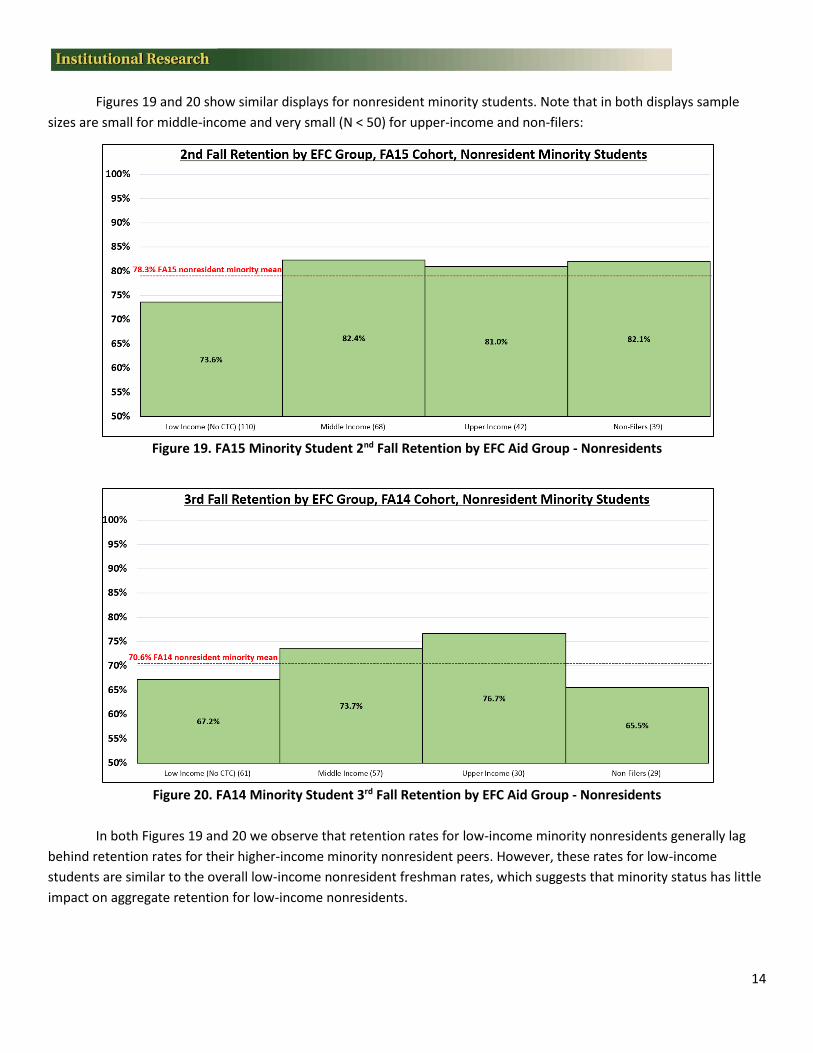
Figures 19 and 20 show similar displays for nonresident minority students. Note that in both displays sample
sizes are small for middle-income and very small (N < 50) for upper-income and non-filers:
Figure 19. FA15 Minority Student 2nd Fall Retention by EFC Aid Group - Nonresidents
Figure 20. FA14 Minority Student 3rd Fall Retention by EFC Aid Group - Nonresidents
In both Figures 19 and 20 we observe that retention rates for low-income minority nonresidents generally lag
behind retention rates for their higher-income minority nonresident peers. However, these rates for low-income
students are similar to the overall low-income nonresident freshman rates, which suggests that minority status has little
impact on aggregate retention for low-income nonresidents.

15
Conclusions
Household capacity to pay, as measured by EFC, is positively association with both 2nd Fall and 3rd Fall retention.
Students from lower income families persist at a lower rate compared to students from higher income families.
However, receipt of CTC is associated with a substantial increase in retention for students at eligible incomes. Across the
Colorado resident analyses conducted in this report, 2nd and 3rd Fall retention rates are around 5 to 9 percentage points
higher for low-income students who received CTC support compared to low-income students who received no CTC
award. These effects of CTC receipt hold when studying either the overall cohort or when isolating First Generation and
minority subpopulations.
For nonresidents, who are not supported by CTC, each 2nd Fall and 3rd Fall analysis demonstrates that low-
income students retain at rates that are substantially lower than their higher-income peers. Retention is particularly low
for first generation nonresidents, who persisted to 3rd fall at just a 58.7% rate in the FA14 cohort.
Overall, the proportion of students who fall into the broad low, middle, and high income groups has remained
relatively constant since FA12. Nonresident freshmen tend belong to the higher income groups (High Income and non-
filers) at greater rates than Colorado resident freshmen. Just under 75% of the FA15 Colorado resident FTFT freshmen
cohort falls into the low income or middle income groups, which highlights the continued importance of optimizing
student aid policies to enhance retention among these groups and thus enhance CSU’s overall retention performance.