retention of 2006-07 freshmen cohort prepared by institutional research november 2007
TRANSCRIPT
RETENTION OF 2006-07
FRESHMEN COHORT
Prepared byInstitutional Research
November 2007
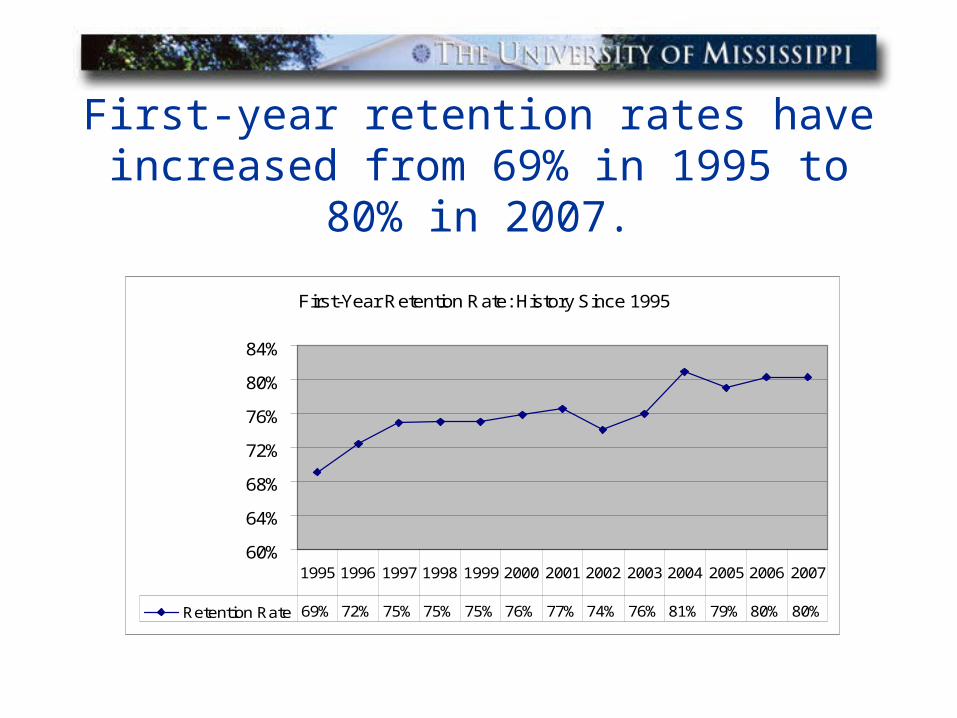
First-year retention rates have increased from 69% in 1995 to 80%
in 2007.
First-Year Retention Rate: History Since 1995
60%
64%
68%
72%
76%
80%
84%
Retention Rate 69% 72% 75% 75% 75% 76% 77% 74% 76% 81% 79% 80% 80%
1995 1996 1997 1998 1999 2000 2001 2002 2003 2004 2005 2006 2007
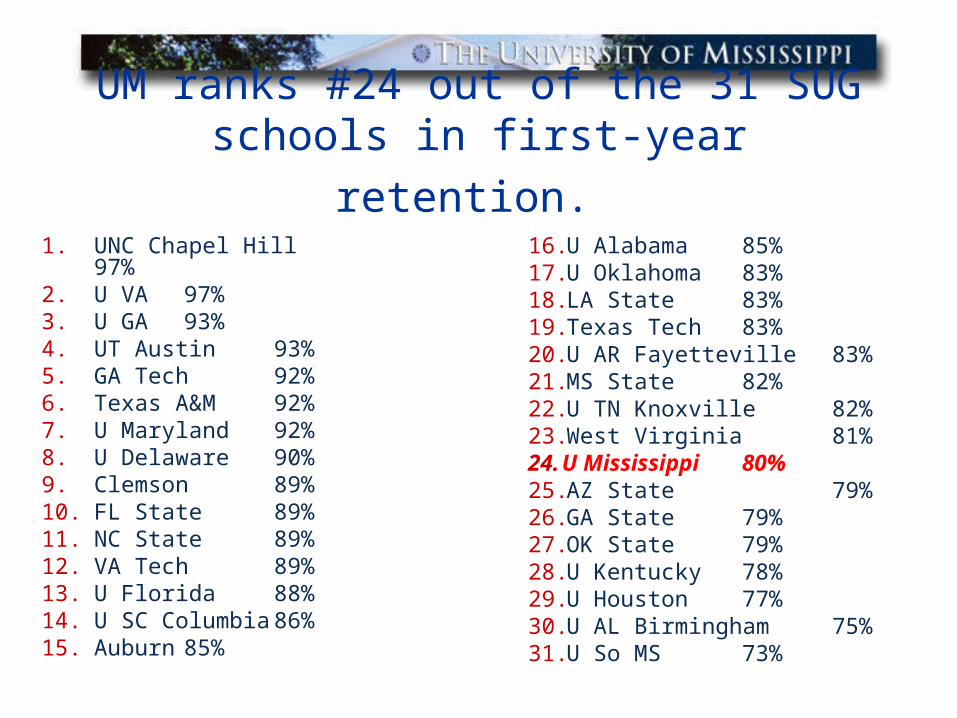
UM ranks #24 out of the 31 SUG schools in first-year retention.
1. UNC Chapel Hill 97%2. U VA 97%3. U GA 93%4. UT Austin 93%5. GA Tech 92%6. Texas A&M 92%7. U Maryland 92%8. U Delaware 90%9. Clemson 89%10. FL State 89%11. NC State 89%12. VA Tech 89%13. U Florida 88%14. U SC Columbia 86%15. Auburn 85%
16. U Alabama 85%17. U Oklahoma 83%18. LA State 83%19. Texas Tech 83%20. U AR Fayetteville 83%21. MS State 82%22. U TN Knoxville 82%23. West Virginia 81%24. U Mississippi 80%25. AZ State 79%26. GA State 79%27. OK State 79%28. U Kentucky 78%29. U Houston 77%30. U AL Birmingham 75%31. U So MS 73%
Five-Year Goal: Increase Retention to 85% by 2012
Goal is to increase retention by 1% per year for next five years
For the 2007-08 freshman class of 2,473:• A 1% increase is 25 students• Increase retention from 80% (1,944) to 81% (2,003)
STUDENTCHARACTERISTIC
S
RETENTION OF 2006-07 FRESHMEN COHORT
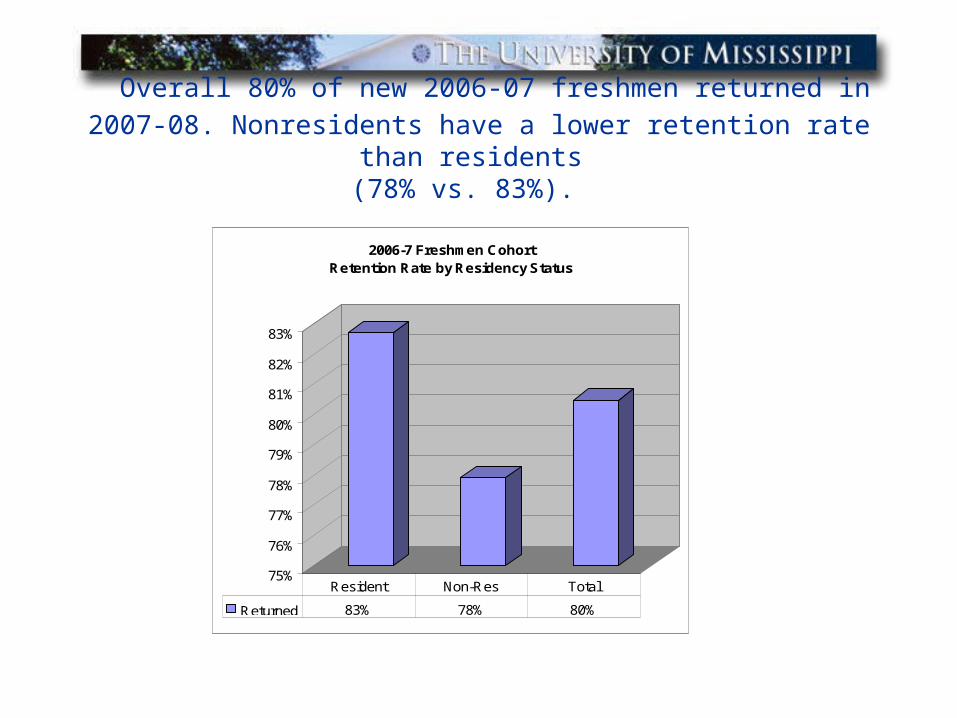
Overall 80% of new 2006-07 freshmen returned in 2007-08. Nonresidents have a lower retention rate than
residents (78% vs. 83%).
75%
76%
77%
78%
79%
80%
81%
82%
83%
2006-7 Freshmen CohortRetention Rate by Residency Status
Returned 83% 78% 80%
Resident Non-Res Total
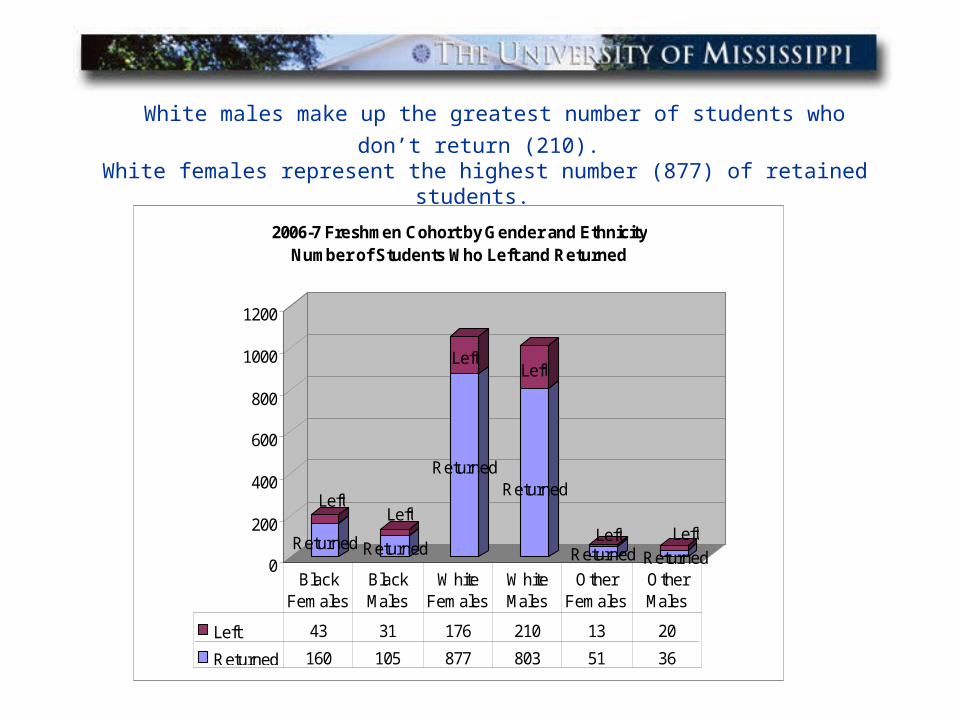
White males make up the greatest number of students who don’t return
(210). White females represent the highest number (877) of retained students.
Returned
Left
Returned
Left
Returned
Left
Returned
Left
ReturnedLeft
Returned
Left
0
200
400
600
800
1000
1200
2006-7 Freshmen Cohort by Gender and EthnicityNumber of Students Who Left and Returned
Left 43 31 176 210 13 20
Returned 160 105 877 803 51 36
Black Females
Black Males
White Females
White Males
Other Females
Other Males
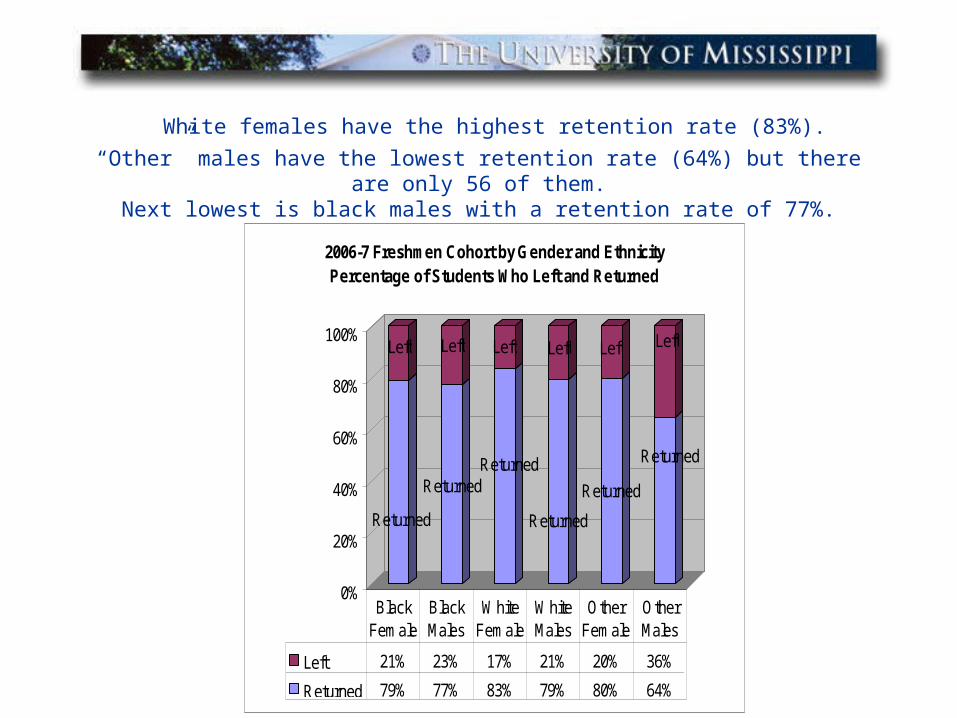
White females have the highest retention rate (83%).
“Other” males have the lowest retention rate (64%) but there are only 56 of them.
Next lowest is black males with a retention rate of 77%.
Returned
Left
Returned
Left
Returned
Left
Returned
Left
Returned
Left
Returned
Left
0%
20%
40%
60%
80%
100%
2006-7 Freshmen Cohort by Gender and EthnicityPercentage of Students Who Left and Returned
Left 21% 23% 17% 21% 20% 36%
Returned 79% 77% 83% 79% 80% 64%
Black Female
Black Males
White Female
White Males
Other Female
Other Males
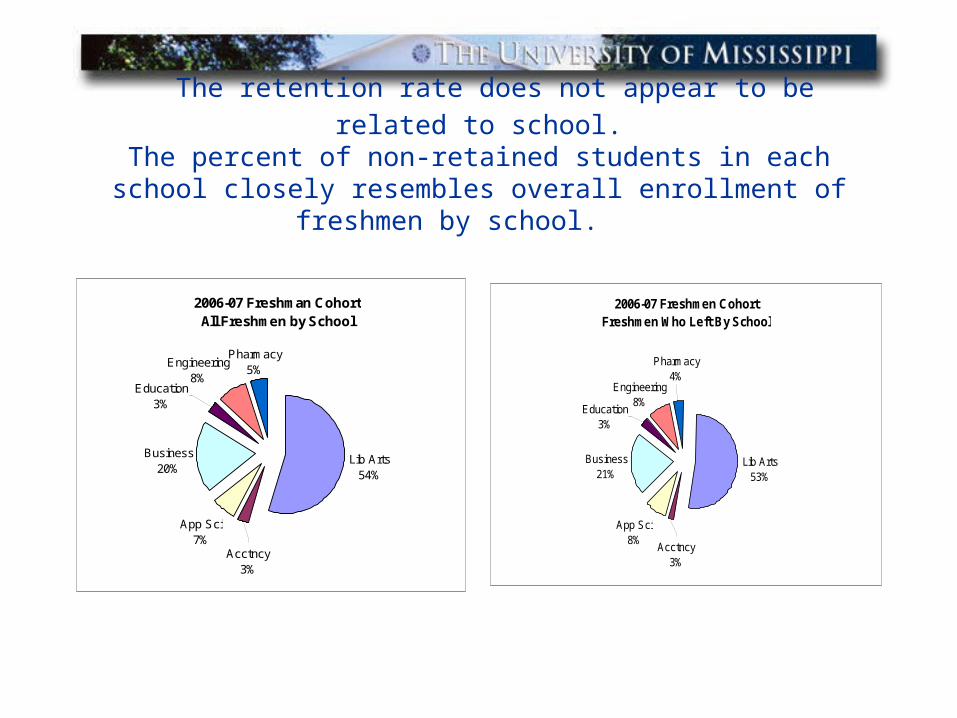
The retention rate does not appear to be related to school.
The percent of non-retained students in each school closely resembles overall enrollment of freshmen by
school.
2006-07 Freshman Cohort All Freshmen by School
Lib Arts54%
App Sci7%
Business20%
Acctncy3%
Pharmacy5%
Engineering8%
Education3%
2006-07 Freshmen CohortFreshmen Who Left By School
Lib Arts53%
App Sci8%
Business21%
Pharmacy4%
Acctncy3%
Engineering8%
Education3%

Greek Status appears to be an important factor in retention.
The percentage of Greek students who left (13%) is less than half than the percent of Independent students who
left (28%).
Returned
Left
Returned
Left
Returned
Left
0
500
1000
1500
2000
2500
2006-7 Freshman Cohort Greek vs. Independent Status
Returned 1215 817 2032
Left 181 312 493
Greek Independent Total0%
5%
10%
15%
20%
25%
30%
2006-7 Freshmen CohortGreek vs. Independent Status
Left 13% 28% 20%
Greek Independent Total
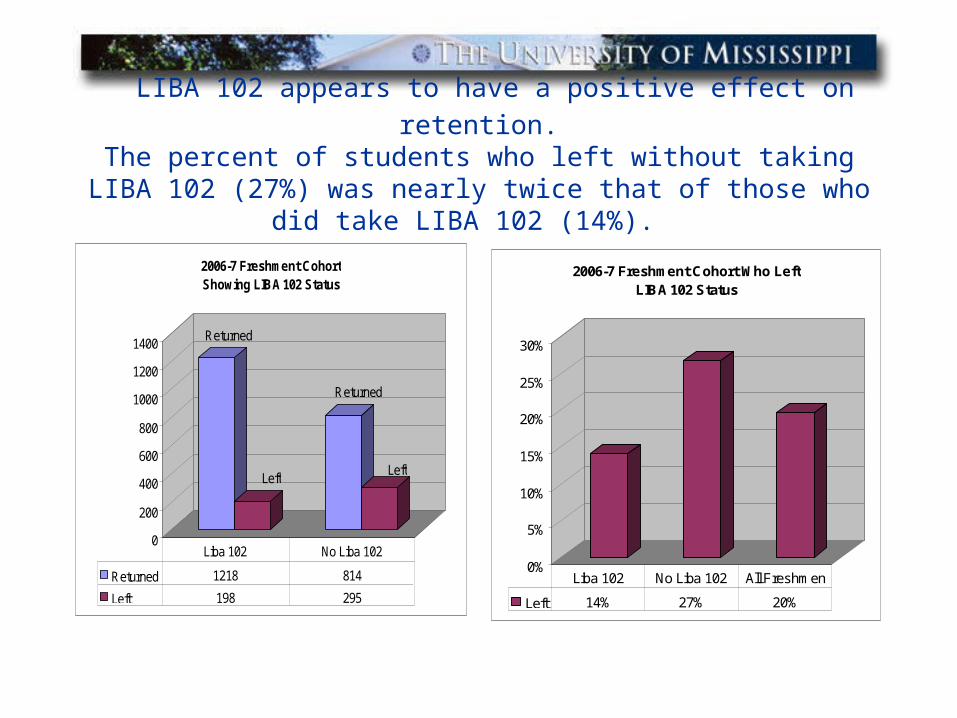
LIBA 102 appears to have a positive effect on retention.The percent of students who left without taking LIBA 102 (27%) was nearly twice that of those who did take LIBA
102 (14%).
Returned
Left
Returned
Left
0
200
400
600
800
1000
1200
1400
2006-7 Freshment CohortShowing LIBA 102 Status
Returned 1218 814
Left 198 295
Liba 102 No Liba 1020%
5%
10%
15%
20%
25%
30%
2006-7 Freshment Cohort Who LeftLIBA 102 Status
Left 14% 27% 20%
Liba 102 No Liba 102 All Freshmen
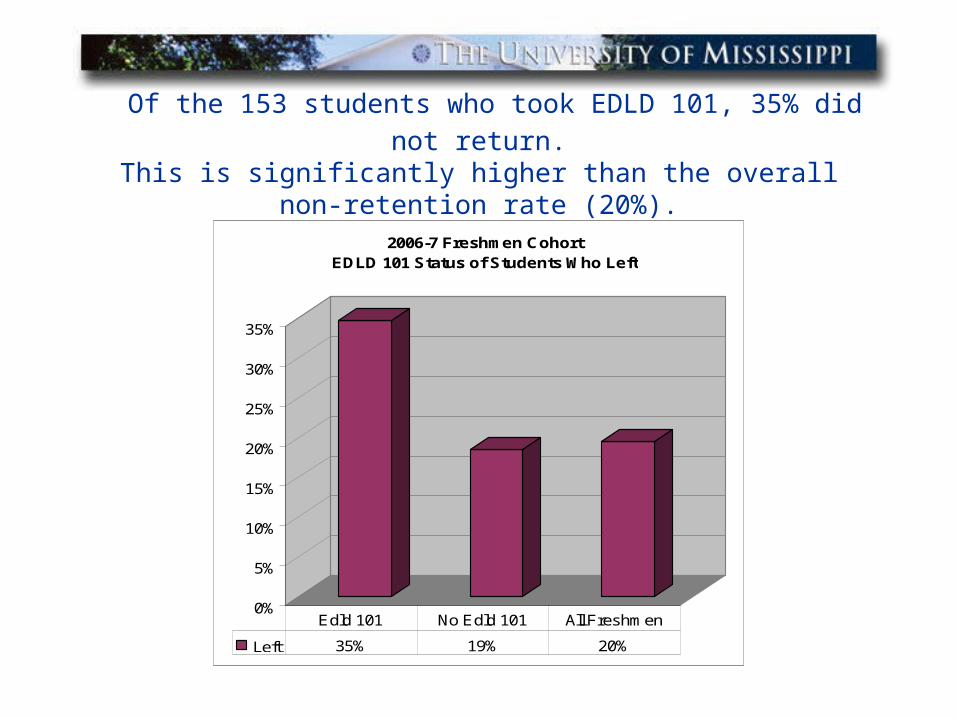
Of the 153 students who took EDLD 101, 35% did not return.
This is significantly higher than the overall non-retention rate (20%).
0%
5%
10%
15%
20%
25%
30%
35%
2006-7 Freshmen CohortEDLD 101 Status of Students Who Left
Left 35% 19% 20%
Edld 101 No Edld 101 All Freshmen
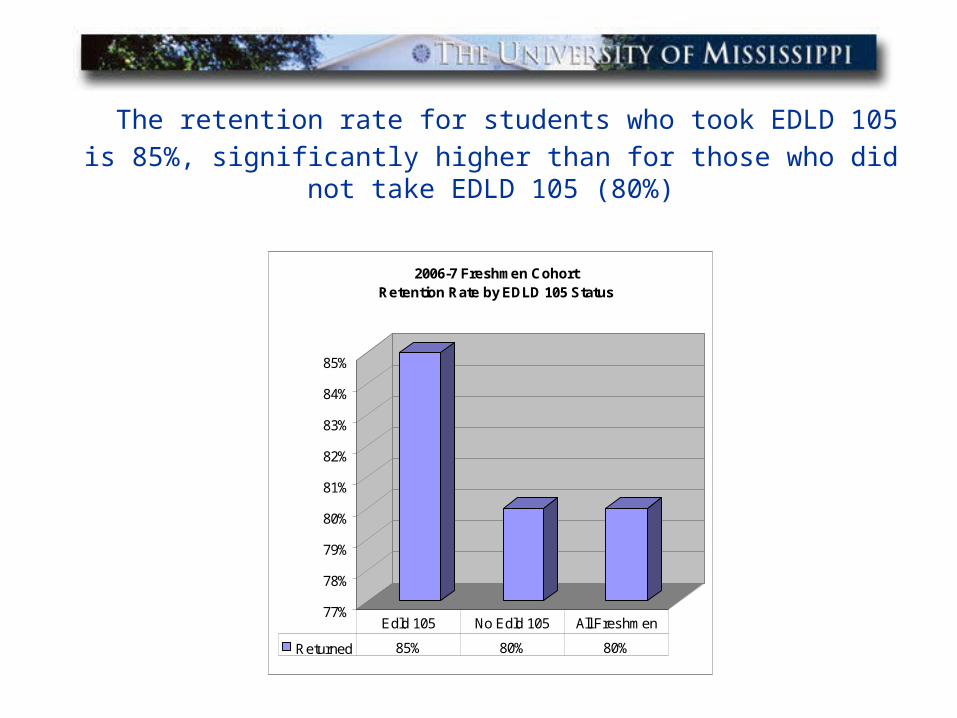
The retention rate for students who took EDLD 105 is 85%, significantly higher than for those who did not take EDLD
105 (80%)
77%
78%
79%
80%
81%
82%
83%
84%
85%
2006-7 Freshmen CohortRetention Rate by EDLD 105 Status
Returned 85% 80% 80%
Edld 105 No Edld 105 All Freshmen
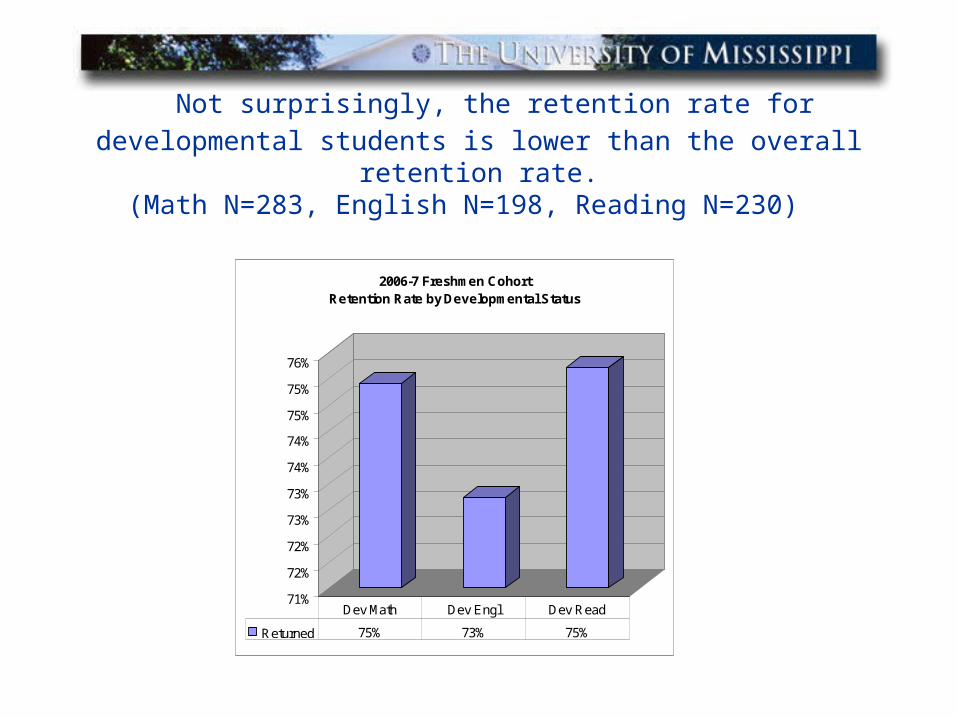
Not surprisingly, the retention rate for developmental students is lower than the overall retention rate.(Math N=283, English N=198, Reading N=230)
71%
72%
72%
73%
73%
74%
74%
75%
75%
76%
2006-7 Freshmen CohortRetention Rate by Developmental Status
Returned 75% 73% 75%
Dev Math Dev Engl Dev Read
RETENTION BY ACT, GPA’S
RETENTION OF 2006-07 FRESHMEN
COHORT
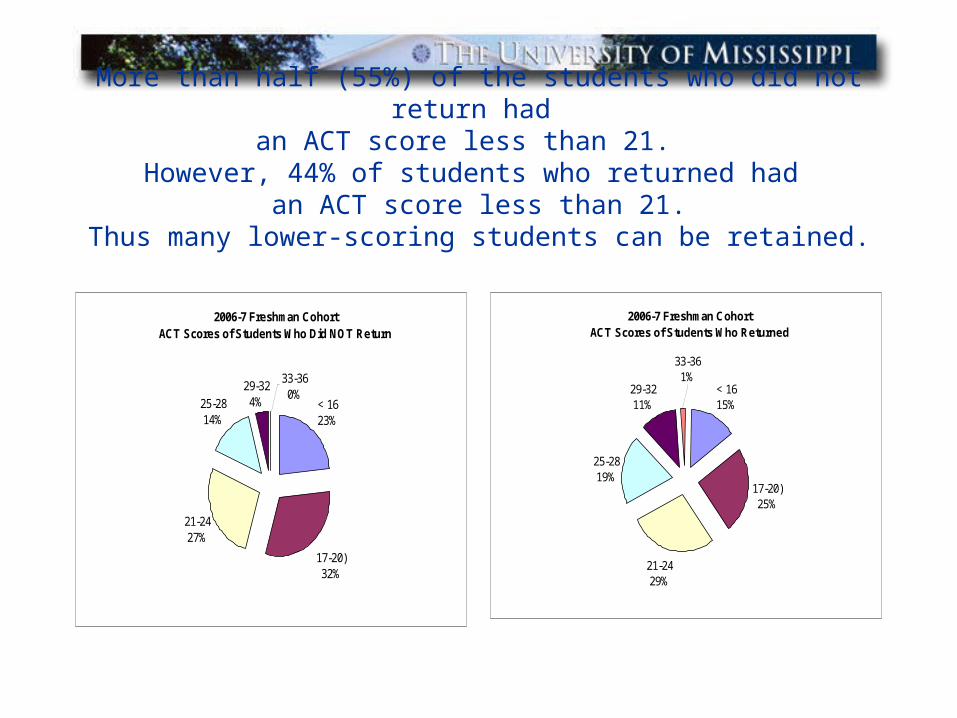
More than half (55%) of the students who did not return had
an ACT score less than 21. However, 44% of students who returned had
an ACT score less than 21.Thus many lower-scoring students can be retained.
2006-7 Freshman Cohort ACT Scores of Students Who Did NOT Return
< 1623%
17-20)32%
21-2427%
25-2814%
29-324%
33-360%
2006-7 Freshman Cohort ACT Scores of Students Who Returned
< 1615%
17-20)25%
21-2429%
25-2819%
29-3211%
33-361%
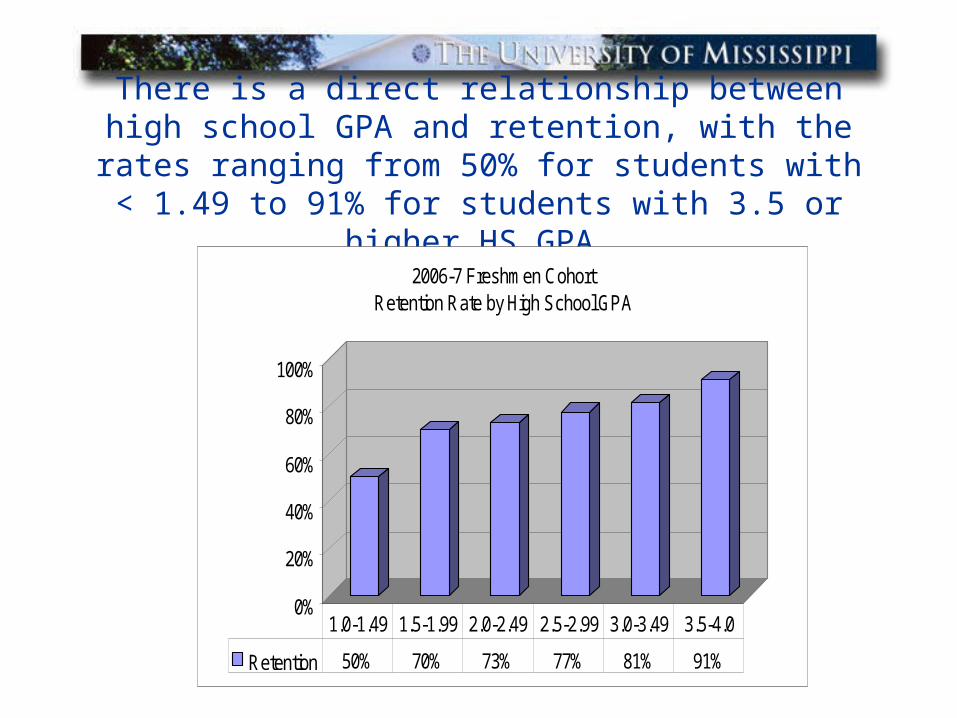
There is a direct relationship between high school GPA and retention, with the rates ranging
from 50% for students with < 1.49 to 91% for students with 3.5 or higher HS GPA.
0%
20%
40%
60%
80%
100%
2006-7 Freshmen CohortRetention Rate by High School GPA
Retention 50% 70% 73% 77% 81% 91%
1.0-1.49 1.5-1.99 2.0-2.49 2.5-2.99 3.0-3.49 3.5-4.0
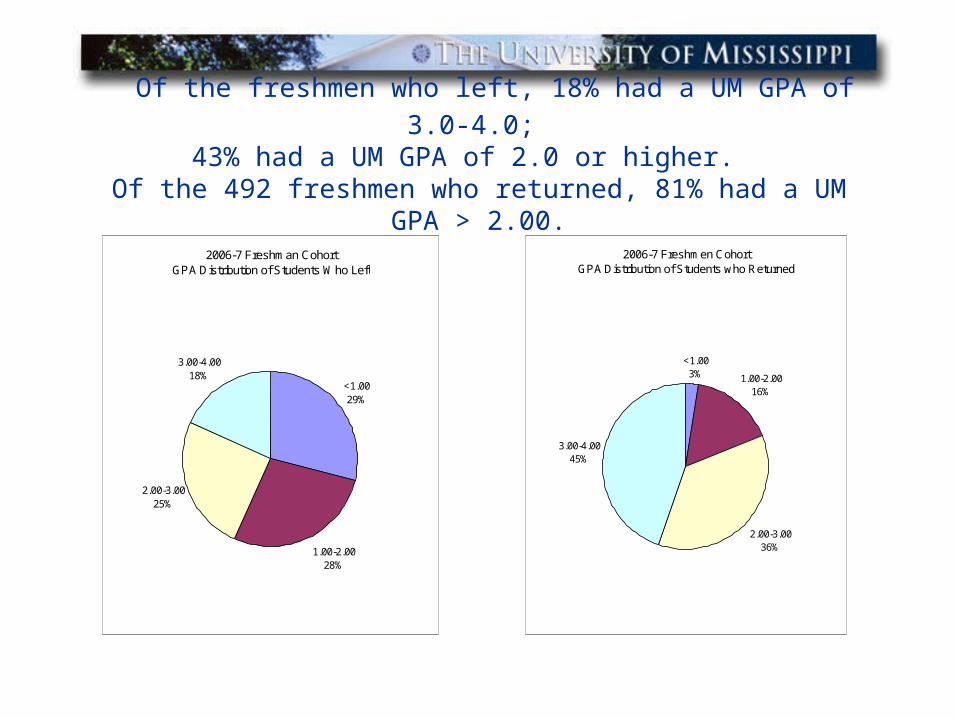
Of the freshmen who left, 18% had a UM GPA of 3.0-4.0; 43% had a UM GPA of 2.0 or higher.
Of the 492 freshmen who returned, 81% had a UM GPA > 2.00.
2006-7 Freshman CohortGPA Distribution of Students Who Left
<1.0029%
1.00-2.0028%
2.00-3.0025%
3.00-4.0018%
2006-7 Freshmen CohortGPA Distribution of Students who Returned
<1.003% 1.00-2.00
16%
2.00-3.0036%
3.00-4.0045%

Nearly 60% of students who left were in Good Standing.Education had the lowest percent of students who left in
good academic standing; Pharmacy had the most.
Left in Good Academic Standing
Lib Arts 63%Accountancy 69%App Sciences 40%Business 55%Education 35%Engineering 53%Pharmacy 89%Total 59%
0%
10%
20%
30%
40%
50%
60%
70%
80%
90%
2006-7 Freshmen CohortStudents who Left in Good Academic Standing by School
RETENTION BY
PROGRAM
RETENTION OF 2006-07 FRESHMEN
COHORT
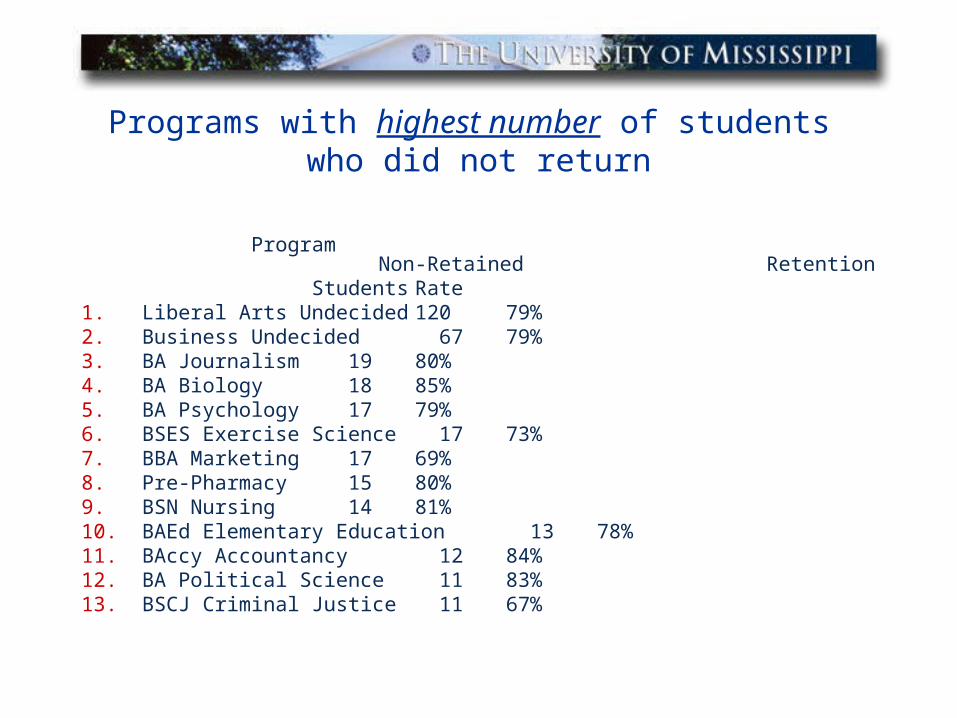
Programs with highest number of students who did not return
Program Non-Retained Retention Students Rate
1. Liberal Arts Undecided 120 79%2. Business Undecided 67 79%3. BA Journalism 19 80%4. BA Biology 18 85%5. BA Psychology 17 79%6. BSES Exercise Science 17 73%7. BBA Marketing 17 69%8. Pre-Pharmacy 15 80%9. BSN Nursing 14 81%10. BAEd Elementary Education 13 78%11. BAccy Accountancy 12 84%12. BA Political Science 11 83%13. BSCJ Criminal Justice 11 67%
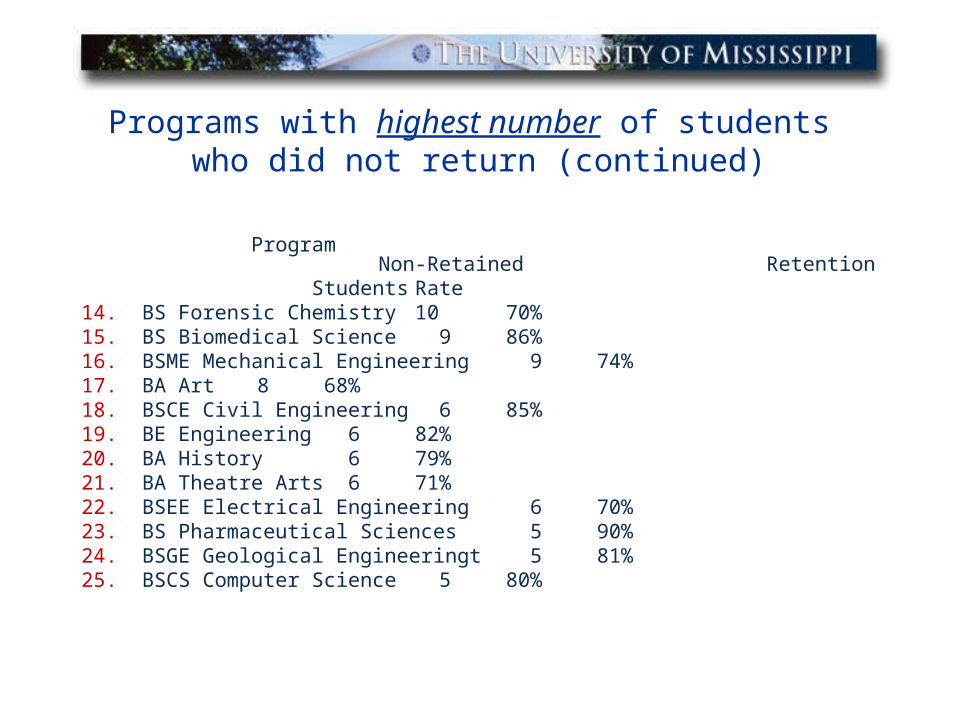
Programs with highest number of students who did not return (continued)
Program Non-Retained Retention Students Rate
14. BS Forensic Chemistry 10 70%15. BS Biomedical Science 9 86%16. BSME Mechanical Engineering 9 74%17. BA Art 8 68%18. BSCE Civil Engineering 6 85%19. BE Engineering 6 82%20. BA History 6 79%21. BA Theatre Arts 6 71%22. BSEE Electrical Engineering 6 70%23. BS Pharmaceutical Sciences 5 90%24. BSGE Geological Engineeringt 5 81%25. BSCS Computer Science 5 80%
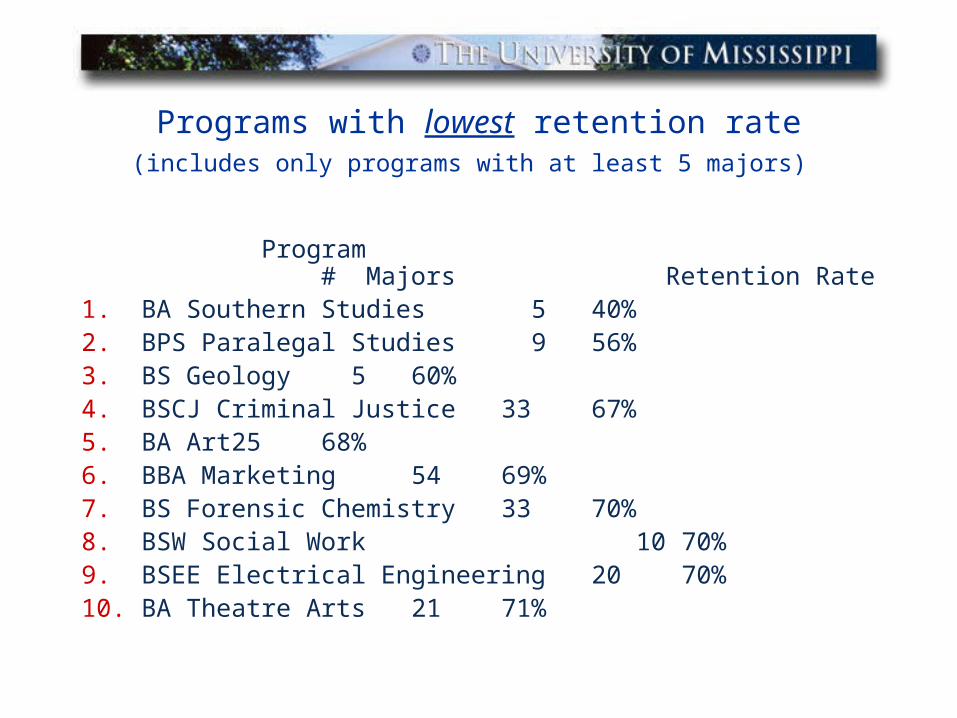
Programs with lowest retention rate(includes only programs with at least 5 majors)
Program # Majors Retention Rate1. BA Southern Studies 5 40%2. BPS Paralegal Studies 9 56%3. BS Geology 5 60%4. BSCJ Criminal Justice 33 67%5. BA Art 25 68%6. BBA Marketing 54 69%7. BS Forensic Chemistry 33 70%8. BSW Social Work 10 70%9. BSEE Electrical Engineering 20 70%10. BA Theatre Arts 21 71%
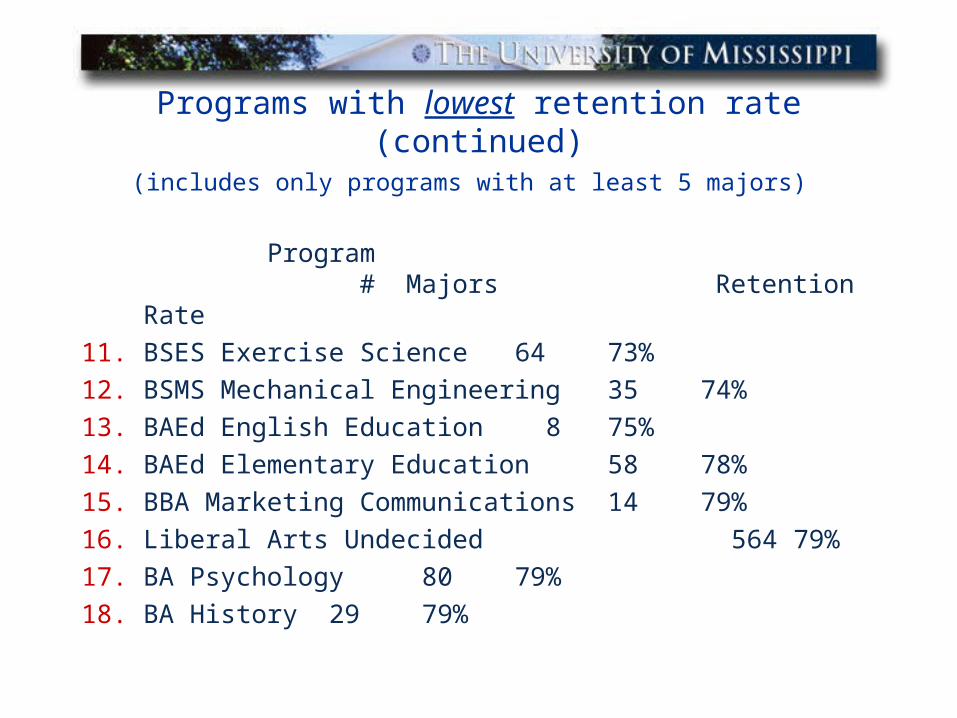
Programs with lowest retention rate (continued)(includes only programs with at least 5 majors)
Program # Majors Retention Rate11. BSES Exercise Science 64 73%12. BSMS Mechanical Engineering 35 74%13. BAEd English Education 8 75%14. BAEd Elementary Education 58 78%15. BBA Marketing Communications 14 79%16. Liberal Arts Undecided 564 79%17. BA Psychology 80 79%18. BA History 29 79%
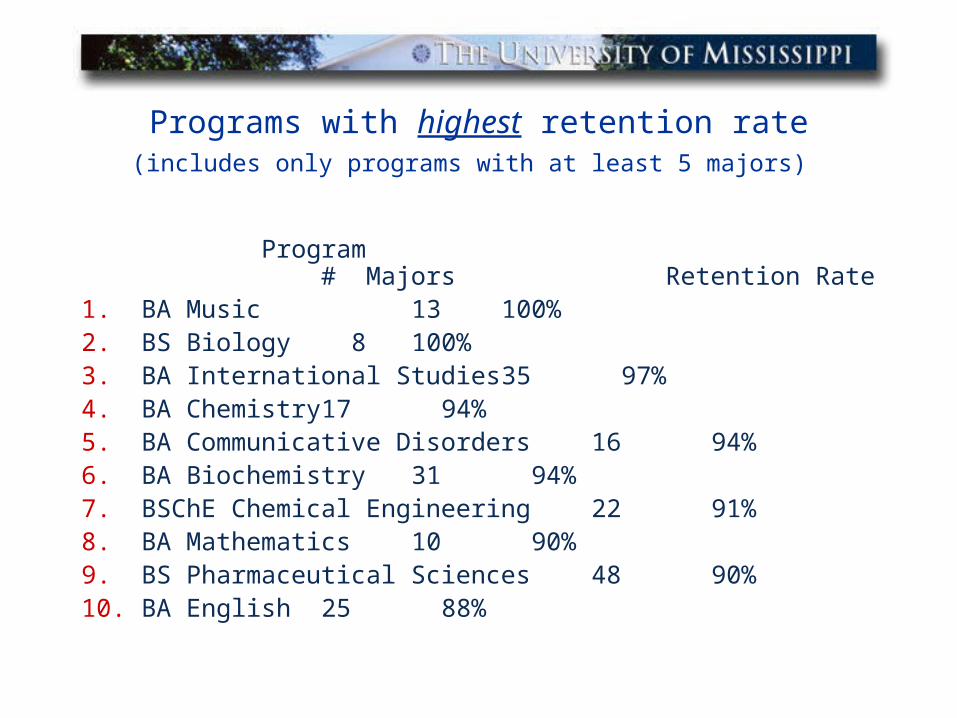
Programs with highest retention rate(includes only programs with at least 5 majors)
Program # Majors Retention Rate1. BA Music 13 100%2. BS Biology 8 100%3. BA International Studies 35 97%4. BA Chemistry 17 94%5. BA Communicative Disorders 16 94%6. BA Biochemistry 31 94%7. BSChE Chemical Engineering 22 91%8. BA Mathematics 10 90%9. BS Pharmaceutical Sciences 48 90%10. BA English 25 88%
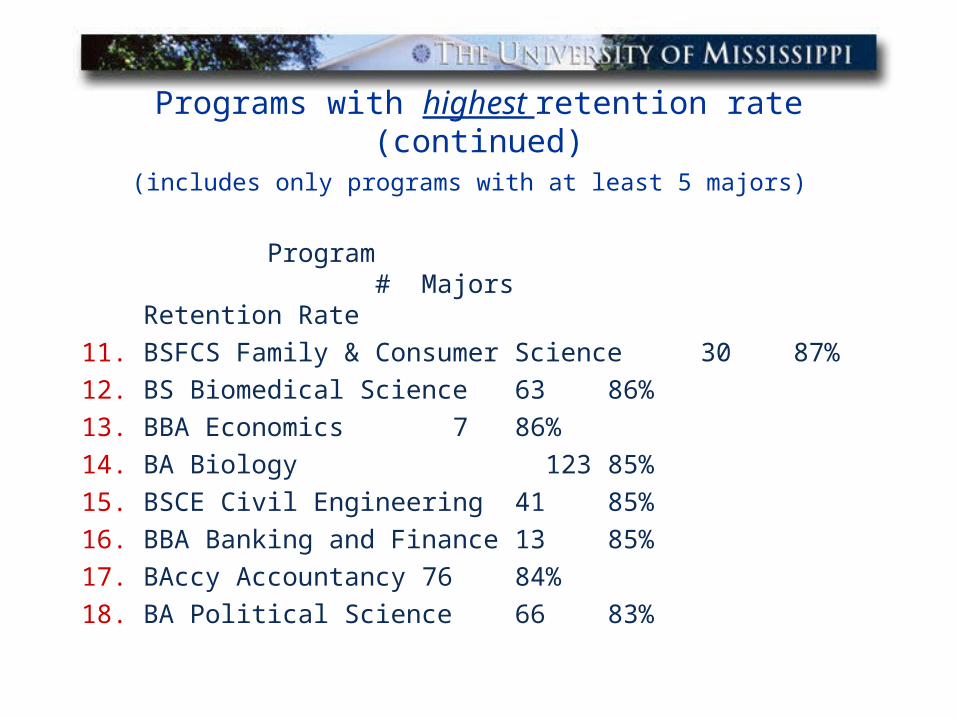
Programs with highest retention rate (continued)(includes only programs with at least 5 majors)
Program # Majors Retention Rate11. BSFCS Family & Consumer Science 30 87%12. BS Biomedical Science 63 86%13. BBA Economics 7 86%14. BA Biology 123 85%15. BSCE Civil Engineering 41 85%16. BBA Banking and Finance 13 85%17. BAccy Accountancy 76 84%18. BA Political Science 66 83%