rethingking sales force in 2010
TRANSCRIPT

NEW WAVE MARKETING 2010 : NEW WAVE MARKETING 2010 : Optimizing Sales Force Activities Optimizing Sales Force Activities

© The TAS Group 20092

© The TAS Group 20093
2009 – 2010: Tough Times

© The TAS Group 20094
Background
“US pharmaceutical companies have for decades relied on the “pinball wizard” sales model: sales representatives bounce from one doctors office to another in hopes of catching a few moments with physicians and influencing which drugs they prescribe.”
“In recent years, the changing dynamics of the business have
prompted a massive expansion of sales forces. The resulting
system is costly, inefficient, and rife with dissatisfaction.”
- MCKINSEY
“Industry average for field force budgets is nearly $875 million with top spending organizations committing more than $1billion” – Cutting Edge

© The TAS Group 20095
Background
• Business Challenge• Physicians spending less time with sales representatives –
about 38% of physicians have consciously decided to make less time for pharmaceutical representatives than they did in 2001.
• Research conducted in 2001 indicates physicians were allocating 10% of their day to seeing pharmaceutical representatives assuming they saw them at all.
• Because of increasing complexity of marketplace dynamics, sales representatives are unable to effectively adjust their sales activities, and are increasingly experiencing poorer sales results.
• Despite these claims, pharmaceutical companies continue to use outdated reach and frequency models based on sales call goals from the mid 1990’s to influence their sizing models.

© The TAS Group 20096
The pharmaceutical industry continues to march toward the patent cliff in 2010-2012, when a record amount of drug sales will lose patent protection in the U.S. This means some of the best-selling drugs, including Pfizer's (PFE) Lipitor, Bristol-Myers Squibb's (BMY) Plavix and Avapro, Eli Lilly's (LLY) Zyprexa, Wyeth's (WYE) Effexor, and Merck's (MRK) Cozaar/Hyzaar and Singulair will be exposed to generic competition.
Our selection criteria for the top 10 prospects is pretty straightforward—promising late-stage drugs due out over the next two years……………………..
JAKARTA. Meski tetap bergairah, pertumbuhan pasar farmasi di 2010 tak akan terlalu tinggi. Gabungan Pengusaha Farmasi Indonesia (GP Farmasi) memperkirakan nilai pasar bisnis farmasi di Indonesia hanya tumbuh 10%, atau naik sekitar Rp 3 triliun dari realisasi 2009 sebesar Rp 30 triliun.
Pertumbuhan pasar farmasi ini lebih rendah dibandingkan negara tetangga seperti Thailand dan Malaysia. "Pertumbuhannya nggak akan lebih dari 10%," tegas Ketua Umum GP Farmasi Anthony Ch Sunarjo, Selasa (24/11).
Belum optimalnya pasar farmasi di Indonesia antara lain terhambat beberapa aturan yang mempersempit ruang gerak pelaku bisnis farmasi. Semisal, Peraturan Menteri Keuangan Nomor 104 Tahun 2009 yang membatasi biaya promosi produk obat-obatan menjadi 2% dari setoran pajak penghasilan (Pph) atau sebanyak-banyaknya Rp 25 miliar.
Padahal, potensi pasar farmasi di dalam negeri seharusnya lebih besar mengingat jumlah penduduk Indonesia mencapai 230 juta orang. Hingga kini, konsumsi obat-obatan per kapita di Indonesia hanya US$ 6-US$ 7 per tahun. Berbeda dengan Filipina (US$ 14), Malaysia (US$ 20), dan Singapura (US$ 27).
© The TAS Group 20097
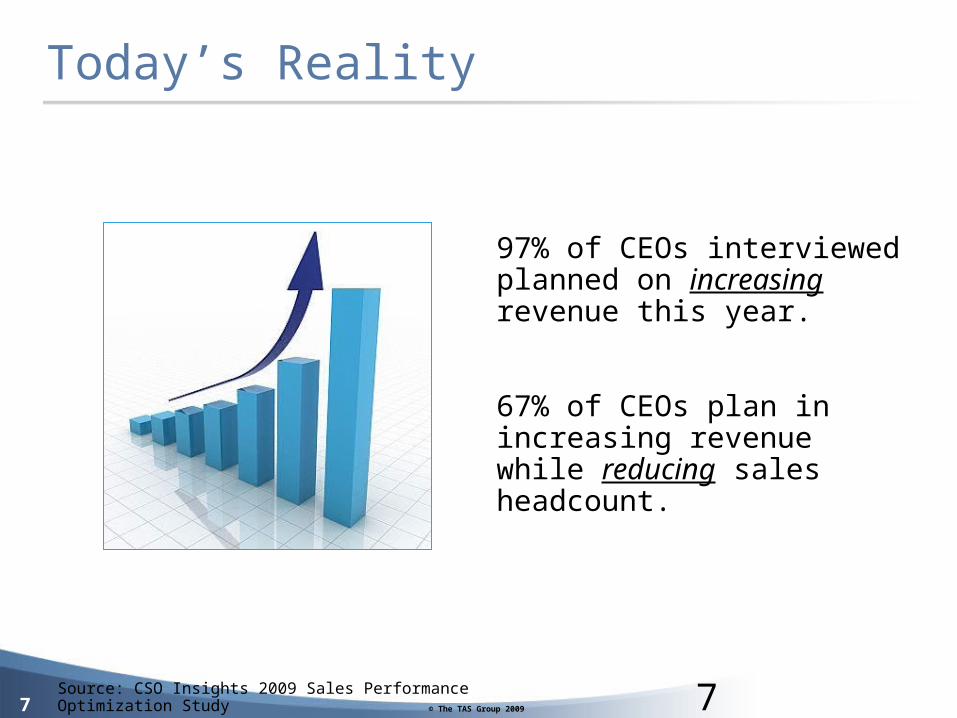
Today’s Reality
Source: CSO Insights 2009 Sales Performance Optimization Study
97% of CEOs interviewed planned on increasing revenue this year.
67% of CEOs plan in increasing revenue while reducing sales headcount.
7

© The TAS Group 20098

© The TAS Group 20099
Sales Exec Top Priorities
Increasing Revenues 63%
Improving Sales Effectiveness 50%
Growing Market 39%
Optimizing Lead Gen 31%
Reducing Sales Cycles 18%
Source: CSO Insights 2009 Sales Performance Optimization Study

© The TAS Group 200910

© The TAS Group 200911

© The TAS Group 200912
TransactionsTransactions RelationshipsRelationships
LocalLocal GlobalGlobal
ManagementManagement LeadershipLeadership
IndividualsIndividuals TeamsTeams
Sales VolumeSales Volume Sales ProductivitySales Productivity
Sales Management Trends

© The TAS Group 200913
Sales Teamwork Approaches
Relatively permanent, Relatively permanent, customer-focused groupcustomer-focused group
Relatively temporary, Relatively temporary, transaction-focused grouptransaction-focused group
Membership determined by Membership determined by job assignment to a specific job assignment to a specific
buying organizationbuying organization
Membership determined by Membership determined by involvement in sales involvement in sales
transactiontransaction
One team per buying unitOne team per buying unit One selling center per One selling center per sales opportunitysales opportunity
Core Selling TeamCore Selling Team Selling CenterSelling Center

© The TAS Group 200914
Sales Teamwork Approaches
Core Selling TeamCore Selling Team Selling CenterSelling Center
Membership Membership relatively stablerelatively stable
Membership Membership very fluidvery fluid
Characteristics of team Characteristics of team depend on characteristics depend on characteristics
of buying organizationof buying organization
Characteristics of team Characteristics of team depend on characteristics depend on characteristics
of sales opportunityof sales opportunity
Mission is strategic with Mission is strategic with respect to the buying respect to the buying
organizationorganization
Mission is tactical Mission is tactical with respect to the with respect to the sales opportunitysales opportunity

© The TAS Group 200915
Marketing
Sales Force Goals
Strategy Increase share of customer business
Marketing Strategy-Sales Force Goals, Strategy and Tactics
share 10%
GoalsIncrease share of customer business
StrategyBuild long-term
customer relations
TacticsDevelop sales teams
Provide bonuses for greater customer share
Increase market

© The TAS Group 200916

© The TAS Group 200917

© The TAS Group 200918
Sales Rep Time Allocation
Almost 2/3 of sales time is spent NOT selling!
Source: CSO Insights 2009 Sales Performance Optimization Study
© The TAS Group 200919
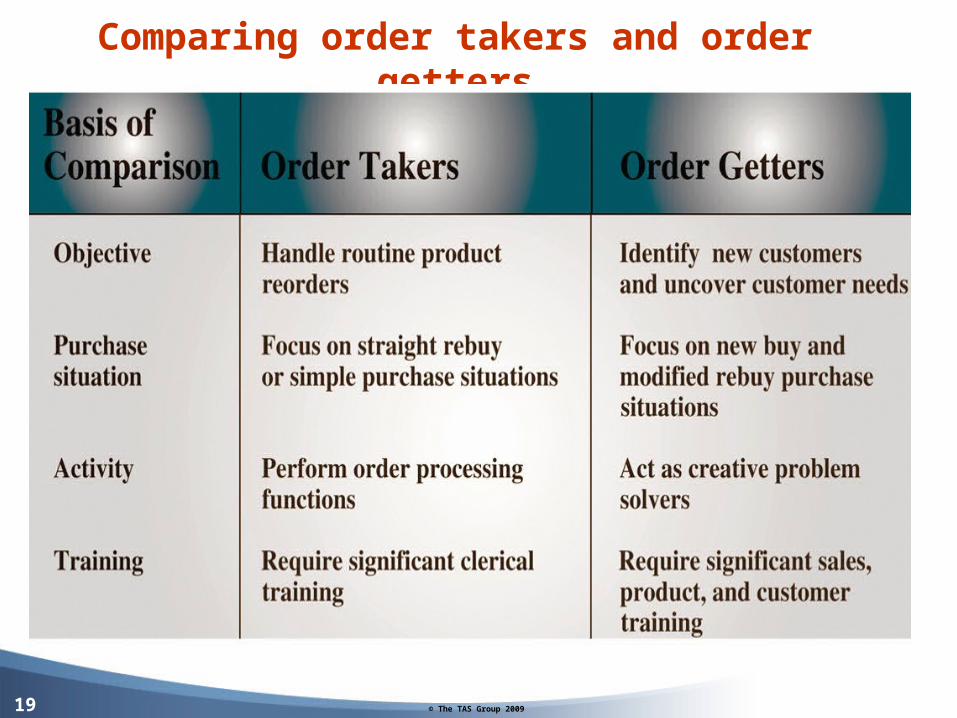
Comparing order takers and order getters

© The TAS Group 200920
© The TAS Group 200921
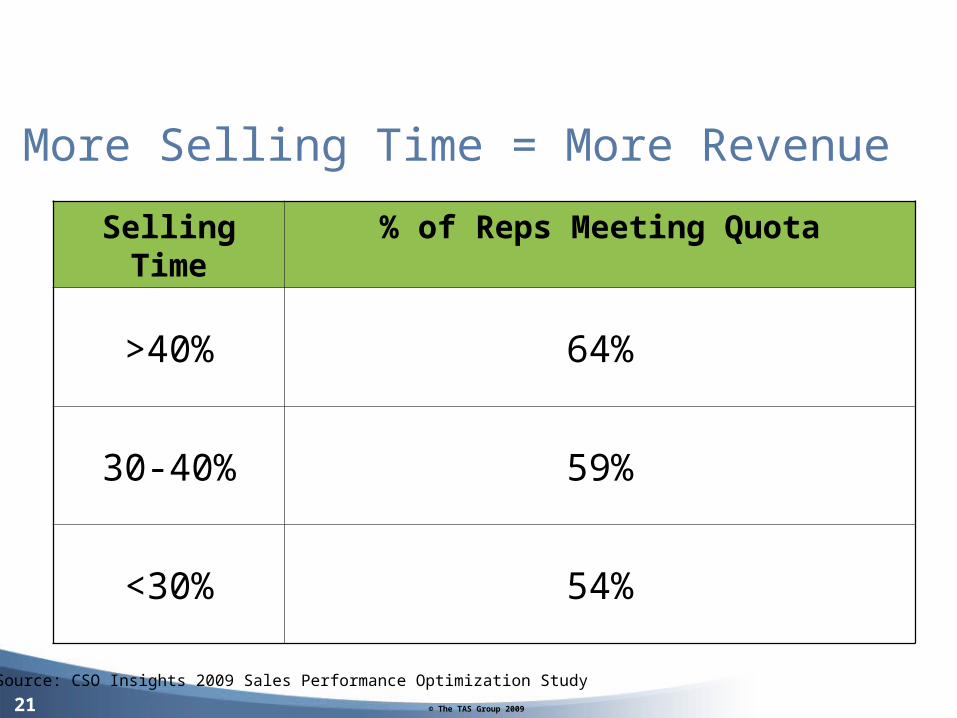
More Selling Time = More Revenue
Selling Time
% of Reps Meeting Quota
>40% 64%
30-40% 59%
<30% 54%
Source: CSO Insights 2009 Sales Performance Optimization Study
© The TAS Group 200922
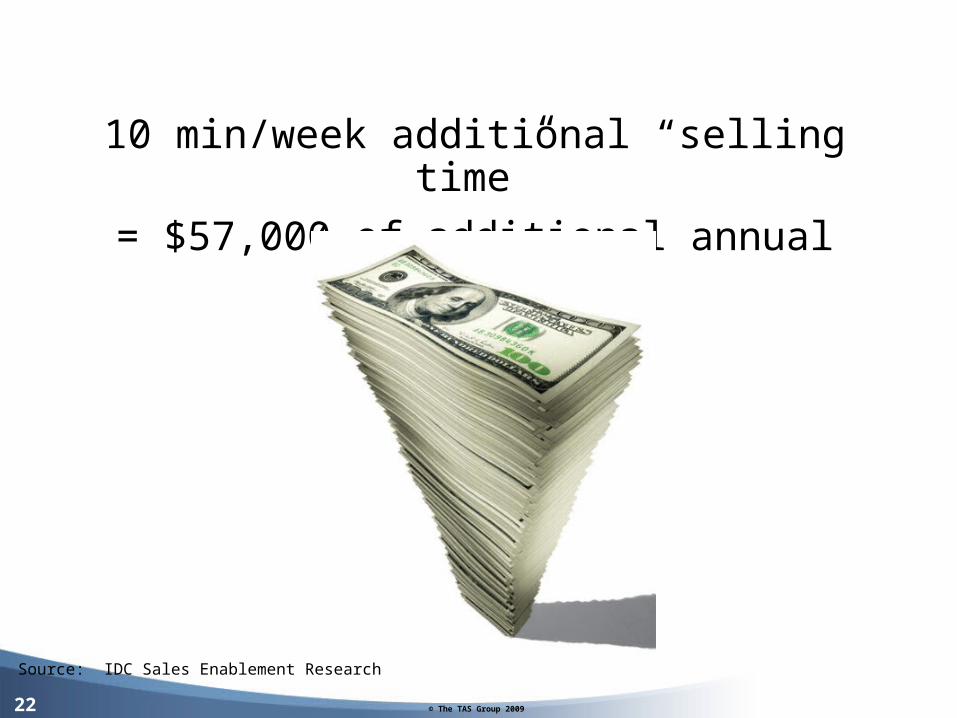
10 min/week additional “selling time”
= $57,000 of additional annual revenue
Source: IDC Sales Enablement Research

© The TAS Group 200923
Map the Sales Process
Suspect
Prospect
Qualified
Scored
ABC’s 7 Steps, the Baseline Selling Stepsand the Criteria for Reaching Them.
1. Target an Account
2. Meet with Decision Maker
7. Convert Account
6. Closing
5. Successful Evaluation
4. Evaluate Products
3. Qualify Account
They Need It
Differentiated ABC’sQuantified Problem
Compelling Reasons to Buy
They’ll Spend More
Have Timeline for Decision
Know Process for Decision
Needs and Cost Appropriate Presentation

© The TAS Group 200924
© The TAS Group 200925
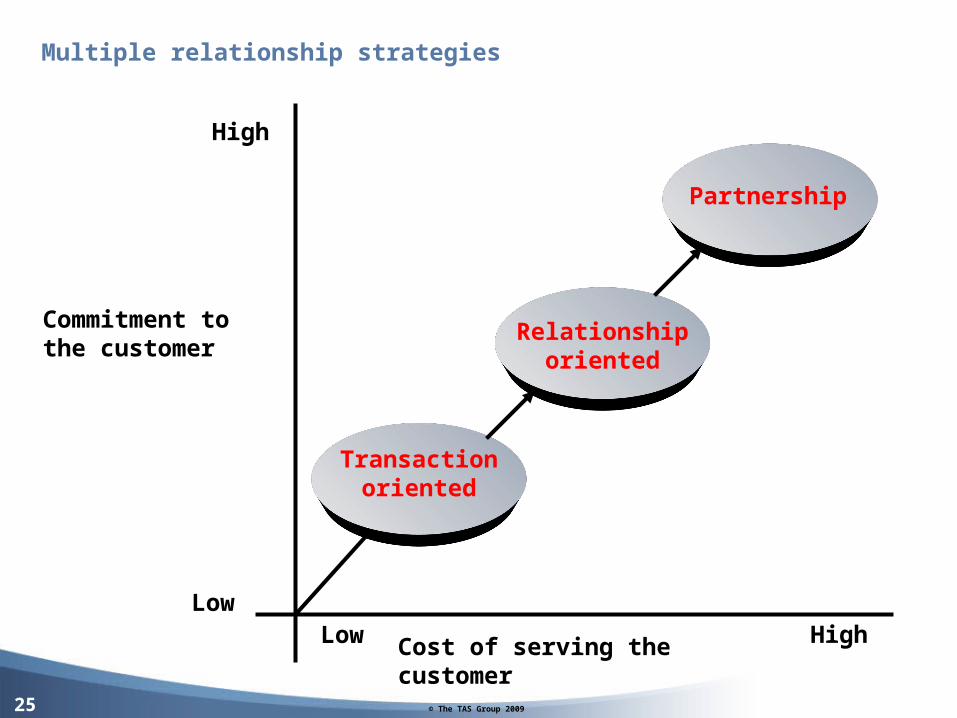
Transaction oriented
Relationship oriented
Partnership
Low HighLow
High
Multiple relationship strategies
Cost of serving the customer
Commitment to the customer

© The TAS Group 200926
Strategy #1Optimize Time

© The TAS Group 200927
Ask Executives what they need to make their numbers and they’ll likely say:
“More Leads”
Ask sales people what they need and they’ll likely say:
“More TIME with QUALIFIED leads”
Source: Lead Generation for the Complex Sale, Brian Carroll, 2006
© The TAS Group 200928
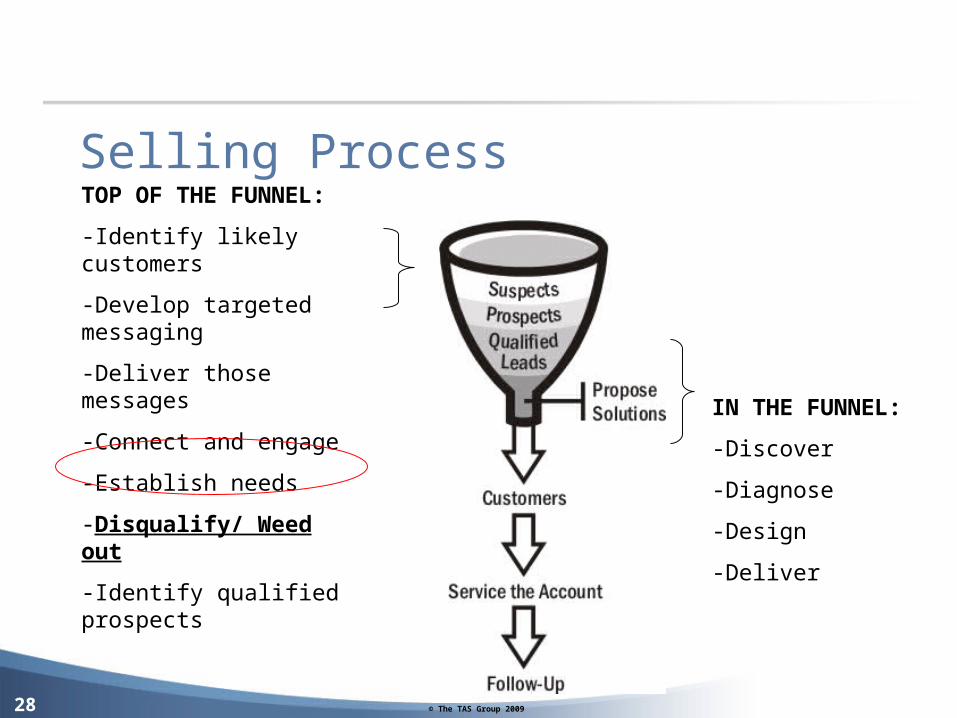
TOP OF THE FUNNEL:
-Identify likely customers
-Develop targeted messaging
-Deliver those messages
-Connect and engage
-Establish needs
-Disqualify/ Weed out
-Identify qualified prospects
IN THE FUNNEL:
-Discover
-Diagnose
-Design
-Deliver
Selling Process
© The TAS Group 200929
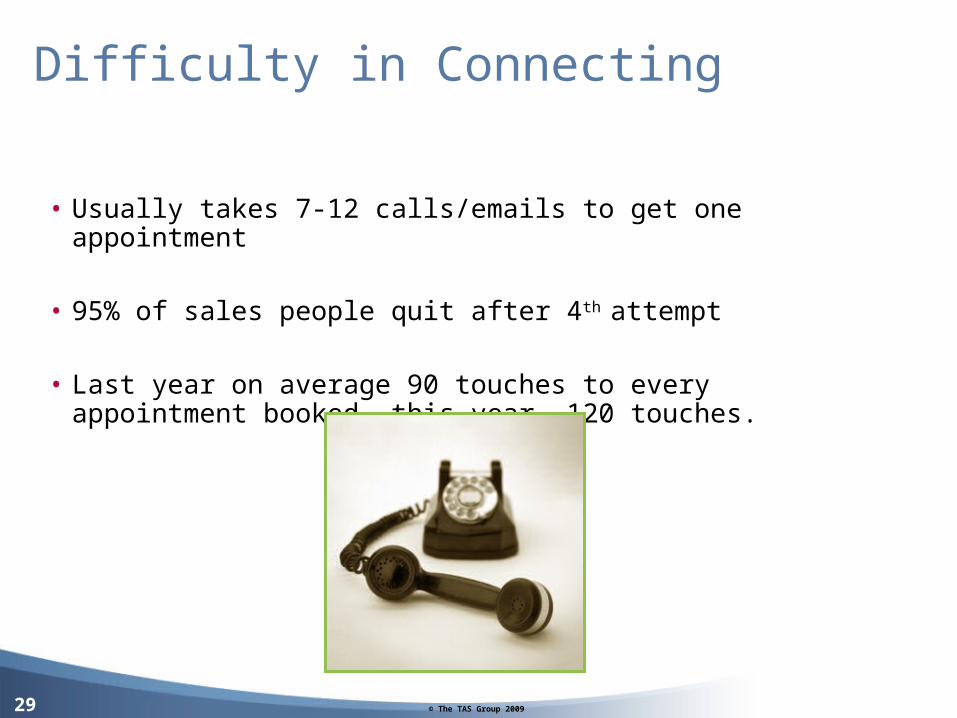
Difficulty in Connecting
• Usually takes 7-12 calls/emails to get one appointment
• 95% of sales people quit after 4th attempt
• Last year on average 90 touches to every appointment booked….this year, 120 touches.

© The TAS Group 200930
Strategy #2Optimize Resources
Use the resource that fits the task
© The TAS Group 200931
What is Sales Enablement?
IDC defines Sales Enablement as:
“The delivery of the right information to the right person at the right time and in the right place to assist in moving a specific sales opportunity forward.”
Source: IDC, 2009

© The TAS Group 200932
Arm your Sales Team
• The right knowledge• specific to the current selling situation• at the right time• in the right place• tailored to the needs of the buyer

© The TAS Group 200933
Conversations…NOT Collateral
• It’s not about more collateral, it’s enabling salespeople to have conversations.
• It's not about creating messages at “Corporate”, it’s discovering the messages and strategies that are resonating with buyers.
Relevant Content = Information
Irrelevant Content = NoiseSource: New Rules of Sales Enablement eBook, Jeff Ernst
Key Messages

© The TAS Group 200934
Conversations…NOT Collateral
• Shared experiences :: Stories of successful selling experiences, lessons learned in the field, advice on how to avoid landmines or differentiate from competitors.
• Sales support tools :: Competitive analysis, objection handling, customer stories and references, discovery questions, call scripts, sample letters.
• Subject matter experts :: Product gurus, industry specialists, client service managers who can help prepare the rep for a sales call or support the rep on a call.
• Coaching and proven strategies :: Content, messages, and strategies that are proven to work in the current selling situation.
• Customer-facing materials :: Not just static collateral, but dynamic deliverables that are personalized for each prospect.
Source: New Rules of Sales Enablement eBook, Jeff Ernst
© The TAS Group 200935
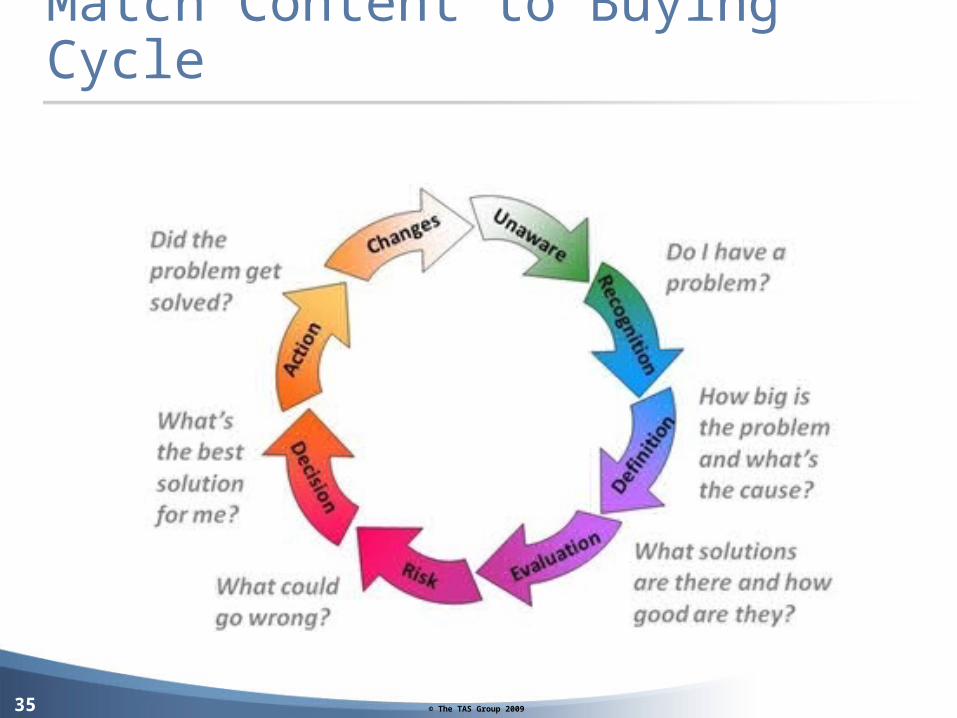
Match Content to Buying Cycle
© The TAS Group 200936
Strategy #3Optimize Knowledge

© The TAS Group 200937
“Thinking back to your initial meeting, what percent of reps were….”
Buyer-Seller Alignment
Source: IDC Customer Experience Panel, January 2009Number of respondents = 296
© The TAS Group 200938
© The TAS Group 200939
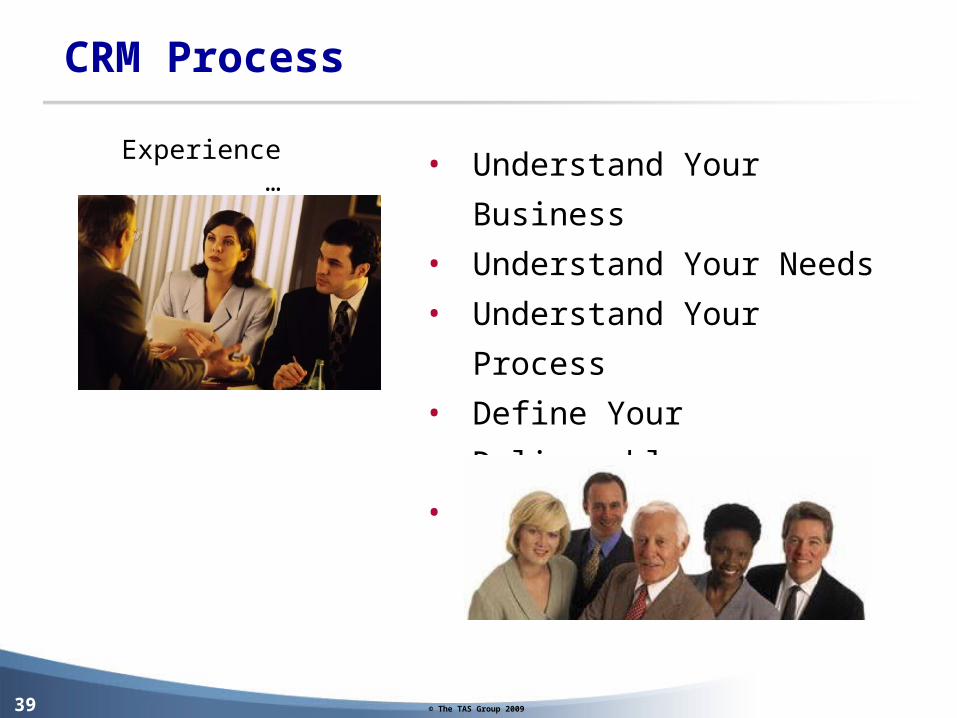
• Understand Your Business
• Understand Your Needs
• Understand Your Process
• Define Your Deliverable
• Implement Your Solution
Experience…
CRM Process

© The TAS Group 200940

© The TAS Group 200941

© The TAS Group 200942
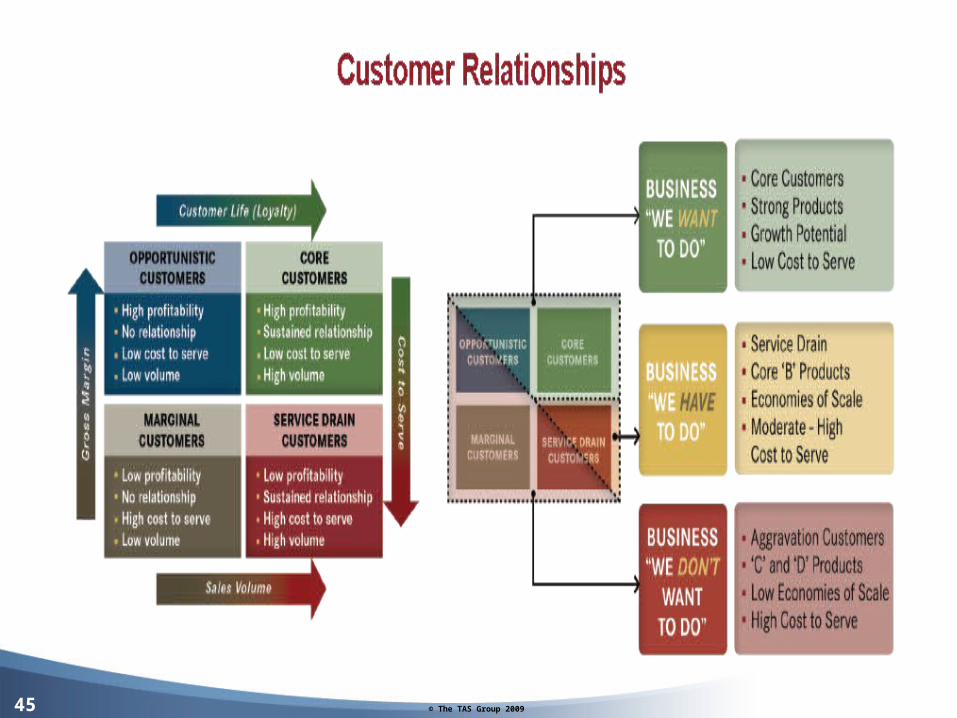
Customer Relationship Management
• Most personal selling is transaction-oriented
• Companies want to encourage repeat purchasing because it is more efficient
• Mutually profitable relationships are built on creating value, offering packaged solutions to problems, and improving products and processes

© The TAS Group 200943
© The TAS Group 200944
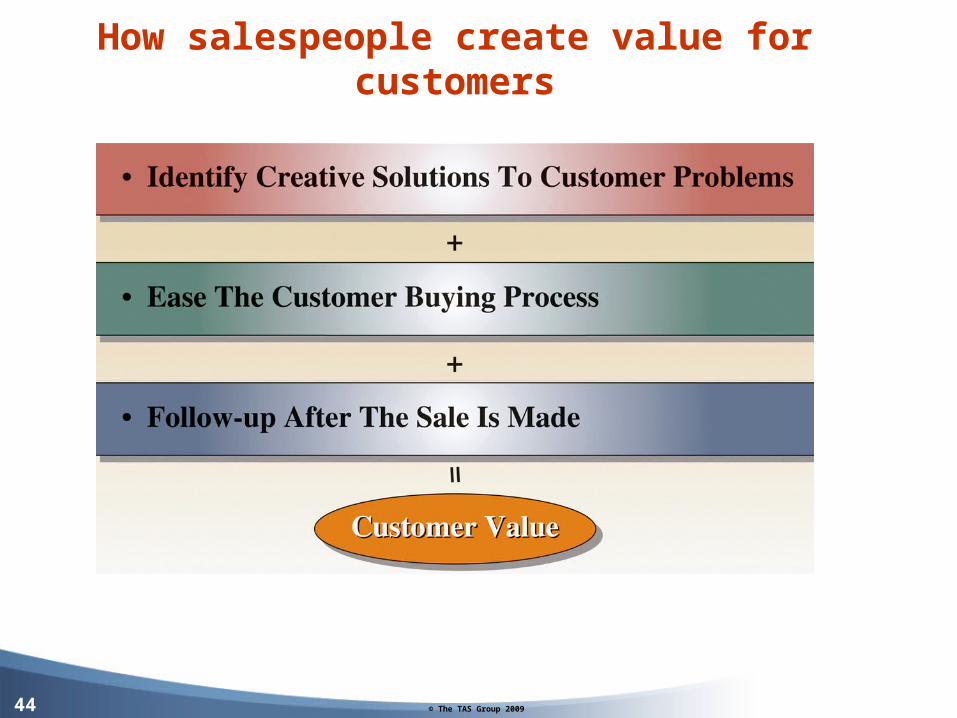
How salespeople create value for customers
© The TAS Group 200945
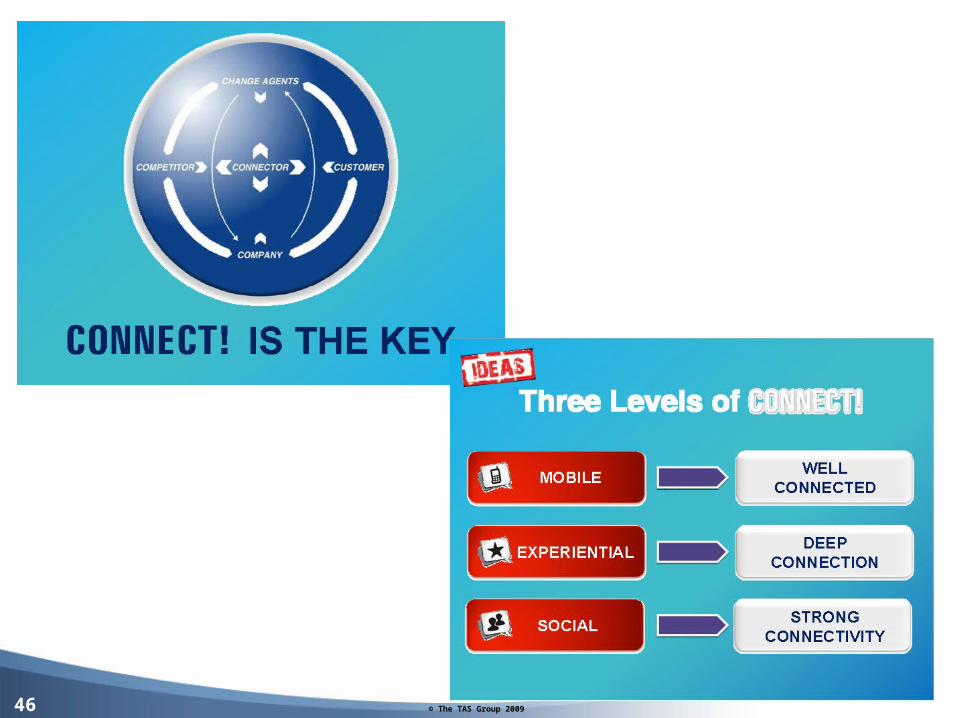
© The TAS Group 200946

© The TAS Group 200947

© The TAS Group 200948
Marketing 3.0™• The marketing ecosystem has changed.
• Customers and consumers have evolved.
• Your marketing strategies must adapt to
• the new expectations,
• behavior and attitudes of today’s and tomorrow’s buying decision makers.
• Marketing 3.0™, a customer & consumer centric personalized marketing strategy focused on
• Satisfying your customers' c
• Consumers' needs with a tailored solution, communicated in a way and at a time and place acceptable to the customer to
•Enhance
•Acceptance
•Adoption
•Comprehension
•retention
•purchase transformation.
Communication
All change is stressful – even positive change.
