rethinking history graduate education by the numbers
TRANSCRIPT

Rethinking History Graduate Education by the Numbers
Crossroads: The Future of Graduate History EducationDrew University
March 12, 2016 Twitter: @rbthisted
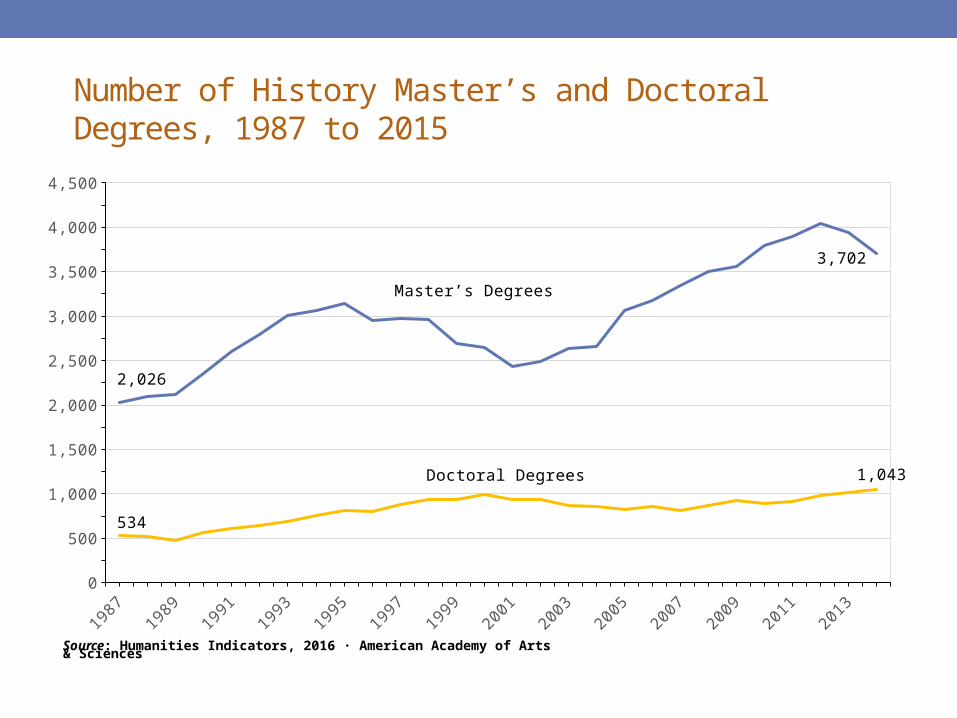
Number of History Master’s and Doctoral Degrees, 1987 to 2015
1987
1988
1989
1990
1991
1992
1993
1994
1995
1996
1997
1998
1999
2000
2001
2002
2003
2004
2005
2006
2007
2008
2009
2010
2011
2012
2013
2014
0
500
1,000
1,500
2,000
2,500
3,000
3,500
4,000
4,500
2,026
Master’s Degrees
3,702
534
Doctoral Degrees 1,043
Source: Humanities Indicators, 2016 · American Academy of Arts & Sciences
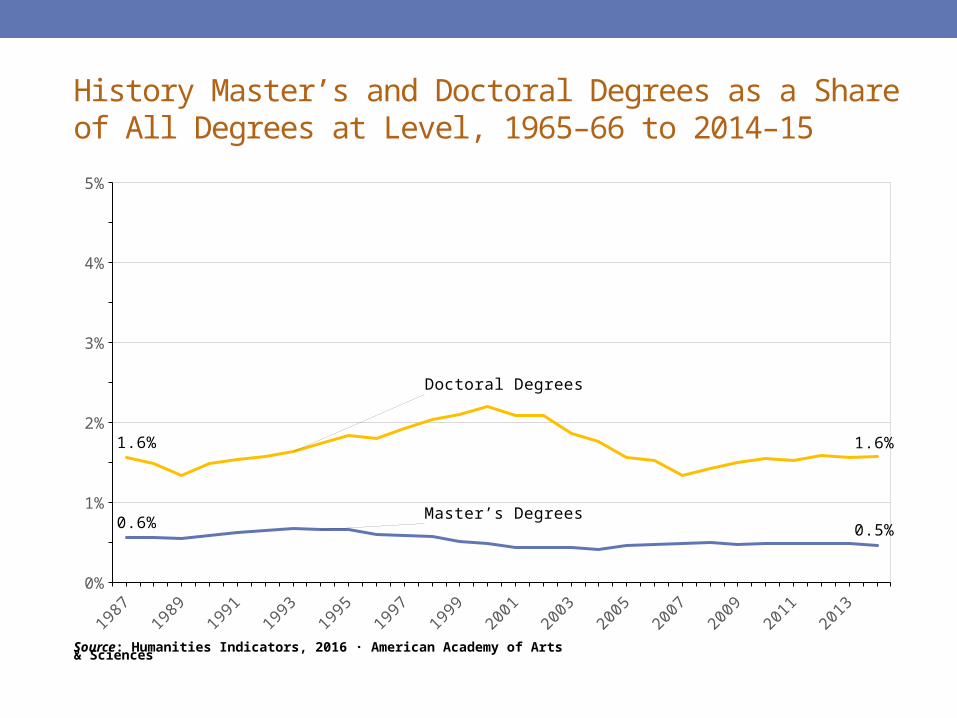
History Master’s and Doctoral Degrees as a Share of All Degrees at Level, 1965–66 to 2014–15
1987
1988
1989
1990
1991
1992
1993
1994
1995
1996
1997
1998
1999
2000
2001
2002
2003
2004
2005
2006
2007
2008
2009
2010
2011
2012
2013
2014
0%
1%
2%
3%
4%
5%
0.6% Master’s Degrees0.5%
1.6%
Doctoral Degrees
1.6%
Source: Humanities Indicators, 2016 · American Academy of Arts & Sciences

Share of Women Earning Master’s and Doctoral Degrees in History, 1966 to 2014
1987
1988
1989
1990
1991
1992
1993
1994
1995
1996
1997
1998
1999
2000
2001
2002
2003
2004
2005
2006
2007
2008
2009
2010
2011
2012
2013
2014
0%
10%
20%
30%
40%
50%
60%
70%
32.6%History--Doctorate
42.9%
Humanities--Doctorate
40.6% History--Master's
48.9%
Humanities--Master's
Source: Humanities Indicators, 2016 · American Academy of Arts & Sciences

Share of Traditionally Underrepresented Racial/Ethnic Minorities, 1995 to 2014
1995
1996
1997
1998
1999
2000
2001
2002
2003
2004
2005
2006
2007
2008
2009
2010
2011
2012
2013
2014
0%
2%
4%
6%
8%
10%
12%
14%
16%
6.6%
11.5%
5.6%
11.0%
History--Master's
History--Doctorates
Humanities--Master's
Humanities--Doc-torates
Source: Humanities Indicators, 2016 · American Academy of Arts & Sciences
Master’s Degrees
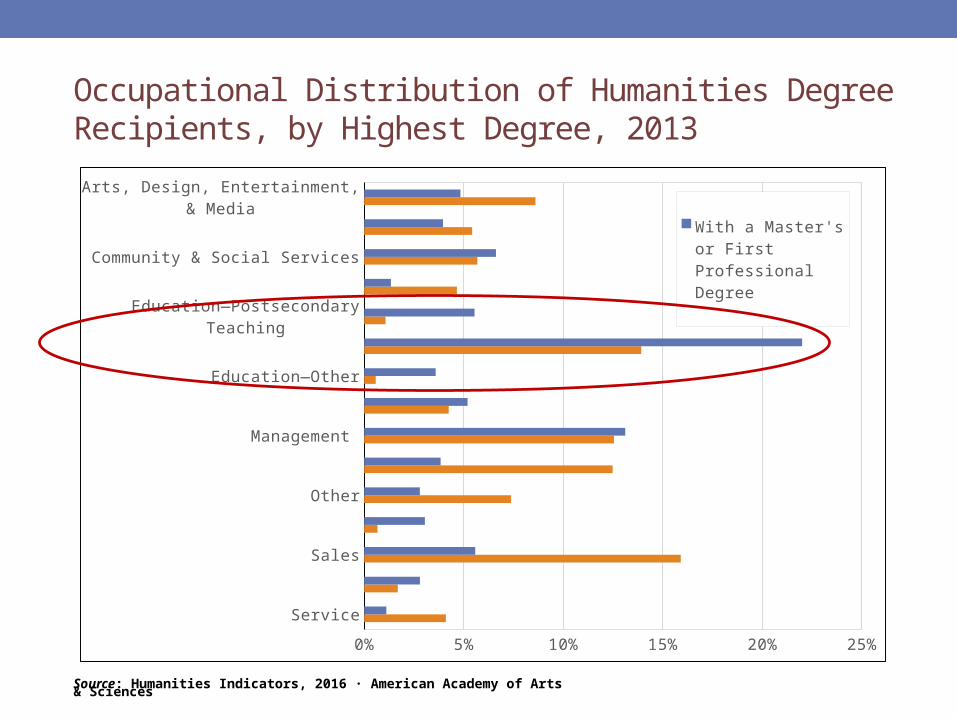
Occupational Distribution of Humanities Degree Recipients, by Highest Degree, 2013
Service
Sciences & Engineering
Sales
Other Management & Professional
Other
Office and Administrative Support
Management
Healthcare
Education—Other
Education—Precollegiate Teaching
Education—Postsecondary Teaching
Computer
Community & Social Services
Business & Financial Operations
Arts, Design, Entertainment, & Media
0% 5% 10% 15% 20% 25%
With a Master's or First Professional Degree
With only a Bachelor's Degree
Source: Humanities Indicators, 2016 · American Academy of Arts & Sciences

Department Characterization of Degree, 2016
Research degree Research-based teaching degree
Teaching degree General purpose degree
Other0%
10%
20%
30%
40%
50%
60%
70%
80%Master's Pro-grams (n=71)Doctoral Pro-grams (n=86)
Source: Survey of Department Chairs with Graduate Degree Programs, February 2016
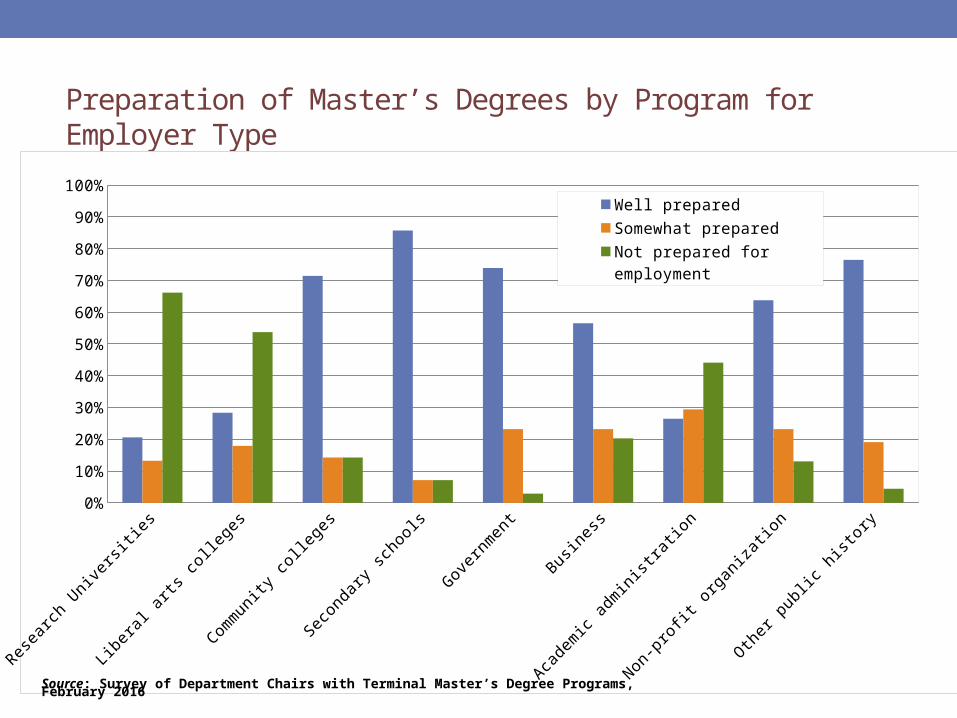
Preparation of Master’s Degrees by Program for Employer Type
Researc
h Univ
ersitie
s
Libera
l arts c
ollege
s
Commun
ity col
leges
Secon
dary
schoo
ls
Governm
ent
Busine
ss
Academ
ic adm
inistra
tion
Non-pr
ofit o
rganiz
ation
Other p
ublic
histor
y0%
10%20%30%40%50%60%70%80%90%
100%Well preparedSomewhat preparedNot prepared for employment
Source: Survey of Department Chairs with Terminal Master’s Degree Programs, February 2016

The Diversity of the History M.A.
• “A plurality of our students are getting an non-thesis MA in history with the highest secondary education license. Another group are pursuing non-thesis degrees with an interest in teaching junior college -maybe- but wanting jobs/promotions in the local military-industrial complex. We have another group who write theses, sometimes thinking about going on to a Ph.D.”
• “the vast majority of our students want to go into public history”
• “Students can pick different tracks so that about a third of our students are research oriented and well-prepared for Ph.D. programs, 1/3 will go into teaching and focus on teaching more than research, and another 1/3 are in our public history program, which prepares them for a lot of careers in public history.”
Source: Survey of Department Chairs with Terminal Master’s Degree Programs, February 2016

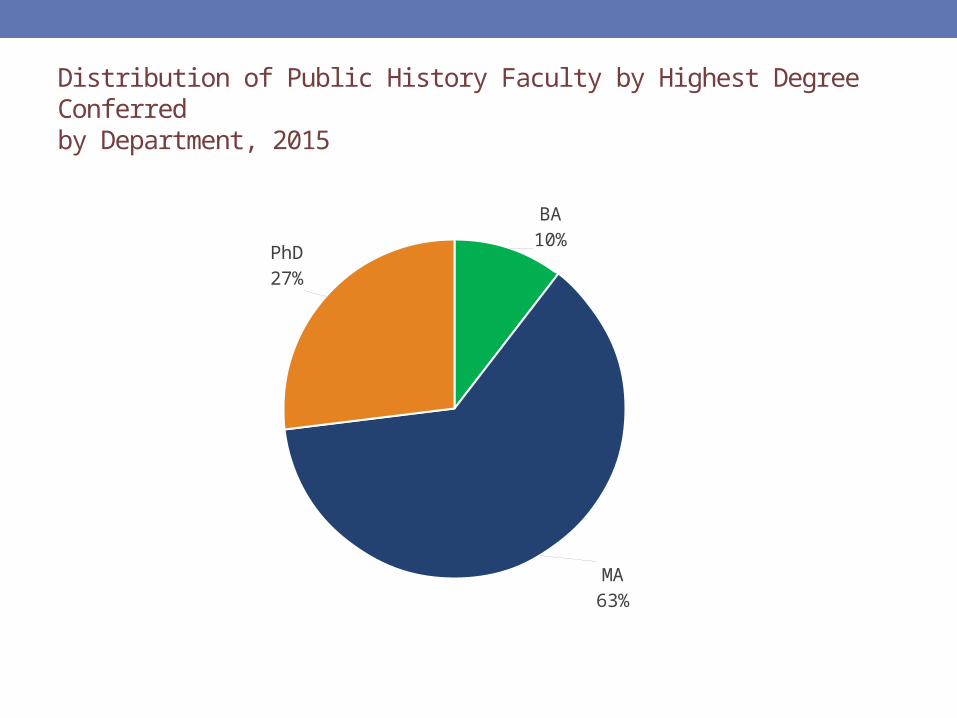
Distribution of Public History Faculty by Highest Degree Conferred by Department, 2015
BA10%
MA63%
PhD27%

Ecology of Doctoral Programs
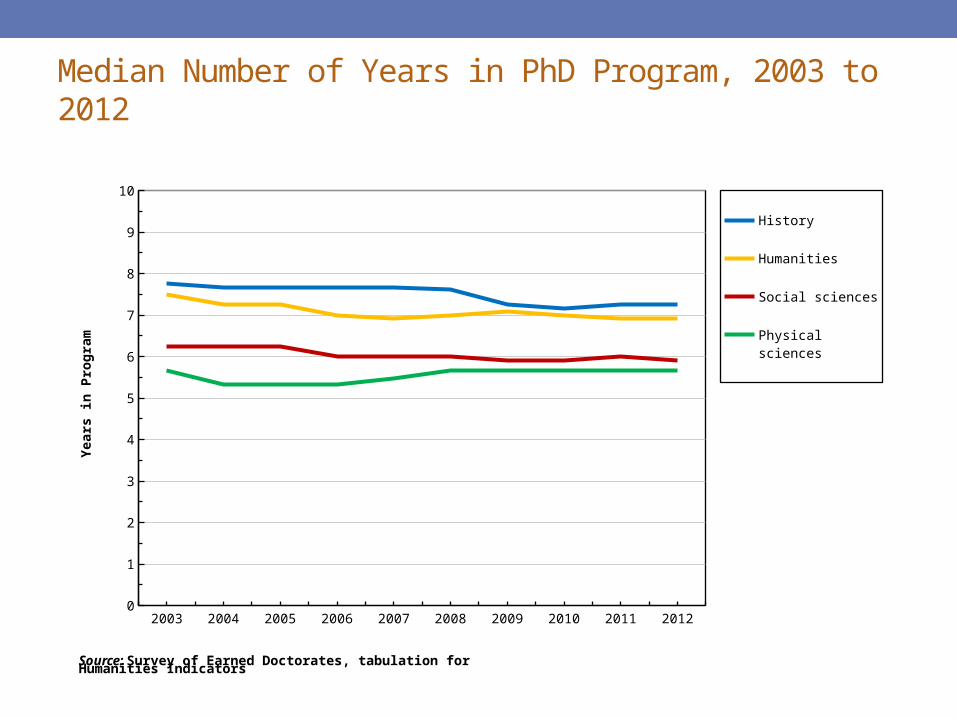
Median Number of Years in PhD Program, 2003 to 2012
2003 2004 2005 2006 2007 2008 2009 2010 2011 20120
1
2
3
4
5
6
7
8
9
10
History
Humanities
Social sciences
Physical sciences
Year
s in
Pro
gram
Source: Survey of Earned Doctorates, tabulation for Humanities Indicators
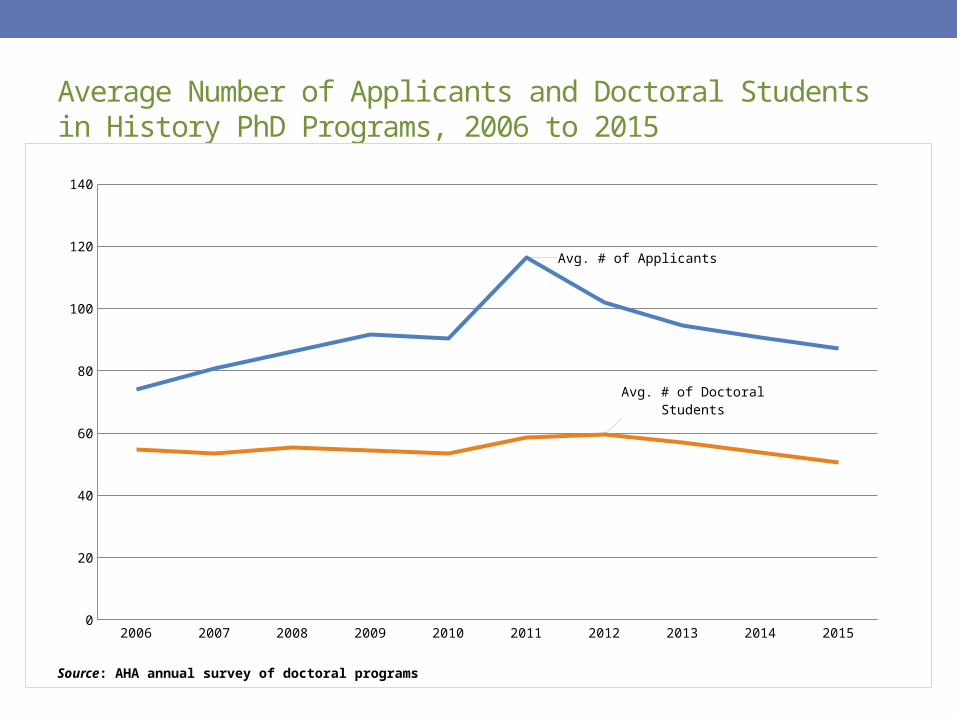
Average Number of Applicants and Doctoral Students in History PhD Programs, 2006 to 2015
2006 2007 2008 2009 2010 2011 2012 2013 2014 20150
20
40
60
80
100
120
140
Avg. # of Applicants
Avg. # of Doctoral Students
Source: AHA annual survey of doctoral programs
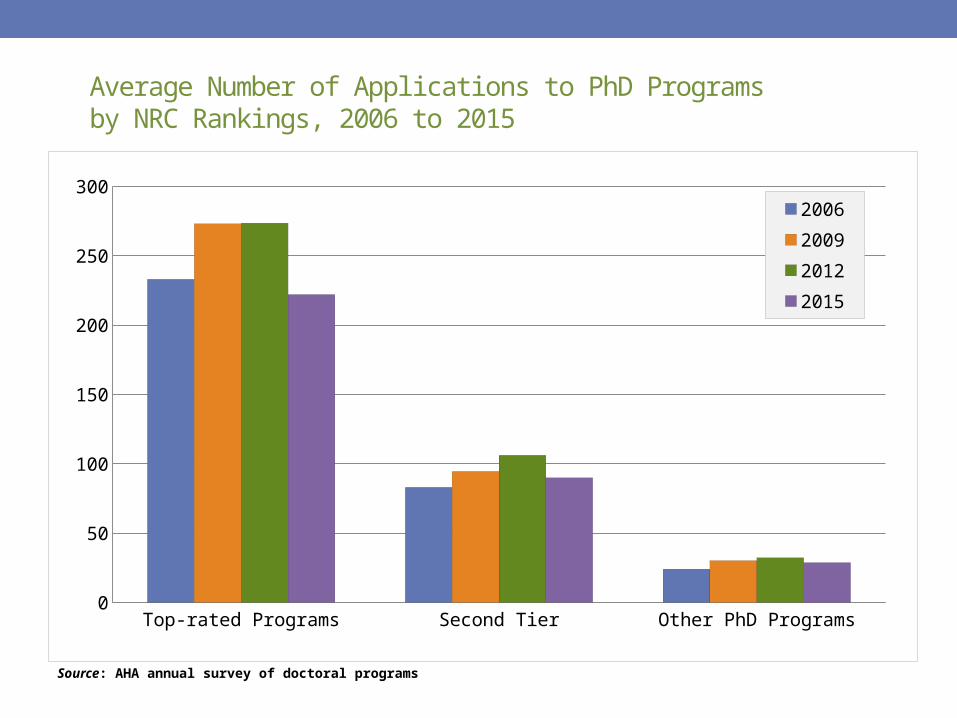
Average Number of Applications to PhD Programsby NRC Rankings, 2006 to 2015
Top-rated Programs Second Tier Other PhD Programs0
50
100
150
200
250
3002006200920122015
Source: AHA annual survey of doctoral programs
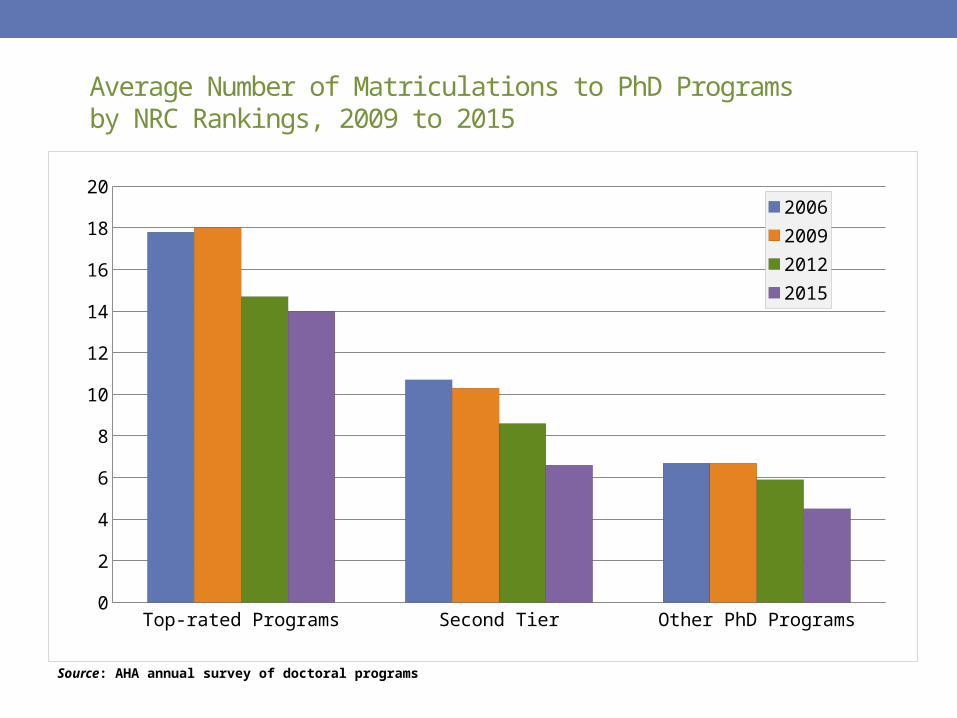
Average Number of Matriculations to PhD Programsby NRC Rankings, 2009 to 2015
Top-rated Programs Second Tier Other PhD Programs0
2
4
6
8
10
12
14
16
18
202006200920122015
Source: AHA annual survey of doctoral programs
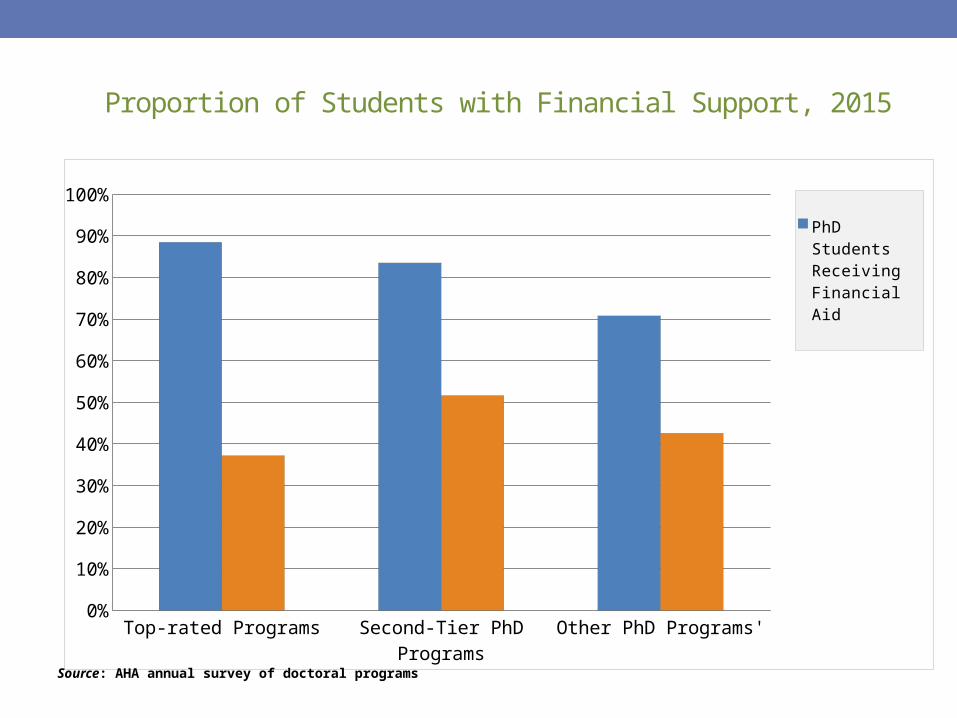
Proportion of Students with Financial Support, 2015
Top-rated Programs Second-Tier PhD Programs
Other PhD Programs'0%
10%
20%
30%
40%
50%
60%
70%
80%
90%
100%PhD Students Receiving Fi-nancial Aid
PhD Students as TAs
Source: AHA annual survey of doctoral programs
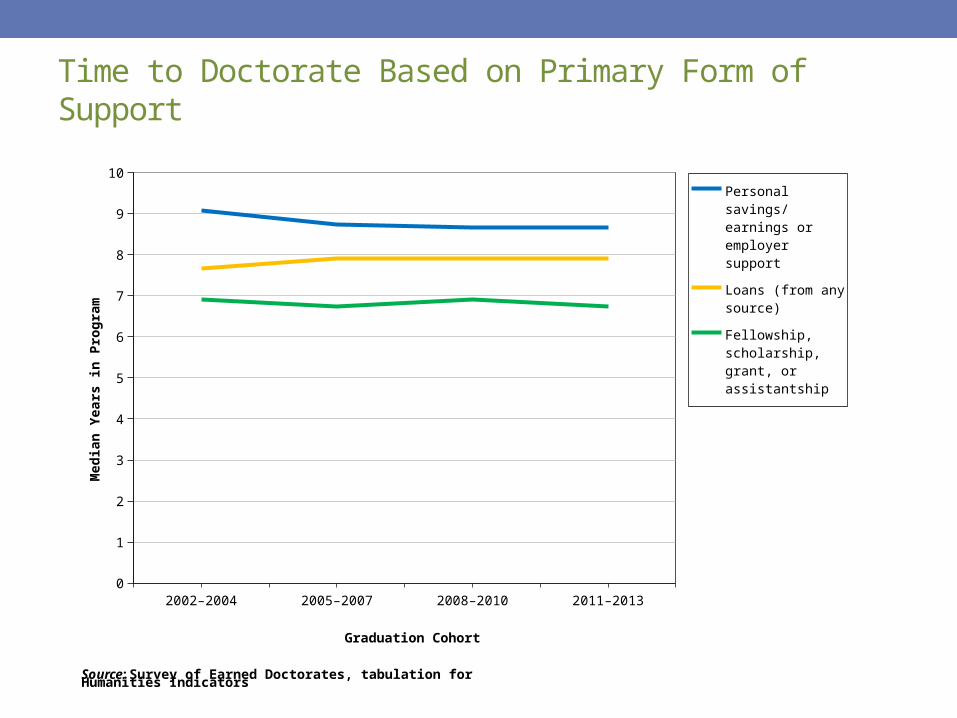
Time to Doctorate Based on Primary Form of Support
Personal or familysavings or earnings
Fellowship, scholarship, or grant
2002–2004 2005–2007 2008–2010 2011–20130
1
2
3
4
5
6
7
8
9
10
Personal savings/earnings or employer support
Loans (from any source)
Fellowship, schol-arship, grant, or assistantship
Graduation Cohort
Med
ian
Year
s in
Pro
gram
Source: Survey of Earned Doctorates, tabulation for Humanities Indicators
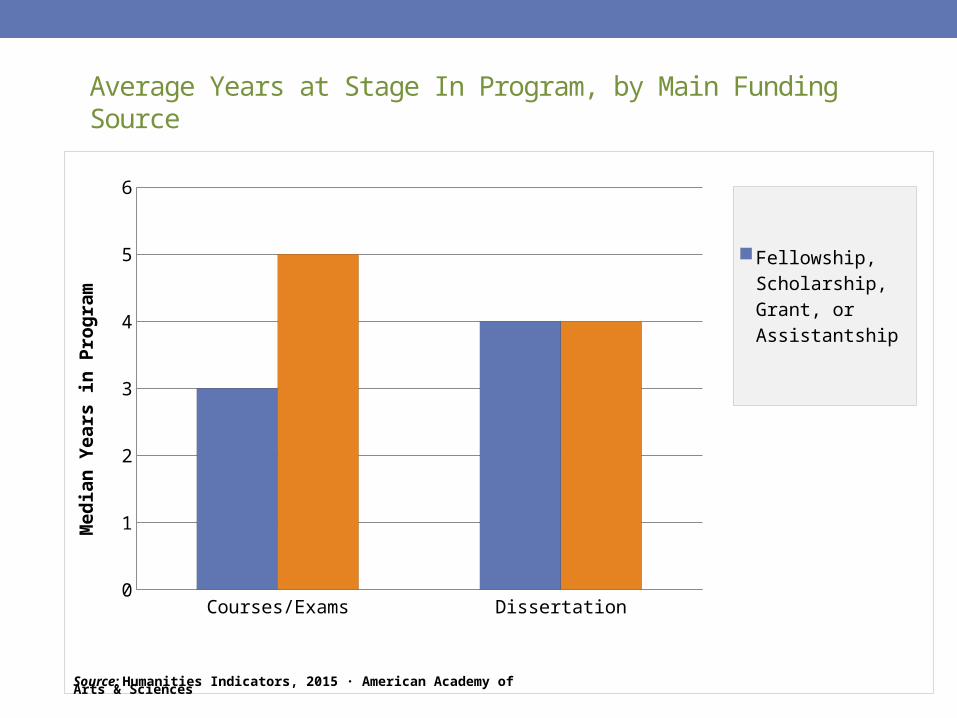
Average Years at Stage In Program, by Main Funding Source
Courses/Exams Dissertation0
1
2
3
4
5
6Fellowship, Scholarship, Grant, or As-sistantship Personal Sav-ings/Earnings or Employer Sup-port
Med
ian
Year
s in
Prog
ram
Source: Humanities Indicators, 2015 · American Academy of Arts & Sciences
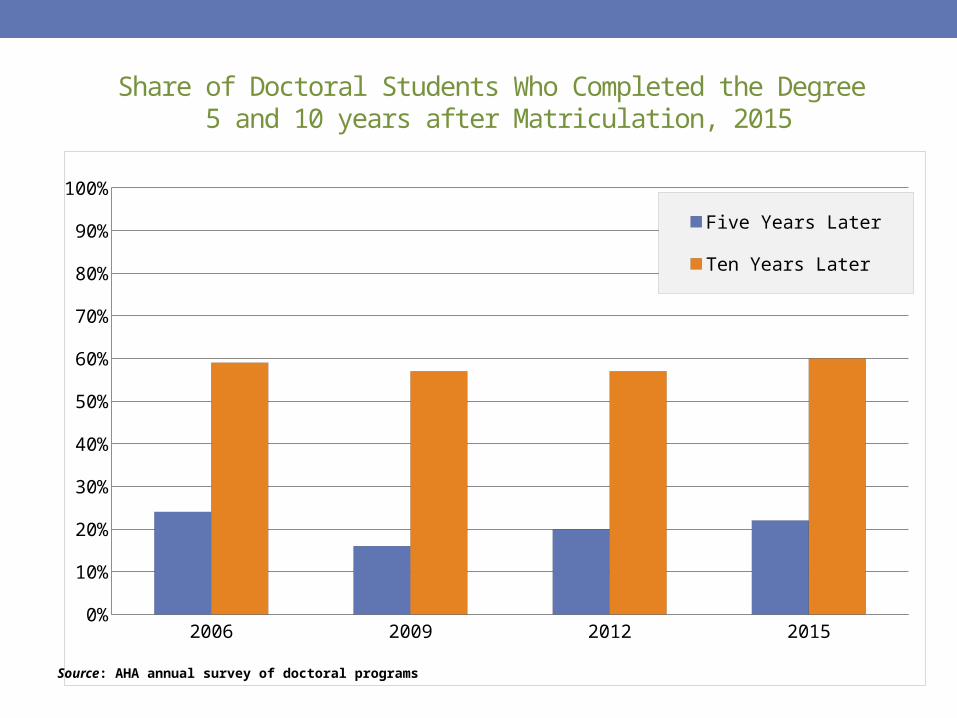
Share of Doctoral Students Who Completed the Degree 5 and 10 years after Matriculation, 2015
2006 2009 2012 20150%
10%
20%
30%
40%
50%
60%
70%
80%
90%
100%Five Years Later
Ten Years Later
Source: AHA annual survey of doctoral programs
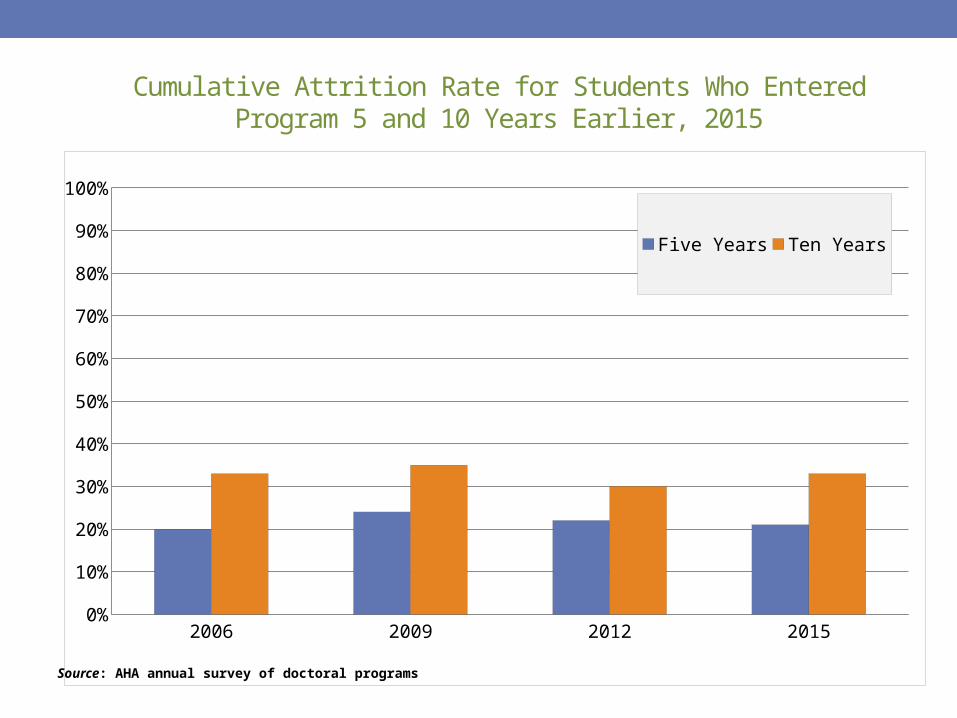
Cumulative Attrition Rate for Students Who Entered Program 5 and 10 Years Earlier, 2015
2006 2009 2012 20150%
10%
20%
30%
40%
50%
60%
70%
80%
90%
100%
Five Years Ten Years
Source: AHA annual survey of doctoral programs
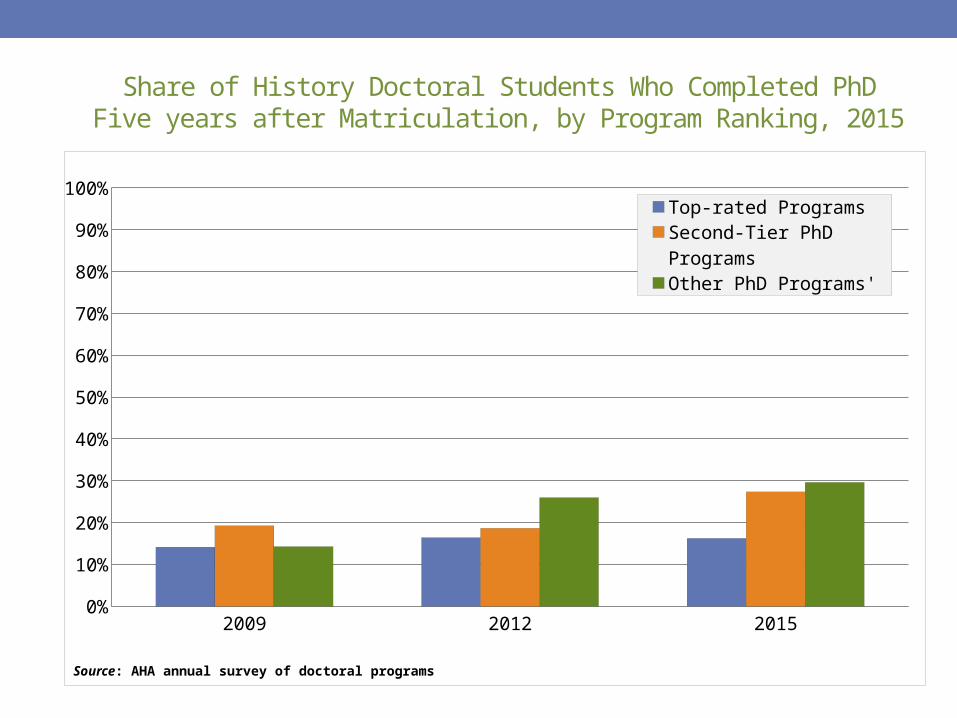
Share of History Doctoral Students Who Completed PhD Five years after Matriculation, by Program Ranking, 2015
2009 2012 20150%
10%
20%
30%
40%
50%
60%
70%
80%
90%
100%Top-rated ProgramsSecond-Tier PhD ProgramsOther PhD Programs'
Source: AHA annual survey of doctoral programs

Outcomes for History PhDs
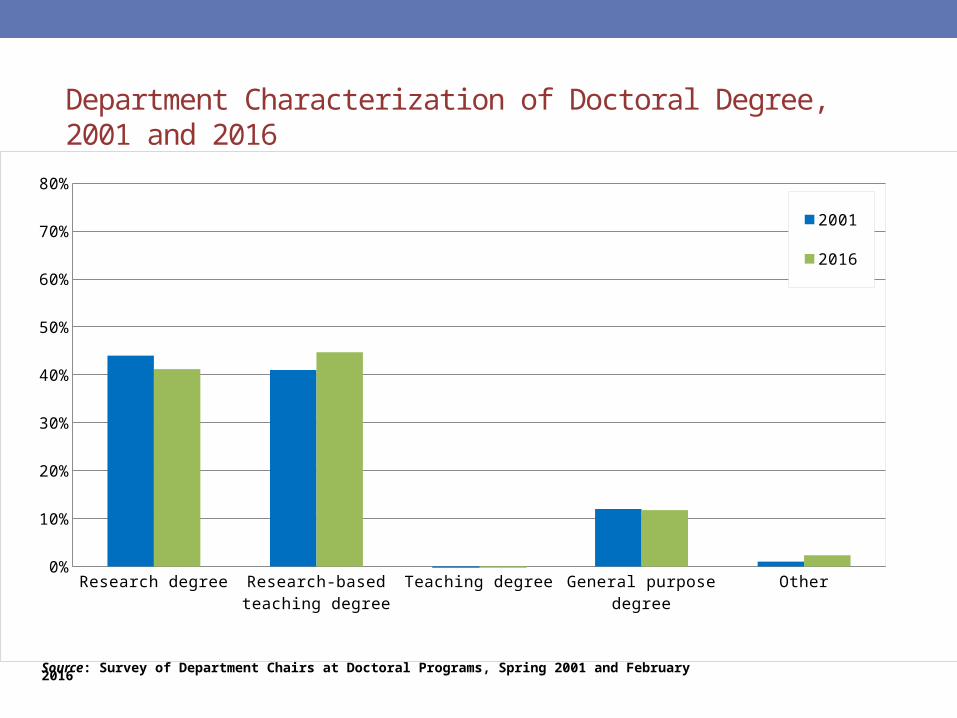
Department Characterization of Doctoral Degree, 2001 and 2016
Research degree Research-based teaching degree
Teaching degree General purpose degree
Other0%
10%
20%
30%
40%
50%
60%
70%
80%
2001
2016
Source: Survey of Department Chairs at Doctoral Programs, Spring 2001 and February 2016
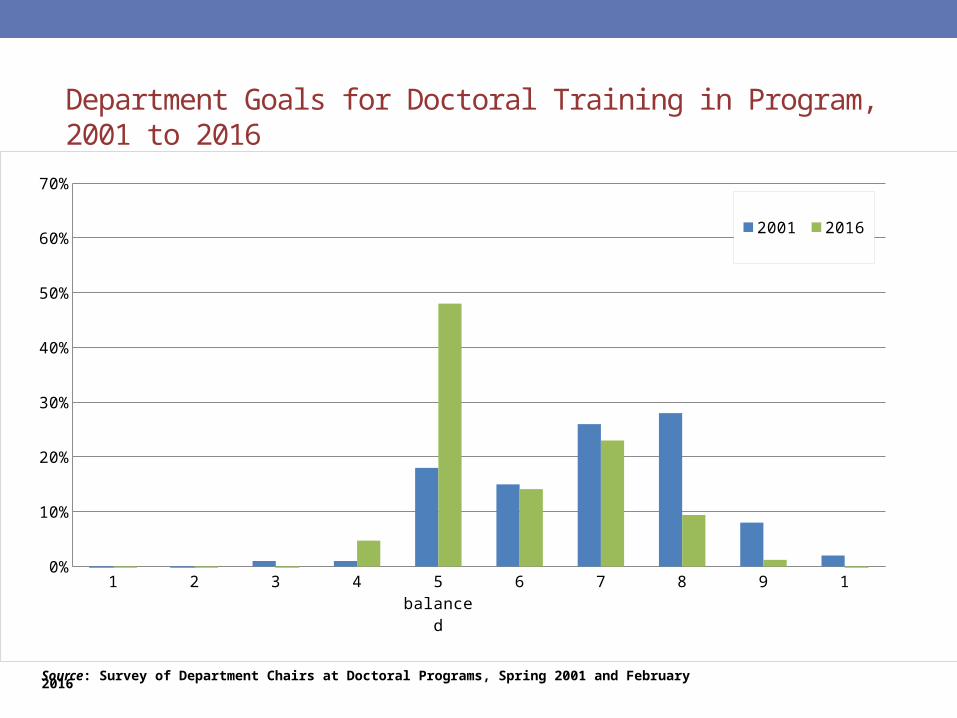
Department Goals for Doctoral Training in Program, 2001 to 2016
1no re-
search,all teach-
ing
2 3 4 5balanced
6 7 8 9 10no teach-
ing,all re-search
0%
10%
20%
30%
40%
50%
60%
70%
2001 2016
Source: Survey of Department Chairs at Doctoral Programs, Spring 2001 and February 2016
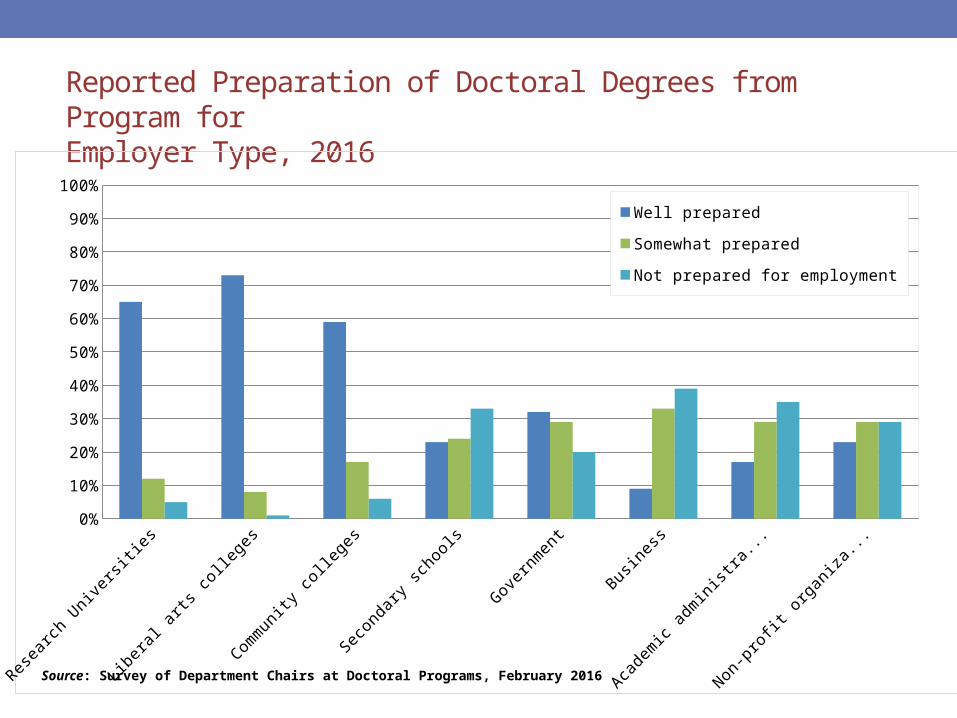
Reported Preparation of Doctoral Degrees from Program for Employer Type, 2016
Researc
h Univ
ersitie
s
Libera
l arts c
ollege
s
Commun
ity col
leges
Secon
dary
schoo
ls
Governm
ent
Busine
ss
Academ
ic adm
inistra
tion
Non-pr
ofit o
rganiz
ation
0%10%20%30%40%50%60%70%80%90%
100%Well preparedSomewhat preparedNot prepared for employment
Source: Survey of Department Chairs at Doctoral Programs, February 2016
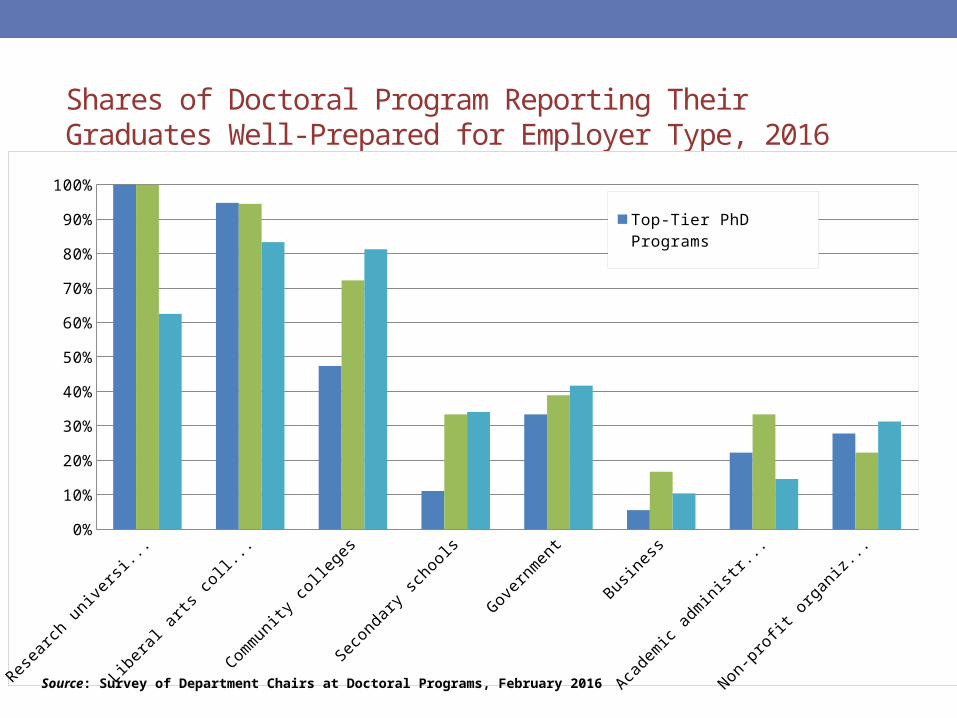
Shares of Doctoral Program Reporting Their Graduates Well-Prepared for Employer Type, 2016
Researc
h univ
ersitie
s
Libera
l arts c
ollege
s
Commun
ity col
leges
Secon
dary
schoo
ls
Governm
ent
Busine
ss
Academ
ic adm
inistra
...
Non-pr
ofit o
rganiz
ation
s0%
10%
20%
30%
40%
50%
60%
70%
80%
90%
100%Top-Tier PhD ProgramsSecond-Tier PhD ProgramsOther PhD Programs
Source: Survey of Department Chairs at Doctoral Programs, February 2016
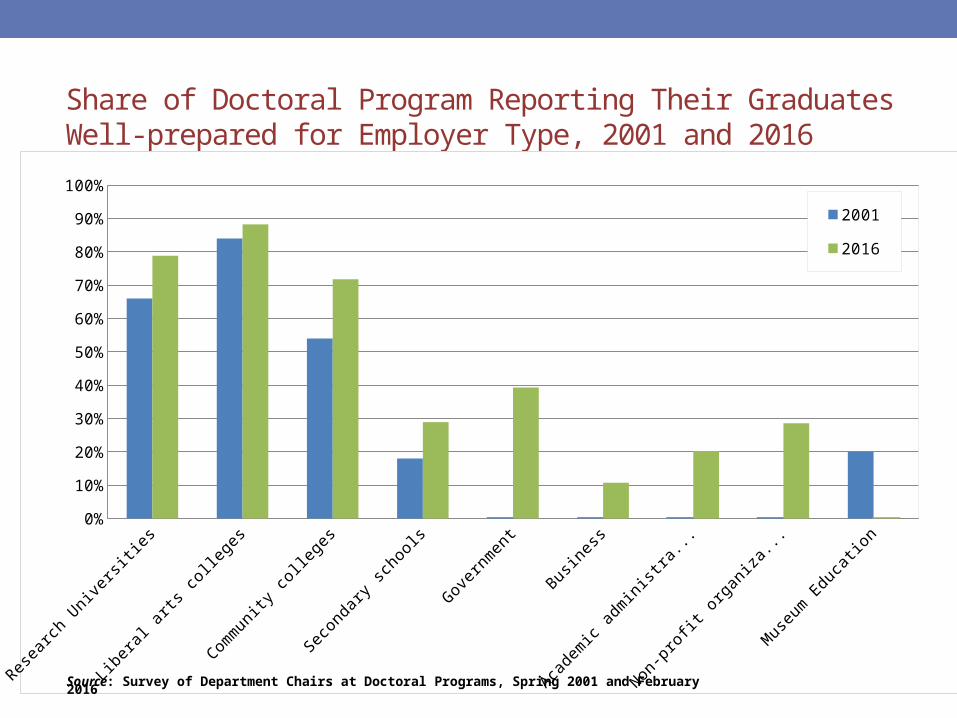
Share of Doctoral Program Reporting Their Graduates Well-prepared for Employer Type, 2001 and 2016
0%10%20%30%40%50%60%70%80%90%
100%20012016
Source: Survey of Department Chairs at Doctoral Programs, Spring 2001 and February 2016
2-Year Non-tenure Track3.1%
2-Year Tenure Track2.4%
4-Year Non-tenure Track14.8%
4-Year Tenure Track50.7%
Academic Administration3.3%
Business3.0%
Federal Government3.2%
Independent Scholar2.2%
K-122.9%
1.4%Non-Profit
3.3%Publishing/ Editing
0.6%Researcher
0.6%State/ Local Government
0.8%
Other0.4%
Library, Museum. Archive,
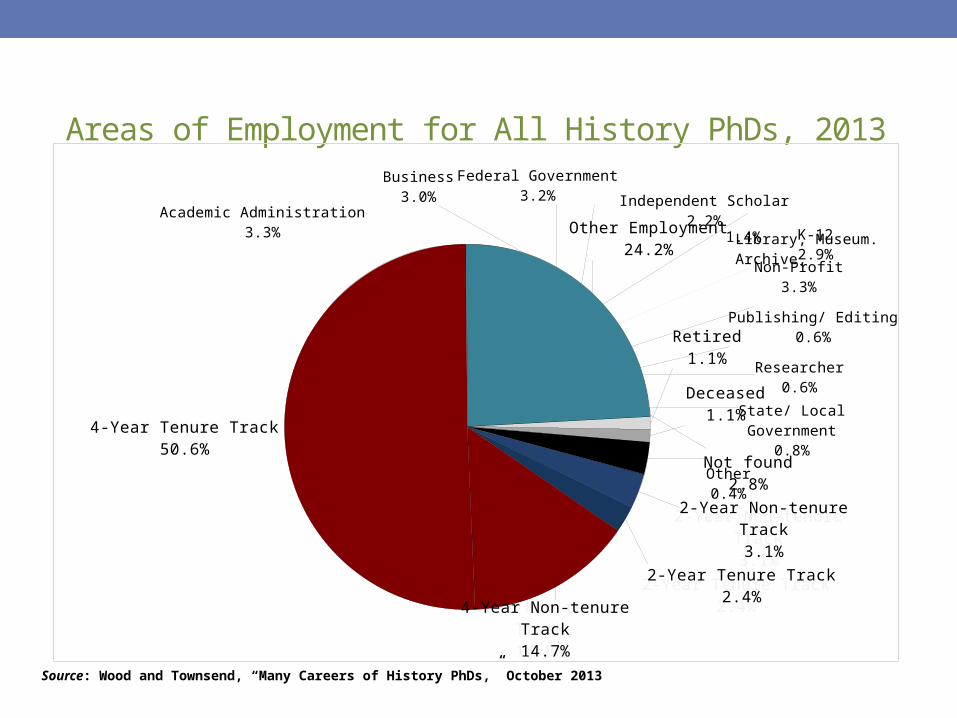
Areas of Employment for All History PhDs, 2013
2-Year Non-tenure Track3.1%
2-Year Tenure Track2.4%
4-Year Non-tenure Track14.7%
4-Year Tenure Track50.6%
Other Employment24.2%
Retired1.1%
Deceased1.1%
Not found2.8%
Source: Wood and Townsend, “Many Careers of History PhDs,” October 2013
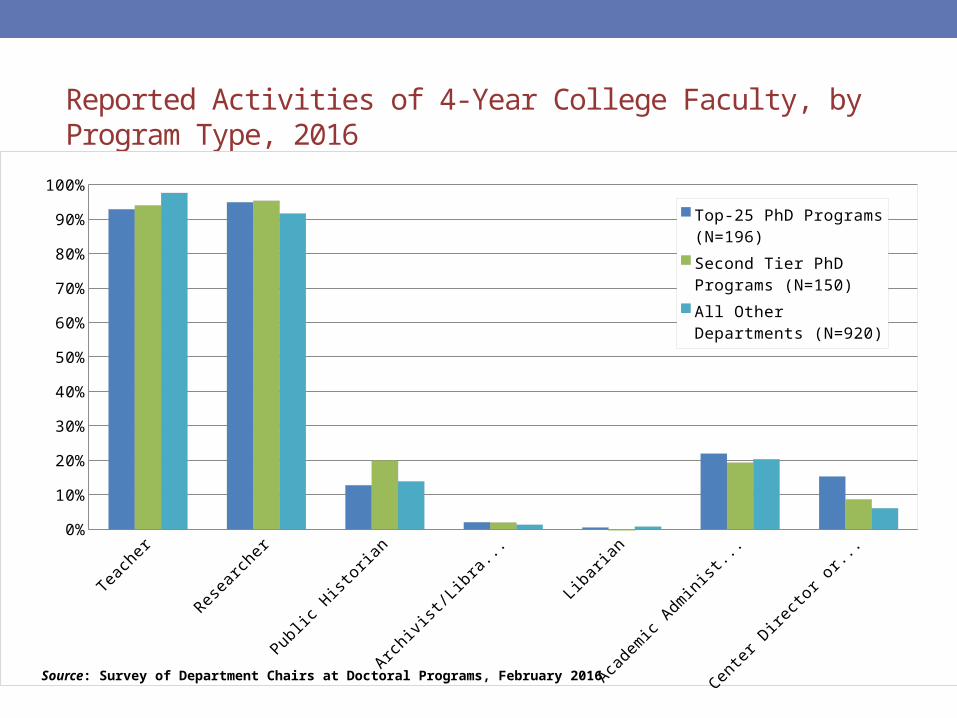
Reported Activities of 4-Year College Faculty, by Program Type, 2016
Teach
er
Researc
her
Public
Historia
n
Archivis
t/Libr
arian
Libari
an
Academ
ic Adm
inistra
tor
Center
Directo
r or S
taff0%
10%
20%
30%
40%
50%
60%
70%
80%
90%
100%Top-25 PhD Programs (N=196)Second Tier PhD Programs (N=150)All Other Departments (N=920)
Source: Survey of Department Chairs at Doctoral Programs, February 2016

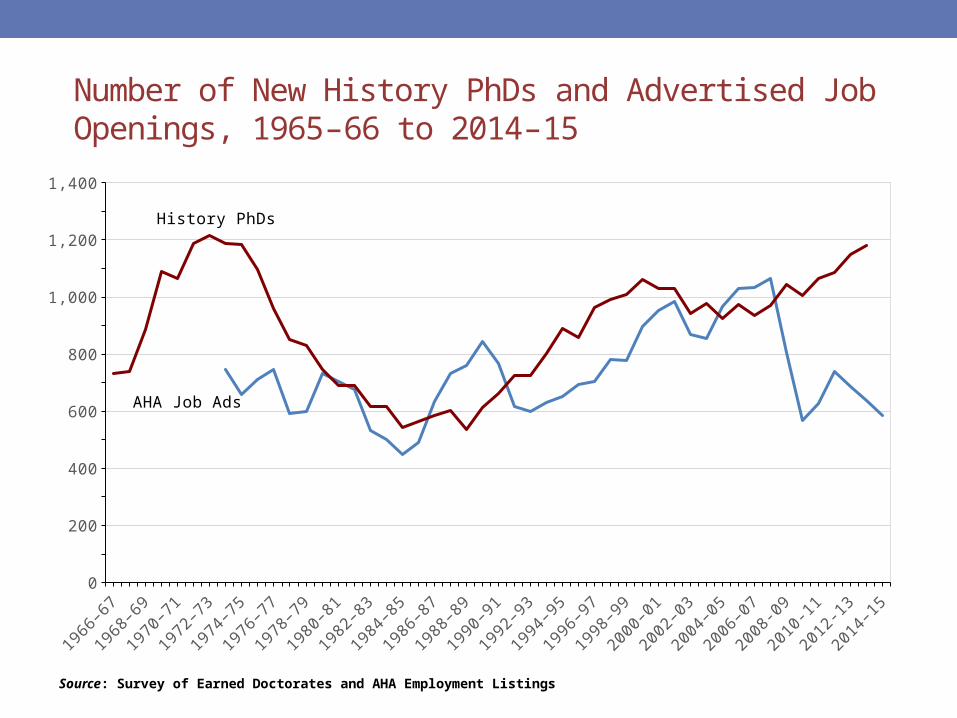
Number of New History PhDs and Advertised Job Openings, 1965–66 to 2014–15
1966
–67
1968
–69
1970
–71
1972
–73
1974
–75
1976
–77
1978
–79
1980
–81
1982
–83
1984
–85
1986
–87
1988
–89
1990
–91
1992
–93
1994
–95
1996
–97
1998
–99
2000
–01
2002
–03
2004
–05
2006
–07
2008
-09
2010
-11
2012
-13
2014
–15
0
200
400
600
800
1,000
1,200
1,400
AHA Job Ads
History PhDs
Source: Survey of Earned Doctorates and AHA Employment Listings
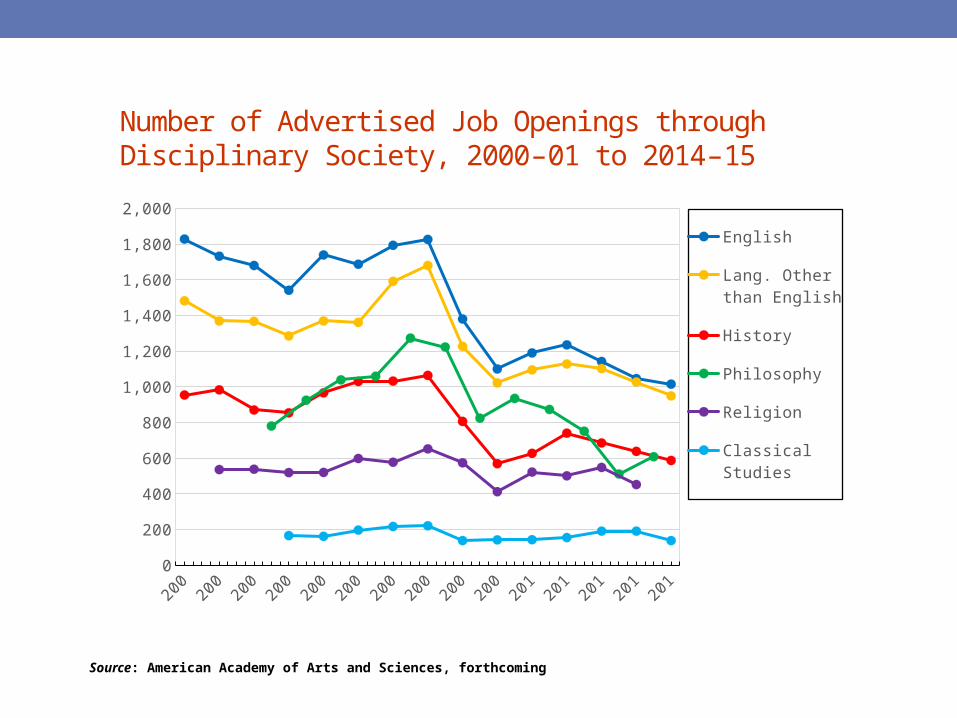
Number of Advertised Job Openings through Disciplinary Society, 2000–01 to 2014–15
2000
–01
2001
–02
2002
–03
2003
–04
2004
–05
2005
–06
2006
–07
2007
–08
2008
-09
2009
-10
2010
-11
2011
-12
2012
-13
2013
-14
2014
-150
200
400
600
800
1,000
1,200
1,400
1,600
1,800
2,000
English
Lang. Other than English
History
Philosophy
Religion
Classical Stud-ies
Source: American Academy of Arts and Sciences, forthcoming
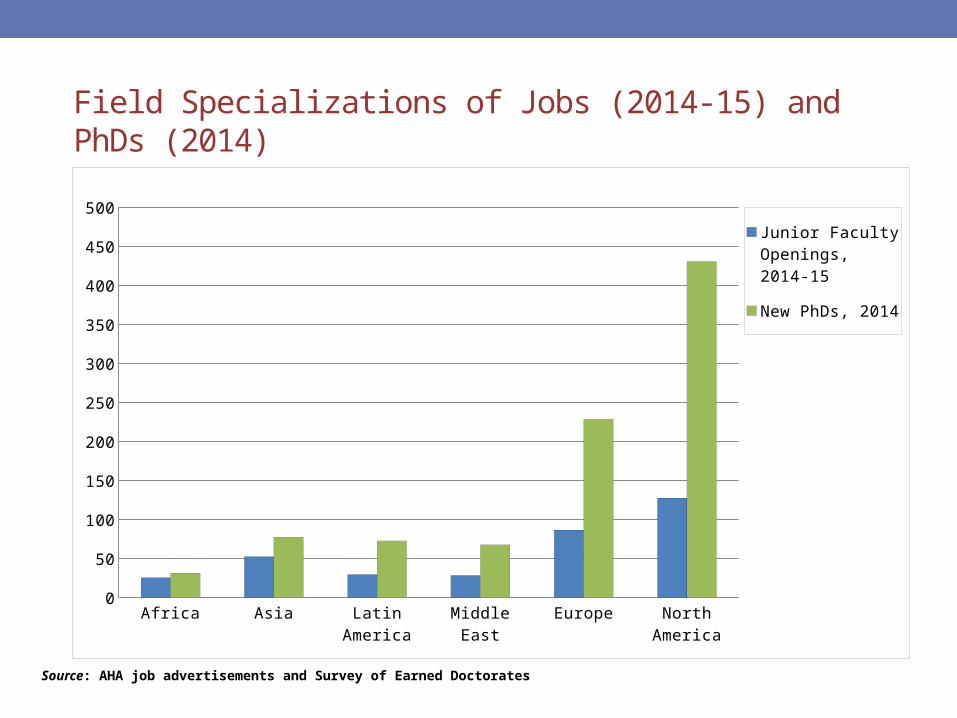
Field Specializations of Jobs (2014-15) and PhDs (2014)
Africa Asia Latin America Middle East Europe North America0
50
100
150
200
250
300
350
400
450
500Junior Faculty Openings, 2014-15
New PhDs, 2014
Source: AHA job advertisements and Survey of Earned Doctorates
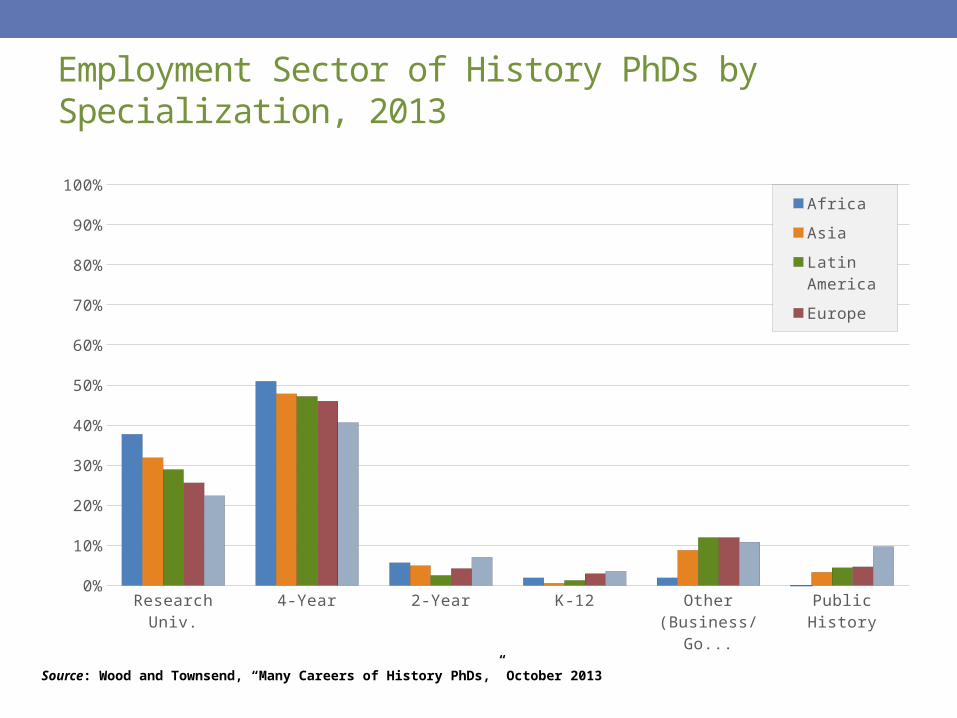
Employment Sector of History PhDs by Specialization, 2013
Research Univ. 4-Year 2-Year K-12 Other (Business/
Gov't)
Public History0%
10%
20%
30%
40%
50%
60%
70%
80%
90%
100%AfricaAsiaLatin AmericaEuropeNorth Amer-ica
Source: Wood and Townsend, “Many Careers of History PhDs,” October 2013
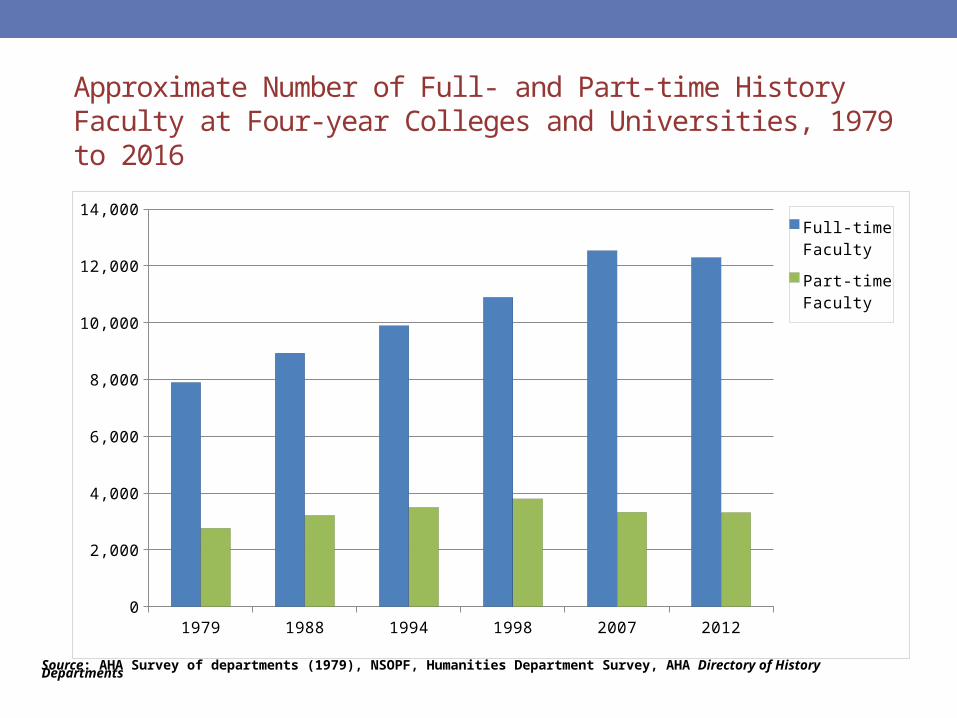
Approximate Number of Full- and Part-time History Faculty at Four-year Colleges and Universities, 1979 to 2016
1979 1988 1994 1998 2007 20120
2,000
4,000
6,000
8,000
10,000
12,000
14,000Full-time FacultyPart-time Faculty
Source: AHA Survey of departments (1979), NSOPF, Humanities Department Survey, AHA Directory of History Departments

Trend in History Majors, 1966 to 2014
1966
1968
1970
1972
1974
1976
1978
1980
1982
1984
1986
1988
1990
1992
1994
1996
1998
2000
2002
2004
2006
2008
2010
2012
2014
0
5,000
10,000
15,000
20,000
25,000
30,000
35,000
40,000
45,000
50,000
0
1
2
3
4
5
6
Bachelor's Degrees
As a Percentage of All Bachelor's Degrees
Com
plet
ions
Perc
ent
Source: Humanities Indicators, 2016
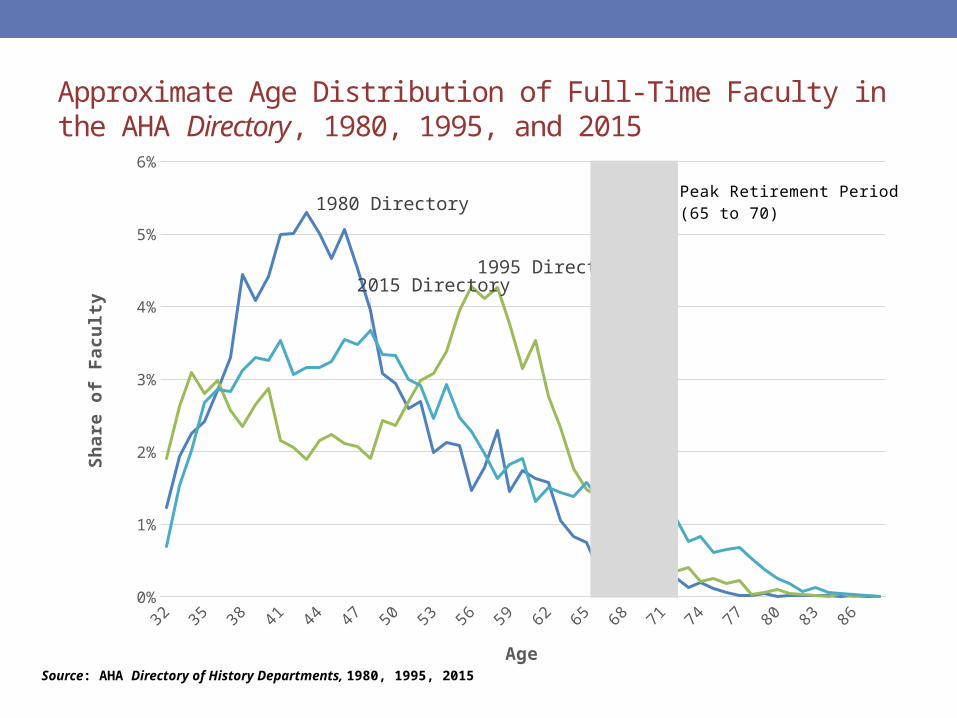
Approximate Age Distribution of Full-Time Faculty in the AHA Directory, 1980, 1995, and 2015
32 34 36 38 40 42 44 46 48 50 52 54 56 58 60 62 64 66 68 70 72 74 76 78 80 82 84 86 880%
1%
2%
3%
4%
5%
6%
1980 Directory
1995 Directory2015 Directory
Age
Shar
e of
Fac
ulty
Peak Retirement Period(65 to 70)
Source: AHA Directory of History Departments, 1980, 1995, 2015
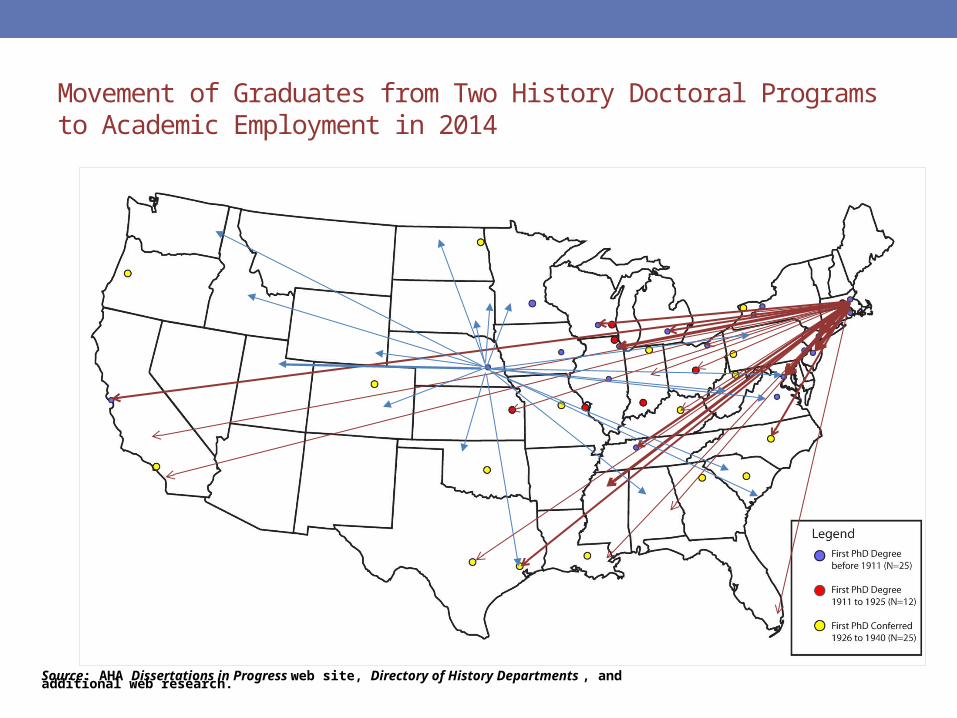
Movement of Graduates from Two History Doctoral Programs to Academic Employment in 2014
Source: AHA Dissertations in Progress web site, Directory of History Departments , and additional web research.
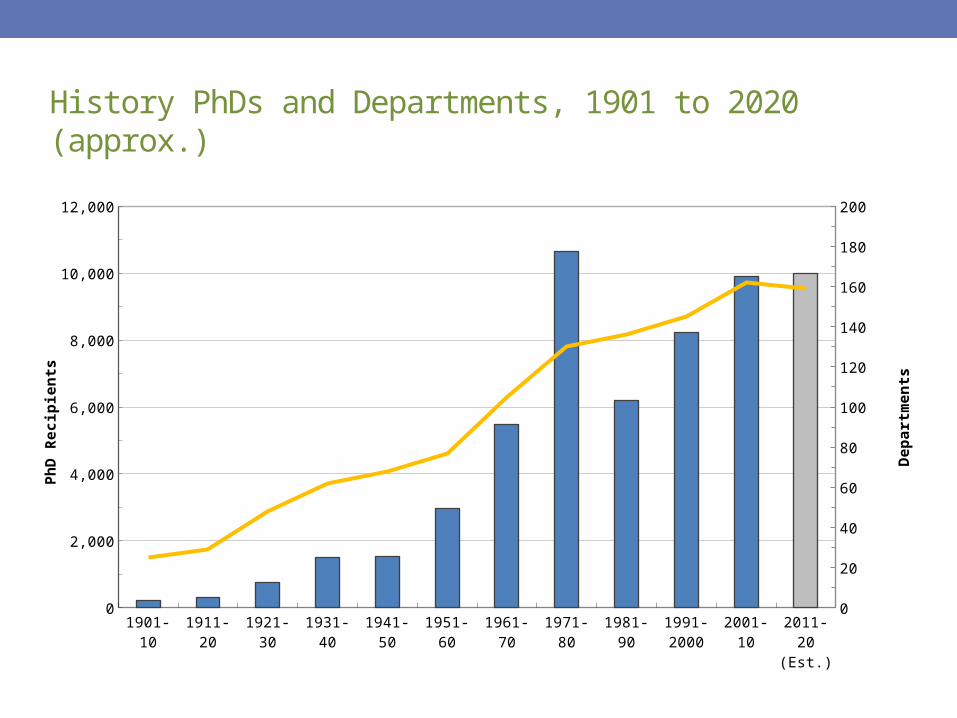
History PhDs and Departments, 1901 to 2020 (approx.)
1901-10
1911-20
1921-30
1931-40
1941-50
1951-60
1961-70
1971-80
1981-90
1991-2000
2001-10
2011-20
(Est.)
0
2,000
4,000
6,000
8,000
10,000
12,000
0
20
40
60
80
100
120
140
160
180
200
PhD
Rec
ipie
nts
Dep
artm
ents
Number of New History PhDs and Advertised Job Openings, 1965–66 to 2014–15
1966
–67
1968
–69
1970
–71
1972
–73
1974
–75
1976
–77
1978
–79
1980
–81
1982
–83
1984
–85
1986
–87
1988
–89
1990
–91
1992
–93
1994
–95
1996
–97
1998
–99
2000
–01
2002
–03
2004
–05
2006
–07
2008
-09
2010
-11
2012
-13
2014
–15
0
200
400
600
800
1,000
1,200
1,400
AHA Job Ads
History PhDs
Source: Survey of Earned Doctorates and AHA Employment Listings

Digital History
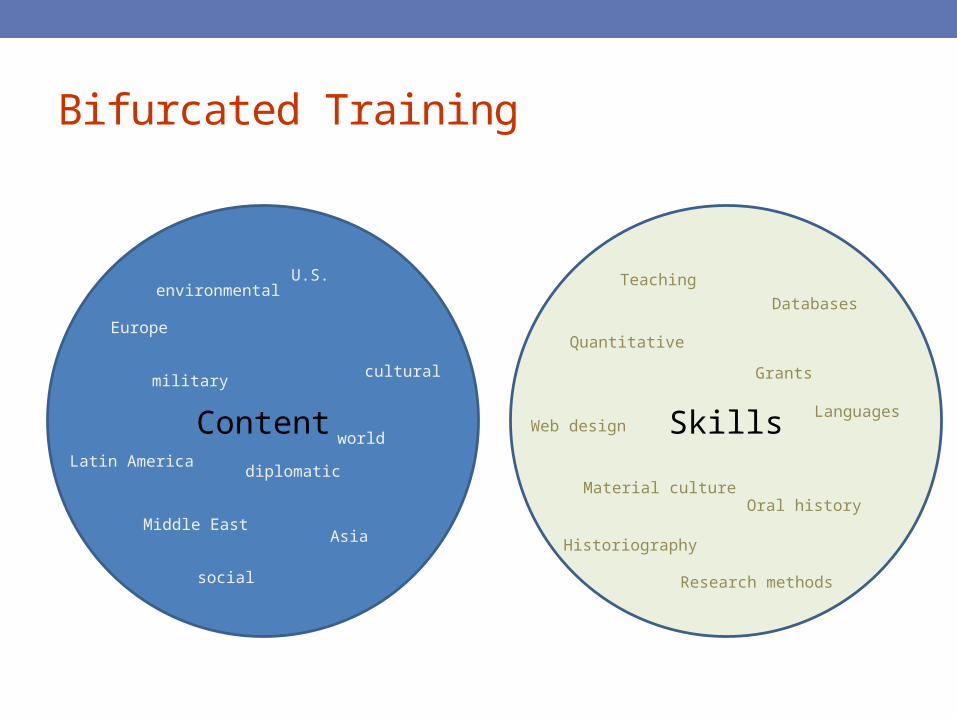
Bifurcated Training
Content Skills
Quantitative
Web designLanguages
Databases
Material culture
Europe
Latin America
U.S.
social
cultural
environmental
AsiaMiddle East
world
diplomatic
military
Oral history
Historiography
Research methods
Teaching
Grants
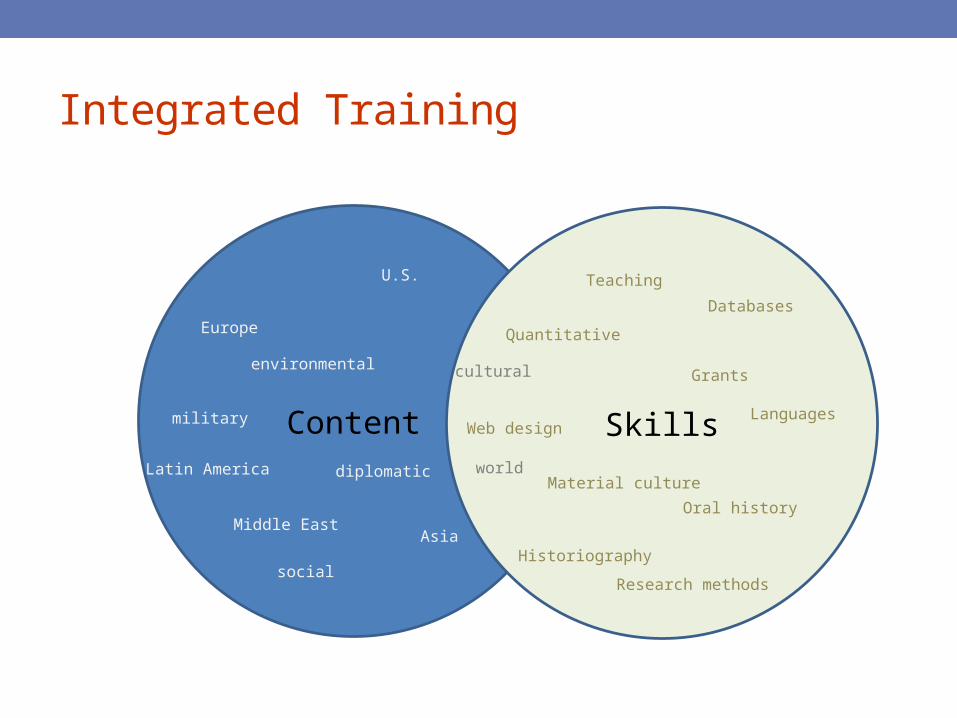
Integrated Training
Content Skills
Quantitative
Web designLanguages
Databases
Material culture
Europe
Latin America
U.S.
social
culturalenvironmental
AsiaMiddle East
worlddiplomatic
military
Oral history
Historiography
Research methods
Teaching
Grants
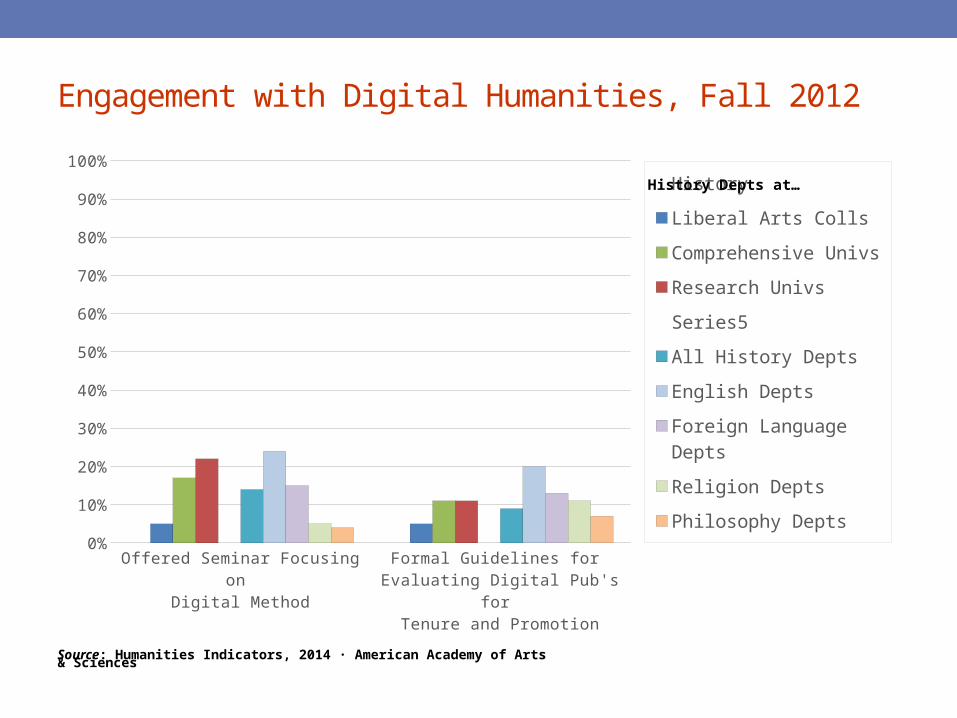
Engagement with Digital Humanities, Fall 2012
Offered Seminar Focusing on Digital Method
Formal Guidelines for Evaluating Digital Pub's for
Tenure and Promotion
0%
10%
20%
30%
40%
50%
60%
70%
80%
90%
100%HistoryLiberal Arts CollsComprehensive UnivsResearch UnivsSeries5All History DeptsEnglish DeptsForeign Language DeptsReligion DeptsPhilosophy Depts
History Depts at…
Source: Humanities Indicators, 2014 · American Academy of Arts & Sciences

Technology Used for Research, 2010 and 2015
Scanners and/or digital
cameras
Spreadsheets Citation software
Databases Geographical Information
Systems
Statistical analysis software
Text Mining software
0%
10%
20%
30%
40%
50%
60%
70%
80%
90%
100%20102015

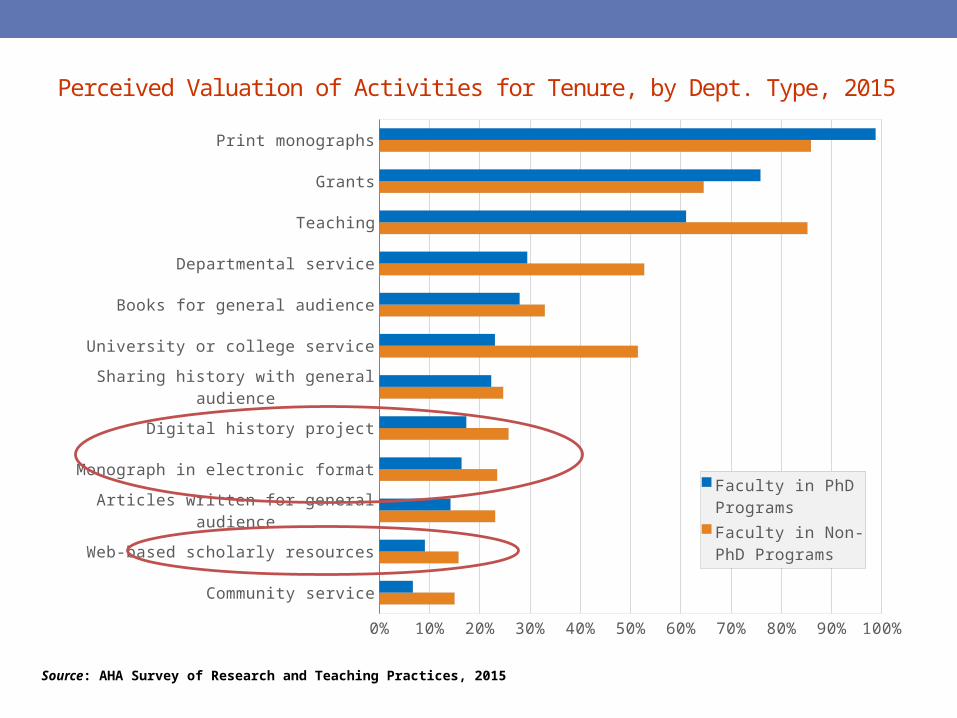
Perceived Valuation of Activities for Tenure, by Dept. Type, 2015
Community service
Web-based scholarly resources
Articles written for general audience
Monograph in electronic format
Digital history project
Sharing history with general audience
University or college service
Books for general audience
Departmental service
Teaching
Grants
Print monographs
0% 10% 20% 30% 40% 50% 60% 70% 80% 90% 100%
Faculty in PhD ProgramsFaculty in Non-PhD Programs
Source: AHA Survey of Research and Teaching Practices, 2015

Why Historians Choose Not to Publish Online, 2010 and 2015
I worry that whatever I published would quickly become obsolete
My institution does not provide the support needed to create new forms of scholarship
There is no career benefit to adopting new technologies at my institution
I have not found an appropriate publisher
It is difficult enough to write an article or book for print publication.
I doubt it would improve the article/book
Online publication lacks the scholarly recognition/prestige of print publications
0% 10% 20% 30% 40% 50% 60% 70% 80%
20102015
Source: AHA Survey of Research and Teaching Practices, 2010 and 2015
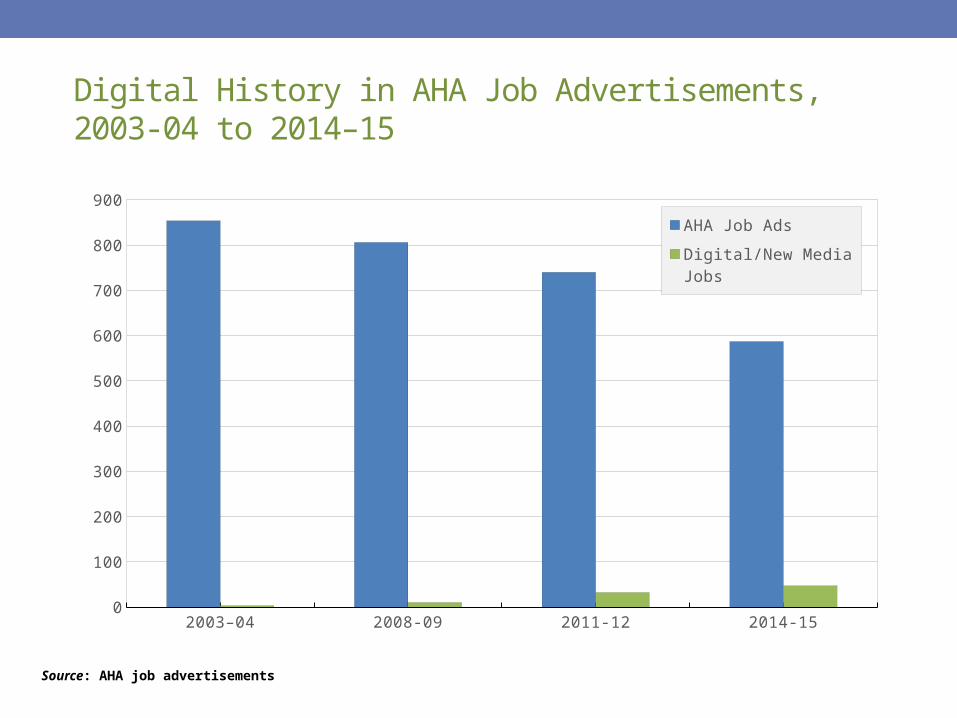
Digital History in AHA Job Advertisements, 2003-04 to 2014–15
2003–04 2008-09 2011-12 2014-150
100
200
300
400
500
600
700
800
900
AHA Job Ads
Digital/New Media Jobs
Source: AHA job advertisements
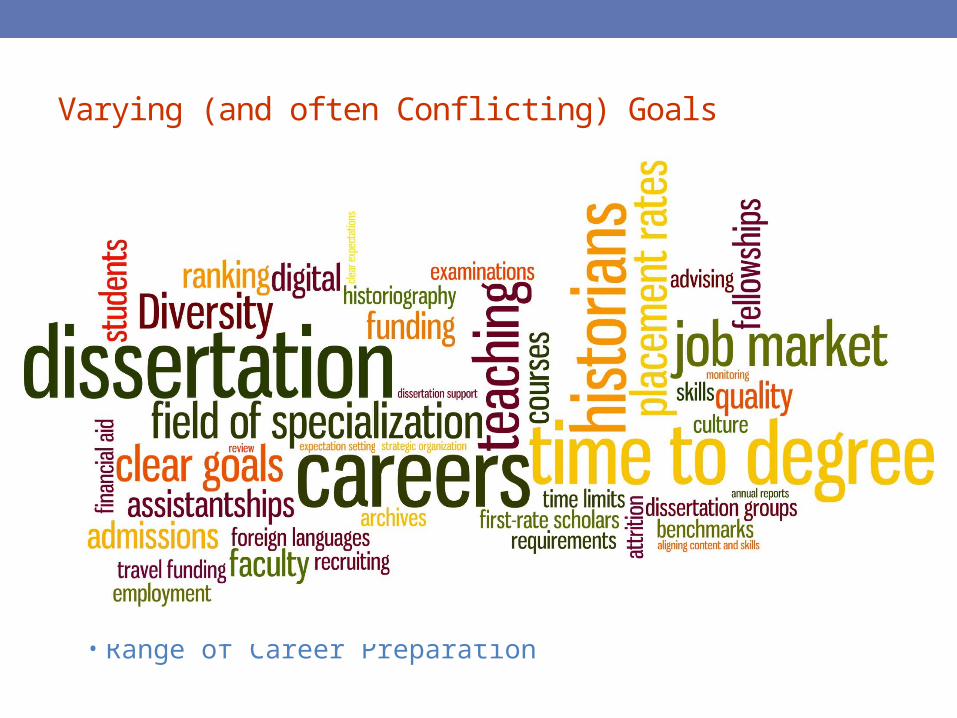
Varying (and often Conflicting) Goals
• Quality of Preparation • preparing “first-rate” scholars regardless of outcomes?
• Placement Rates• Placing into Research I programs?
• Time to Degree• Reducing time in program to five years?
• Department Ranking• Emphasizing published output by faculty
• Lowered Attrition Rates
• Range of Career Preparation
Visit my current project at www.HumanitiesIndicators.org
And contact me with specific questions at: [email protected] or on Twitter @rbthisted