rethinking rural livelihoods in afghanistan
TRANSCRIPT

RethinkingRural Livelihoods
in Afghanistan
Synthesis Paper Series
Jo Grace and Adam Pain
June 2004
Afghanistan Research and Evaluation Unit
Synthesis Paper Series
RethinkingRural Livelihoods in
Afghanistan
Jo Grace and Adam Pain
Funding for this study wasprovided by the EuropeanCommission (EC)
July 2004

© 2004 The Afghanistan Research and Evaluation Unit (AREU). All rights reserved.

About the Authors
Jo Grace is the Rural Livelihoods Monitoring Research Project Team Leader at the AfghanistanResearch and Evaluation Unit (AREU). She has been working on AREU’s rural livelihoodsresearch project since 2002. She has a master’s degree in gender analysis in developmentwith a focus on livelihoods from the University of East Anglia, UK. Previous research exploredpeople’s perceptions of women’s rights to land in Madhya Pradesh, India. Ms. Grace alsodesigned and coordinated a research project on men’s perception of female developmentin Tamil Nadu, south India.
Adam Pain is a research fellow at the School of Development Studies, University of EastAnglia, UK, where he was a faculty member between 1976 and 1987. He has been workingin Afghanistan since February 2001 for various agencies, including AREU and the livelihoodsresearch project. He has been working in the Himalayan region since 1992.
About the Afghanistan Research andEvaluation Unit (AREU)
The Afghanistan Research and Evaluation Unit (AREU) is an independent research organisationthat conducts and facilitates action-oriented research and learning that informs and influencespolicy and practice. AREU also actively promotes a culture of research and learning bystrengthening analytical capacity in Afghanistan and by creating opportunities for analysis,thought and debate. Fundamental to AREU’s vision is that its work should improve Afghanlives. AREU was established by the assistance community working in Afghanistan and has aboard of directors with representation from donors, UN and multilateral agencies and non-governmental organisations (NGOs).
Current core funding for AREU is provided by the United Nations Assistance Mission inAfghanistan (UNAMA) and the governments of Sweden and Switzerland.
Acknowledgements
This study is the result of a joint effort by the Afghanistan Research and Evaluation Unit(AREU) and seven partner NGOs: the Aga Khan Development Network (AKDN), CARE International(CARE), Coordination of Humanitarian Assistance (CHA), Ecumenical Office/Christian Aid(EOCA), Danish Committee for Aid to Afghan Refugees (DACAAR), German Agro Action/DeutscheWelthungerhilfe (GAA) and Mercy Corps (MC). The study would not have been possiblewithout the hard work of all of these organisations and their staff.
In addition, many thanks must go to AREU staff, particularly Asif Karimi and Aimal Ahmadzaifor their hard work and commitment, Alexia Coke for her constant advice, support andencouragement, Aftab Opel for his support and advice, and Brandy Bauer and Tom Mullerfor editing this publication. The authors are also indebted to the administrative and financeteam at AREU, particularly the drivers, for their help and support over the last 18-months.
We are also extremely grateful to the staff of the Afghanistan Information ManagementService (AIMS), particularly Masoud Andarabi, for their untiring work in building the researchdatabase.
Our thanks also go to all those who read an earlier version of this report and provided usefuland insightful comments.
We would also like to express our gratitude to the European Commission for enabling us toconduct this study. Without their funding and faith in the potential benefits of this research,this project may not have been possible.
Finally, to the people of the 21 villages studied, especially to the members of the 390households who allowed us and partner NGO staff into their homes, not once but two ormore times, we are very grateful for your hospitality and participation in the study. To thesepeople we are greatly indebted and we hope that this research will in some way be of benefitto them.
Table of Contents
Glossary ..................................................................................................iv
Executive Summary .....................................................................................1
Key findings, implications and recommendations .........................................1
1. Introduction .....................................................................................4
2. Context and Policy Issues .....................................................................6
2.1 Key policy areas .......................................................................7
2.1.1 Agriculture/NR Technical Annex............................................72.1.2 LSP Technical Annex..........................................................8
3. Methods.........................................................................................10
3.1 Project stages.........................................................................103.2 Limitations ............................................................................14
4. Key Rural Livelihoods Findings ..............................................................17
4.1 Household grain budgets ............................................................174.2 Land ownership patterns............................................................204.3 Livestock ownership .................................................................254.4 Household income portfolios .......................................................27
4.4.1 Livelihoods diversity ........................................................284.4.2 Income sources ..............................................................31
4.5 Expenditure ...........................................................................354.6 Debts ...................................................................................38
4.6.1 Debts and change over time...............................................42
4.7 Differences between villages.......................................................454.7.1 Differences in village assets and history ................................454.7.2 Differential effects of policies and power structures .................454.7.3 Wealth differences between villages ....................................46
5. Conclusion: Key Implications and Recommendations....................................47
5.1 Social protection and livelihoods ..................................................47
5.1.1 Livelihood diversity .........................................................475.1.2 Non-farm labour.............................................................485.1.3 Labour migration ............................................................495.1.4 Indebtedness.................................................................495.1.5 Gender ........................................................................505.1.6 Health.........................................................................515.1.7 Social protection and the "poorest of the poor"........................52

5.2 Agriculture ............................................................................535.3 Livelihoods monitoring ..............................................................55
Appendices
Appendix 1: Village descriptions....................................................................57Appendix 2: Means of accessing grain .............................................................65Appendix 3: Household questionnaire .............................................................67
Acronyms and Abbreviations .........................................................................83
Bibliography ............................................................................................84
Tables
Table 1: Site characteristics.......................................................................11Table 2: Sample frame .............................................................................13Table 3: Access to wheat from farm production and the market by site,
village and wealth group ................................................................18Table 4: Percent of grain obtained from farm production by site ...........................20Table 5: Patterns of cultivation (percentage of households by wealth group) ............21Table 6: Land ownership: mean area (jeribs) by wealth group, WGIII as percent
total sample area and mean household area per village ...........................23Table 7: Percentage of joint ownership of land in landed households by site.............25Table 8: Mean number of sheep and goats owned by site, village and wealth group ....26Table 9: The most important income source ...................................................32Table 10: Non-resident member activities by wealth group ...................................33Table 11: Ranking of household expenditure.....................................................37Table 12: Percent of households with debts and weighted mean value of
cash debt by site, village and wealth group..........................................40Table 13: Source of loan by wealth groups with loans..........................................41Table 14: Changes in debt level: percent of households with debts and
the mean value of cash debts in Afs...................................................42Table 15: Changes in livestock holdings...........................................................44
Boxes
Box 1: Begging for grain ..............................................................................19Box 2: New terms of trade in carpet weaving ....................................................34Box 3: A business women in Faryab.................................................................35Box 4: Combinations of farm and non-farm labour in Saripul and Faryab ....................36Box 5: Health expenditure in Laghman and Herat ...............................................38Box 6: The politics of wood economy in a village in Laghman .................................46
Charts
Chart 1: Diagram of household activities from one poor household in Faryab, by season and gender................................................................30
Chart 2: Reasons for loans held by households by wealth groups .......................41

Maps
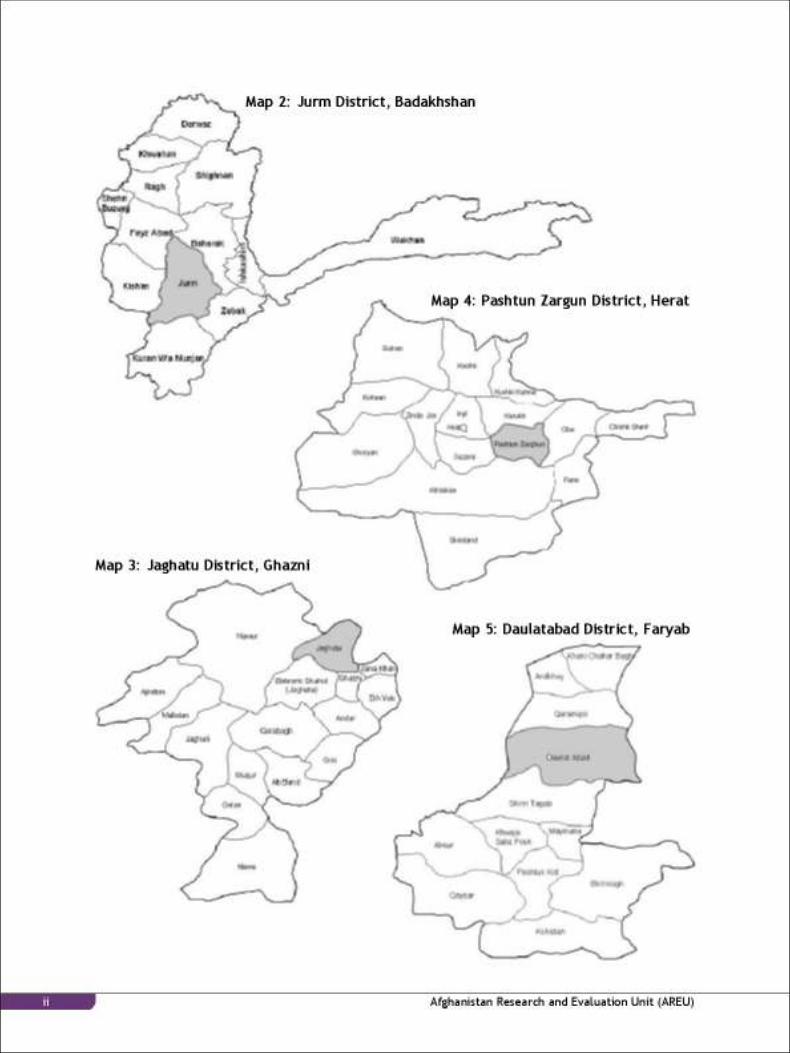
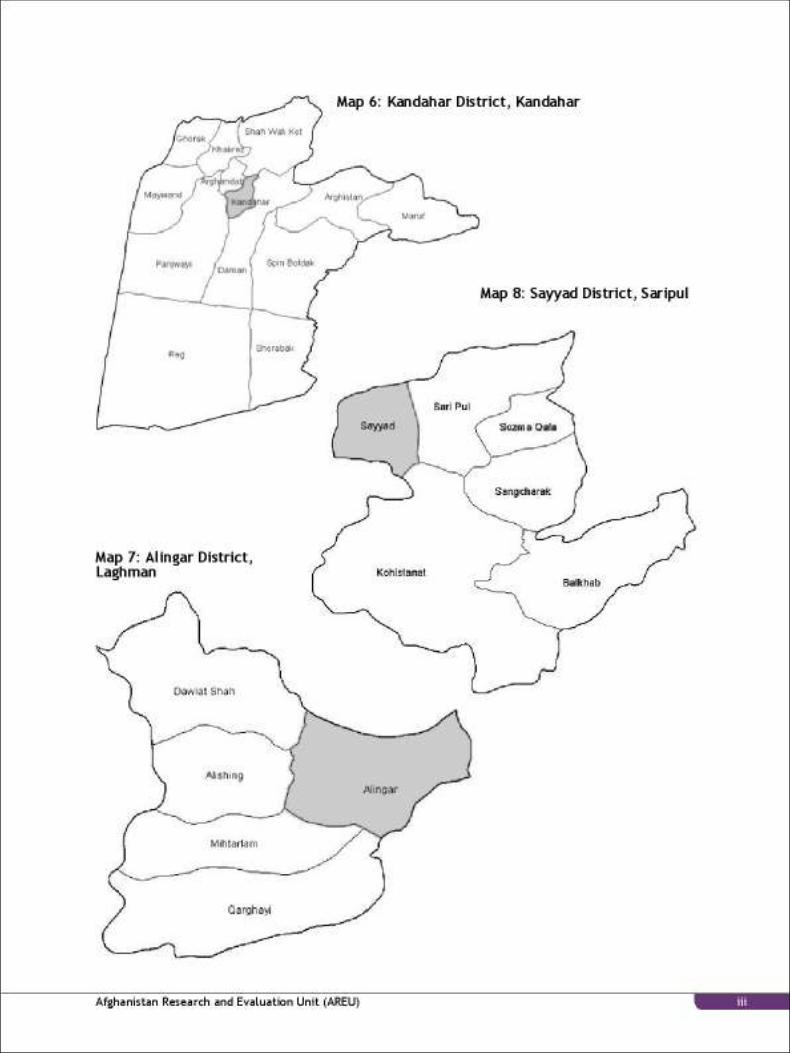
Map 1: Afghanistan ......................................................................................iMap 2: Jurm District, Badakhshan ....................................................................iiMap 3: Jaghatu District, Ghazni...................................................................... iiMap 4: Pashtun Zargun District, Herat...............................................................iiMap 5: Daulatabad District, Faryab ..................................................................iiMap 6: Kandahar District, Kandahar.................................................................iiiMap 7: Alingar District, Laghman ....................................................................iiiMap 8: Sayyad District, Saripul .......................................................................iii

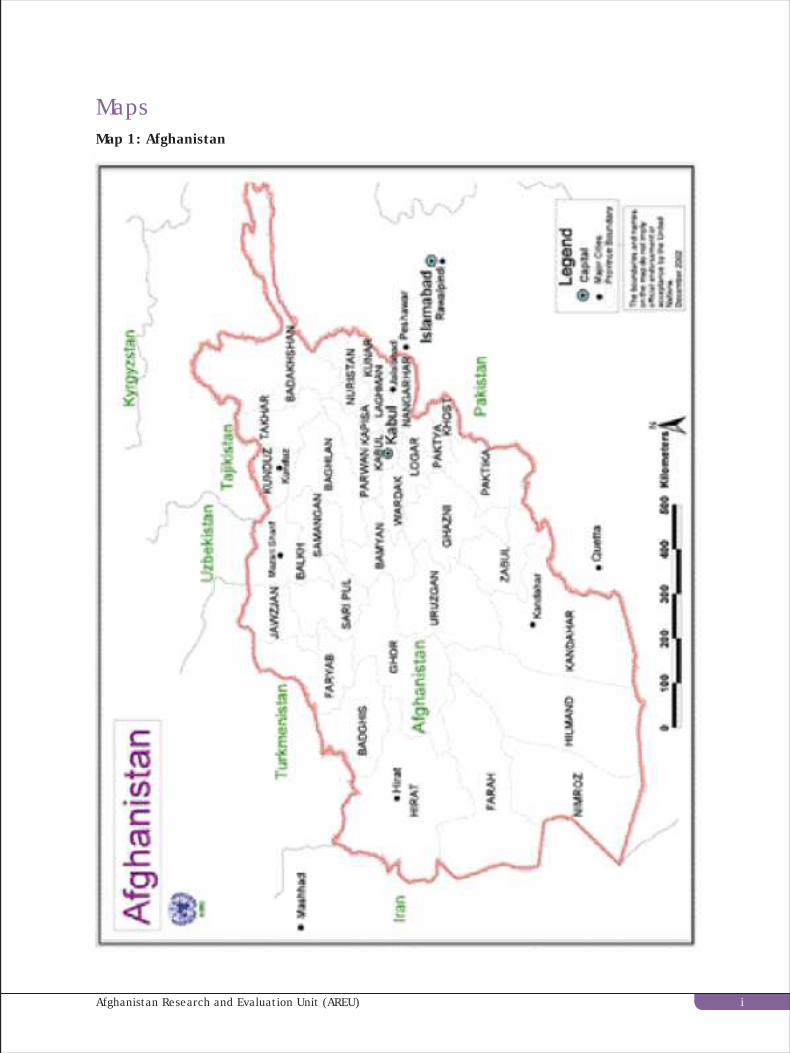
MapsMap 1: Afghanistan
Afghanistan Research and Evaluation Unit (AREU) i
Chronically poor those who are persistently below the poverty line
Financial assets stocks of cash, such as credit or savings that can be used to produce orpurchase goods
Gilims traditional Afghan flat weave rugs
Household smallest unit living in a compound; usually husband, wife and dependentchildren
Human assets the education and health level of individuals and populations
Jerib one jerib equals 2000 square metres
Kabuli Jerib this is the official government area of a jerib; the local unit of a jeribmay differ in terms of metric equivalence
Livelihood a livelihood is defined here as the assets, activities and access thatdetermine the living gained by an individual of a household
LSP CG the LSP CG facilitates interaction between government, donors, UNagencies and NGOs on livelihoods and social protection
Manteqa local domain, territory, area
MISFA this is a World Bank and MRRD initiative aimed at developing microfinanceservices in Afghanistan
Natural assets the natural resource base (e.g. land, water, trees) that yields productsused by human populations for their survival or income
NABDP this is a government led programme that aims to enable provincial anddistrict level institutions to implement national level priorities andprogrammes, and to provide a framework for public investment
NEEP this is a national programme that aims to generate person-days of minimumwage employment through labour-intensive public works in order toprotect the livelihoods of the poor
Non-farm labour labour that is not involved in agriculture
NRVA National Risk and Vulnerability Assessment
NSP this is a programme that aims to develop the abilities of communities toplan, manage, finance and monitor their own development programmesthrough strengthening local governance, building leadership within villagesand neighbourhoods and providing assistance for rehabilitation anddevelopment to communities
Glossary
Afghanistan Research and Evaluation Unit (AREU)iv

NSS this is a nationwide initiative involving UN, NGOs, donors and the Afghangovernment aimed at providing understanding of food security, vulnerability,nutrition and coping strategies among households in Afghanistan
Off-farm labour labour that is associated with agriculture but is not involved in cultivation,for example, crop processing
Physical assets assets brought into existence by economic production processes (e.g.,tools, machines, irrigation canals)
Seers seven kilograms
Shura village council
Social assets social networks people participate in, from which they can derive supportthat contributes to their livelihoods
Vulnerability high degree of exposure to risks, shocks and stress
Wuliswali district
Afghanistan Research and Evaluation Unit (AREU) v

This report presents the findings andimplications of an 18-month Rural LivelihoodsMonitoring Research Project. The AfghanistanResearch and Evaluation Unit (AREU) andseven partner non-governmental organisations(NGOs) implemented the research project,which involved the monitoring of 390households in 21 villages in seven districts inseven provinces. Information was gatheredat the village and household level on human,financial, physical and natural assets, withthe aim of building understanding of rurallivelihoods in Afghanistan and improving themonitoring and evaluation capacity of partnerNGOs. This summary presents the key findings,implications and recommendations from thisresearch.
Key findings, implications andrecommendations
Livelihoods diversityThe majority of households, both rich andpoor, have diversified income sources andmany are involved in a combination of farmand non-farm activities. For wealthierhouseholds livelihood diversity is usually astrategy of accumulation, while for poorerhouseholds diversity is more of a copingmechanism.
The Government of Afghanistan (GoA), UnitedNations (UN) agencies, donors and NGOsshould ensure that their activities supportthe multiple income strategies that poorhouseholds use and not encouragedependence on one sector, such asagriculture, as a livelihoods source. One wayforward could be to design activities thatsupport an entire household, rather than anindividual.
Non-farm labourFor the poorest groups in 18 out of the 21villages studied, non-farm labour was themost important source of income. The currentimportance of non-farm labour has significant
Executive Summary
implications for the agricultural focus ofmuch rural programming and policy inAfghanistan.
The GoA, UN agencies, donors and NGOs mustrecognise and support the importance of non-farm labour in rural livelihoods and look to:
• Monitor over time employment trendsat the local level;
• Examine and support the skills peoplealready possess;
• Build an understanding of the skillsneeded for non-farm labour for men andwomen;
• Explore providing skills training as partof public works programmes; and
• Ensure that national programmes directlybenefit women and also develop womenoriented strategies.
Labour migrationFor over a quarter of all households labourmigration, both inside and outsideAfghanistan, is a critical income strategy. Forwealthier households labour migration maybe a strategy of accumulation. However, forthe poor it is a crucial way of coping withuneven job opportunities inside the villageand a way of seeking better-paid work.
The GoA, UN, donors and NGOs alike needto begin to view migration in a more positivelight, rather than something negative thatshould be prevented, and undertake researchon labour migration to provide a betterunderstanding of why people migrate, wherethey migrate, how they migrate, etc.
IndebtednessMany households are indebted, rich and pooralike, and indebtedness is a factor in boththe creation as well as the perpetuation ofpoverty. For wealthier households, loans areoften taken either for ceremonies such asweddings, where a large lump sum is needed,or for the purposes of production and
Afghanistan Research and Evaluation Unit (AREU) 1
Rethinking Rural Livelihoods in Afghanistan
investment. For poorer households, themajority of loans are taken out as a copingstrategy to meet basic needs such as foodand health care. Policy makers andpractitioners, particularly from thegovernment and microfinance providersshould:
• Explore and monitor locally existing creditmechanisms;
• Monitor the level of indebtedness;• Consider moving part of the money
currently allocated for targeted transfersto the poorest to the MicroFinanceInvestment and Support Facility forAfghanistan (MISFA); and
• Study the possibilities of helping peoplerecover assets.
GenderWomen in rural Afghanistan are involved inmany production and income generatingactivities that contribute to the overallhousehold income. However, very few womenown resources such as land and livestock,and their income generating options are fewerin comparison to men. It is these inequitiesthat make some female-headed householdsparticularly vulnerable to poverty, as thereare few activities that they can do which aresufficient to support a family.
Policy makers and practitioners from thegovernment, donors and implementingorganisations need to:
• Protect, support and develop thelivelihoods of women;
• Recognise and support women’s role inagriculture at the policy and programmelevel; and
• Tackle the structural causes of genderinequity and look beyond traditionalactivities, such as poultry farming andembroidery.
HealthFor the majority of households, health careis the second largest area of expenditure.Health is a livelihoods and social protection
issue in that ill health, either physical ormental, has an enormous impact onlivelihoods. Ill health is a major factor increating indebtedness and leads to a depletionof assets, as households sell their assets topay for health treatment. Ill health alsoimpacts on livelihoods, as the person who isill (and possibly their carer) is unable toengage in income generating activities.Health is also tied up with livelihoods throughthe negative effects of certain incomegenerating activities such as carpet weavingor embroidery and because of the health risksassociated with labour migration. Despite allof the above, the Ministry of Health (MoH) isnot part of the Livelihoods and SocialProtection Consultative Group (LSP CG).
The government, the LSP CG and/orimplementing organisations should:
• Include the MoH on the LSP CG andinstitutionalise linkages between healthand livelihoods and social protection;
• Provide advice on livelihood relatedhealth issues in heath educationactivities; and
• More closely control pharmaceuticalsand pharmacies to prevent the sale ofineffective medicine and ensure thatdrugs and antibiotics are only availableby prescription.
Social Protection and the Poorest of thePoorMost current policy and programmes do nottarget the very poor, who are likely to bethose who are unable to work, lack assets,and obtain grain through begging. For women,those who are married too much older menare particularly vulnerable to poverty. Whilethe Livelihoods and Social Protection (LSP)Annex of the Security Afghanistan’s Futures(SAF) document has empowerment of themost vulnerable as an aim, the programmesencompassed within the LSP are unlikely toreach the most vulnerable. The annex doesrecognise the need to understand and workwith traditional mechanisms of support, for
Afghanistan Research and Evaluation Unit (AREU)2
Synthesis Paper Series
those not able to help themselves, but nostrategy for doing this appears to have beendeveloped.
Policy makers and practitioners in governmentministries and/or NGOs should:
• Target resources to households withyoung children in which adults are notable to work;
• Use community workers to raiseawareness of the long-term livelihoodsconsequence of women marrying mucholder men; and
• Build greater understanding of traditionalsocial support mechanisms.
AgricultureA majority of poor households access mostof their grain from the market or from othermeans, and non-farm labour, rather thanagriculture, is their most important sourceof income. This raises questions over theaccuracy of the frequently cited “80 percentof the population is dependent onagriculture.” The findings of this researchhave major ramifications for agriculturalpolicy and programming, as they demonstratethat the needs of the rural poor are currentlybeing missed by the focus on agriculture.
Policy makers and practitioners need torecognise the discrepancy between therealities of rural livelihoods and the policyand programme focus on agriculture and:
• Distinguish between the asset portfoliosof different rural households andindividuals; and
• Understand the different natural resourcebase which households have access tobefore designing agricultural programmes
Livelihoods monitoringThe findings of this research demonstratethe importance of monitoring livelihoodtrends. The majority of the NGOs whoparticipated in this project found what theylearned to be very valuable in assessingwhether their programmes are responding tothe realities of people’s lives, especiallythose of the poor. However, NGOs and theirdonors need to begin to look more at theoutcomes (effects) of their projects andprogrammes, and where possible the impacts,rather than focusing on outputs. Long-termfunding and investment in learning is alsorequired to enable NGOs and others to beginto look at and tackle the causes of livelihoodconstraints and not only the symptoms.
Afghanistan Research and Evaluation Unit (AREU) 3
Rethinking Rural Livelihoods in Afghanistan
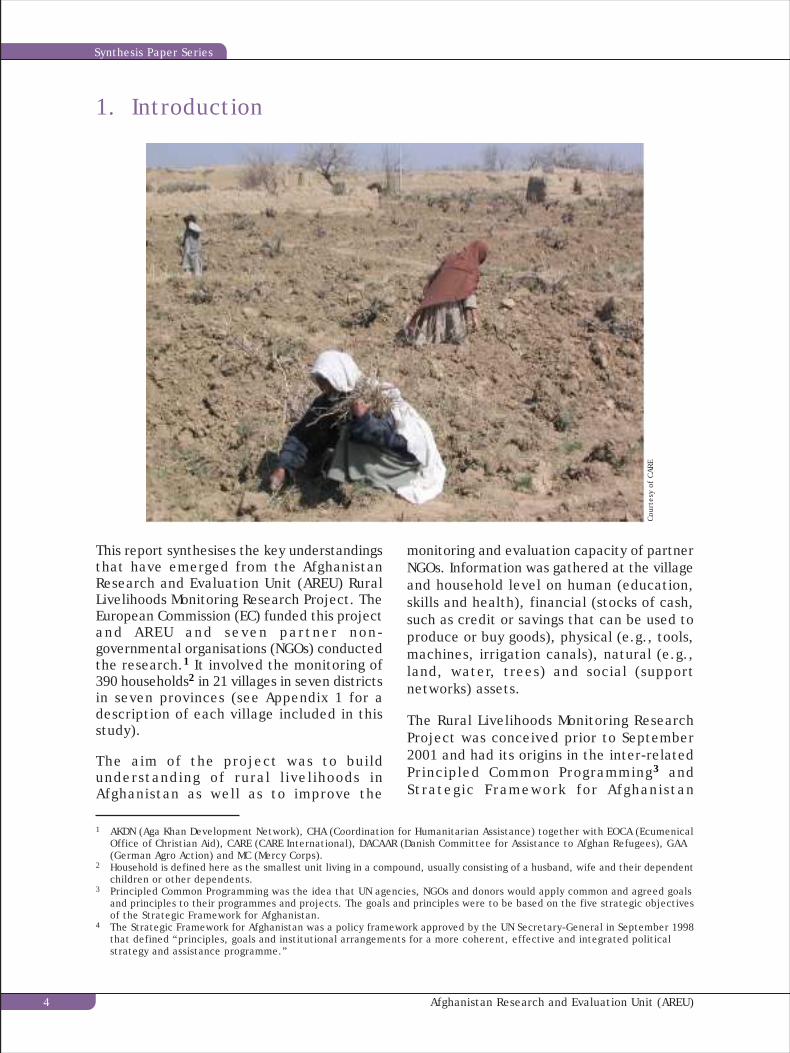
This report synthesises the key understandingsthat have emerged from the AfghanistanResearch and Evaluation Unit (AREU) RuralLivelihoods Monitoring Research Project. TheEuropean Commission (EC) funded this projectand AREU and seven partner non-governmental organisations (NGOs) conductedthe research.1 It involved the monitoring of390 households2 in 21 villages in seven districtsin seven provinces (see Appendix 1 for adescription of each village included in thisstudy).
The aim of the project was to buildunderstanding of rural livelihoods inAfghanistan as well as to improve the
1. Introduction
monitoring and evaluation capacity of partnerNGOs. Information was gathered at the villageand household level on human (education,skills and health), financial (stocks of cash,such as credit or savings that can be used toproduce or buy goods), physical (e.g., tools,machines, irrigation canals), natural (e.g.,land, water, trees) and social (supportnetworks) assets.
The Rural Livelihoods Monitoring ResearchProject was conceived prior to September2001 and had its origins in the inter-relatedPrincipled Common Programming3 andStrategic Framework for Afghanistan
1 AKDN (Aga Khan Development Network), CHA (Coordination for Humanitarian Assistance) together with EOCA (EcumenicalOffice of Christian Aid), CARE (CARE International), DACAAR (Danish Committee for Assistance to Afghan Refugees), GAA(German Agro Action) and MC (Mercy Corps).
2 Household is defined here as the smallest unit living in a compound, usually consisting of a husband, wife and their dependentchildren or other dependents.
3 Principled Common Programming was the idea that UN agencies, NGOs and donors would apply common and agreed goalsand principles to their programmes and projects. The goals and principles were to be based on the five strategic objectivesof the Strategic Framework for Afghanistan.
4 The Strategic Framework for Afghanistan was a policy framework approved by the UN Secretary-General in September 1998that defined “principles, goals and institutional arrangements for a more coherent, effective and integrated politicalstrategy and assistance programme.”
Cour
tesy
of
CARE
Afghanistan Research and Evaluation Unit (AREU)4
Synthesis Paper Series
coordination mechanisms.4 The motivationfor the project was the observation thathumanitarian action was generally notinformed by a detailed understanding of rurallivelihoods and that aid practice paid littleattention to learning, and instead primarilyemphasised delivery of aid built onassumptions about the significance ofagriculture in rural livelihoods.5 The projectwas implemented in the post-2001 context,with its emphasis on state building,reconstruction and development, and asubstantially greater scale of funding andaction than before. Policy and programmingdecisions, in this environment, were stillconstrained by a lack of understanding andknowledge gained through systematicresearch. A good example of this is the policyand programming narrative surrounding thecollapse of agricultural production inAfghanistan, which was so widely articulatedin the post-2001 environment, and influencedmuch of the immediate response. Moreimportantly, while there has been a reboundof agricultural production, there has beenno corresponding transformation of rurallivelihoods or reduction in rural poverty. Thislack of transformation undermines the implicitassumption linking wheat production andrural livelihoods, which has provided thefoundation for many rural agricultural policiesand programmes. This assumption is reflectedmost commonly in the statement, “80% ofrural Afghans depend on agriculture.”
A fundamental objective of this report is tomove beyond and challenge untestedassumptions and statements to explore thecomplexities of rural livelihoods based onempirical evidence from the field. Bypresenting and analysing field-based evidence,this report aims to influence policy andprogramming at the government and agencylevel, and thereby contribute to one of thegovernment’s key objectives – buildingsustainable livelihoods for rural Afghans.
The bulk of this report provides an analysisand interpretation of the panel householddata collected by AREU and the seven partnerNGOs. The report focuses particularly oncross-site evidence at the village and wealthgroup level, with some rather more selectiveuse of household data to investigatedifferences within wealth groups. Moredetailed site-specific analysis, with immediateprogramming implications, rests with theindividual agencies.6 In addition, this reportdraws on three case studies on seeddistribution, gender roles in agriculture andvillage institutions, which were undertakenas part of the Rural Livelihoods MonitoringResearch Project.
In constructing a panel set of data, it washoped that this would provide the basis fortracking changes in livelihoods over time.While this report does discuss some indicativedata, it is not possible to go into more detailin relation to longitudinal trends. However,if the Rural Livelihoods Monitoring ResearchProject is to contribute to longer-termunderstanding of rural change in Afghanistan,then this panel data set provides the meansby which it can be achieved. In this regard,three NGO partners involved in the projectplan to continue monitoring the samehouseholds over time.
The next chapter provides an overview ofthe context within which this research hasbeen undertaken and highlights the emergingpolicy agenda for which the evidencepresented in this report has importantramifications. Chapter three then focuses onthe methods employed during the RuralLivelihoods Monitoring Research Project andincludes a description of the sample frame.Chapter four provides a detailed discussionof the evidence collected from this projectin relation to livelihoods, and is followed bya concluding chapter that presents key policyand programming implications andrecommendations arising from the evidence.
5 Pain, A., and Lautze, S. Addressing Livelihoods in Afghanistan. Kabul: AREU. 2002.6 For example see Kerr-Wilson, A., and Pain, A. Three Villages in Laghman: A Case Study of Rural Livelihoods. Kabul: AREU.
2004.
Afghanistan Research and Evaluation Unit (AREU) 5
Rethinking Rural Livelihoods in Afghanistan
2. Context and Policy Issues
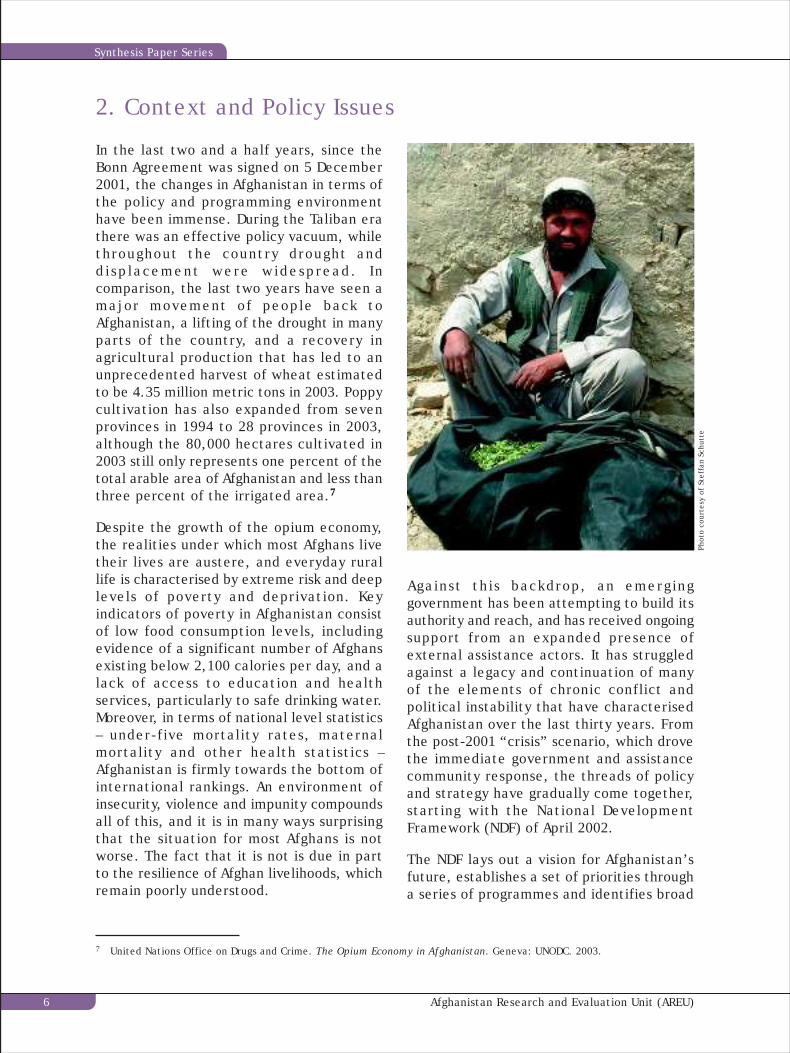
In the last two and a half years, since theBonn Agreement was signed on 5 December2001, the changes in Afghanistan in terms ofthe policy and programming environmenthave been immense. During the Taliban erathere was an effective policy vacuum, whilethroughout the country drought anddisplacement were widespread. Incomparison, the last two years have seen amajor movement of people back toAfghanistan, a lifting of the drought in manyparts of the country, and a recovery inagricultural production that has led to anunprecedented harvest of wheat estimatedto be 4.35 million metric tons in 2003. Poppycultivation has also expanded from sevenprovinces in 1994 to 28 provinces in 2003,although the 80,000 hectares cultivated in2003 still only represents one percent of thetotal arable area of Afghanistan and less thanthree percent of the irrigated area.7
Despite the growth of the opium economy,the realities under which most Afghans livetheir lives are austere, and everyday rurallife is characterised by extreme risk and deeplevels of poverty and deprivation. Keyindicators of poverty in Afghanistan consistof low food consumption levels, includingevidence of a significant number of Afghansexisting below 2,100 calories per day, and alack of access to education and healthservices, particularly to safe drinking water.Moreover, in terms of national level statistics– under-five mortality rates, maternalmortality and other health statistics –Afghanistan is firmly towards the bottom ofinternational rankings. An environment ofinsecurity, violence and impunity compoundsall of this, and it is in many ways surprisingthat the situation for most Afghans is notworse. The fact that it is not is due in partto the resilience of Afghan livelihoods, whichremain poorly understood.
Against this backdrop, an emerginggovernment has been attempting to build itsauthority and reach, and has received ongoingsupport from an expanded presence ofexternal assistance actors. It has struggledagainst a legacy and continuation of manyof the elements of chronic conflict andpolitical instability that have characterisedAfghanistan over the last thirty years. Fromthe post-2001 “crisis” scenario, which drovethe immediate government and assistancecommunity response, the threads of policyand strategy have gradually come together,starting with the National DevelopmentFramework (NDF) of April 2002.
The NDF lays out a vision for Afghanistan’sfuture, establishes a set of priorities througha series of programmes and identifies broad
7 United Nations Office on Drugs and Crime. The Opium Economy in Afghanistan. Geneva: UNODC. 2003.
Phot
o co
urte
sy o
f St
effa
n Sc
hutt
e
Afghanistan Research and Evaluation Unit (AREU)6
Synthesis Paper Series
strategies for each programme area. Thedevelopment strategy has three maincomponents or pillars, as these have beentermed. The first pillar focuses onhumanitarian assistance and social policy andis concerned with achieving social protectionand enabling conditions for people to livesecure lives. The second pillar focuses onaddressing physical reconstruction and thedevelopment of natural resources, and thethird deals with private sector development.
Underlying the NDF is a premise that theprocess of state building and reconstructionwill be based on private sector led growth,in which agriculture will play a critical role.The private sector, furthermore, is seen asmaking social inclusion possible by creatingeconomic opportunities for Afghans. TheAfghan state, in comparison, is to be “light”and “enabling,” with responsibility forcreating appropriate regulatory frameworks.Community-driven development provides boththe mechanism for accountability and thevehicle for social change.
This framework has recently been developedand elaborated into a substantial policydocument, “Securing Afghanistan’s Future(SAF): Accomplishments and Strategic PathForward.” The development of this documentoccurred at the same time as an extensiverecosting exercise, with respect to budgetaryprojections and the level of external supportAfghanistan requires in the medium-term(the SAF argues that Afghanistan needs US$28billion over the coming seven years). The SAFalso sets out in detail the proposed linkagesbetween planned levels of economic growth,the development of the three pillars andtheir programme content, and strategies ofimplementation.
Key arguments within the SAF relate to theimportance of economic growth rates of ninepercent per annum, so that economic
development and social investment can ensurethe support of communities for thegovernment. The SAF further argues that thislevel of growth is required to raise per capitaincomes from their current estimated levelof US$200 per head to US$500 in ten yearstime. According to the SAF, this magnitudeof growth will assist in crowding out theopium poppy economy. While the SAFprioritises economic growth, it also recognisesthe need for strong social welfare policies tosupport the most “vulnerable” individuals.
2.1 Key policy areas
The evidence presented in this report hasparticular significance for two key policyareas within the SAF. The first policy arearelates to the development of agriculture,while the second area is concerned withlivelihoods and social protection. Theremainder of this chapter summarises thecentral arguments from these two policyareas and identifies critical issues with whichthis report will engage. The summariespresented here are from the Natural Resources(NR) Technical Annex and the Livelihoods andSocial Protection (LSP) Technical Annex ofthe SAF.
2.1.1 Agriculture/NR Technical Annex
Agriculture is addressed under the NRTechnical Annex, which has the overallobjective of “improved livelihoods andeconomic conditions of rural families andenhanced household food security.”8 This isbased on the assumption, stated at the veryoutset of the annex that “Over 80 percentof the population is dependent onagriculture.”9 The targets set to measureperformance in achieving the objective, whichare identified in the executive summary,include reduction in ministry of agriculturestaff, the establishment of river basinmanagement agencies, the extent of irrigation
8 Government of Afghanistan/International Agencies. Securing Afghanistan’s Future: Accomplishments and Strategic PathForward, Natural Resources Technical Annex. Kabul: Government of Afghanistan/International Agencies. January 2004,Executive Summary, i.
9 Ibid.
Afghanistan Research and Evaluation Unit (AREU) 7
Rethinking Rural Livelihoods in Afghanistan
rehabilitation achieved, the expansion of theorchard areas, and productivity improvementsfor wheat and livestock.
The annex is structured around a review ofthe status of key sub-sectors (agriculture andlivestock, land issues, etc.), progress in thenine sub-programmes of the sub-sectors, andcurrent organisational arrangements. Theannex then goes on to identify its vision,goals and objectives, which have alreadybeen mentioned above. Key strategic areasin relation to sectoral activities are identified,including inter-alia “improving the economicwell-being of rural households andcommunities through broad-based andequitable agricultural reconstruction.”10 Theannex then identifies areas of policy andinstitutional reform before going on todescribe in detail by sub-sector the key issues,strategic objectives, needs assessment andpolicy agenda. The annex concludes with adetailed development programme and budget.
This is not the place for a detailed analysisof the arguments within the technical annex.However, given the evident origins of thisannex in the Asian Development Bank’s (ADB)Natural Resources and Agricultural NeedsAssessment, prepared in 2002, it is pertinentto refer to the arguments of a critique of thisassessment. Although the overall goal foragriculture in the ADB’s needs assessment isto improve rural livelihoods, it is simplyassumed that livelihoods are largelyconstructed out of agriculture. Moreover,detailed sub-sectoral objectives and outputsare not connected with the livelihood goal,but are instead focused entirely on sub-sectoral concerns.11
Likewise, with the NR Annex it remainsunclear what the statement “Over 80% of thepopulation is dependent on the agriculturaland natural resource management sector”12
actually means, or where this claim comes
from. While no doubt a useful (butproblematic) simplification for policypurposes, the statement is at best ambiguous.Does the statement refer to 80 percent ofall the population of Afghanistan or just therural population? What does dependent mean?Is it a direct or indirect dependence? Is it atotal or partial dependence? Is it uniform ordifferentiated by location, class or gender?
There are, moreover, some key issues thatarise with respect to the actual role ofagriculture in the livelihoods of rural people:How many of the rural population are directlyand fully dependent on agricultural productionfor their livelihoods and where are thesevarious populations? How many are partiallydependent on production and derive incomesources from elsewhere and who are they?How many are indirectly engaged inagriculture, primarily through labour inagriculture and agriculturally relatedactivities? How many rural households actuallyderive the majority of their income fromnon-agricultural sources? These are criticalissues that will determine how the direct andindirect benefits of agricultural growth areactually distributed. These points will bereturned to in the concluding chapter of thisreport, as the implications of the data fromthis project are considered in relation topolicy and programming options.
2.1.2 LSP Technical Annex
The LSP Public Investment Programme(LSP/PIP), which is part of the Human andSocial Capital Pillar of the NDF, includes themost comprehensive treatment of the linkagesbetween poverty reduction and growth. TheLSP/PIP is designed to promote a strategicshift beyond humanitarian approaches torelief and to encourage the provision of long-term support to the poor, which should betterenable them to protect their assets andrebuild their livelihoods. Underlying the
10 Ibid. Paragraph 60.11 Pain and Lautze, op cit.12 Government of Afghanistan/International Agencies, Securing Afghanistan’s Future: Accomplishments and Strategic Path
Forward, Natural Resources Technical Annex, op cit. Paragraph 2.
Afghanistan Research and Evaluation Unit (AREU)8
Synthesis Paper Series
LSP/PIP is the building of poverty monitoringand assessment systems to enhanceunderstanding of livelihood systems, existinginformal safety-net mechanisms andvulnerability to various risks.
The LSP Technical Annex starts with ananalysis of current knowledge of poverty,vulnerability and risk in Afghanistan. It drawsattention to the diversity of livelihoodstrategies at inter- and intra-household levels,and raises questions about assumptions linkingagricultural growth and poverty reduction.It in fact draws from some of the early outputsfrom this project.13 It details existingprogrammes operating under the overall pillargoal of “putting in place an effective andaffordable social policy which enhanceshuman security and supports sustainable ruraland urban livelihoods.”14 These programmesinclude the National Emergency EmploymentProgramme (NEEP), the National SolidarityProgramme (NSP), the National Risk andVulnerability Assessment (NRVA), the NationalArea Based Development Programme (NABDP)and the Micro-Finance Support Facility inAfghanistan (MISFA).
In section two of the annex, constraints andcross-cutting issues are identified. Theseinclude institutional constraints, a recognition“that formal and market based options are
limited for risk management in the immediatefuture,”15 and a need for information,monitoring and evaluation in order to build“understanding of informal and community-based solidarity systems and social networksfor risk management.”16 Section three setsout the goals and key priorities of LSP, andfocuses on the link between social protectionand the promotion of sustainable livelihoods.17
This includes recognition of the differentstrategies (prevention, mitigation and coping)needed to handle diverse risks and the rangeof approaches that exist to manage risk(informal, market-based and public).18 A setof key priorities and programme areas areidentified, each linked to targets withappropriate indicators to key goals, includingpoverty reduction and promotion of genderequality. The final two sections of the annexaddress costing and delivery targets andimplementation strategies.
The evidence presented in this report raisesa number of critical issues for the two policyareas summarised above, particularlyconcerning assumptions linking livelihoodsand agriculture. Other key issues includeassumptions about gender roles, the livelihoodstrategies of the poor, risk and vulnerability.
These issues will be discussed in more detailin the concluding chapter.
13 Kerr-Wilson and Pain, op cit.14 Government of Afghanistan/International Agencies. Securing Afghanistan’s Future: Accomplishments and Strategic Path
Forward, Livelihoods and Social Protection Technical Annex. Kabul: Government of Afghanistan/International Agencies.January 2004, 19.
15 Ibid. 28.16 Ibid. 30.17 Ibid. 34.18 Ibid. 35.
Afghanistan Research and Evaluation Unit (AREU) 9
Rethinking Rural Livelihoods in Afghanistan
3. Methods
This chapter outlines the five stages of theRural Livelihoods Monitoring Research Project,from design to analysis, as well as highlightsthe limitations of the methods used.
3.1 Project stagesStage 1: Design interview formats
Two interview formats were designed togather information on human, financial,physical, natural and social assets in orderto obtain a better understanding of howdifferent people in rural areas are buildingtheir livelihoods. The first format was a villagedescription that aimed to gather data onvillage location, characteristics, distances toservices, land holdings, activities, wealth
groupings, cooperation and conflicts.
The second format was an extensivequestionnaire, which consisted of 12 tableslooking at household composition, householdmember skills, education, activities,household history, household assets, landassets, livestock, debts, grain budget, incomeand expenditure (see Appendix 3).
In the first round of interviews, questionswere asked about the previous four seasons.The questionnaire was designed to be askedto the same households over time at anintended interval of four months. Duringsubsequent rounds of interviews, questionsreferred to the previous four months. FiveNGOs were able to complete two rounds ofinterviews and one NGO was able to completethree rounds of interviews in two locations.The first set of data was collected betweenNovember 2002 and July 2003, as each NGOstarted the interviews at different times.The second and third rounds of interviewswere carried out between February 2003 andDecember 2003.
A cohort tracking system was used, whichwas designed to allow an understanding ofchange over time, if the research is continued.This tracking method was employed to allowthe research team to check the information
collected for consistency. It was also hopedthat it would enable interviewers to build upsome trust with the interviewees.
Stage 2: Partnership formation and staffselection
This study involved collaboration with sevenpartner NGOs who conducted the researchin the seven provinces (DACAAR conductedthe research in both Laghman and HeratProvinces and CHA worked together withEOCA) and analysed their own findings.Partnerships were formed based on theinterest of individual NGOs and dependingon where they worked, as an attempt wasmade to look at sites in different parts ofthe country (see Table 1).
Each NGO was responsible for selecting stafffrom their own organisation to conduct theresearch. Some partner NGOs had to hirestaff for the project, as they lacked availablestaff. Each research team consisted of atleast one male and one female who weretrained either in Kabul or in the field on thepurpose of the project, the use of theinterview formats, and the ethics of research.At least one person in each NGO was alsoassigned the task of data entry and datacleaning and provided training by AREU.
Stage 3: Site and household selection
Each NGO decided which areas would be themost valuable for them to look at withindistricts where they work. Within these areasvillage selection was then undertaken basedon the following criteria:
• Whether the NGO had been working inthe village and had some relationshipwith the villagers;
• Whether the NGO wished to continueworking in those areas; and
• Whether there were differences betweenthe villages such as location along avalley, proximity to services or livelihoodsource.
The main characteristics of the villagesselected are summarised in Table 1.
Afghanistan Research and Evaluation Unit (AREU)10
Synthesis Paper Series
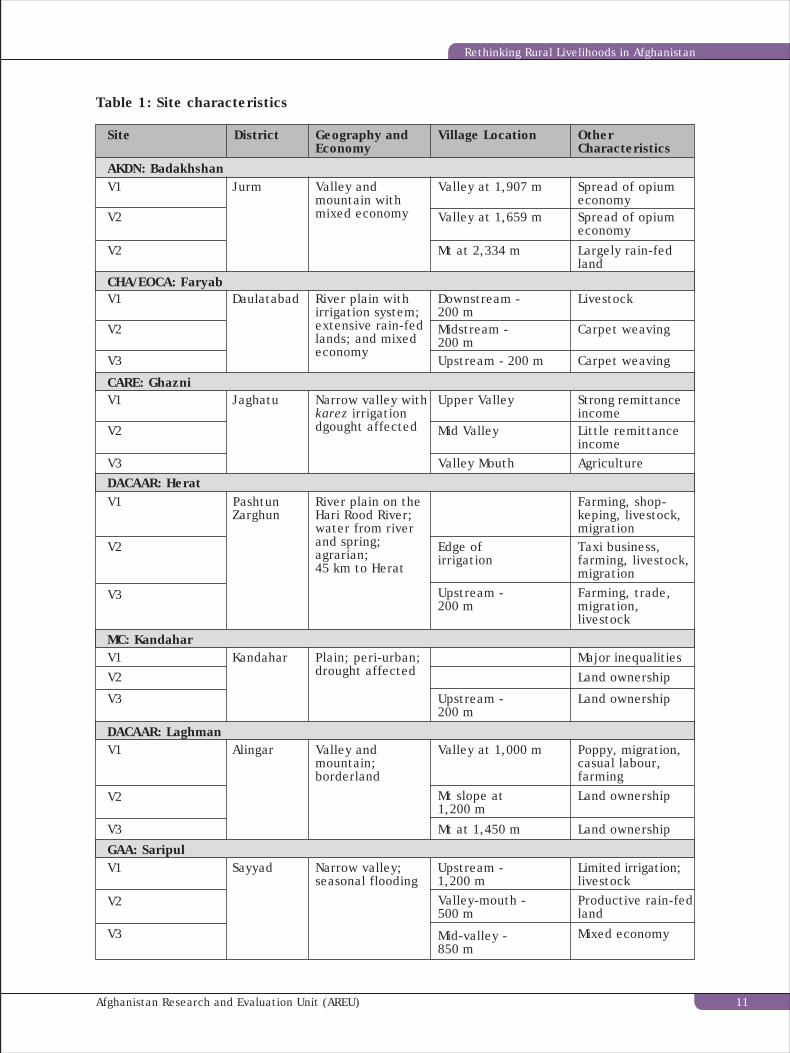
Table 1: Site characteristics
Site District Geography andEconomy
Village Location OtherCharacteristics
V1 Jurm Valley andmountain withmixed economy
Valley at 1,907 m Spread of opiumeconomy
AKDN: Badakhshan
V2 Valley at 1,659 m Spread of opiumeconomy
V2 Mt at 2,334 m Largely rain-fedland
CHA/EOCA: FaryabV1 Daulatabad River plain with
irrigation system;extensive rain-fedlands; and mixedeconomy
Downstream -200 m
Livestock
V2 Midstream -200 m
Carpet weaving
V3 Upstream - 200 m Carpet weaving
V1 Jaghatu Narrow valley withkarez irrigationdgought affected
Upper Valley Strong remittanceincome
V2 Mid Valley Little remittanceincome
V3 Valley Mouth AgricultureDACAAR: HeratV1 Pashtun
ZarghunRiver plain on theHari Rood River;water from riverand spring;agrarian;45 km to Herat
Farming, shop-keping, livestock,migration
V2 Edge ofirrigation
Taxi business,farming, livestock,migration
V3 Upstream -200 m
Farming, trade,migration,livestock
MC: KandaharV1 Kandahar Plain; peri-urban;
drought affectedMajor inequalities
V2 Land ownership
V3 Upstream -200 m
Land ownership
DACAAR: LaghmanV1 Alingar Valley and
mountain;borderland
Poppy, migration,casual labour,farming
V2 Mt slope at1,200 m
Land ownership
V3 Mt at 1,450 m Land ownership
Valley at 1,000 m
CARE: Ghazni
GAA: SaripulV1 Sayyad Narrow valley;
seasonal floodingLimited irrigation;livestock
V2 Valley-mouth -500 m
Productive rain-fedland
V3 Mid-valley -850 m
Mixed economy
Upstream -1,200 m
Afghanistan Research and Evaluation Unit (AREU) 11
Rethinking Rural Livelihoods in Afghanistan
At the start of the first round of interviews,the interviewers met village shuras (councils)in each village to explain the project and itsaims as well as to explain that there wouldbe no direct benefit from participating in theresearch. Meetings were then arranged tocollect information for the villagedescriptions. The village description questionswere asked to male shuras and, wherepossible, some of the questions were alsoasked to groups of women.
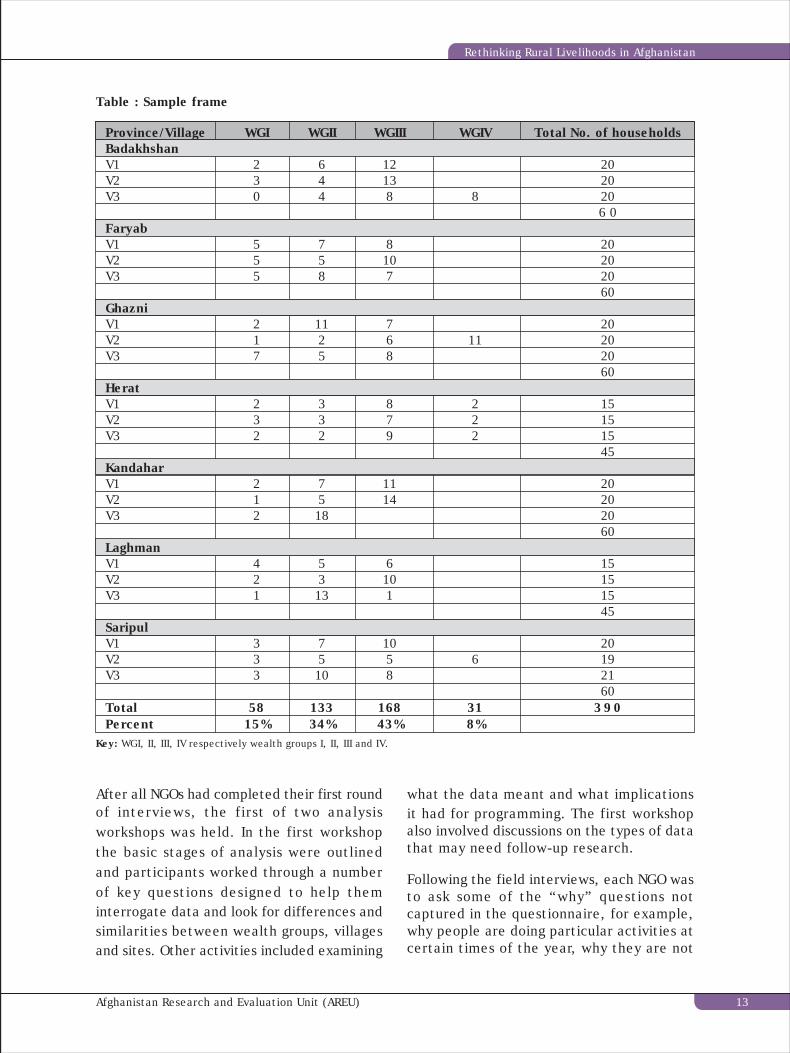
A wealth ranking exercise was also conductedin each village. For the purposes ofcomparison across areas, the research teamsexplained the meaning of household, whichis defined in this project as the smallest unitliving inside a compound and usually consistedof husband, wife and dependent children.With this definition in mind, members of thecommunity – usually male shura members –were first asked to explain the characteristicsof a poor and wealthy household in theirvillage. They were then asked how manydifferent wealth groups there were in theirvillage and subsequently to list the names ofhouseholds falling into each category.Households for individual interviews werethen randomly selected from the lists ofhouseholds generated from the wealth rankingexercise. The number of households in eachgrouping determined the number ofhouseholds selected from each wealth group.The more households there were in thepoorest wealth group, the greater the numberof households from this group was sampled.Between 15 and 20 households wereinterviewed in each village, resulting in atotal sample of 390 households (seeTable 2).
Stage 4: Implementation
Individual NGOs began the interviews atdifferent times depending on when theyjoined the project, and also due to delaysresulting from insecurity or difficultiesrecruiting appropriate staff.
Male and female team members went to thesame household at the same time. The maleinterviewer interviewed the household headif the household was male-headed and theoldest male available if it was female-headed.The female interviewer interviewed thehousehold head if the household was female-headed and a senior woman if the householdwas male-headed.
Special studies
In addition to the above interviews, threespecial studies were conducted as part ofthe Rural Livelihoods Monitoring ResearchProject. The aim of these studies was todeepen understanding of aspects of thelivelihoods data not adequately captured inthe formats described above. These threeinterlinked studies were conducted with threeNGOs: CHA/EOCA in Daulatabad, FaryabProvince and GAA in Saripul Province.CHA/EOCA also took part in the design of thestudies. These studies looked at three themesin a total of five villages: (i) the impact ofwheat seed interventions, (ii) gender rolesin agriculture, and (iii) water managementas a village institution.19
Stage 5: Data entry and data analysis
After each round of interviews, or during theinterview rounds, data were entered intodatabases managed by individual NGOs. AREUgave each partner NGO a replica of a databasethat was designed by AREU and theAfghanistan Information Management Service(AIMS). The database was built by AIMS.Partner NGOs then cleaned the data and sentit to AREU for generating reports.Unfortunately, creating reporting structuresin Access proved problematic andprogramming problems in the reports led toinaccurate data outputs. As a consequenceof these difficulties, partner NGOs had torun many of their own queries to producedata for analysis, which was very timeconsuming.
19 To obtain copies of the special studies reports see AREU’s website: www.areu.org.af.
Afghanistan Research and Evaluation Unit (AREU)12
Synthesis Paper Series
After all NGOs had completed their first roundof interviews, the first of two analysisworkshops was held. In the first workshopthe basic stages of analysis were outlinedand participants worked through a numberof key questions designed to help theminterrogate data and look for differences andsimilarities between wealth groups, villagesand sites. Other activities included examining
Key: WGI, II, III, IV respectively wealth groups I, II, III and IV.
what the data meant and what implicationsit had for programming. The first workshopalso involved discussions on the types of datathat may need follow-up research.
Following the field interviews, each NGO wasto ask some of the “why” questions notcaptured in the questionnaire, for example,why people are doing particular activities atcertain times of the year, why they are not
Table : Sample frame
Province/Village WGI WGII WGIII WGIV Total No. of householdsBadakhshanV1 2 6 12 20V2 3 4 13 20V3 0 4 8 8 20
6 0FaryabV1 5 7 8 20V2 5 5 10 20V3 5 8 7 20
60GhazniV1 2 11 7 20V2 1 2 6 11 20V3 7 5 8 20
60HeratV1 2 3 8 2 15V2 3 3 7 2 15V3 2 2 9 2 15
45KandaharV1 2 7 11 20V2 1 5 14 20V3 2 18 20
60LaghmanV1 4 5 6 15V2 2 3 10 15V3 1 13 1 15
45SaripulV1 3 7 10 20V2 3 5 5 6 19V3 3 10 8 21
60Total 58 133 168 31 3 9 0Percent 15% 34% 43% 8%
Afghanistan Research and Evaluation Unit (AREU) 13
Rethinking Rural Livelihoods in Afghanistan

involved in agriculture, why they migrate forlabour. However, due to resource constraints,only one NGO was able to ask the “why”questions. For this NGO the follow up provedvery fruitful in terms of gaining a betterunderstanding of the livelihoods of the peoplein the villages surveyed. Some of the otherpartner NGOs, which were not able to askthe “why” questions, did follow up with theirfield staff to discuss the meaning of the datacollected. This enabled them to use the often-untapped knowledge of field staff to fill insome of the gaps in the data collected in theinterviews.
The second workshop was held to review theanalysis conducted by the NGOs and focusedon how to identify differences between eachround of data. A checklist of key questionswas again designed to facilitate this analysis.
The comparative analysis of the across sitedata for this report was carried out by AREUand used data from queries to examinedifferences and similarities across sites, aswell as between villages, wealth groups andwithin wealth groups.
3.2 Limitations
Using wealth groups
In the vast majority of cases wealthierhouseholds were said to be those with largerland holdings and occasionally businesses,while the poorest households were identifiedas those who rely on daily labour andsometimes begging. The categorisation wasmostly the same in all villages, but therewere some differences. For example,receiving remittance income is seen to denotewealth in the villages in Ghazni Province.This is in a context where the three villageshave very small land holdings and lack waterresources, which has resulted in very little,if any, production for most households.
One other difference was that although largerland holdings were seen as synonymous withbeing wealthy, the size of land holdings variedenormously from location to location. In
villages in Faryab Province, for example, 15to 70 jeribs of irrigated land and 50 to 100jeribs of rain-fed land denote wealth,compared to villages in Herat Province where10-20 jeribs of land in total denotes wealth.Differences in the quality of land, etc., mustalso be taken into account. Thus comparingpoor wealth groups across sites is notcomparing like with like, although thesegroups do often share similar characteristicsin terms of asset ownership and incomesources.
Wealth ranking exercises can cause conflictin villages when people become angry at notbeing placed in the poorest categories, dueto expectations of assistance, despiterepeated explanations that no direct benefitsof participation are available. Despite theproblems already noted, for the purposes ofthis research wealth groupings proved veryuseful and mostly consistent in terms ofidentifying characteristics of richer and poorerhouseholds in diverse areas.
Unit of analysis
The “household” was the unit of analysis forthis study and was defined as the smallestunit living inside a compound. The householdunit usually comprised a husband, wife anddependent children. For the villagedescription in each village, groups of people,usually male shura members, were askedwhat the terms “family” and “household”locally mean. In some areas the term “family”was the smallest unit, while in others itreferred to the extended family. Theresearchers endeavoured to ensure that thelocally correct term for the smallest unit wasused in all villages. It was not possible tointerview all members of a compound, asthis often totalled around 40 people. As aresult, this report does not capturerelationships or the pooling of assets, labourand/or income between units within individualcompounds.
Capturing change over time
A longer period of time is needed to capturechange over time for many aspects of the
Afghanistan Research and Evaluation Unit (AREU)14
Synthesis Paper Series

data presented in this report. Unfortunately,change over time in household grain budgets,land assets, income and expenditure cannotbe explored at this stage. For grain budgets,the seasonal variation in household graininflows, due to higher grain inflows at harvesttime, for example, means that to comparea year’s data with another four months canskew the results, if the second round of datais collected either post or pre-harvest. Also,each NGO did not begin at the same timeand therefore conducted interviews atdifferent seasons to one another. To be ableto compare these changes over time anotherfull year’s worth of data is needed. The samelimitations affect the data on income andexpenditure. For the land data, changes werenot adequately captured, although it isunlikely that there were many major changesduring the research period.
Using categories
Many of the questions asked on thequestionnaire were closed to enable easiercoding of answers for data entry. Twoproblems were encountered with this. Thefirst was that many answers fell into thecategory of “other” and to produce thesedata from the database was very timeconsuming. In terms of the categoriesthemselves, several were too broad, whichmeans it was not possible to identify whatmakes up these categories. For example, itis unclear what the category non-farm labourentailed in all cases.
Size of questionnaire
The household questionnaire was veryextensive and took a lot of time to complete.Some households reportedly became bored,which may have affected the answers given.Aside from the problem of the length of theinterviews from the perspective of thehousehold, it was also very time consumingfor the NGOs. The NGO partners intendingto continue this type of monitoring havetherefore decided to do so in a modifiedform. Starting with an extensive questionnairehas, however, allowed partner NGOs to see
which questions work best and are the mostuseful.
Content of questionnaire
Collecting information on particular assetssuch as savings and jewellery proved verydifficult as people, understandably, do notwish to divulge this kind of information. Thismeans that aspects of the data relating toassets cannot be relied upon and havetherefore not been included in the analysisfor this report.
Furthermore, the questionnaire formats werenot able to capture the relational aspects ofhousehold lives both within households andbetween households (indeed it is one of theweaknesses of the sustainable livelihoodsframework). To understand the pathways ortrajectories of change for households in onewealth group requires an understanding ofchanges in households of other socio-economicgroups. Thus the livelihoods of poor peopleare related to the livelihoods of others, aspoor households are often dependent onthose who are better off. Poverty does notoccur outside a context and has to beunderstood in structural terms.
Equally, this project does not link livelihoodsat the micro household level with the mesovillage and district level nor to wider dynamicsthat permeate Afghanistan and shape theconditions under which most people live.While the study refers to government policiesand programmes, the reality is that thecentral government and reconstruction effortare not the key drivers of change affectingpeople’s lives. The experience of most peoplehas far more to do with the impact ofuncertainty, risk and poverty. Conflict,commodity and labour markets, powerstructures, informal institutions and non-state spaces are what exist and are the keysources of risk in daily life. These factors arealso critical for explaining the resilience ofAfghan livelihoods. It is, therefore, importantto remember that projects and villages arenot development islands.
Afghanistan Research and Evaluation Unit (AREU) 15
Rethinking Rural Livelihoods in Afghanistan
Database
The database used for storing the datacollected by partner NGOs was designed byAREU and built by AIMS using the Accessprogramme. Unfortunately, many problemswere encountered producing reports fromthe database and were incorrect. As a result,partner NGOs had to manually run databasequeries on the data, which was very timeconsuming.
Sample size
Due to the small sample size (390 households),the extent to which the findings arestatistically valid for the rest of the countryis limited. However, where there aresimilarities across sites, it is still possible toinfer that similar trends may be occurring inother parts of the country. It is also possiblein some cases to compare findings obtained
in this study to those in other studiesconducted in other parts of the country.
NGO resources
This study was resource heavy in terms ofstaff time needed and some NGOs were moreable to free up resources than others. As hasalready been mentioned, this meant for mostof the partners that follow-up research wasnot possible.
Security
Insecurity presented huge challenges atvarious stages of the research. Interviewshad to be delayed in three locations and oneresearch site had to be moved to anotherarea. However, due to the flexibility andcommitment of those NGO staff membersinvolved, all NGOs managed to complete atleast two rounds of interviews.
Afghanistan Research and Evaluation Unit (AREU)16
Synthesis Paper Series
This chapter presents findings on severalinterlinked aspects of rural livelihoods fromthe villages studied. It first examines wheredifferent households obtain their grain, beforelooking at how different households accessland. Evidence relating to household livestockholdings, income sources, expenditure anddebts are then discussed. Change over timeis looked at in the sections on household debtand livestock holdings.
4.1 Household grain budgets20
Given the persistence of the argument “80percent of the population is dependent onagriculture,” understanding grain budgets iscritical. The starting questions here arestraightforward – Where do households obtaingrain? What proportion of grain comes from
4. Key Rural Livelihoods Findings
production? What proportion comes from themarket or other exchange mechanisms (gifts,labour paid in grain, gleaning, begging, etc.)?
The analysis presented here only looks atwheat budgets, thus excluding other grains,in particular rice and maize, although of theresearch sites rice and maize production onlyoccurs in Laghman and Herat Provinces. Theinformation collected on four seasons in thefirst round of interviews has been aggregatedand the data discussed here thereforerepresent a full year. These data are presentedin Table 3, which categorises sites, villagesand wealth groups in terms of the relativeproportions of wheat coming from farmproduction (the vertical or Y axis) and theproportion coming from the market (thehorizontal or X axis).
20 Grain budgets refer to flow of major grains (used by the household) in and out of the household.
Cour
tesy
of
DAC
AAR
Afghanistan Research and Evaluation Unit (AREU) 17
Rethinking Rural Livelihoods in Afghanistan
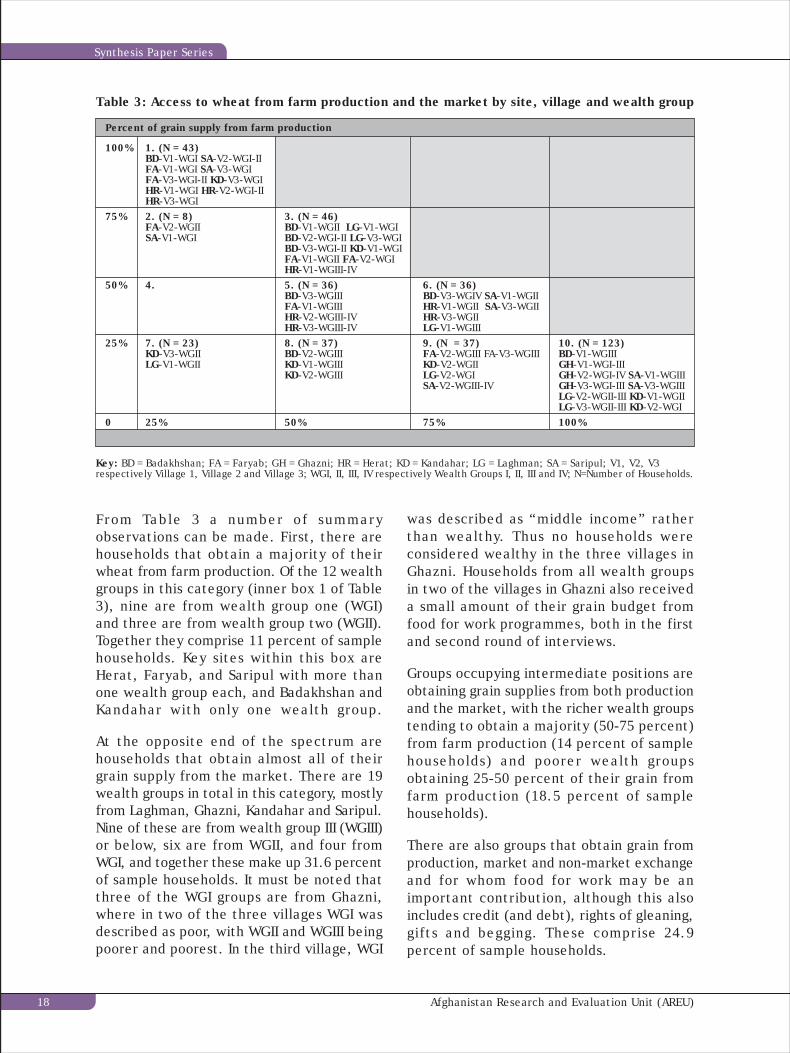
Table 3: Access to wheat from farm production and the market by site, village and wealth group
Percent of grain supply from farm production
100% 1. (N = 43)BD-V1-WGI SA-V2-WGI-IIFA-V1-WGI SA-V3-WGIFA-V3-WGI-II KD-V3-WGIHR-V1-WGI HR-V2-WGI-IIHR-V3-WGI
75% 2. (N = 8) 3. (N = 46)FA-V2-WGII BD-V1-WGII LG-V1-WGISA-V1-WGI BD-V2-WGI-II LG-V3-WGI
BD-V3-WGI-II KD-V1-WGIFA-V1-WGII FA-V2-WGIHR-V1-WGIII-IV
50% 4. 5. (N = 36) 6. (N = 36)BD-V3-WGIII BD-V3-WGIV SA-V1-WGIIFA-V1-WGIII HR-V1-WGII SA-V3-WGIIHR-V2-WGIII-IV HR-V3-WGIIHR-V3-WGIII-IV LG-V1-WGIII
25% 7. (N = 23) 8. (N = 37) 9. (N = 37) 10. (N = 123)KD-V3-WGII BD-V2-WGIII FA-V2-WGIII FA-V3-WGIII BD-V1-WGIIILG-V1-WGII KD-V1-WGIII KD-V2-WGII GH-V1-WGI-III
KD-V2-WGIII LG-V2-WGI GH-V2-WGI-IV SA-V1-WGIIISA-V2-WGIII-IV GH-V3-WGI-III SA-V3-WGIII
LG-V2-WGII-III KD-V1-WGIILG-V3-WGII-III KD-V2-WGI
0 25% 50% 75% 100%Percent of wheat supply obtained from the market
From Table 3 a number of summaryobservations can be made. First, there arehouseholds that obtain a majority of theirwheat from farm production. Of the 12 wealthgroups in this category (inner box 1 of Table3), nine are from wealth group one (WGI)and three are from wealth group two (WGII).Together they comprise 11 percent of samplehouseholds. Key sites within this box areHerat, Faryab, and Saripul with more thanone wealth group each, and Badakhshan andKandahar with only one wealth group.
At the opposite end of the spectrum arehouseholds that obtain almost all of theirgrain supply from the market. There are 19wealth groups in total in this category, mostlyfrom Laghman, Ghazni, Kandahar and Saripul.Nine of these are from wealth group III (WGIII)or below, six are from WGII, and four fromWGI, and together these make up 31.6 percentof sample households. It must be noted thatthree of the WGI groups are from Ghazni,where in two of the three villages WGI wasdescribed as poor, with WGII and WGIII beingpoorer and poorest. In the third village, WGI
was described as “middle income” ratherthan wealthy. Thus no households wereconsidered wealthy in the three villages inGhazni. Households from all wealth groupsin two of the villages in Ghazni also receiveda small amount of their grain budget fromfood for work programmes, both in the firstand second round of interviews.
Groups occupying intermediate positions areobtaining grain supplies from both productionand the market, with the richer wealth groupstending to obtain a majority (50-75 percent)from farm production (14 percent of samplehouseholds) and poorer wealth groupsobtaining 25-50 percent of their grain fromfarm production (18.5 percent of samplehouseholds).
There are also groups that obtain grain fromproduction, market and non-market exchangeand for whom food for work may be animportant contribution, although this alsoincludes credit (and debt), rights of gleaning,gifts and begging. These comprise 24.9percent of sample households.
Key: BD = Badakhshan; FA = Faryab; GH = Ghazni; HR = Herat; KD = Kandahar; LG = Laghman; SA = Saripul; V1, V2, V3respectively Village 1, Village 2 and Village 3; WGI, II, III, IV respectively Wealth Groups I, II, III and IV; N=Number of Households.
Afghanistan Research and Evaluation Unit (AREU)18
Synthesis Paper Series
Only 20 households are begging for part oftheir household grain budget. Thesehouseholds are in Badakhshan, Herat andKandahar. All of these households are fromthe poorest wealth groups and the amountsof grain they receive from begging rangesfrom 10 to 300 seers. Widows head six of the20 households and it is for these householdsthat begging is the major means of accessinggrain. What is striking about six of theremaining households is that they containmen of around 70 years of age, married towomen at least 15 years younger. In somecases, the reason for this age gap is partlyexplained by a first wife dying and thehusband remarrying a younger woman. Inseveral cases the men are too weak to workand begging provides the extra grain neededto supplement the labour of the wife andchildren (see Box 1). It is difficult to see howthe future will be brighter for some of thesehouseholds. Given such an age gap betweenhusband and wife, with all things being equal,these women will be widowed before toolong, and as will be discussed later, womenin Afghanistan have fewer opportunities forgenerating sufficient income than men. Initialfindings from the NRVA data indicate thatfemale–headed households have poverty ratesof more than 70 percent compared to thoseof male-headed households, which are closerto the overall rural poverty rate of 53percent.21
The remaining households who beg for grainhave very few assets. Five households inBadakhshan sold or mortgaged land duringthe drought; one household also sold theirhouse due to “family problems” and anotherhousehold sold trees. A few households receivevery small amounts of grain from their ownproduction, but it appears that this is notenough to last even one season. Several ofthe households receive grain from a varietyof means: buying, borrowing, being paid in-kind, and gathering from people’s fields aswell as begging.
That these households are able to obtain allor part of their grain from begging does showthat some form of social support mechanismsare in place. The majority of households inthe higher wealth groups, who receive someof their grain from their own production, didalso report giving some of it away. What thisappears to show is that the more grain ahousehold has the more it will give away,thus possibly supporting the chronically poor,who are little able to help themselves. Thereis, however, a need for further research intothe giving of alms and the practice of begging,as not enough is known about these issues.
As well as wealth group differences in grainbudgets there are clearly site differences(and differences within sites), reflectingwater and land resources. Table 4 summarisesby site the percent of grain obtained fromproduction by percent of sample households.
21 MRRD and World Bank. Rural Poverty in Afghanistan: Initial Insights from NRVA. Kabul: MRDD. 2004
Box 1: Begging for grain
One woman in Herat said she had been married at the age of 7 to a man of 50. She said she has“faced a lot of tragedy” in her life. She is now around 37 and her husband around 90. He hadbecome ill many years before and was unable to work. In the past she had woven carpets andembroidered but her eyesight had become so weak that she could no longer engage in theseactivities. This household owns no land, but owns one cow and four chickens. With three of herfour children (three girls and one boy) under 12 the household income now comes from what herhusband can beg, together with her payment for cleaning a neighbour’s house and baking breadfor others.
Afghanistan Research and Evaluation Unit (AREU) 19
Rethinking Rural Livelihoods in Afghanistan
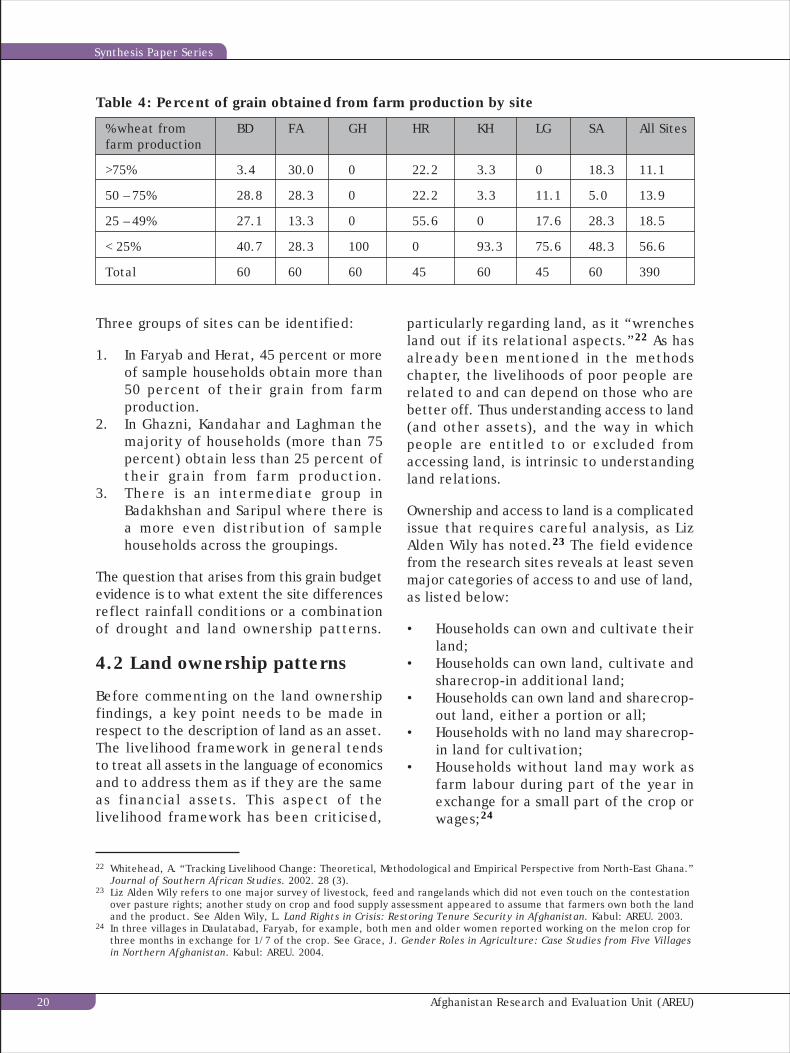
Three groups of sites can be identified:
1. In Faryab and Herat, 45 percent or moreof sample households obtain more than50 percent of their grain from farmproduction.
2. In Ghazni, Kandahar and Laghman themajority of households (more than 75percent) obtain less than 25 percent oftheir grain from farm production.
3. There is an intermediate group inBadakhshan and Saripul where there isa more even distribution of samplehouseholds across the groupings.
The question that arises from this grain budgetevidence is to what extent the site differencesreflect rainfall conditions or a combinationof drought and land ownership patterns.
4.2 Land ownership patterns
Before commenting on the land ownershipfindings, a key point needs to be made inrespect to the description of land as an asset.The livelihood framework in general tendsto treat all assets in the language of economicsand to address them as if they are the sameas financial assets. This aspect of thelivelihood framework has been criticised,
Table 4: Percent of grain obtained from farm production by site
% wheat from BD FA GH HR KH LG SA All Sitesfarm production
>75% 3.4 30.0 0 22.2 3.3 0 18.3 11.1
50 – 75% 28.8 28.3 0 22.2 3.3 11.1 5.0 13.9
25 – 49% 27.1 13.3 0 55.6 0 17.6 28.3 18.5
< 25% 40.7 28.3 100 0 93.3 75.6 48.3 56.6
Total 60 60 60 45 60 45 60 390
particularly regarding land, as it “wrenchesland out if its relational aspects.”22 As hasalready been mentioned in the methodschapter, the livelihoods of poor people arerelated to and can depend on those who arebetter off. Thus understanding access to land(and other assets), and the way in whichpeople are entitled to or excluded fromaccessing land, is intrinsic to understandingland relations.
Ownership and access to land is a complicatedissue that requires careful analysis, as LizAlden Wily has noted.23 The field evidencefrom the research sites reveals at least sevenmajor categories of access to and use of land,as listed below:
• Households can own and cultivate theirland;
• Households can own land, cultivate andsharecrop-in additional land;
• Households can own land and sharecrop-out land, either a portion or all;
• Households with no land may sharecrop-in land for cultivation;
• Households without land may work asfarm labour during part of the year inexchange for a small part of the crop orwages;24
22 Whitehead, A. “Tracking Livelihood Change: Theoretical, Methodological and Empirical Perspective from North-East Ghana.”Journal of Southern African Studies. 2002. 28 (3).
23 Liz Alden Wily refers to one major survey of livestock, feed and rangelands which did not even touch on the contestationover pasture rights; another study on crop and food supply assessment appeared to assume that farmers own both the landand the product. See Alden Wily, L. Land Rights in Crisis: Restoring Tenure Security in Afghanistan. Kabul: AREU. 2003.
24 In three villages in Daulatabad, Faryab, for example, both men and older women reported working on the melon crop forthree months in exchange for 1/7 of the crop. See Grace, J. Gender Roles in Agriculture: Case Studies from Five Villagesin Northern Afghanistan. Kabul: AREU. 2004.
Afghanistan Research and Evaluation Unit (AREU)20
Synthesis Paper Series
• Households without land may notcultivate any land; and
• Households with or without land, butwho own livestock, can access pastureland for grazing animals in areas wherethere is accessible pasture land.
There are a number of further points regardingland ownership that need to be made. First,sharecropping-in is not restricted to the lowerwealth groups, but occurs across all wealthgroups. Second, sharecropping-out is notrestricted to just the wealthier groups, butalso occurs across all wealth groups. This isnot to say that the motivations forsharecropping-in or out are the same acrosswealth groups or even within them. Indeed,evidence from Laghman indicates a tendencyfor larger landholders to sharecrop-out forreasons of both status and to pursuealternatives that are more profitable(essentially pull factors). Poorer households,
however, sharecrop-out because of pushfactors (limited labour or other resourceconstraints, such as lack of draught powerfor cultivation). One man interviewed inSaripul Province, for example, wassharecropping-out land due to a lack ofdraught power and then sharecropping-inland from a landowner with draught power.
For female-headed households who own land,but lack household labour resources, theneed to sharecrop-out may be due to notwanting to cultivate the land themselves,not having the experience to do so, not havingtime to cultivate the land, or it not beingculturally acceptable.
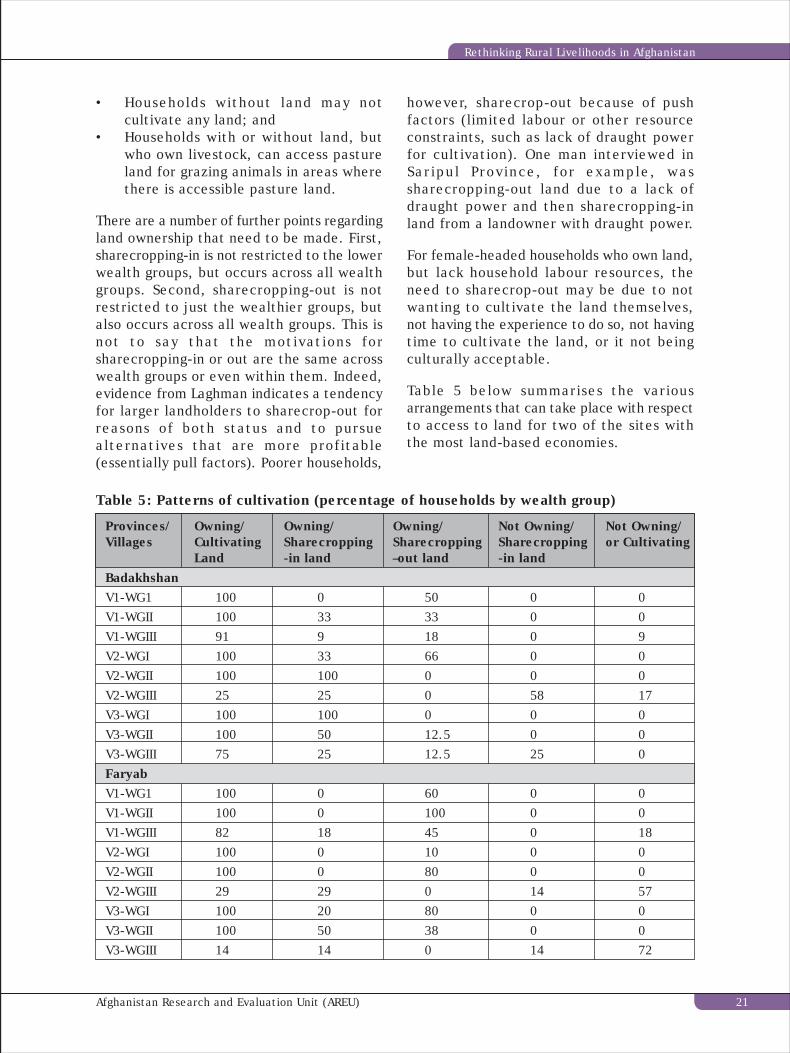
Table 5 below summarises the variousarrangements that can take place with respectto access to land for two of the sites withthe most land-based economies.
Table 5: Patterns of cultivation (percentage of households by wealth group)
Provinces/ Owning/ Owning/ Owning/ Not Owning/ Not Owning/Villages Cultivating Sharecropping Sharecropping Sharecropping or Cultivating
Land -in land –out land -in landBadakhshanV1-WG1 100 0 50 0 0V1-WGII 100 33 33 0 0V1-WGIII 91 9 18 0 9V2-WGI 100 33 66 0 0V2-WGII 100 100 0 0 0V2-WGIII 25 25 0 58 17V3-WGI 100 100 0 0 0V3-WGII 100 50 12.5 0 0V3-WGIII 75 25 12.5 25 0FaryabV1-WG1 100 0 60 0 0V1-WGII 100 0 100 0 0V1-WGIII 82 18 45 0 18V2-WGI 100 0 10 0 0V2-WGII 100 0 80 0 0V2-WGIII 29 29 0 14 57V3-WGI 100 20 80 0 0V3-WGII 100 50 38 0 0V3-WGIII 14 14 0 14 72
Afghanistan Research and Evaluation Unit (AREU) 21
Rethinking Rural Livelihoods in Afghanistan
Motivations for sharecropping thus vary andare driven by context and circumstances. InBadakhshan, sharecropping arrangementshave to be understood in terms of the opiumpoppy economy. Several factors createincentives both for larger landowners tosharecrop-out and for smaller landownersand the landless to sharecrop-in. These factorsinclude a high requirement for labour inpoppy cultivation (350 person days per hectarecompared to 41 for wheat),25 the role ofopium poppy in providing credit, and thepotential for profit. In contrast, in Saripuland Faryab Provinces, where a wheat economydominates the irrigated and rain-fed lands,the current pull of non-farm opportunities,due to relatively well paid urban constructionlabour, has potentially reduced the availablepool of rural labour that are motivated tosharecrop-in.26
The terms under which sharecroppingarrangements are made cannot be assumed.The source of inputs (labour, land, draughtpower and other inputs) influences thesharecropping arrangements, as do otherfactors. These include the availability andprice of farm labour, the crop to be cultivated,whether the land is rain-fed or irrigated, andthe relations between the sharecropper andthe landlord. The economic status of thesharecropper may also affect the agreements.The poorest sharecroppers, in Saripul andFaryab, receive some of their share of thecrop in advance, as they cannot wait untilafter harvest. They then receive a smallershare after the harvest. Similarly, some livein the landlord’s house, receiving food andsometimes clothing, but a smaller share ofthe crop at harvest time. The extent to whichexploitation is bound up in these relationshipswas not explored, but other studies suggestthese relationships can be very exploitative.27
Cross-site comparison of land ownership andcultivation, more generally, highlights thefollowing:
• In Faryab, Kandahar and Saripul Provincesat least 2 of the 3 villages from each sitehave marked differences in the percentof households in WGI and WGII owningand cultivating land compared to thosein WGIII (a difference of more than 50percentage points in at least twovillages).
• In these same three sites, nearly 50percent or more (Faryab 48 percent,Kandahar 90 percent and Saripul 76percent) of WGIII or above householdsdo not own land nor are they cultivatingland. For Kandahar, however, it must bementioned that before the drought manyhouseholds rented-in and sharecroppedland.
• Owning and sharecropping-in land is mostcommon in Badakhshan, Herat andFaryab, although for different reasons.In Badakhshan, for example, this isundoubtedly due to the high labourdemands of opium poppy, whichencourages landowners to sharecrop-outland, while the potential income fromopium poppy encourages those withlimited or no land to sharecrop-in land.
• Owning land and sharecropping-out is aparticular feature of Badakhshan andFaryab Provinces, although again probablyfor different reasons.
• Not owning land but sharecropping-in isessentially restricted to members ofWGIII and occurs across all sites. However,only a relatively small proportion of thesehouseholds are in this position, exceptin Badakhshan, where it is moresignificant (again probably due to poppyproduction).
25 Mansfield, D. “The Economic Superiority of Illicit Drug Production: Myth and Reality,” Opium Poppy Cultivation in Afghanistan,Paper Prepared for the International Conference on Alternative Development in Drug Control and Cooperation, Feldafing,September, 2001.
26 Coke, A. Wheat Seed and Agriculture Programming in Afghanistan: It Potential to Impact on Livelihoods: Two Case Studiesfrom Five Villages in Two Provinces. Kabul: AREU. 2004.
27 See Alden Wily, Land Rights in Crisis: Restoring Tenure Security in Afghanistan, op cit; Christoplos, I. Out of Step? AgriculturalPolicy and Afghan Livelihoods. Kabul: AREU. 2004.
Afghanistan Research and Evaluation Unit (AREU)22
Synthesis Paper Series
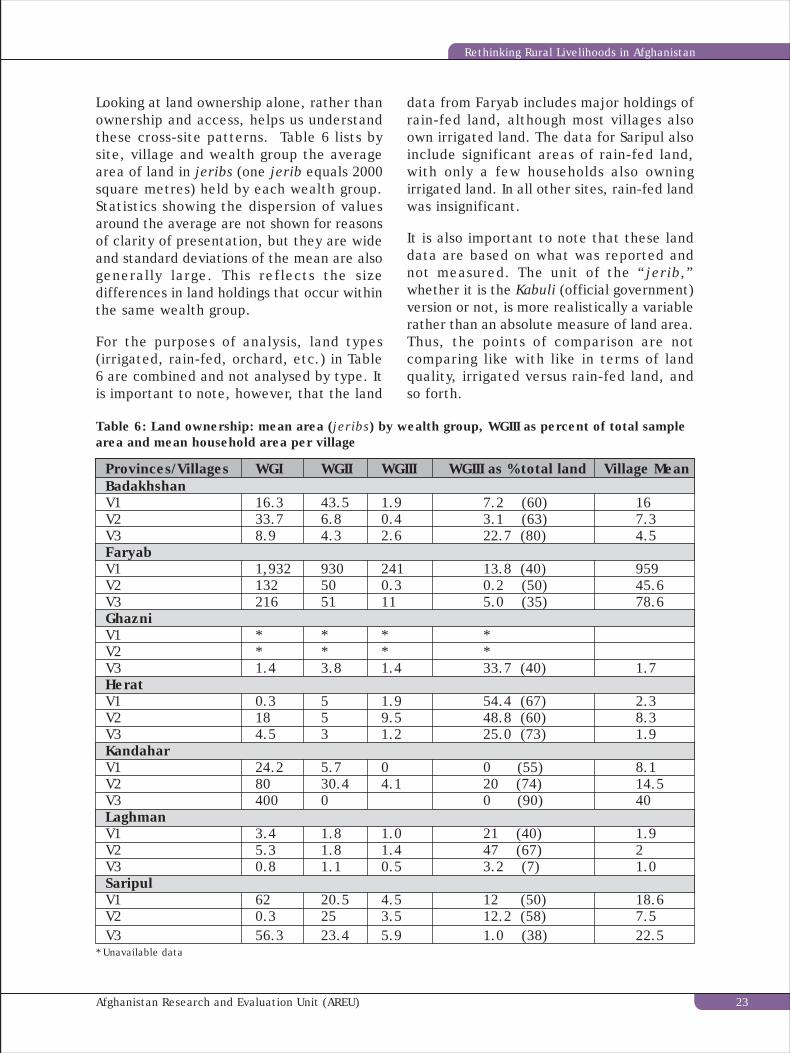
Looking at land ownership alone, rather thanownership and access, helps us understandthese cross-site patterns. Table 6 lists bysite, village and wealth group the averagearea of land in jeribs (one jerib equals 2000square metres) held by each wealth group.Statistics showing the dispersion of valuesaround the average are not shown for reasonsof clarity of presentation, but they are wideand standard deviations of the mean are alsogenerally large. This reflects the sizedifferences in land holdings that occur withinthe same wealth group.
For the purposes of analysis, land types(irrigated, rain-fed, orchard, etc.) in Table6 are combined and not analysed by type. Itis important to note, however, that the land
data from Faryab includes major holdings ofrain-fed land, although most villages alsoown irrigated land. The data for Saripul alsoinclude significant areas of rain-fed land,with only a few households also owningirrigated land. In all other sites, rain-fed landwas insignificant.
It is also important to note that these landdata are based on what was reported andnot measured. The unit of the “jerib,”whether it is the Kabuli (official government)version or not, is more realistically a variablerather than an absolute measure of land area.Thus, the points of comparison are notcomparing like with like in terms of landquality, irrigated versus rain-fed land, andso forth.
Table 6: Land ownership: mean area (jeribs) by wealth group, WGIII as percent of total samplearea and mean household area per village
Provinces/Villages WGI WGII WGIII WGIII as % total land Village MeanBadakhshanV1 16.3 43.5 1.9 7.2 (60) 16V2 33.7 6.8 0.4 3.1 (63) 7.3V3 8.9 4.3 2.6 22.7 (80) 4.5FaryabV1 1,932 930 241 13.8 (40) 959V2 132 50 0.3 0.2 (50) 45.6V3 216 51 11 5.0 (35) 78.6GhazniV1 * * * *V2 * * * *V3 1.4 3.8 1.4 33.7 (40) 1.7HeratV1 0.3 5 1.9 54.4 (67) 2.3V2 18 5 9.5 48.8 (60) 8.3V3 4.5 3 1.2 25.0 (73) 1.9KandaharV1 24.2 5.7 0 0 (55) 8.1V2 80 30.4 4.1 20 (74) 14.5V3 400 0 0 (90) 40LaghmanV1 3.4 1.8 1.0 21 (40) 1.9V2 5.3 1.8 1.4 47 (67) 2V3 0.8 1.1 0.5 3.2 (7) 1.0SaripulV1 62 20.5 4.5 12 (50) 18.6V2 0.3 25 3.5 12.2 (58) 7.5V3 56.3 23.4 5.9 1.0 (38) 22.5
* Unavailable data
Afghanistan Research and Evaluation Unit (AREU) 23
Rethinking Rural Livelihoods in Afghanistan
In column 4, the land holdings of WGIII andbelow (WGIII and IV have been combined)are expressed as a percent of the total landarea of sample households. The number ofhouseholds in these wealth groups (as apercent of the total sample) is expressed inthe brackets. The final column (column 5)states the mean area of the total villagesample.
Looking at the data across all villages andsites, the proportion of land held by WGIIIhouseholds is usually substantially less thantheir weight in the village household sample.For four sites (Badakhshan, Herat, Kandaharand Saripul) the households in WGIII are amajority of sample households (50 percentor more), but own a minority of land. Incomparison, the mean land area of WGIhouseholds is substantially greater than thatof WGII, although not always (contrast Faryaband Kandahar with Ghazni [V3], Badakhshan[V1] and Saripul [V2]).
There are of course exceptions: attention isdrawn particularly to Laghman, Herat andGhazni, where there is more equitable landdistribution (which is not to say that theyare equitable). This finding for Laghman andGhazni reflects the small land areas andmountainous geography of the holdings.However, the data for Herat require furtherinvestigation. This is particularly so ascomparative evidence indicates that thegreatest inequalities in land holdings tend tooccur in the most intensive areas ofcultivation, which are generally intensivelyirrigated areas such as Herat. It must benoted that follow-up interviews in Herat byDACAAR staff found that in village two, 300jeribs of land (compared to a village averageof one to four jeribs per household) is ownedby a man living in Herat City. The owner hadpurchased the land, rather than inheritingit, and now sharecrops most of it out.28
Gender inequalities of landownership alsoexist across most sites, although the patternsof ownership differ both within villages andbetween sites. Table 7 shows the percentageof men from landed households who considerland to be owned jointly by men and women.Of the total households who own land, 31percent said both men and women own theland. This figure is skewed by the fact thatall households in Laghman and Herat reportedthat land is owned jointly. However, follow-up interviews by DACAAR staff in Laghmanand Herat found that women are notconsidered able to exercise any decisionmaking power over the land.29 Moreover,when women inherit land they are mostlyexpected to pass the land onto theirbrothers.30
In terms of women owning land by themselves,only 1.87 percent of women from the sampleown land in their own name, and these aremostly from Badakhshan. Of particular noteis that four women in two of the Badakhshanvillages own land by themselves, despitebeing in male-headed households. It wouldbe interesting to find out how these womenare able to retain ownership in their ownright and what this ownership means forthem. Of the 25 female-headed householdsin the sample, only one woman owns land(though this may be because the remainingwomen are from landless families).
Anecdotal evidence suggests that women maysometimes have to sell their land if they arenot able to cultivate it. Women who ownland and retain it will often sharecrop it out,though this will depend on availability ofhousehold labour. This is an areas thatwarrants much further exploration to see ifthere are ways of supporting women whoown or access land or who can make claimson land to be able to use the land asproductively as possible.
28 Kerr-Wilson, A., and Ghafori, J. Monitoring Afghan Rural Livelihoods: Six Villages in Alingar and Pashtun Zarghun South.Kabul: DACAAR. 2004.
29 Ibid.30 Ibid.; Alden Wily, Land Rights in Crisis: Restoring Tenure Security in Afghanistan, op cit.
Afghanistan Research and Evaluation Unit (AREU)24
Synthesis Paper Series
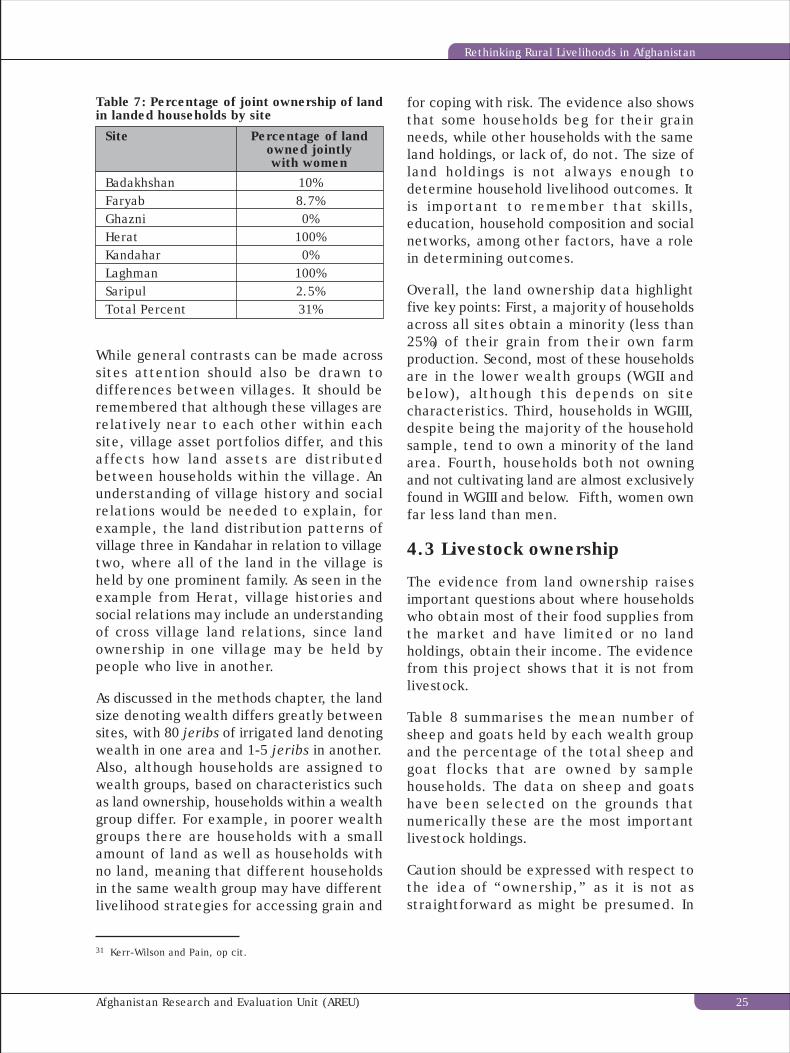
While general contrasts can be made acrosssites attention should also be drawn todifferences between villages. It should beremembered that although these villages arerelatively near to each other within eachsite, village asset portfolios differ, and thisaffects how land assets are distributedbetween households within the village. Anunderstanding of village history and socialrelations would be needed to explain, forexample, the land distribution patterns ofvillage three in Kandahar in relation to villagetwo, where all of the land in the village isheld by one prominent family. As seen in theexample from Herat, village histories andsocial relations may include an understandingof cross village land relations, since landownership in one village may be held bypeople who live in another.
As discussed in the methods chapter, the landsize denoting wealth differs greatly betweensites, with 80 jeribs of irrigated land denotingwealth in one area and 1-5 jeribs in another.Also, although households are assigned towealth groups, based on characteristics suchas land ownership, households within a wealthgroup differ. For example, in poorer wealthgroups there are households with a smallamount of land as well as households withno land, meaning that different householdsin the same wealth group may have differentlivelihood strategies for accessing grain and
for coping with risk. The evidence also showsthat some households beg for their grainneeds, while other households with the sameland holdings, or lack of, do not. The size ofland holdings is not always enough todetermine household livelihood outcomes. Itis important to remember that skills,education, household composition and socialnetworks, among other factors, have a rolein determining outcomes.
Overall, the land ownership data highlightfive key points: First, a majority of householdsacross all sites obtain a minority (less than25%) of their grain from their own farmproduction. Second, most of these householdsare in the lower wealth groups (WGII andbelow), although this depends on sitecharacteristics. Third, households in WGIII,despite being the majority of the householdsample, tend to own a minority of the landarea. Fourth, households both not owningand not cultivating land are almost exclusivelyfound in WGIII and below. Fifth, women ownfar less land than men.
4.3 Livestock ownership
The evidence from land ownership raisesimportant questions about where householdswho obtain most of their food supplies fromthe market and have limited or no landholdings, obtain their income. The evidencefrom this project shows that it is not fromlivestock.
Table 8 summarises the mean number ofsheep and goats held by each wealth groupand the percentage of the total sheep andgoat flocks that are owned by samplehouseholds. The data on sheep and goatshave been selected on the grounds thatnumerically these are the most importantlivestock holdings.
Caution should be expressed with respect tothe idea of “ownership,” as it is not asstraightforward as might be presumed. In
Table 7: Percentage of joint ownership of landin landed households by site
Site Percentage of landowned jointlywith women
Badakhshan 10%Faryab 8.7%Ghazni 0%Herat 100%Kandahar 0%Laghman 100%Saripul 2.5%Total Percent 31%
31 Kerr-Wilson and Pain, op cit.
Afghanistan Research and Evaluation Unit (AREU) 25
Rethinking Rural Livelihoods in Afghanistan
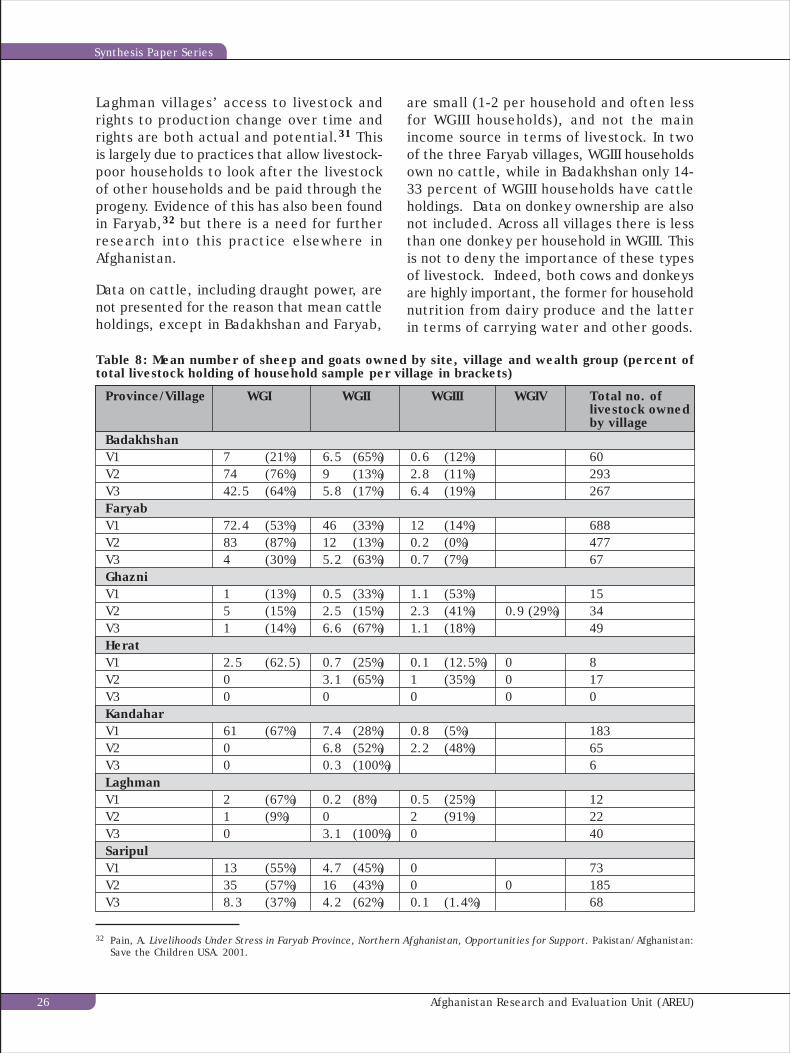
Laghman villages’ access to livestock andrights to production change over time andrights are both actual and potential.31 Thisis largely due to practices that allow livestock-poor households to look after the livestockof other households and be paid through theprogeny. Evidence of this has also been foundin Faryab,32 but there is a need for furtherresearch into this practice elsewhere inAfghanistan.
Data on cattle, including draught power, arenot presented for the reason that mean cattleholdings, except in Badakhshan and Faryab,
are small (1-2 per household and often lessfor WGIII households), and not the mainincome source in terms of livestock. In twoof the three Faryab villages, WGIII householdsown no cattle, while in Badakhshan only 14-33 percent of WGIII households have cattleholdings. Data on donkey ownership are alsonot included. Across all villages there is lessthan one donkey per household in WGIII. Thisis not to deny the importance of these typesof livestock. Indeed, both cows and donkeysare highly important, the former for householdnutrition from dairy produce and the latterin terms of carrying water and other goods.
32 Pain, A. Livelihoods Under Stress in Faryab Province, Northern Afghanistan, Opportunities for Support. Pakistan/Afghanistan:Save the Children USA. 2001.
Table 8: Mean number of sheep and goats owned by site, village and wealth group (percent oftotal livestock holding of household sample per village in brackets)
Province/Village WGI WGII WGIII WGIV Total no. oflivestock ownedby village
BadakhshanV1 7 (21%) 6.5 (65%) 0.6 (12%) 60V2 74 (76%) 9 (13%) 2.8 (11%) 293V3 42.5 (64%) 5.8 (17%) 6.4 (19%) 267FaryabV1 72.4 (53%) 46 (33%) 12 (14%) 688V2 83 (87%) 12 (13%) 0.2 (0%) 477V3 4 (30%) 5.2 (63%) 0.7 (7%) 67GhazniV1 1 (13%) 0.5 (33%) 1.1 (53%) 15V2 5 (15%) 2.5 (15%) 2.3 (41%) 0.9 (29%) 34V3 1 (14%) 6.6 (67%) 1.1 (18%) 49HeratV1 2.5 (62.5) 0.7 (25%) 0.1 (12.5%) 0 8V2 0 3.1 (65%) 1 (35%) 0 17V3 0 0 0 0 0KandaharV1 61 (67%) 7.4 (28%) 0.8 (5%) 183V2 0 6.8 (52%) 2.2 (48%) 65V3 0 0.3 (100%) 6LaghmanV1 2 (67%) 0.2 (8%) 0.5 (25%) 12V2 1 (9%) 0 2 (91%) 22V3 0 3.1 (100%) 0 40SaripulV1 13 (55%) 4.7 (45%) 0 73V2 35 (57%) 16 (43%) 0 0 185V3 8.3 (37%) 4.2 (62%) 0.1 (1.4%) 68
Afghanistan Research and Evaluation Unit (AREU)26
Synthesis Paper Series
The general pattern of household sheep andgoat ownership is fairly clear:
• Ghazni, Herat and Laghman have minimalsheep and goat flocks (50 or less pervillage). These are also the sites wheremean land holdings are small (no greaterthan seven jeribs and usually three orless) across all wealth groups.
• Kandahar and Saripul have moderateholdings of sheep and goats (50 – 200per village). In village one in Kandaharand village two in Saripul ownership isskewed towards the higher wealthgroups.
• In the remaining two sites of Badakhshanand Faryab two of the villages in eachsite have more than 250 sheep and goatsand in these villages ownership is stronglyskewed towards the higher wealthgroups.
The difference between sites in part reflectsthe traditional importance of livestock as alivelihood in certain areas. For example, thepeople of one of the villages in Faryab havetraditionally been very involved in livestockrearing and this is how these people identifythemselves.
The evidence indicates that poorer wealthgroups have minimal livestock holdings acrossall sites. Thus limited land and livestockholdings are characteristics of poorer wealthgroups.
Women’s ownership of livestock is far lessthan that of men’s. Including cattle, draughtpower, sheep and goats, donkey and chickens,ownership solely by women accounts for 24percent, male ownership for 54 percent andjoint ownership for 22 percent. This pictureis somewhat distorted by including chickens,which are generally considered to be ownedby women and which have a much lower cashvalue. The picture is also skewed by the factthat most livestock owned in the three Ghaznivillages is considered to be jointly owned,which makes the amount of joint ownershipoverall look far greater. Analysing cattle,sheep and goats only changes the statistical
picture, with only 11 percent of householdscontaining women who own cattle, sheepand goats. There also appears to be somedifference between wealth groups, withpoorer wealth groups containing highernumbers of households in which women ownlivestock. This may be in part due to thelarger number of WGIII female-headedhouseholds, as 10 of the 24 female-headedhouseholds own some livestock, usually onegoat or one cow.
Women, therefore, tend to own far less landand far less livestock, though again what thisownership, or lack of, really means in practiceis not completely understood. What isapparent, however, is that it is more commonfor women to own livestock than land. Thedata on activities also show that women arevery involved in livestock management.Neither this ownership, nor women’s role inlivestock management, appears to bereflected in a majority of programming linkedto livestock. Projects targeting women rarelyextend their remit beyond chickens, whichare notoriously prone to disease, and generatelittle income compared to other types oflivestock.
The evidence on grain budgets, land assetsand livestock holdings all point to agriculturehaving a limited role in supplying, directlyor indirectly, grain for a significant numberof poorer households. This finding raises anessential question – how are people obtainingincome?
4.4 Household income portfolios
This section examines the issue of incomediversity and the relative contribution ofdifferent income sources, before exploringspecific income sources. Information on theimportance of different income sources wasobtained by a ranking exercise for each seasonduring the previous year. This method waschosen because quantitative data on incomeare difficult to obtain and their reliability isuncertain. It should also be noted that thecontribution of income in-kind – thesubsistence component from farm production
Afghanistan Research and Evaluation Unit (AREU) 27
Rethinking Rural Livelihoods in Afghanistan
– is not included in this analysis. This sectionis only referring to cash sources of income.
The income categories are: farm labour, non-farm labour, livestock sales, farm sales,remittance, carpets and gilims, credit andloans, land mortgage, wild plants, trade andtransport, and other asset sales. The datadiscussed are combined from all four seasons.
4.4.1 Livelihoods diversity
To develop a picture of livelihoods diversity,the overall number of income sources isanalysed against the contribution the largestincome source made to the total income.This is determined by using a very crudemeasure of counts, i.e., the number of timesan income source is reported. This does nottell us the amount of income from eachsource nor does it give an indication of returnfor effort or time expended (both importantissues in understanding the relative returnof different activities). Non-farm labour, forexample, may well be different (or not) fora WGI household compared to a WGIIIhousehold.
From the data collected on livelihoodsdiversity, there are a number of keyobservations:
• The majority of households havediversified income sources. 18 percentof sample households have one to twoincome sources, 34 percent have threeto four income sources, 30 percent havefive to six income sources, and 17 percenthave more than seven income sources.Overall, nearly 50 percent have five ormore income sources.
• At one end of the spectrum are wealthgroups that obtain income from one ortwo sources, either of which contributesmore than 50 percent to total income.Groups across all wealth groups and sitesare in this category, except for villagesin Faryab.
33 Ibid.
• At the other end of the spectrum areseven of the nine wealth groups of FaryabProvince (and WGII from one Badakhshanvillage). These wealth groups have morethan seven income sources with no onesource contributing more than 25 percentof income. In fact, in a number of theFaryab households there are up to 10income sources.
• The majority of wealth groups across allsites have between three and six incomesources. Half of these have one sourcecontributing more than 50 percent ofincome and the other half have onesource contributing between 25 and 50percent of income.
Diversification of income sources is oftenregarded as a strategy of reducing risk inrelation to the reliability and seasonality ofdifferent income sources. It is assumed thatdiversification leads to a more regular incomeand therefore to income smoothing. Theeffectiveness of diversification, of course,depends on the extent to which there arechoices and opportunities (which often thereare not) and is also determined by the extentto which one income source is dependent onanother.
It is important to note, however, particularlyunder crisis conditions, that the significanceof non-farm income is often positivelycorrelated with the shocks affecting crop orlivestock income. As agricultural incomescollapse, so do non-farm incomes. A goodexample of this is the collapse in carpetprices in Faryab during the drought:households shifted into carpet production asall agricultural options failed, leading to anexpansion of production, and a sharp declinein carpet prices.33
In analysing diversification it is important todistinguish between diversification undertakenas a risk coping strategy and, therefore, ina sense forced, and diversification as a
Afghanistan Research and Evaluation Unit (AREU)28
Synthesis Paper Series
strategy of accumulating income and assets.Much of the evidence found in otherenvironments suggests that in practice notonly is diversification a coping strategy, butalso that households may achieve little incomesmoothing as a result. This is because incomesremain highly episodic and unreliable. Thusdiversification may not be taking placebecause of risk handling, but because of thefact that income sources are both short-termand unreliable and households are simplyseeking to find any form of employment.
There is also a question as to whether it isthe household that is multi-tasking (differentmembers doing different things over spaceand time) or if it is an individual within thehousehold. If the ability to diversify dependson household labour, labour poor householdsmay find it particularly difficult to diversify.The amount of household labour availablewill obviously not only depend on the size ofthe household but also on the compositionin terms of age and sex. One man in SayyadDistrict, Saripul, for example, spoke of howhe was unable to sharecrop-in land as hishousehold consisted of himself, his wife andhis young son. His wife took care of their sonand he could not sharecrop-in sufficient landby himself.
What the data from this study show is thatin the vast majority of households differentmembers are engaged in diverse incomegenerating activities. Also, individualhousehold members are often involved invarying activities depending on the season,and this changes depending on the activitiesof other household members. However, therealso tends to be household members who areengaged in similar work all year round. Forexample, in carpet weaving households,women tend to be involved in weaving allyear round. For households with land who donot sharecrop-out, individual householdmembers may mostly be involved inagriculture all year round. The combination
of activities obviously depends on householdsize and composition. Chart 1 provides anexample of income source diversification ina poor household in one of the Faryab villages.
From the limited sample size it is not possibleto identify a link between household size andwealth status. In some villages, the largesthouseholds are in the wealthiest groups,while in others they are in the poorest groups.The effect of household size is likely to bemodified by the asset portfolio of thehousehold. For example, if a household hassome land and a lot of male members overthe age of 15, it may be possible to use someof the family labour for working on the land,while the labour of others can be freed upto engage in other income generatingactivities. Conversely, a family with the sameamount of land, but few adult members, maynot wish to sharecrop-out if the land is small,and may have to use household labour towork on the land, resulting in no membersengaging in other activities.
Wealth status and income generatingopportunities will also change during thecourse of time. For example, if a female-headed household has only young children,obtaining income would be very difficultwithout strong social support mechanisms.However, when the children are old enoughto work, the household’s situation could bevery different. The money either paid orreceived during the marriage of children mayalso positively or negatively affect a householddepending on the sex of the child, withhouseholds generally receiving money fordaughters and paying money for the marriageof sons. Whether a household is headed bya man or a widow may also affect wealthstatus, as women generally have fewer incomegenerating options. This is obviously notalways the case and will depend on theirassets in terms of land, livestock, children,skills, savings and social and supportnetworks.
Afghanistan Research and Evaluation Unit (AREU) 29
Rethinking Rural Livelihoods in Afghanistan
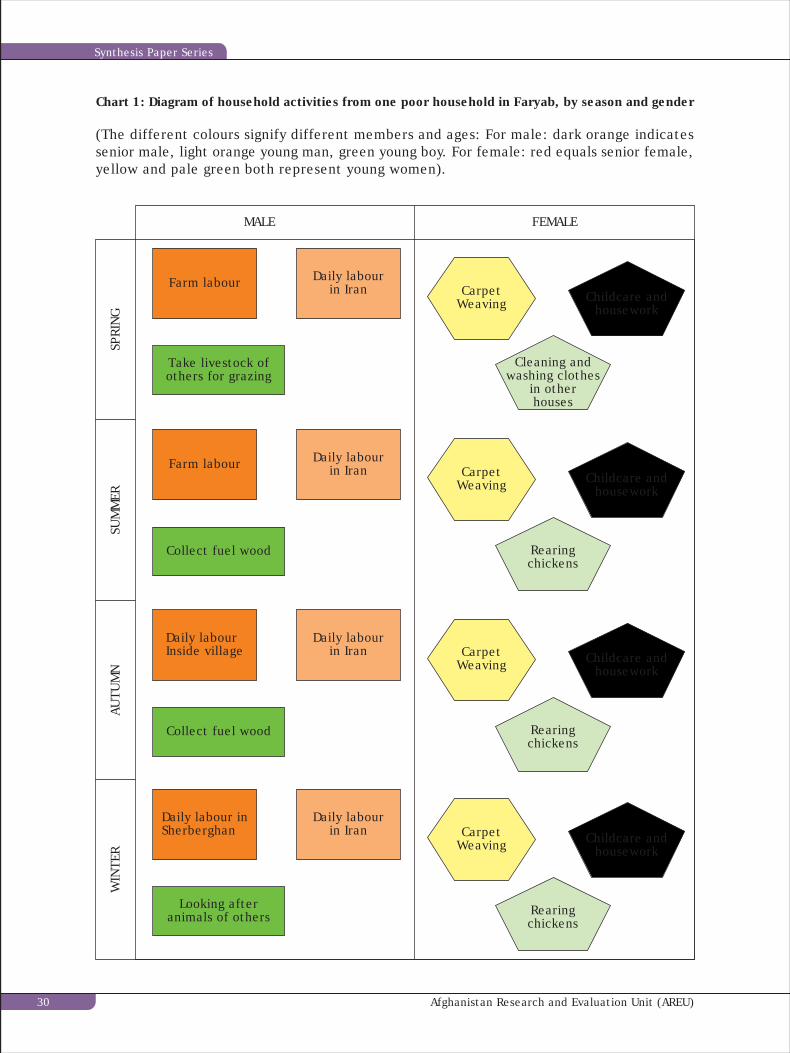
Chart 1: Diagram of household activities from one poor household in Faryab, by season and genderW
INTE
RAU
TUM
NSU
MM
ERSP
RIN
G
MALE FEMALE
Daily labourInside village
Daily labourin Iran
Collect fuel wood
Daily labour inSherberghan
Daily labourin Iran
Looking afteranimals of others
Farm labour Daily labourin Iran
Collect fuel wood
Farm labour Daily labourin Iran
Take livestock ofothers for grazing
CarpetWeaving Childcare and
housework
Cleaning andwashing clothes
in otherhouses
CarpetWeaving Childcare and
housework
Rearingchickens
CarpetWeaving Childcare and
housework
Rearingchickens
CarpetWeaving Childcare and
housework
Rearingchickens
(The different colours signify different members and ages: For male: dark orange indicatessenior male, light orange young man, green young boy. For female: red equals senior female,yellow and pale green both represent young women).
Afghanistan Research and Evaluation Unit (AREU)30
Synthesis Paper Series
The relationship between the size of ahousehold and wealth may depend on thedefinition of a household being used. Forexample, the National Surveillance System(NSS) found that larger households wereassociated with wealth. However, the NSSdefined household as “a group of individualssharing income and expenditure and that areliving within the same compound.” Largerhouseholds were considered to be wealthier,as more members were able to pool incomeand expenditure. Conversely smallerhouseholds, who were not able to pool theirincome, and had become separate units,were considered poorer.34
For poorer households there may be greaterconstraints in starting profitable, risk-reducingdiversification. Profitable diversificationgenerally requires skills and education, whichpoor households often do not have. Instead,poor households tend to move into activitiesthat have low entry costs, such as firewoodcollection, and casual urban and agriculturalemployment. It is the households with capital,skills and probably strong social networkswho can move into shop keeping, livestockrearing, trade, etc.
Some households who diversify have one mainincome source with the other sources actingas supplementary income. In otherhouseholds, each income source may be verysmall, but equally as important. For example,CARE found that in the Ghazni villageslivestock is a key income source, yet lookingat the small numbers of livestock owned thisis not immediately apparent. This shows theimportance of understanding locally ahousehold’s range of income sources. If onlylivestock numbers were examined, a verydifferent understanding of the importanceof livestock as a coping strategy for Ghaznivillages may have been obtained.
Having looked at income diversification, itis important to examine the nature of incomesources.
4.4.2 Income sources
Table 9 summarises the most importantreported income sources. Box 1 (top left handcorner) shows that for the nine wealth groupsfound in this box, seven reported non-farmlabour, one reported wood and the otherreported crop sales as their greatest sourceof income.
There are several key points to be made inrelation to the data. First, for nearly 54percent of wealth groups the most importantsource of income is non-farm labour,35
whether it is wealth groups with only one totwo or five to six sources of income. Forwealth groups that have more than sevenincome sources, only 30 percent reportednon-farm labour as the most important source.
Looking at cash income sources alone doesnot necessarily mean that non-farm labouris the most important income source. Forexample, if a household obtains most cashincome from non-farm labour, but is fulfillingits food needs from its own production, thenfarming may still be the most importantincome source. However, when the main cashincome source is compared with whether thehousehold accesses the majority of its grainfrom its own production, or from the marketor other means, together with the numberof months the households are said to be foodself-sufficient, a fairly consistent pictureemerges. The majority of the poorest wealthgroups obtain grain from means other thantheir own production, are food self-sufficientfor only a very small part of the year, andobtain their main cash income from non-farmlabour (see Appendix 2 for a breakdown offood self-sufficiency and main cash incomes).Non-farm labour is also the main incomesource for some of the richest wealth groupsin particular areas.
More specifically, in 18 out of the 21 villagesstudied non-farm labour is the most important
34 Personal communication with Wendy Johnecheck.35 Non-farm labour is used here to refer to work that is not agricultural, either on-farm or off-farm.
Afghanistan Research and Evaluation Unit (AREU) 31
Rethinking Rural Livelihoods in Afghanistan
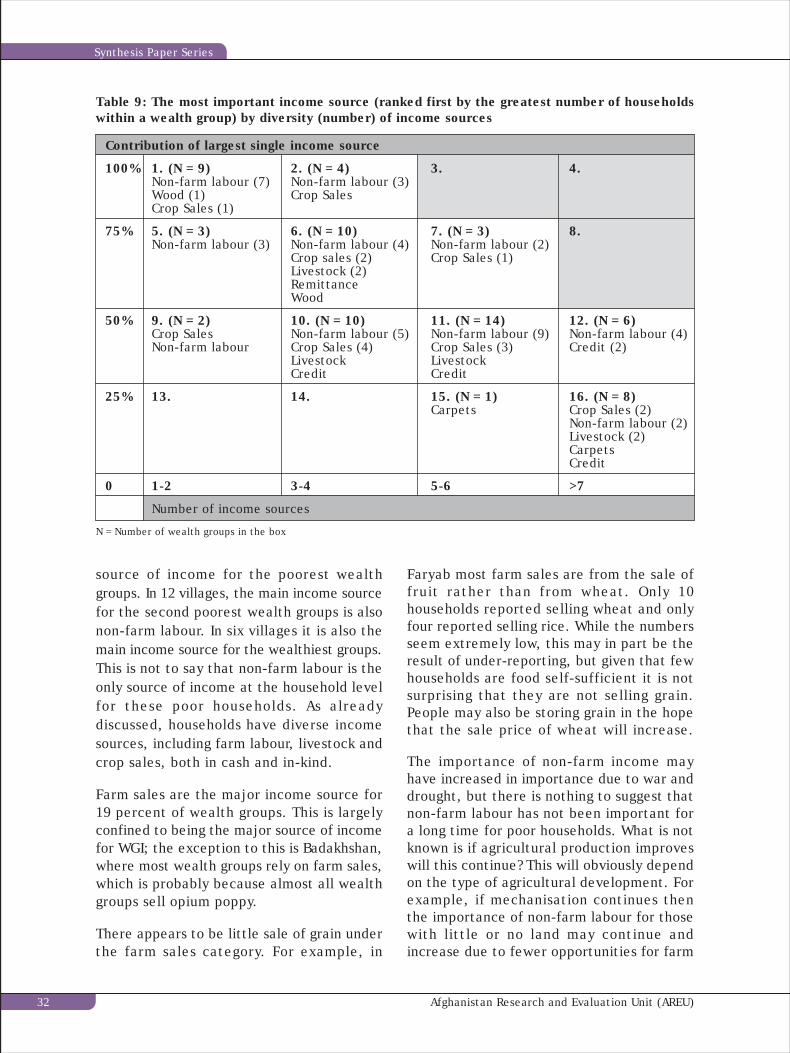
source of income for the poorest wealthgroups. In 12 villages, the main income sourcefor the second poorest wealth groups is alsonon-farm labour. In six villages it is also themain income source for the wealthiest groups.This is not to say that non-farm labour is theonly source of income at the household levelfor these poor households. As alreadydiscussed, households have diverse incomesources, including farm labour, livestock andcrop sales, both in cash and in-kind.
Farm sales are the major income source for19 percent of wealth groups. This is largelyconfined to being the major source of incomefor WGI; the exception to this is Badakhshan,where most wealth groups rely on farm sales,which is probably because almost all wealthgroups sell opium poppy.
There appears to be little sale of grain underthe farm sales category. For example, in
Table 9: The most important income source (ranked first by the greatest number of householdswithin a wealth group) by diversity (number) of income sources
Contribution of largest single income source
100% 1. (N = 9) 2. (N = 4) 3. 4.Non-farm labour (7) Non-farm labour (3)Wood (1) Crop SalesCrop Sales (1)
75% 5. (N = 3) 6. (N = 10) 7. (N = 3) 8.Non-farm labour (3) Non-farm labour (4) Non-farm labour (2)
Crop sales (2) Crop Sales (1)Livestock (2)RemittanceWood
50% 9. (N = 2) 10. (N = 10) 11. (N = 14) 12. (N = 6)Crop Sales Non-farm labour (5) Non-farm labour (9) Non-farm labour (4)Non-farm labour Crop Sales (4) Crop Sales (3) Credit (2)
Livestock LivestockCredit Credit
25% 13. 14. 15. (N = 1) 16. (N = 8)Carpets Crop Sales (2)
Non-farm labour (2)Livestock (2)CarpetsCredit
0 1-2 3-4 5-6 >7
Number of income sources
N = Number of wealth groups in the box
Faryab most farm sales are from the sale offruit rather than from wheat. Only 10households reported selling wheat and onlyfour reported selling rice. While the numbersseem extremely low, this may in part be theresult of under-reporting, but given that fewhouseholds are food self-sufficient it is notsurprising that they are not selling grain.People may also be storing grain in the hopethat the sale price of wheat will increase.
The importance of non-farm income mayhave increased in importance due to war anddrought, but there is nothing to suggest thatnon-farm labour has not been important fora long time for poor households. What is notknown is if agricultural production improveswill this continue? This will obviously dependon the type of agricultural development. Forexample, if mechanisation continues thenthe importance of non-farm labour for thosewith little or no land may continue andincrease due to fewer opportunities for farm
Afghanistan Research and Evaluation Unit (AREU)32
Synthesis Paper Series
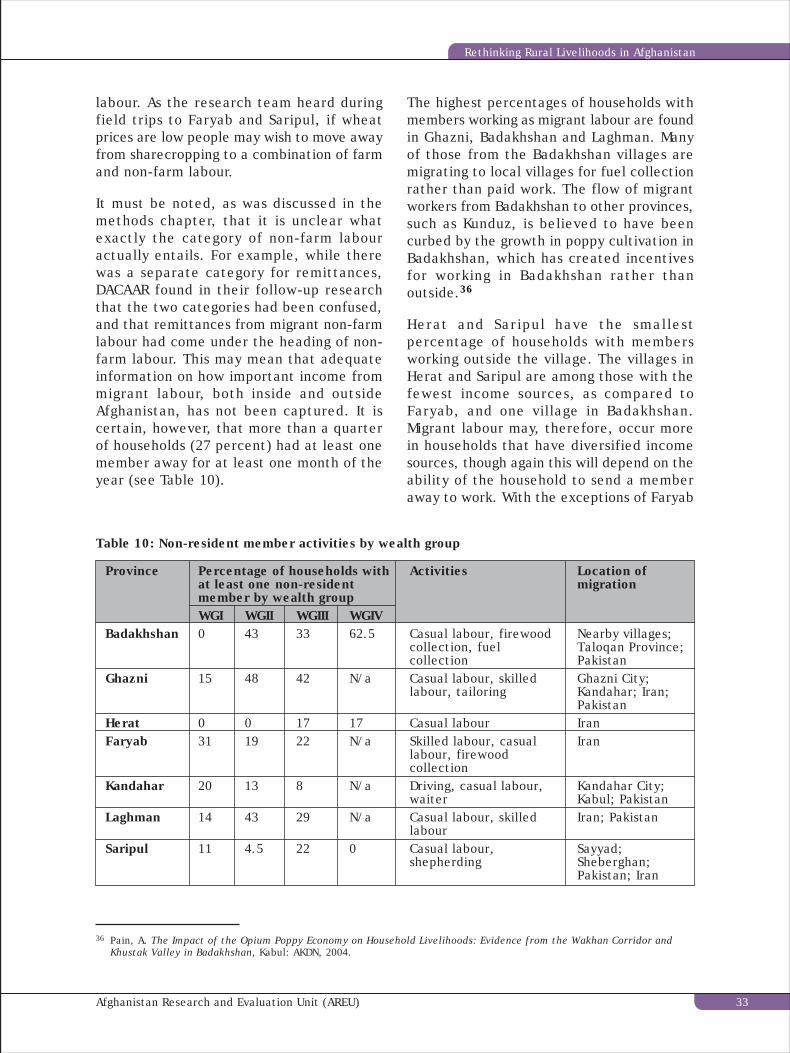
labour. As the research team heard duringfield trips to Faryab and Saripul, if wheatprices are low people may wish to move awayfrom sharecropping to a combination of farmand non-farm labour.
It must be noted, as was discussed in themethods chapter, that it is unclear whatexactly the category of non-farm labouractually entails. For example, while therewas a separate category for remittances,DACAAR found in their follow-up researchthat the two categories had been confused,and that remittances from migrant non-farmlabour had come under the heading of non-farm labour. This may mean that adequateinformation on how important income frommigrant labour, both inside and outsideAfghanistan, has not been captured. It iscertain, however, that more than a quarterof households (27 percent) had at least onemember away for at least one month of theyear (see Table 10).
The highest percentages of households withmembers working as migrant labour are foundin Ghazni, Badakhshan and Laghman. Manyof those from the Badakhshan villages aremigrating to local villages for fuel collectionrather than paid work. The flow of migrantworkers from Badakhshan to other provinces,such as Kunduz, is believed to have beencurbed by the growth in poppy cultivation inBadakhshan, which has created incentivesfor working in Badakhshan rather thanoutside.36
Herat and Saripul have the smallestpercentage of households with membersworking outside the village. The villages inHerat and Saripul are among those with thefewest income sources, as compared toFaryab, and one village in Badakhshan.Migrant labour may, therefore, occur morein households that have diversified incomesources, though again this will depend on theability of the household to send a memberaway to work. With the exceptions of Faryab
Table 10: Non-resident member activities by wealth group
Province Percentage of households with Activities Location ofat least one non-resident migrationmember by wealth groupWGI WGII WGIII WGIV
Badakhshan 0 43 33 62.5 Casual labour, firewood Nearby villages;collection, fuel Taloqan Province;collection Pakistan
Ghazni 15 48 42 N/a Casual labour, skilled Ghazni City;labour, tailoring Kandahar; Iran;
PakistanHerat 0 0 17 17 Casual labour IranFaryab 31 19 22 N/a Skilled labour, casual Iran
labour, firewoodcollection
Kandahar 20 13 8 N/a Driving, casual labour, Kandahar City;waiter Kabul; Pakistan
Laghman 14 43 29 N/a Casual labour, skilled Iran; Pakistanlabour
Saripul 11 4.5 22 0 Casual labour, Sayyad;shepherding Sheberghan;
Pakistan; Iran
36 Pain, A. The Impact of the Opium Poppy Economy on Household Livelihoods: Evidence from the Wakhan Corridor andKhustak Valley in Badakhshan, Kabul: AKDN, 2004.
Afghanistan Research and Evaluation Unit (AREU) 33
Rethinking Rural Livelihoods in Afghanistan
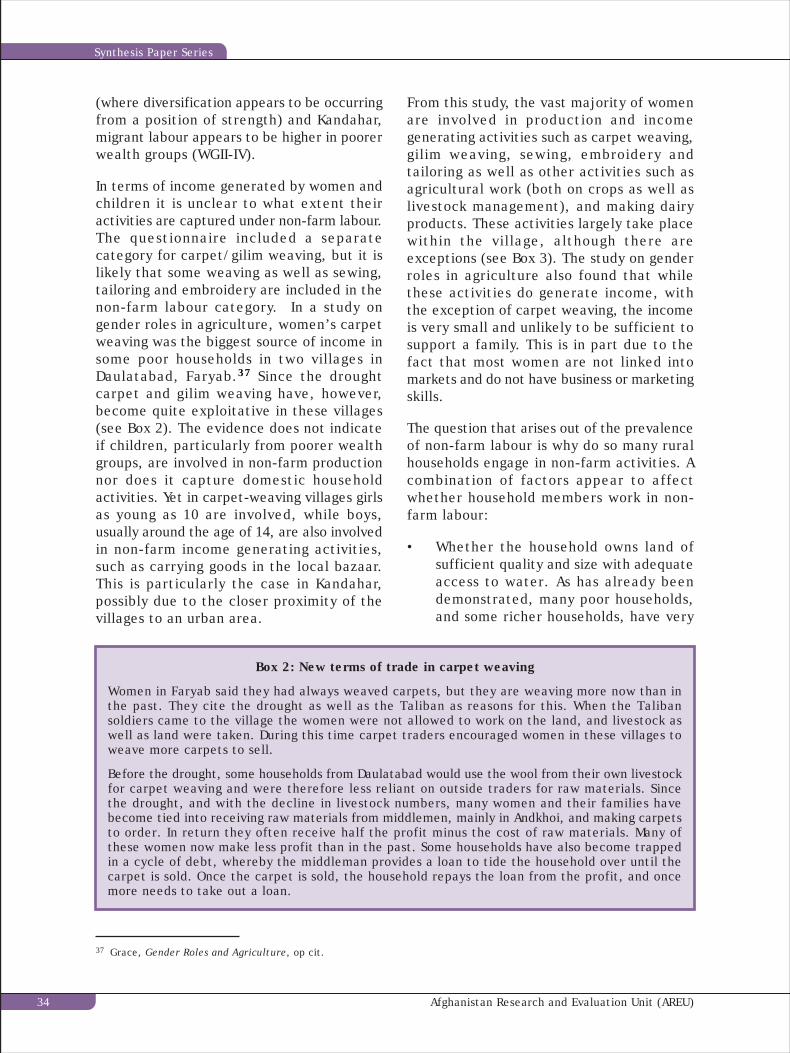
(where diversification appears to be occurringfrom a position of strength) and Kandahar,migrant labour appears to be higher in poorerwealth groups (WGII-IV).
In terms of income generated by women andchildren it is unclear to what extent theiractivities are captured under non-farm labour.The questionnaire included a separatecategory for carpet/gilim weaving, but it islikely that some weaving as well as sewing,tailoring and embroidery are included in thenon-farm labour category. In a study ongender roles in agriculture, women’s carpetweaving was the biggest source of income insome poor households in two villages inDaulatabad, Faryab.37 Since the droughtcarpet and gilim weaving have, however,become quite exploitative in these villages(see Box 2). The evidence does not indicateif children, particularly from poorer wealthgroups, are involved in non-farm productionnor does it capture domestic householdactivities. Yet in carpet-weaving villages girlsas young as 10 are involved, while boys,usually around the age of 14, are also involvedin non-farm income generating activities,such as carrying goods in the local bazaar.This is particularly the case in Kandahar,possibly due to the closer proximity of thevillages to an urban area.
From this study, the vast majority of womenare involved in production and incomegenerating activities such as carpet weaving,gilim weaving, sewing, embroidery andtailoring as well as other activities such asagricultural work (both on crops as well aslivestock management), and making dairyproducts. These activities largely take placewithin the village, although there areexceptions (see Box 3). The study on genderroles in agriculture also found that whilethese activities do generate income, withthe exception of carpet weaving, the incomeis very small and unlikely to be sufficient tosupport a family. This is in part due to thefact that most women are not linked intomarkets and do not have business or marketingskills.
The question that arises out of the prevalenceof non-farm labour is why do so many ruralhouseholds engage in non-farm activities. Acombination of factors appear to affectwhether household members work in non-farm labour:
• Whether the household owns land ofsufficient quality and size with adequateaccess to water. As has already beendemonstrated, many poor households,and some richer households, have very
Box 2: New terms of trade in carpet weaving
Women in Faryab said they had always weaved carpets, but they are weaving more now than inthe past. They cite the drought as well as the Taliban as reasons for this. When the Talibansoldiers came to the village the women were not allowed to work on the land, and livestock aswell as land were taken. During this time carpet traders encouraged women in these villages toweave more carpets to sell.
Before the drought, some households from Daulatabad would use the wool from their own livestockfor carpet weaving and were therefore less reliant on outside traders for raw materials. Sincethe drought, and with the decline in livestock numbers, many women and their families havebecome tied into receiving raw materials from middlemen, mainly in Andkhoi, and making carpetsto order. In return they often receive half the profit minus the cost of raw materials. Many ofthese women now make less profit than in the past. Some households have also become trappedin a cycle of debt, whereby the middleman provides a loan to tide the household over until thecarpet is sold. Once the carpet is sold, the household repays the loan from the profit, and oncemore needs to take out a loan.
37 Grace, Gender Roles and Agriculture, op cit.
Afghanistan Research and Evaluation Unit (AREU)34
Synthesis Paper Series
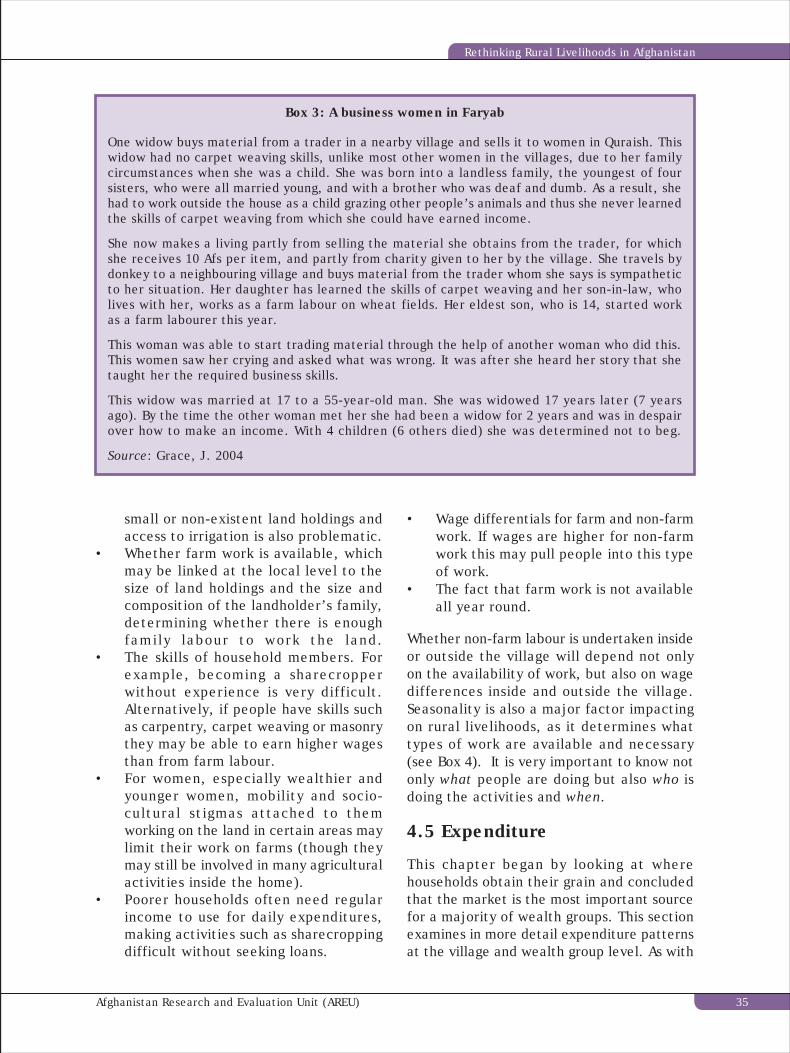
small or non-existent land holdings andaccess to irrigation is also problematic.
• Whether farm work is available, whichmay be linked at the local level to thesize of land holdings and the size andcomposition of the landholder’s family,determining whether there is enoughfamily labour to work the land.
• The skills of household members. Forexample, becoming a sharecropperwithout experience is very difficult.Alternatively, if people have skills suchas carpentry, carpet weaving or masonrythey may be able to earn higher wagesthan from farm labour.
• For women, especially wealthier andyounger women, mobility and socio-cultural stigmas attached to themworking on the land in certain areas maylimit their work on farms (though theymay still be involved in many agriculturalactivities inside the home).
• Poorer households often need regularincome to use for daily expenditures,making activities such as sharecroppingdifficult without seeking loans.
• Wage differentials for farm and non-farmwork. If wages are higher for non-farmwork this may pull people into this typeof work.
• The fact that farm work is not availableall year round.
Whether non-farm labour is undertaken insideor outside the village will depend not onlyon the availability of work, but also on wagedifferences inside and outside the village.Seasonality is also a major factor impactingon rural livelihoods, as it determines whattypes of work are available and necessary(see Box 4). It is very important to know notonly what people are doing but also who isdoing the activities and when.
4.5 Expenditure
This chapter began by looking at wherehouseholds obtain their grain and concludedthat the market is the most important sourcefor a majority of wealth groups. This sectionexamines in more detail expenditure patternsat the village and wealth group level. As with
Box 3: A business women in Faryab
One widow buys material from a trader in a nearby village and sells it to women in Quraish. Thiswidow had no carpet weaving skills, unlike most other women in the villages, due to her familycircumstances when she was a child. She was born into a landless family, the youngest of foursisters, who were all married young, and with a brother who was deaf and dumb. As a result, shehad to work outside the house as a child grazing other people’s animals and thus she never learnedthe skills of carpet weaving from which she could have earned income.
She now makes a living partly from selling the material she obtains from the trader, for whichshe receives 10 Afs per item, and partly from charity given to her by the village. She travels bydonkey to a neighbouring village and buys material from the trader whom she says is sympatheticto her situation. Her daughter has learned the skills of carpet weaving and her son-in-law, wholives with her, works as a farm labour on wheat fields. Her eldest son, who is 14, started workas a farm labourer this year.
This woman was able to start trading material through the help of another woman who did this.This women saw her crying and asked what was wrong. It was after she heard her story that shetaught her the required business skills.
This widow was married at 17 to a 55-year-old man. She was widowed 17 years later (7 yearsago). By the time the other woman met her she had been a widow for 2 years and was in despairover how to make an income. With 4 children (6 others died) she was determined not to beg.
Source: Grace, J. 2004
Afghanistan Research and Evaluation Unit (AREU) 35
Rethinking Rural Livelihoods in Afghanistan
the income data, information on expenditurewas gained through a ranking system,identifying the most important householdexpenditures, for each season during theprevious year. This has been aggregated forthe whole year through a weighted scoringsystem38 in order to capture a picture ofvillage expenditure patterns, which aresummarised in Table 11. This hides patternsof difference between wealth groups, whichwill be discussed later.
Table 11 includes the most common items ofexpenditure across villages. Notably absentfrom the list is payments for taxation, whichwas not reported by any household. Theloaning out of money was only reported invery few cases.
Not surprisingly, across all sites and villagesexpenditure on food is ranked first inimportance. In only a few cases, and theseare a few households in WGI in Kandahar,Herat and Faryab, is expenditure on food notthe most important item. There is noinformation on the nature of the food
Box 4: Combinations of farm and non-farm labour in Saripul and Faryab
In a village in Saripul one man carries out work such as bringing water, protecting wheat andmelon fields and weeding for three months in the summer. He also grazes people’s livestock formoney and milk. After the agricultural work is finished he works on other types of day labour.People know he does this kind of work and approach him to carry out various tasks such asconstruction. In November he goes to Sheberghan and Mazar-e-Sharif for non-farm day labouruntil spring, and receives Afs 150 compared to Afs 70-100 in the village. He had been a sharecropperbefore the drought but these opportunities are now fewer as landlords are cultivating their ownland. He also lost his oxen during the drought.
A village in Faryab, which is upstream to other villages visited in Daulatabad, has more wateravailable and as a result non-farm activities such as brick-making are possible. One man interviewedwas making bricks to order as well as carrying out construction work on other people’s housesand canal cleaning. He only had one son and his wife was busy with housework as there was noone else to help her, so she was unable to weave carpets. During the brick-making period hesaves some of the income to use in winter when this work is not possible.
Source: Grace, J. 2004
expenditure – is it on wheat, rice or otherfood items? While not all NGOs were able tocollect information on amounts ofexpenditure, information from those whocould shows that the poorest groupssometimes had the highest expenditures aswell as cash income. This is because theygenerally receive cash payments and spendcash on food, which means they are probablymore dependent on the cash economy andsusceptible to changes in food prices.39
A second distinct expenditure feature is therepayment of loans, and in the case of Faryab,Badakhshan and Laghman the acquisition ofassets. This issue of debts and changes inassets is addressed in more detail in the nextsection.
Expenditure on education takes place in somehouseholds across all sites, although rankingusually at least fourth or less in importance.In contrast, for many villages expenditure onhealth is the second or third most importantitem of expenditure. It is unclear what thishealth expenditure means, although a more
38 A ranking system summing the household rankings for each income source and weighted by wealth group according to thenumber of positive answers.
39 This is also reflected in the studies by Christoplos and also by Lautze, et al.
Afghanistan Research and Evaluation Unit (AREU)36
Synthesis Paper Series
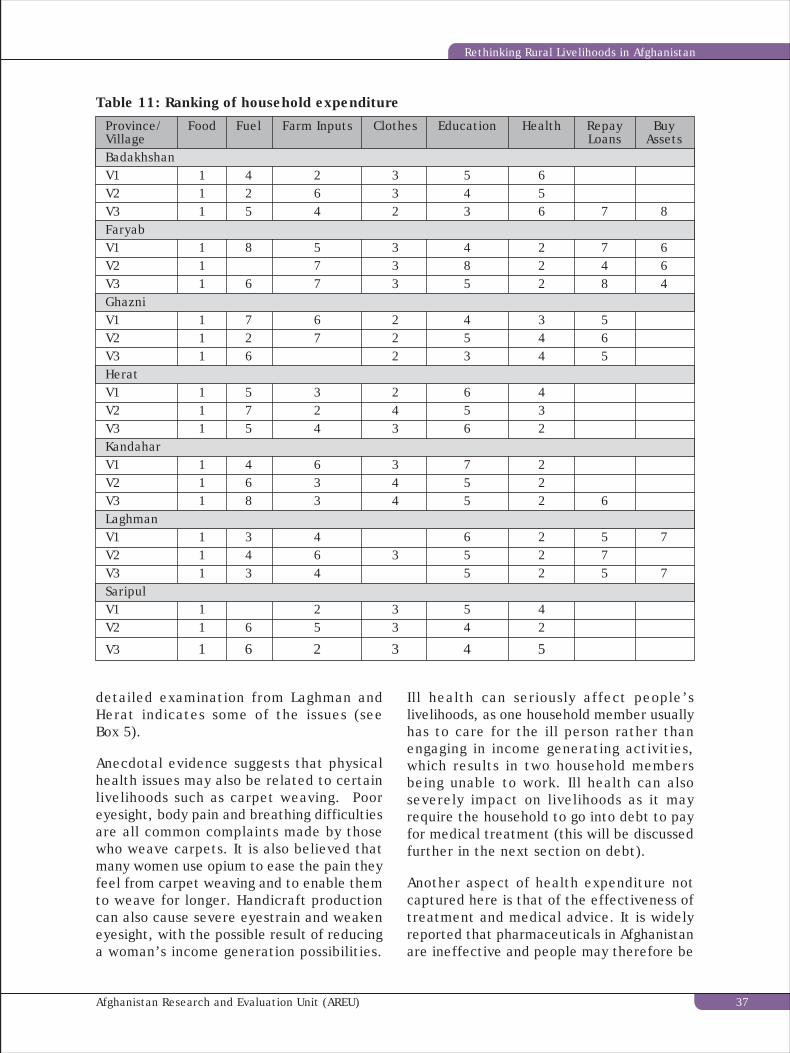
detailed examination from Laghman andHerat indicates some of the issues (seeBox 5).
Anecdotal evidence suggests that physicalhealth issues may also be related to certainlivelihoods such as carpet weaving. Pooreyesight, body pain and breathing difficultiesare all common complaints made by thosewho weave carpets. It is also believed thatmany women use opium to ease the pain theyfeel from carpet weaving and to enable themto weave for longer. Handicraft productioncan also cause severe eyestrain and weakeneyesight, with the possible result of reducinga woman’s income generation possibilities.
Table 11: Ranking of household expenditureProvince/ Food Fuel Farm Inputs Clothes Education Health Repay BuyVillage Loans AssetsBadakhshanV1 1 4 2 3 5 6V2 1 2 6 3 4 5V3 1 5 4 2 3 6 7 8FaryabV1 1 8 5 3 4 2 7 6V2 1 7 3 8 2 4 6V3 1 6 7 3 5 2 8 4GhazniV1 1 7 6 2 4 3 5V2 1 2 7 2 5 4 6V3 1 6 2 3 4 5HeratV1 1 5 3 2 6 4V2 1 7 2 4 5 3V3 1 5 4 3 6 2KandaharV1 1 4 6 3 7 2V2 1 6 3 4 5 2V3 1 8 3 4 5 2 6LaghmanV1 1 3 4 6 2 5 7V2 1 4 6 3 5 2 7V3 1 3 4 5 2 5 7SaripulV1 1 2 3 5 4V2 1 6 5 3 4 2
V3 1 6 2 3 4 5
Ill health can seriously affect people’slivelihoods, as one household member usuallyhas to care for the ill person rather thanengaging in income generating activities,which results in two household membersbeing unable to work. Ill health can alsoseverely impact on livelihoods as it mayrequire the household to go into debt to payfor medical treatment (this will be discussedfurther in the next section on debt).
Another aspect of health expenditure notcaptured here is that of the effectiveness oftreatment and medical advice. It is widelyreported that pharmaceuticals in Afghanistanare ineffective and people may therefore be
Afghanistan Research and Evaluation Unit (AREU) 37
Rethinking Rural Livelihoods in Afghanistan

repeatedly spending money on uselessmedication.40
Expenditure on fuel features quite widely;it is ranked as a more significant item ofexpenditure in high altitude places(Badakhshan, Ghazni and Laghman). In someways this is a surprising finding given theobservational evidence of fuel collection inmany locations by many households and thereports of fuel collection at particular timesof the year. In part this may reflect a shortageof fuel as a consequence of the drought, butthis probably needs more detailedcorroboration. It may also suggest thathouseholds collect fuel types such as woodfor sale and purchase or gather cheaper fuelsfor their own use.
Expenditure on farm inputs features acrossall sites, but the village level aggregationhas hidden the distributional dimensions ofthis. Expenditure on farm inputs is rankedhigher for WGI households than for WGIIIhouseholds, for whom it features much lower,if at all. The exception to this is Badakhshanwhere the proportion of sharecropping-in, asa result of opium poppy cultivation, combinedwith the requirements of planting poppy,gives farm inputs a particular significance.
4.6 Debts
A significant feature of household expenditureis the repayment of loans, and from this studyit appears that large numbers of ruralhouseholds are indebted. From the data,there are two key dimensions of debt to beanalysed: (i) the extent to which land ismortgaged, and (ii) the extent of cash andfood debts households carry.
On the issue of mortgaged land, the evidenceis that the amount of land that is mortgagedis very small. In four sites – Faryab, Ghazni,Kandahar and Laghman – no households haveany land under mortgage. For the other threesites, some households have land undermortgage. In Herat, one WGI household, fromvillage three, has one jerib mortgaged. TwoWGIII households from village two in Saripulhad a total of seven and a half jeribs undermortgage. In Badakhshan, three WGIIIhouseholds, from village one, had a total offive jeribs mortgaged. In village three(Badakhshan) another three households, againin WGIII, had a total of three jeribs undermortgage. There may be different reasonsfor mortgaging land, but the majority of theabove cases appear to be the result ofdrought. Payment for the treatment of an
Box 5: Health expenditure in Laghman and Herat
In Laghman and Herat, households are spending between nine and 26 percent of income on health,with poorer households genrally spending more than richer households. While there is littledifference between the amounts spent on health between seasons, spending on health is generallyhigher in winter.
Reasons for these health problems may include poor housing and sanitation conditions, poornutrition, the young age at which girls are married and begin having children as well as mentalhealth problems due to war and poverty.
To pay for these illnesses households operate a range of strategies from mortgaging out land,taking loans, migrating abroad to earn money for treatment, and selling valuables.
Source: Adapted from Kerr-Wilson, A. and Ghafori, J. 2004
40 Karimi, A. The Pharmaceutical System in Afghanistan. Unpublished Draft. Kabul: AREU. 2004.
Afghanistan Research and Evaluation Unit (AREU)38
Synthesis Paper Series

illness of a family member was also given asa reason for mortgaging land. Indeed, onewoman said she had mortgaged land as wellas borrowed a substantial amount of moneyto pay for her husband’s illness.
In the case of Badakhshan, anecdotal evidencesuggests that the reason for some householdsengaging in poppy production is to earnenough money to get their land out ofmortgage. Three households did manage toretrieve their land, but whether this was duethe sale of poppy is unclear.
The evidence on other forms of debt gives arather different picture. Table 12 summarisesthe debts that households reported holdingat the time of the first interview. The datarefer only to cash debts. This is because onlya minority of debts were reported as beingin grain, and these were largely found inareas of surplus grain production, namelyFaryab (across all three villages) and Saripul(in village two). Grain debts typically rangedfrom 20 to 60 seers of wheat, while themaximum debt was 100 seers of wheat. Giventhat the main reason for taking out loans wasfood, it is somewhat surprising that householdsmostly took out loans in cash. This may beexplained by people having to makerepayments in cash for loans in food. Or, itcould be explained by an apparent lack ofhousehold surplus grain. If on the other handpeople prefer loans in cash, perhaps becausethey see cash as a more stable currency thanfood, then this may have some relevance forthe food-for-work versus cash-for-workdebate. For instance, would this play a partin people’s decisions over whether toparticipate in public works programmesdepending on whether cash or food was beingoffered?
As Table 12 shows, debts are not confinedto households in WGIII, but are in fact foundacross all sites and wealth groups. In somevillages, households in WGI have a greater
level of debt, while in other villages WGIIand WGIII have a higher number of householdswith debt. The same mixed picture emergeswith regards to mean values of debts, and itis important that debts are considered againstthe asset portfolio and income level of eachhousehold and wealth group.
Mean values of debt must be handled withcaution with respect to interpretation, sincethe motivation and reasons for taking loans– and hence its significance – may vary greatly.For example, if we contrast the reasons fortaking out loans between households (seeChart 2), it can be seen that WGI take ahigher proportion of loans for ceremonies( m o s t l y w e d d i n g s ) a n d f o rproductive/investment purposes such asbuying land and livestock compared to WGIII.WGIII takes out more loans for basicnecessities such as food and health, withdebts for health often being quite large,depending on the treatment needed. Poorerhouseholds, in comparison to wealthierhouseholds, are not obtaining loans that willbring them income, which will enable themto repay the loans. Poorer households aretaking out loans as a coping strategy, whilericher households are to some extent seekingloans in order to improve their livelihoods.
Loans for food may also be taken for seasonalconsumption smoothing, and this practice isnot always negative. Loans for consumptionsmoothing can be a very important incomesource for households, particularly as a lackof access to credit may be detrimental if itleads to the sale of assets. A study conductedin Kabul showed that a majority of householdsin the sample without debt had not takenloans because no one would provide themwith credit; these households were deemedtoo poor to be able to repay.41 Debt can,however, be a detrimental coping strategy,if it leads to the sale of assets or mortgagingof land to make repayments. There is a needto learn more about the nature of loans anddebts: Who is able to access credit? Are
41 Grace, J. One Hundred Households in Kabul: A Study of Winter Vulnerability, Coping Strategies, and the Impact of Cash-for –Work Programmes. Kabul: AREU, 2003. Also, see Alden Wily, L. Faryab Land Case Study. Draft. Kabul: AREU. 2004.
Afghanistan Research and Evaluation Unit (AREU) 39
Rethinking Rural Livelihoods in Afghanistan
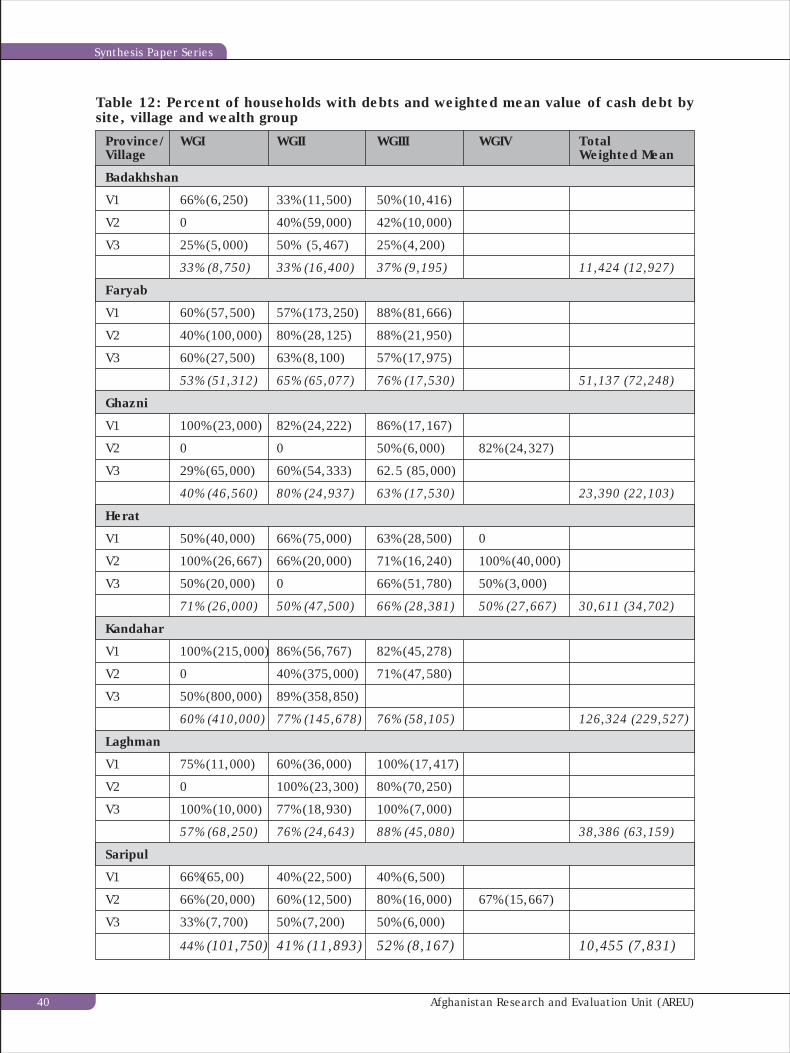
Table 12: Percent of households with debts and weighted mean value of cash debt bysite, village and wealth group
Province/ WGI WGII WGIII WGIV TotalVillage Weighted Mean
Badakhshan
V1 66% (6,250) 33% (11,500) 50% (10,416)
V2 0 40% (59,000) 42% (10,000)
V3 25% (5,000) 50% (5,467) 25% (4,200)
33% (8,750) 33% (16,400) 37% (9,195) 11,424 (12,927)
Faryab
V1 60% (57,500) 57% (173,250) 88% (81,666)
V2 40% (100,000) 80% (28,125) 88% (21,950)
V3 60% (27,500) 63% (8,100) 57% (17,975)
53% (51,312) 65% (65,077) 76% (17,530) 51,137 (72,248)
Ghazni
V1 100% (23,000) 82% (24,222) 86% (17,167)
V2 0 0 50% (6,000) 82% (24,327)
V3 29% (65,000) 60% (54,333) 62.5 (85,000)
40% (46,560) 80% (24,937) 63% (17,530) 23,390 (22,103)
Herat
V1 50% (40,000) 66% (75,000) 63% (28,500) 0
V2 100% (26,667) 66% (20,000) 71% (16,240) 100% (40,000)
V3 50% (20,000) 0 66% (51,780) 50% (3,000)
71% (26,000) 50% (47,500) 66% (28,381) 50% (27,667) 30,611 (34,702)
Kandahar
V1 100% (215,000) 86% (56,767) 82% (45,278)
V2 0 40% (375,000) 71% (47,580)
V3 50% (800,000) 89% (358,850)
60% (410,000) 77% (145,678) 76% (58,105) 126,324 (229,527)
Laghman
V1 75% (11,000) 60% (36,000) 100% (17,417)
V2 0 100% (23,300) 80% (70,250)
V3 100% (10,000) 77% (18,930) 100% (7,000)
57% (68,250) 76% (24,643) 88% (45,080) 38,386 (63,159)
Saripul
V1 66%(65,00) 40% (22,500) 40% (6,500)
V2 66% (20,000) 60% (12,500) 80% (16,000) 67% (15,667)
V3 33% (7,700) 50% (7,200) 50% (6,000)
44% (101,750) 41% (11,893) 52% (8,167) 10,455 (7,831)
Afghanistan Research and Evaluation Unit (AREU)40
Synthesis Paper Series
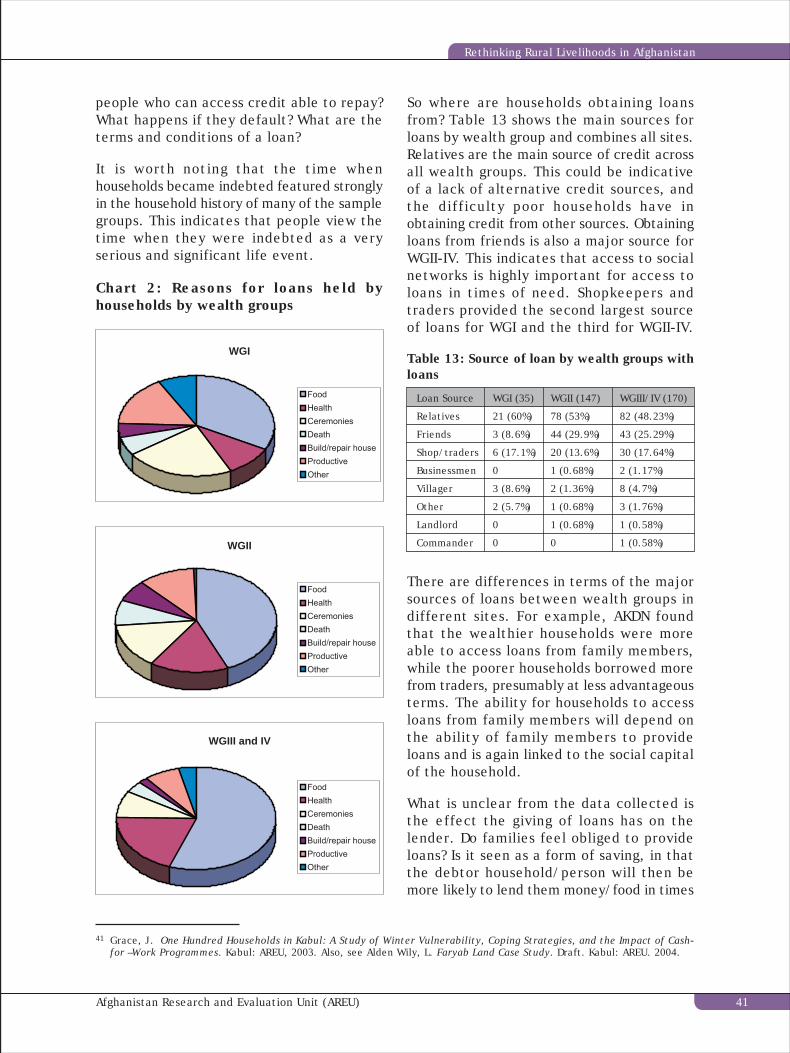
people who can access credit able to repay?What happens if they default? What are theterms and conditions of a loan?
It is worth noting that the time whenhouseholds became indebted featured stronglyin the household history of many of the samplegroups. This indicates that people view thetime when they were indebted as a veryserious and significant life event.
So where are households obtaining loansfrom? Table 13 shows the main sources forloans by wealth group and combines all sites.Relatives are the main source of credit acrossall wealth groups. This could be indicativeof a lack of alternative credit sources, andthe difficulty poor households have inobtaining credit from other sources. Obtainingloans from friends is also a major source forWGII-IV. This indicates that access to socialnetworks is highly important for access toloans in times of need. Shopkeepers andtraders provided the second largest sourceof loans for WGI and the third for WGII-IV.
41 Grace, J. One Hundred Households in Kabul: A Study of Winter Vulnerability, Coping Strategies, and the Impact of Cash-for –Work Programmes. Kabul: AREU, 2003. Also, see Alden Wily, L. Faryab Land Case Study. Draft. Kabul: AREU. 2004.
There are differences in terms of the majorsources of loans between wealth groups indifferent sites. For example, AKDN foundthat the wealthier households were moreable to access loans from family members,while the poorer households borrowed morefrom traders, presumably at less advantageousterms. The ability for households to accessloans from family members will depend onthe ability of family members to provideloans and is again linked to the social capitalof the household.
What is unclear from the data collected isthe effect the giving of loans has on thelender. Do families feel obliged to provideloans? Is it seen as a form of saving, in thatthe debtor household/person will then bemore likely to lend them money/food in times
Chart 2: Reasons for loans held byhouseholds by wealth groups
Table 13: Source of loan by wealth groups withloans
Loan Source WGI (35) WGII (147) WGIII/IV (170)
Relatives 21 (60%) 78 (53%) 82 (48.23%)
Friends 3 (8.6%) 44 (29.9%) 43 (25.29%)
Shop/traders 6 (17.1%) 20 (13.6%) 30 (17.64%)
Businessmen 0 1 (0.68%) 2 (1.17%)
Villager 3 (8.6%) 2 (1.36%) 8 (4.7%)
Other 2 (5.7%) 1 (0.68%) 3 (1.76%)
Landlord 0 1 (0.68%) 1 (0.58%)
Commander 0 0 1 (0.58%)
WGI
WGII
WGIII and IV
Afghanistan Research and Evaluation Unit (AREU) 41
Rethinking Rural Livelihoods in Afghanistan

of need, as has been found in othercontexts?
4.6.1 Debts and change over time
Analysing changes in debt levels during theperiod of monitoring can be undertaken bylooking at the number of households in debtand the mean level of cash debt they hold.Table 14 summarises the evidence on changesin debt during the period of monitoring.
Looking at Badakhshan, the debt levels forWGI and WGII in all villages either stayed thesame or declined, both in terms of the number
of households in debt and the mean level ofcash debt. For WGIII households in villageone, the number of households in debt andthe mean level increased, the latter by aboutthree times. For village two, the number ofhouseholds in debt in WGIII declined by abouteight percentage points, although the meanlevel of debt increased by over two times.In the case of village three, the number ofhouseholds in debt jumped by 50 percent,but the level of debt declined by about 50percent. There is evidence that for householdsin WGIII, new debts are being taken on oncesome old debts have been paid off.
Key: =decline; =increase; no arrow means no change; * refers to no data
Table 14: Changes in debt level: percent of households with debts and the mean value of cashdebts in Afs
Province/Village WGI WGII WGIII WGIVBadakhshanV1 66% (6,250) 33% ( 5,000) 58% ( 34,357)V2 0 25% ( 49,000) 33% ( 23,550)V3 0% 37.5% ( 3,667) 50% ( 2,262)FaryabV1 80%( 28,250) 57% ( 114,500) 63% ( 39,700)V2 40% (100,000) 80% ( 22,500) 75% ( 24,483)V3 60% (30,000) 63% ( 6,300) 100% ( 8,614)GhazniV1 * * *V2 * * *V3 * * *HeratV1 50% (40,000) 66% (75,000) 57% (29,373) 0V2 100% (26,666) 66% ( 40,000) 71% ( 27,041) 100% ( 52,500)V3 50% (20,000) 0 66% ( 43,583) 59% (3,000)KandaharV1 100% ( 290,000) 71% ( 51,920) 72% ( 75,062)V2 0 40% (37,500) 71% (48,150)V3 50% (80,000) 94% ( 64,411)LaghmanV1 100% ( 25,750) 60% ( 60,000) 100% ( 25,667)V2 0 100% ( 108,333) 90% ( 131,062)V3 100% ( 60,000) 85% ( 160,564) 100% (7,000)SaripulV1 * * *V2 0% 20% (?20,000) 20% ( 25,000) 50% ( 6,667)V3 0% 30% (?4,189) 38% ( 8,000)
Afghanistan Research and Evaluation Unit (AREU)42
Synthesis Paper Series
A similar picture emerges for WGI and WGIIhouseholds from Faryab, Herat and Kandahar,with the number of households in debt andthe level of cash debt largely staying thesame or declining. For WGIII households thepicture is more mixed and depends on thevillage as to whether the percent ofhouseholds in debt increased, stayed thesame or declined. The change in the level ofdebt also varied for WGIII householdsaccording to village. In Saripul, for the twovillages for which there is data, the numberof households in debt declined across allwealth groups, although the level of debtincreased in three of the groups.
Unlike the other provinces, in Laghman thenumber of households in debt either stayedthe same or increased and the mean level ofdebt increased for seven of the nine wealthgroups. For example, in villages two andthree the mean level of debt for WGIIhouseholds increased by four and a half andeight and a half times, respectively. Oneexplanation for the increase in the level ofdebt for village two could be the reportedlypoor performance of the opium economyduring the time of research, which couldhave had a significant negative effect onhousehold economies. The increase in villagethree may be more associated with a ban onwoodcutting, which was a main income sourcefor households in all wealth groups in thishigh altitude village (see Box 6).
While the evidence is suggestive of a declinein the level of debt in many sites andparticularly for the richer wealth groups, therather more mixed picture for poorer wealthgroups and the evidence from Laghman arenot encouraging.
Another asset where changes are found duringthe relatively short period of this project islivestock holdings. Table 15 records thechanges in livestock holdings, which, like thedebt data, present a mixed picture bothacross and within sites and between wealthgroups.
It should be remembered that in many sitesand for many wealth groups livestock holdingswere low in the first round of interviews (seeTable 8). Starting from a low base exaggeratesthe significance of percentage changes.However, for the low livestock holding sites– Herat and Laghman (unfortunately there ismissing data for Ghazni with respect tochanges in livestock holdings) – the directionof change is largely positive and appears tobe taking place across all wealth groups. InHerat there have been positive changes,particularly in cattle numbers, while inLaghman positive changes have been recordedfor all wealth groups for cattle and otherlivestock. This raises interesting questionsas to the nature of debt. In particular, haveloans been taken out to invest in livestockor do the increases in livestock reflect naturalgrowth combined with investment? Thiscannot be answered with the available data.
In Kandahar, where livestock holdings areheavily skewed towards village one and WGIhouseholds in general, the poorer wealthgroups appear to still be losing livestock. Itis unknown if this is due to the sale of livestockto purchase other assets, which could possiblybe positive, or due to stress sales, or whetherthe animals died.
In Badakhshan and Faryab, the livestock richsites, the picture is varied. In Badakhshan,notably in poorer wealth groups, livestockholdings in cattle, sheep and goats areincreasing from already moderate levels.Similar changes are to be found in Saripul.In Faryab, on the other hand, where two ofthe villages (village one and two) had thehighest livestock holdings of all the sites,there appears to have been a depletion ofcattle across all wealth groups. Sheep flockshave, however, increased by about fivepercent from an already high base for higherwealth groups, but declined overall for thelowest wealth groups.
Of the women who were reported to havesole ownership of livestock, there is littlechange in livestock holdings. Only three
Afghanistan Research and Evaluation Unit (AREU) 43
Rethinking Rural Livelihoods in Afghanistan
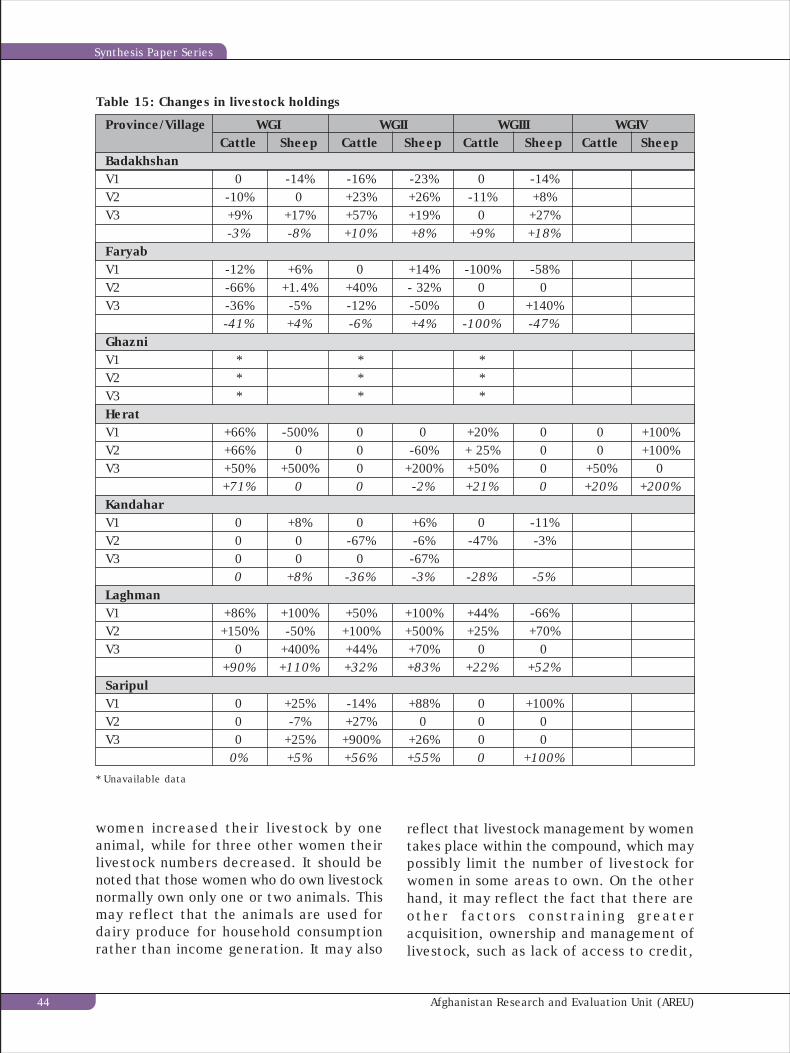
women increased their livestock by oneanimal, while for three other women theirlivestock numbers decreased. It should benoted that those women who do own livestocknormally own only one or two animals. Thismay reflect that the animals are used fordairy produce for household consumptionrather than income generation. It may also
* Unavailable data
Table 15: Changes in livestock holdings
Province/Village WGI WGII WGIII WGIVCattle Sheep Cattle Sheep Cattle Sheep Cattle Sheep
BadakhshanV1 0 -14% -16% -23% 0 -14%V2 -10% 0 +23% +26% -11% +8%V3 +9% +17% +57% +19% 0 +27%
-3% -8% +10% +8% +9% +18%FaryabV1 -12% +6% 0 +14% -100% -58%V2 -66% +1.4% +40% - 32% 0 0V3 -36% -5% -12% -50% 0 +140%
-41% +4% -6% +4% -100% -47%GhazniV1 * * *V2 * * *V3 * * *HeratV1 +66% -500% 0 0 +20% 0 0 +100%V2 +66% 0 0 -60% + 25% 0 0 +100%V3 +50% +500% 0 +200% +50% 0 +50% 0
+71% 0 0 -2% +21% 0 +20% +200%KandaharV1 0 +8% 0 +6% 0 -11%V2 0 0 -67% -6% -47% -3%V3 0 0 0 -67%
0 +8% -36% -3% -28% -5%LaghmanV1 +86% +100% +50% +100% +44% -66%V2 +150% -50% +100% +500% +25% +70%V3 0 +400% +44% +70% 0 0
+90% +110% +32% +83% +22% +52%SaripulV1 0 +25% -14% +88% 0 +100%V2 0 -7% +27% 0 0 0V3 0 +25% +900% +26% 0 0
0% +5% +56% +55% 0 +100%
reflect that livestock management by womentakes place within the compound, which maypossibly limit the number of livestock forwomen in some areas to own. On the otherhand, it may reflect the fact that there areother factors constraining greateracquisition, ownership and management oflivestock, such as lack of access to credit,
Afghanistan Research and Evaluation Unit (AREU)44
Synthesis Paper Series
42 Pain, Understanding Village Institutions, op cit.43 Christoplos, op cit.
and lack of female extension and veterinaryworkers.
4.7 Differences between villages
The evidence examined thus far has largelyfocused on comparative analysis betweensites and between wealth groups. The aimof this section is to discuss the differencesthat exist between villages within sites.
4.7.1 Differences in village assets andhistory
Each village has its own unique history (seeAppendix 1) and, as has already beendiscussed, different villages within a districthave access to different natural resourcessuch as land and water. This access is partlydetermined by location along a valley, interms of water supply and altitude, bypropensity to drought and/or flooding, aswell as to the history of the villages, includingsettlement pattern and conflict overresources. Access will also be partlydetermined by the claims of those inneighbouring villages, for example, to pastureor water.42
Access to natural resources both betweenhouseholds and individuals in each village,and between villages, partly determinespeople’s ability to engage in agriculture. Ashas been shown earlier in this report accessto land is often uneven and many householdsown no land. However, the extent oflandlessness also differs from village to village.For example, in village two in Faryab 40percent of the village was landless, while invillage three 80 percent of the householdsin the village are landless. It is logical thatthe impact of agricultural programmes willdiffer according to the land ownershipsituation.
Christoplos argues that agriculturalprogramming and policy also needs to be
differentiated by area in terms of itsagricultural potential – commercial farmingshould be the focus in high potential areasand food security the focus in low potentialareas.43 Regardless of this differentialbetween high and low areas, it will continueto be important to recognise difference inaccess to assets existing between villages inthe same areas as well as betweenhouseholds. Likewise, it is important toremember that villages within the samedistrict have different levels of access toschools and health care, and that traditionaloccupations and skills can vary greatlybetween villages in close proximity.
All of the above factors, together with localgender relations, household composition andaccess to social networks (as well as what ishappening in the rest of the country and theregion) combine to partially determine thelivelihood options available to people withinvillages. Villages need to be looked atseparately, as livelihood opportunities andconstraints differ within and between villages,and thus appropriate interventions will notbe the same.
4.7.2 Differential effects of policies andpower structures
The reliance of villages and individuals ondiverse assets and income sources means thatvillages and their inhabitants are differentiallyaffected by policies, local politics and powerstructures. For example, in contrast to manyother villages in the area, in village three inLaghman, which is a high altitude village,the majority of villagers have traditionallybeen involved in cutting off dead wood forsale as firewood. Due to a recent ban on thecutting of wood in the area many of thevillagers, who have very small land andlivestock holdings and extremely loweducation levels, have lost one of their mainincome sources (see Box 6). While most ofthe villagers have been affected by this ban,
Afghanistan Research and Evaluation Unit (AREU) 45
Rethinking Rural Livelihoods in Afghanistan

women have been especially hard hit, as theywere generally responsible for collectingfirewood for sale. As a result, women wereable to control and manage some of theirearnings, whereas now they have to ask theirhusbands for money, which is not alwaysgiven.
4.7.3 Wealth differences between villages
In the vast majority of villages wealthierhouseholds are said to be those with largerland holdings and sometimes businesses,while the poorest households are those thatrely on daily labour and at times begging.There are, however, differences betweenvillages. As noted earlier, the size of landholdings needed to be deemed wealthy variesenormously from location to location.
Size of land holdings does not always meana village is richer than another that has lessland. The wealth of a village will in partdepend on who owns the land, whether theland is equitably distributed, the quality of
the land and the availability of resourcessuch as water. CHA/EOCA, for example, foundthat the village they had thought to be thewealthiest was actually not. The village mayhave had much larger land holdings and flocksof livestock, but the other two villages hadbetter access to water and pasture. Thecombination of assets, and not only thequantity, is highly important and varies fromvillage to village.
Similarly, while villages in Faryab and Saripulhave larger amounts of land per village thanvillages in other areas, there is a highproportion of landlessness, which means thatwhile the village as a whole might appearwealthier, individual village members maybe worse off.
Having now looked at the main themesemerging from this project, the next sectionoutlines the major implications and policyrecommendations that can be drawn fromthe above evidence.
Box 6: The politics of wood economy in a village in Laghman
Many of the people of this village, especially the poorest, rely on the collection and sale of woodfrom the forests for their income. Different governments, including the agricultural departmentof the present government, have asked for a ban on the cutting down of wood to preserve theforests. However, the people of this village argued against it, as they had no alternative incomesource.
More recently, DACAAR staff were involved in trying to have a ban imposed on cutting wood.DACAAR enlisted the help of a locally respected man who was instrumental in getting five shurasto agree to a ban. People agreed to the ban for several reasons: DACAAR had always advised themto, it would assist in preventing flooding, it would aid the storage of irrigation water, providetrees for construction in the long term, provide fodder, and beautify the area.
While the poor are now unable to sell wood, the more powerful appear to be profiting from theban. The brother of a local commander takes one truckload to the Wuliswali everyday. As a resultof the ban the powerful are benefiting, wood is still being cut down, though to a lesser extent,and many of the poor are considering turning to poppy cultivation. The poor have also turnedto cutting down their own fruit trees for sale, as this is not banned, which further jeopardisestheir future livelihoods.
Source: Ghafori, J. 2004
Afghanistan Research and Evaluation Unit (AREU)46
Synthesis Paper Series
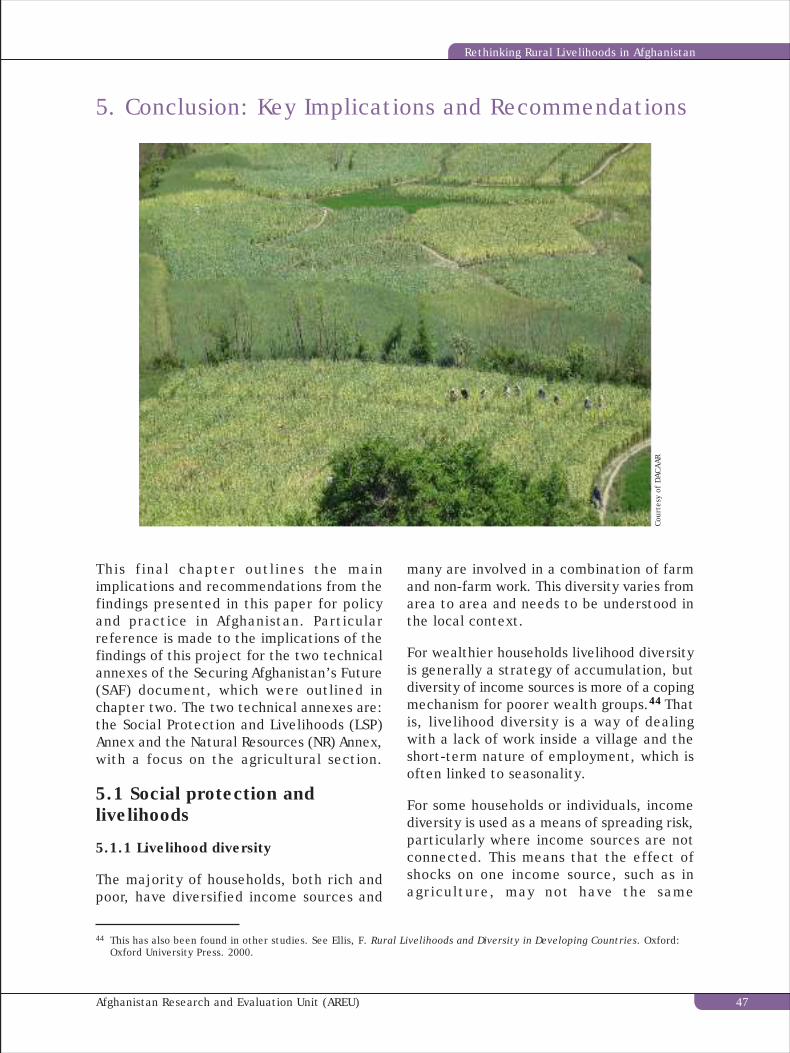
This final chapter outlines the mainimplications and recommendations from thefindings presented in this paper for policyand practice in Afghanistan. Particularreference is made to the implications of thefindings of this project for the two technicalannexes of the Securing Afghanistan’s Future(SAF) document, which were outlined inchapter two. The two technical annexes are:the Social Protection and Livelihoods (LSP)Annex and the Natural Resources (NR) Annex,with a focus on the agricultural section.
5.1 Social protection andlivelihoods
5.1.1 Livelihood diversity
The majority of households, both rich andpoor, have diversified income sources and
5. Conclusion: Key Implications and Recommendations
44 This has also been found in other studies. See Ellis, F. Rural Livelihoods and Diversity in Developing Countries. Oxford:Oxford University Press. 2000.
many are involved in a combination of farmand non-farm work. This diversity varies fromarea to area and needs to be understood inthe local context.
For wealthier households livelihood diversityis generally a strategy of accumulation, butdiversity of income sources is more of a copingmechanism for poorer wealth groups.44 Thatis, livelihood diversity is a way of dealingwith a lack of work inside a village and theshort-term nature of employment, which isoften linked to seasonality.
For some households or individuals, incomediversity is used as a means of spreading risk,particularly where income sources are notconnected. This means that the effect ofshocks on one income source, such as inagriculture, may not have the same
Cour
tesy
of
DAC
AAR
Afghanistan Research and Evaluation Unit (AREU) 47
Rethinking Rural Livelihoods in Afghanistan
immediate effect on the urban wage sector,although wage levels will be affected in both.More research is needed into the linksbetween different income sources andprincipally the link between agriculturegrowth and the non-farm sector. This isparticularly important to investigate ifagriculture is to be the engine of growth inAfghanistan.
Recommendations
The Government of Afghanistan (GoA), UnitedNations (UN) agencies, donors and NGOsshould ensure that their activities supportthe multiple income strategies that poorhouseholds use and not encouragedependence on one sector, such asagriculture, as a livelihoods source. One wayforward could be to:
• Design activities that support an entirehousehold, rather than an individual, toenable responsibility for income diversityto be shifted to the household level. Thiswould result in different householdmembers engaging in different activities,rather than each member engaging inalternate activities. Such an approachto supporting livelihood diversitystrategies would facilitate the spreadingof risk, while securing the income sourcesof individual household members, andthereby enable households to accumulateand build up their asset and skill base.
5.1.2 Non-farm Labour
This study found that in 18 out of the 21villages studied, non–farm labour is the mostimportant source of income for poorer wealthgroups. The current importance of non-farmlabour in rural Afghanistan has majorimplications for the agricultural focus ofmuch rural programming and policy. The vitalrole of non-farm labour in rural Afghanistannecessitates that action be taken towardssupporting the non-farm sector and improvingpeople’s abilities to gain employment andincome in this sector. The current importanceof non-farm labour in rural livelihoods mustbe recognised.
Recommendations
The GoA, UN agencies, donors and NGOs mustrecognise and support the importance of non-farm labour in rural livelihoods and look to:
• Monitor over time employment trendsat the local level, specifically the natureand type of work available, in order toinform rural policy development andprogramming. This will, for example,mean examining whether the non-farmsector continues to be as vital to thepoor over time. The NRVA could be onevehicle through which this could be done.Mechanisms also need to be put in placeto enable NGOs working at the local levelto feed information on trends in theirarea up to the national level.
• Examine and support the skills peoplealready possess, and develop themthrough vocational training combinedwith bus iness tra in ing, whereappropriate. This could enable the ruralpoor to increase their incomes throughbeing able to demand higher wages.
• Build an understanding of the skillsneeded for non-farm labour for menand women, both now and in the future,through labour market research oncurrent work opportunities as well asnewly developing employment areas.
• Link vocational training to businessand/or marketing training, whereappropriate, to enable people to gainthe maximum income benefit from theirproduction and income generationactivities. While business training ismentioned in the LSP Annex, vocationaltraining is not.
• Play a role in enabling people todevelop existing income generatingactivities. This is particularly relevantto microfinance providers. For example,microfinance products could be offeredto female carpet weavers in Daulatabadwho since the drought have had to relyon middlemen to provide raw materials.As a result, women work more as contractlabour for less return. Credit from
Afghanistan Research and Evaluation Unit (AREU)48
Synthesis Paper Series
microfinance providers could enablewomen to buy their own raw materialsand ideally receive more of the profit oftheir labour. For this to be donesuccessfully possible constraints will needto be identified, such as if it is possiblefor women to sell carpets withoutmiddlemen, given unequal powerrelations in the carpet market.
• Explore providing skills training aspart of public works programmes sothat the benefits of involvement in theseprogrammes outlive the project lifetime.
• Ensure that national programmesdirectly benefit women and alsodevelop women oriented strategies.National programmes, such as theNational Emergency EmploymentProgramme (NEEP) and the NationalSolidarity Programme (NSP), should bothdirectly benefit women as well as men,and where this is not possible separatestrategies to benefit women must bedeveloped.
5.1.3 Labour migration
Labour migration, both inside and outsideAfghanistan, is a very important incomestrategy for over a quarter of households.For wealthier households labour migrationmay be a strategy of accumulation. For thepoor it is a crucial way of coping with unevenjob opportunities inside the village, or ofseeking better-paid work. There is, however,currently insufficient knowledge about howlabour migration works and who is involved.
While the SAF does argue for supportingmigrant workers, it provides no strategy asto how this will be done. From this researchsuch strategies could include supporting therights and working conditions of migrantworkers and improving people’s skill base,so that where people need or choose tomigrate they can command higher wages, aswell as providing employment information.Strategies for supporting those who are unableto migrate for financial reasons, but for whommigrant labour could be highly beneficial,
should also be explored. This could includeproviding such people with access to creditfor travel costs as well as covering the basicexpenses needed to support those left behind.
Recommendations
The GoA, UN, donors and NGOs alike needto begin to view migration in a more positivelight, rather than something negative thatshould be prevented, and:
• Undertake research on labourmigration to provide a betterunderstanding of why people migrate,where they migrate, how they migrate,what activities they engage in and whatis needed for migration in terms of skills,information and credit as well as howthose in the source villages are coping.With this understanding the governmentand others could then begin to designstrategies aimed at supporting migrantlabour populations and their families.
5.1.4 Indebtedness
Many households are indebted, rich and pooralike, and indebtedness is a factor in boththe creation as well as the perpetuation ofpoverty. For wealthier households, loans areoften taken either for ceremonies such asweddings, where a large lump sum is needed,or for purposes of production or investment.For poorer households, the majority of loansare taken out as a coping strategy to meetbasic needs such as food and health care. Incontrast to a loan taken out for productivepurposes (if the production is successful),copy strategy loans are unlikely to lead toan improved ability to repay the loan,recognising, of course, that having healthyhousehold members is important for workpurposes.
At the moment, many households are ableto access credit, but the majority of loanscome from family and friends. Somehouseholds are indebted through mortgagingland. These households face the doublechallenge of trying to regain their land bypaying off the mortgage, while in some cases
Afghanistan Research and Evaluation Unit (AREU) 49
Rethinking Rural Livelihoods in Afghanistan

not being able to use their most productiveasset.
Credit for the purchase of food and healthcare is often essential for the poor. Whilerecognising that microfinance organisationsdo not like to provide such loans, for reasonsof financial sustainability, these types ofloans must be available if microfinance isreally to reach the poorest and play a largerole in social protection. Providers, with alarge enough portfolio of wealthier clients,should be able to provide credit to the pooron terms that enable repayment over timein small instalments.
Microfinance lenders should, however, becareful not to disrupt local credit supportmechanisms where they function well. Onthe other hand, providing alternative creditsources could ease the burden of those, oftenfamily members, who lend often quitesubstantial sums of money.
Recommendations
Policy makers and practitioners, particularlyfrom the government and microfinanceproviders should:
• Explore and monitor locally existingcredit mechanisms, particularly theterms and conditions of loans, thepenalties of inability to repay, who isable to access local credit sources, whatloans are used for, and how loans arerepaid. Interventions should then betargeted towards those who havedifficulty accessing credit and repayingloans. If terms and conditions are foundto be highly exploitative then thepossibility of households accessing creditunder fairer terms from microfinanceproviders to repay exploitative loansshould be explored.
• Monitor the level of indebtedness,again possibly through the NRVA, andidentify problem areas in order to preventnegative coping mechanisms for repayingdebts.
• Consider moving part of the moneycurrently allocated for targetedtransfers to the poorest to theMicroFinance Investment and SupportFacility for Afghanistan (MISFA). Thiscould allow MISFA to target the poorestpopulation (who may have a high defaultrate) with credit to meet their basicneeds. This credit could help protect thelivelihoods of the chronically poor andcould be used to gradually assist themto improve their livelihoods through theprovision of credit for income generatingpurposes.
• Study the possibilities of helpingpeople recover assets, such as landheld in debt, as well as helping peopleaccumulate and protect assets. Thepossible positive impact of recovery ofassets such as land on reducing incentivesfor households to engage in poppycultivation should also be explored.
5.1.5 Gender
Recommendations for improving thelivelihoods of both men and women areincluded under each sub-heading in thissection, but a separate sub-heading for genderis warranted given the lack of focus on genderin both the LSP Annex and the NR Annex.While there are no doubt initiatives beingundertaken by NGOs in the field, stepstowards increasing the livelihoods of differenttypes of men and women need to be speltout if clear strategies and actions are to beundertaken. It is unclear how programmesgrouped under LSP, such as NSP and NEEP,will really benefit women as opposed to men,and what steps will be undertaken to carryforward any positive change.
Women have been shown to be involved inmany production and income generatingactivities and to contribute to householdincome, yet few women own resources suchas land and livestock. Inequities, in terms ofaccess to resources, are barely mentioned ineither annex, yet these are very real barriersfor many rural women, especially those whoare financially responsible for their households
Afghanistan Research and Evaluation Unit (AREU)50
Synthesis Paper Series
and who have few income generating optionssufficient to support a family. It is thesestructural inequities that make some female-headed households particularly vulnerableto poverty and it is these structural causesof vulnerability, and not just the symptoms,that need to be tackled.
Women possess many skills that could anddo provide income, such as carpet weaving,tailoring, embroidery, livestock management,and agricultural work such as weeding.However, due to a lack of recognition ofwomen’s work in areas of agriculture, or alack of business and marketing training, theseactivities often generate less income than ispossible.
Recommendations
Policy makers and practitioners from thegovernment, donors and implementingorganisations need to:
• Protect, support and develop thelivelihoods of women. In this regard,the government should work with genderand livelihoods specialists to developexplicit strategies for women, whichdisaggregate how the livelihoods ofwomen vis-à-vis men can be protected,supported and developed.
• Recognise and support women’s rolein agriculture at the policy andprogramme level.
• Conduct market research beforeproviding skills training in areas suchas handicrafts, to ensure there is amarket for the goods produced, andaccompany skills training with businessand market ing tra in ing whereappropriate, to enable women to obtainthe maximum benefits from their labour.
• Tackle the structural causes of genderinequity and look beyond traditionalactivities, such as poultry farming andembroidery.
5.1.6 Health
Health accounts for the second largestexpenditure in the majority of households.
Health is very much a livelihoods issue inthat ill health, either physical or mental, hasan enormous impact on livelihoods. It is amajor factor in creating indebtedness as wellas leading to the depletion of assets throughsales to pay for treatment. Ill health alsoimpacts on livelihoods through the inabilityof the person who is ill, and possibly theircarer, to engage in production or incomegenerating activities. Health is also tied upwith livelihoods through the negative effectson heath of certain types of income generationactivities, such as carpet weaving orembroidery. Labour migration may be anotherlivelihood strategy that has health implicationsthat need to be addressed. If, for example,male migrant workers visit sex workers, ashappens in other parts of the world, theremay be a need for health education to thesegroups, as well as to others, around HIV andAIDS awareness.
Despite all of the above, the Ministry ofHealth (MoH) is not part of the Livelihoodsand Social Protection Consultative Group (LSPCG). Health issues also do not appear to beconsidered either as a livelihoods or a socialprotection issue in the LSP Annex. Instead,it is assumed that social protection will leadto greater ability to access health care. Thisfails to take into account several issues:
1. Social protection as currently outlinedin the LSP will do little for the chronicallypoor (those unable to help themselves)in terms of the income generationstrategies incorporated under LSP.
2. Ill health, either physical or mental,maybe a factor preventing householdsfrom gaining work and may serve toperpetuate poverty. Participation inprogrammes such as NEEP, which arephysically demanding, will require acertain level of health to begin with andthus exclude certain households.Moreover, there are health implicationsin participating in physically demandingwork on a poor diet, while suchparticipation may lead to household foodresources being diverted to those workingon such schemes. These dynamics needto be better understood.
Afghanistan Research and Evaluation Unit (AREU) 51
Rethinking Rural Livelihoods in Afghanistan
45 Karimi, op cit.
3. There is anecdotal evidence that muchof the medication available to householdsis ineffective.45
4. Ill health can prevent either the personwho is ill or the person caring for thesick person from accessing employmentor income.
Recommendations
The government, the LSP CG and/orimplementing organisations should:
• Include the MoH on the LSP CG, ashealth is very much a livelihoods andsocial protection issue. Improvements inhealth care planned under the HealthTechnical Annex of the SAF will have animportant impact on livelihoods andsocial protection, but it is necessary thatlinkages be institutionalised andunderstood, if they are to be effectivelyacted upon.
• Ensure the chronically poor receiveadequate health care. This should bedone by developing measures thatprovide health care under socialprotection strategies to those who donot have access to health care throughparticipation in programmes such asNEEP. While it is difficult to know whichneeds come first – improvement in healthcare or improvements in income enablinggreater access to health care – it appearsthat for the chronically poor, who maybe unable to work, health care is a socialprotection issue. Similarly, for those whocannot currently access employment dueto ill health, health care needs to comefirst.
• Provide advice on livelihood relatedhealth issues in heath educationactivities. For example, for women,advice should be provided on the needto rest your eyes when working onembroidery or carpet weaving, or theneed to wear masks and move around
when weaving carpets and gilims. Whilefor migrant labourers, and others, it maybe appropriate to provide advice on HIVand AIDS.
• More closely control pharmaceuticalsand pharmacies to prevent the sale ofineffective medicine and ensure thatdrugs and antibiotics are only availableby prescription. Health education shouldalso include awareness raising aboutineffective drugs.
5.1.7 Social protection and the “poorestof the poor”
Most current policy and programmes do nottarget the very poor, who are likely to bethose who are unable to work and lack assets.While the LSP Annex has empowerment ofthe most vulnerable as an aim, theprogrammes encompassed within the LSP areunlikely to reach the most vulnerable. Indeed,the document itself raises the question ofwhether to target the “poorest of the poor”or those closer to the poverty line for whoma wider range of possibilities, such asfood/cash for work and micro-finance, areavailable. Programmes such as NEEP and NAPappear to be targeting the latter category.The LSP does mention resource transfers tothe chronic poor, as a “last resort,” but it isunclear how this will work.
The annex does recognise the need tounderstand and work with traditionalmechanisms of support, for those not ableto help themselves, but no strategy for doingthis appears to have been developed. Gainingan understanding of local support networksfor the poorest is crucial to understandingwhether improvements in the livelihoods ofthe less poor are likely to benefit those lessable to help themselves.
This research shows that there does appearto be a relationship between the wealth ofthe less poor and poorer groups. For example,a mullah in Herat spoke of how his life had
Afghanistan Research and Evaluation Unit (AREU)52
Synthesis Paper Series
been very difficult during the drought as herelied on alms from others. Those who gavehim alms were badly hit by the drought andwere only able to give him a very smallamount, which was not enough for him tosupport his family. Similarly, in two of thevillages in Kandahar, shura members said thatthe amount of alms given to the poorestmembers of the community had changedduring and since the drought. In one village,no alms are given to the poorest now, whilein the other village people reported givingsubstantially less to the poor than before thedrought.
Helping wealthier households to give moreto poorer households, as required in Islam,would not tackle inequitable powerstructures, but it could be one way throughwhich the poorest are targeted. Separatestrategies to target the poorest will also beneeded.
Recommendations
Policy makers and practitioners in governmentministries and/or NGOs should:
• Target resources to households withyoung children in which adults are notable to work. This may enable thechildren of these households to attendschool, rather than work from an earlyage, and give them the skills to improvetheir livelihoods in the long term.
• Use community workers to raiseawareness of the long-term livelihoodsconsequence of women marrying mucholder men. This could be one way inwhich the vulnerability of women to foodinsecurity in later life could be reduced,although it is likely that such practiceswould be reduced if people were not aspoor.
There is also a need to gain moreunderstanding of the following:
• The extent to which the traditional givingof alms has been affected by events such
as drought and war and to what extentthese informal social protection systemsare still functioning. It is equallynecessary to determine to what extentimproved livelihoods for some lead togreater support for the poorest.
• The characteristics of those individualsand households who are unable to supportthemselves. This study found the poorestto be those who resorted to begging.Understanding more about thecharacteristics of these people andengaging them in a dialogue would enablebetter programme and policy design toassist them.
• The structural factors that keep peoplein poverty and how to break throughthem. For example, in the case of female-headed households a large factor is thelack of opportunities for women toengage in income generating activitiesthat provide sufficient income to supporta family. This is linked to a lack ofownership of productive assets, such asland and livestock, which to a largedegree stems from socio-cultural normsand stigmas that dictate what peoplecan and should do.
5.2 Agriculture
This study found that a majority of poorhouseholds access most of their grain fromthe market or from other means, and thatnon-farm labour, rather than agriculture, isthe most important source of income for amajority of the poorest households. Thisraises questions over the accuracy of thefrequently cited “80% of the population aredependent on agriculture.” Agriculture playsa role in the lives of many of the rural poor,but this research shows that even underrelatively good agricultural productionconditions, agriculture plays less of a rolethan other income sources, if any, in manypoor households in different parts ofAfghanistan.
Many of the poorest households are landlessand own few livestock. Women have been
Afghanistan Research and Evaluation Unit (AREU) 53
Rethinking Rural Livelihoods in Afghanistan

found to own far less land and livestock thanmen. These findings have huge implicationsfor the assumptions in the NR Annex thatagricultural reconstruction can be equitable,particularly given that participation inagriculture is not equitable because ofunequal land ownership between men andwomen and households.
There is, moreover, a disjunction betweenthe recognition of livelihood diversity andthe importance of non-farm labour in the LSPAnnex, and the fact that this is not mentionedin the NR Annex. Indeed the latter statesthat:
“The overall sector objectives are thatimproved livelihoods and economicconditions of rural families, and enhancedhousehold food security will result intheir active participation in the nationaleconomic growth that will be guaranteedthrough deployment of improved,efficient and sustainable use of waterresources, agriculture, forestry, rangelandand other sub-sectors, and based onadoption of sound environmentalpractices.”
The findings of this research have majorramifications for agricultural policy andprogramming, as it demonstrates that theneeds of the rural poor are currently beingmissed by this focus on agriculture. Forexample, if a household has land throughwhich support could provide part of householdfood needs, then agricultural programmingmay play a large direct role. However, unlesshouseholds have sufficient land to be ableto sell or trade produce for expenditures,such as health and other expenses, it is likelythat they will still be involved in non-farmlabour, both to generate cash income as wellas to spread risk.
For those without sufficient land, or land atall, residing in areas where farm labouropportunities are lacking and/or poorly paid,alternative income sources will always needto be sought. This may be especially the casefor women, and widows in particular, because
as has been shown here, women have lessaccess to land than men and despite oftenbeing involved in agriculture are rarelyconsidered in agricultural programming.
There may be some benefits for poorerhouseholds from improved agriculturalproduction, such as greater labour demand,but these are assumptions that are largelyuntested. It is possible that agriculturalprogramming could have the opposite effect,with higher yields meaning lower food prices,resulting in lower wages for farm labourers.(This may be offset by a lack of farm labouravailable due to other opportunities, meaninglandlords have to pay higher wages.)
It is recognised that agricultural developmentmay lead to higher production and therebylower prices, enabling the poor greater accessto food; however, this will not necessarilyimprove people’s ability to access income topurchase food. This is not to say thatagricultural programming is of no importanceto the rural poor, but that the extent to whichit has a positive impact will depend fromhousehold to household on asset portfolios.
Recommendations
Policy makers and practitioners need torecognise the discrepancy between therealities of rural livelihoods and the policyand programme focus on agriculture and:
• Distinguish between the assetportfolios of different households andindividuals in order to understand whowill benefit from agriculture programmesand who will not. This will help policymakers and practitioners to better targetresources to those they seek to assist.
• Understand the different naturalresource base which households haveaccess to before designing agriculturalprogrammes. Land without water andlivestock without pasture does not makefor productive assets. While livestockmay be an option for women and menwithout land, who live in areas withsufficient common pasture land, it may
Afghanistan Research and Evaluation Unit (AREU)54
Synthesis Paper Series
not be for those who live in areas withinsufficient pasture land. Thusdifferentiated programming for differenthouseholds is required at the local level.
As well as these broad recommendations,there are other potential ways in whichagriculture can benefit poor households withlittle or no land, and who currently relylargely on non-farm labour. While many ofthe poor in this study were found to dependmostly on non-farm labour, agriculture alsoforms part of the livelihood strategies ofmany. It is crucial, therefore, that strategiesbe explored with a view to supportinghousehold livelihood diversification, ratherthan trying to move households to agricultureentirely. It is also worth mentioning that theexample of the differential effects of thewood collection ban in Laghman demonstratesthat there is a need to monitor who gainsand who benefits in conservation attempts.The following need to be explored (andmonitored to see who benefits):
• What skills and activities peoplealready have for whom agriculturerepresents part of their livelihoodstrategy, in order to support and developthem. For example, women havelivestock management skills yet fewprogrammes, other than animalhusbandry, assist women. Moreover,beyond chickens, women are rarelyassisted with livestock as incomegeneration. Women’s role in agriculturemust be recognised, supported andextended where desirable.
• Mobilising resources within a village,which can be mutually beneficial, suchas where one person looks after the cowof another and keeps the calf after birth.Similarly, the possibilities of negotiatingaccess to common land (where the landis not used as pasture) for landless menand women should be explored.
46 Christoplos, op cit.47 Ibid.
• Providing non-farm opportunities forlarge landowning families, which maythereby provide more opportunities forpoorer households to sharecrop-in land.46
• Harnessing employment opportunitiesfor the poor, which may arise fromincreases in the processing industry.47
• The recruitment of more femaleagricultural and veterinary extensionworkers to provide training to womeninvolved in agriculture. This will of coursenecessitate ensuring that these womenhave appropriate work conditionsincluding accommodation for women andtoilet facilities.
• Factors that currently constrain theinvolvement of the poor in agriculture.
5.3 Livelihoods monitoring
All of these findings demonstrate theimportance of monitoring livelihood trendsand who is benefiting and who is losing: Isthe importance of non-farm labour as acurrent phenomenon, because of the amountof reconstruction or is it a long-term trend?What effect will agricultural growth have onthe non-farm sector? The NRVA is one vehiclethrough which this monitoring could be done,but other more qualitative studies will needto be conducted to fill in gaps inunderstanding, while also providing a bettertemporal perspective of people’s livelihoods.
Given that many poor rural households appearto be reliant on the cash economy, themonitoring of changes in food price and labourwage rates is crucial. WFP and others arecurrently undertaking this monitoring, but itneeds to be ensured that this information isanalysed and shared and that strategies forusing the data are designed. Understandingmore about the factors that affect thelivelihood choices people make, such asmigrating for work, would help us understandthe effects that market price changes mayhave on livelihoods.
Afghanistan Research and Evaluation Unit (AREU) 55
Rethinking Rural Livelihoods in Afghanistan
NGOs working at the local level need to havethe capacity to use such data sets for theirlocal programming. However, NGOs shouldalso be involved in some livelihoods monitoringin their areas of work to ensure theirprogrammes are relevant to the realities ofthose they seek to aid. This does notnecessarily mean replicating what has beentried here, but simply trying to obtain abetter understanding of what different peoplein a given village are doing and why, and tolook at the constraints and opportunities theyhave and monitor how this changes over time.
The majority of the NGOs who participatedin this livelihoods monitoring research projectfound what they learned to be very valuablein assessing whether their programmes wereresponding to the realities of people’s lives,especially those of the poor. DACAAR, for
instance, found that their agriculturallyfocused programmes were missing their targetbeneficiary groups to some extent, since thepoorer groups were not dependent onagriculture and were largely landless. Thishas resulted in DACAAR looking at additionalways of reaching the poor.
NGOs, government and their donors also needto begin to look more at the outcomes(effects) of their projects, and where possiblethe impacts, rather than focusing largely onoutputs (deliverables). These actors also needto begin to look at and tackle the causes oflivelihood constraints and not only thesymptoms. For this to happen, however,more investment in learning and longer-termfunding than is currently available will beneeded.
Afghanistan Research and Evaluation Unit (AREU)56
Synthesis Paper Series
Appendix 1: Village descriptions
Jurm District, Badakhshan Province(Adapted from AKDN, 2004)
Village OneThis village is located in the centre of Yumgansub-district and is nestled in the main valleysurrounded by agricultural land, green andlush vegetation, with plenty of access towater (both drinking and irrigation). Villageone is the wealthiest of all three villagessurveyed and because of its historicalimportance it is quite a large and rich villagewith its own market, clinic, schools (boysand a girls school), electricity station, andan administrative centre that is about 10/15km away. Until the fall of the Taliban regimethe village was positioned along an importantaccess route with direct access to the norththat linked it to major markets in bothBaharak and Faizabad, and to the south thatlinked it to the Lapis Lazuli mines and thePanjsher Valley.
Historically village one has been a place ofgreat importance. It is where one of thegreatest Ismaili leaders, Naser Khesraw, isburied. Naser Khesraw came to the area fromMazar-e-Sharif in the year 455 (1076) seekingto move as far away as possible from thecentres of political power. Upon his arrivalto the area, the village was renamed andbecame an important intellectual centre fora number of years, as he was regarded as ahighly educated man and an importantintellectual thinker. Upon his death the villagelost its importance as an intellectual centre,however, it remained a strong agriculturalcentre and later a strategic village on anaccess route during the jihad for themujaheddin.
During the Russian invasion of Afghanistanthe people of village one suffered many
Appendices
casualties primarily because of the locationof the village on a primary access route,linking it to areas like the Panjsher in thesouth and further down to Kabul. In 1359(1980) the mujaheddin captured village one,where they were well received, and ultimatelythe village became strong supporters of themovement.
Village one is predominantly a Sunni village,with only 30 Ismaili families living in it despiteits historical background.
Village TwoVillage two lies in the middle sub-valleys inJurm District known as Furghominj Valleywith direct access to Baharak District in thesouth and the centre of Jurm in the north,which in turn provide it with direct links tomarkets, schools, health facilities and theadministrative centre. However, unlike villageone it has no high schools located in thevillage and students need to travel 15-16 kmto reach Baharak. Unlike the two othervillages it has better access to health facilitiesbecause it can reach the Baharak hospitalwithin three hours by foot. The main watersource of village two is a stream that peopleuse for both their irrigation and drinking.
Village two is considered to be middle ranking,not isolated like village three, but muchsmaller in size and less wealthy than villageone. Village two is said to have beenestablished many years ago and like many ofthe villages in the district it supported themujaheddin and was very much affected overits course of history by natural disasters suchas the drought. On two different occasionsin 1322 (1943) and 1349 (1970) the peopleof the village lost large numbers of livestockdue to Caw Ghumar,48 and 1349 (1970) againbecause of the drought.
48 A disease that kills cows.
Afghanistan Research and Evaluation Unit (AREU) 57
Rethinking Rural Livelihoods in Afghanistan
The basic economy for village two has beenagriculture and livestock, of which poppy hasbecome a major crop in all households. Inaddition to agriculture, village two is knownfor its women’s skills in gilim weaving andall activities related to the production ofgilims from spinning to weaving are a majorpart of the household activity shared by menand women.
Village ThreeVillage three is located in Khustak Manteqaof Jurm at a high altitude (one of the highervillages in the sub-manteqa at 2,330 m) andis inaccessible by vehicles. It is a one-hourwalk by foot from the nearest road. Villagethree suffers from the fact that it is veryisolated and the nearest bazaar, clinic, schooland administrative centre are about 40 kmaway, nearly nine hours by foot. The mainwater source for the village is a stream thatpeople use for both their irrigation anddrinking. In the months of October and Aprilvillagers are required to collect water fromvery far away as the stream dries up.
Village three is the poorest of the threevillages, located on the peripheral/marginalside of Jurm. This village is one of only threevillages in Jurm District with a religiousminority (Ismaili community) that havetraditionally been oppressed by the elitepower structures. Village three is said tohave been established about 550 years agoby people coming predominantly from Zeebokand Balkh District.
During the communist government ofAfghanistan era the people lost large amountsof pasture land to a commander of the areawho later gave the land to people from outsidethe village. In addition the village sufferedfrom heavy bombardment and attacks bydifferent mujaheddin groups.
The basic economy of village three has beenagriculture and livestock, but like many placesin Afghanistan, its residents own more rain-
49 A statement issued by the Agha Khan, Ismaili religious leader, as a rule for guidance.
fed land than irrigated land, which in turnhas led to a lot of loss and suffering fromsuch events as drought, floods, and Shah Darddisease (a disease that killed their livestock).Throughout its history, village three hassuffered more than one drought, which inturn has resulted in food deficiency, leadingto many of its residents leaving for otherareas in Badakhshan of which only some havereturned. However, for those residents thatdid stay or returned many have had to selltheir land, livestock and other assets to makeends met. The result today is that mostpeople have become sharecroppers, as theyhave had to sell or mortgage most of theirland.
Village three is different to the other threevillages in the fact that most of its residentsare Ismaili and will claim that they are notgrowing poppy because of a Farman49 thatcame out prohibiting Ismailis from growingor using poppy. Even though village threehas not traditionally been a poppy growingarea there is evidence that its residents beganto grow poppy in 2001 as a means to gainaccess to credit and regain lost assets.
Jaghatu District, Ghazni Province (Adaptedfrom CARE, 2004)
Village OneVillage one has a population of 130households, including 25 female-headedhouseholds, and the population is Hazara. Itis at the highest elevation of the three villagesand the furthest away from Ghazni City. Itis the closest to a water source and thus hasthe best access to irrigation and the highestrate of cultivation, although the village isprone to flooding. Village one is consideredto rank second in wealth of the three villages.
Village TwoVillage two is also entirely Hazara and contains100 households, including five female-headedhouseholds. Thirty of these households arecurrently living outside the village. It closer
Afghanistan Research and Evaluation Unit (AREU)58
Synthesis Paper Series
to water sources and has more land undercultivation than village three. Village two isconsidered the wealthiest of the three villagesas the head of the shura has been verysuccessful in attracting NGO support to thevillage and men in some of the householdsin WGI are employed by NGOs.
This village has some conflict with bothcommanders and kuchis and has severe levelsof joblessness, as do the other two villages.
Village ThreeVillage three is populated entirely by Turkmenand contains 115 households, 12 of which arefemale-headed. It is the closest to GhazniCity. Village three has the least access towater for irrigation and other purposes andhas very little land under cultivation. Thevillage is also prone to flooding. Because ofthis it is considered the poorest of the threevillages.
The economies of the three villages are quitesimilar. First, households in all wealth groupsin all villages use a mix of income generatingactivities to address their needs. Theseinclude agriculture, livestock and their ownlabour. From the data and discussions withstaff it emerged that non-farm labour isperhaps the most significant incomegeneration activity for households across allwealth groups in all three villages. Travel toGhazni City for casual labour is most common,followed by travel to Pakistan and Iran. Thosewho travel to the latter two places will gofor a season or up to several years. In eachof the villages, a number of the female-headed households have a male householdhead who has been overseas for many years.Men who travel to these faraway places willoften borrow money to tide their familiesover during their absence. On their return,they repay their debts and use other cash tomeet family needs.
Agriculture is apparently less important inthe economy of all of the villages, thoughthe level of engagement does vary. In villagethree, agriculture seems to be least important
as the village has the least access to water.Only five percent of the 2,000 jeribs ofirrigable land is under cultivation. In villagetwo, with a somewhat closer location towater sources, approximately 15 percent ofthe irrigable land is under cultivation. Invillage one, the village closest to the sourceof water, up to 30 percent of the land isunder cultivation. In all villages wheat is themain crop produced, followed by a smallamount of vegetables (potatoes, onions,alfalfa and others).
Livestock is an important part of the incomegeneration and consumption strategies forhouseholds across all villages. Wealthierhouseholds tend to own cattle and sheepwhile all households own at least a fewchickens. In the past, the villagers sold mostof their livestock for income but the droughthas badly affected their capacity to keeplarge numbers of animals (no food or grazingpasture, limited water). Currently mostfamilies have only a few livestock – the smallerruminants (chickens) are consumed while theless poor families sell the larger livestockcattle and sheep if they have any in the fallfor cash over winter. Women in all villagesare involved in income generating activitiesboth in and outside the home. These includecollecting firewood, wild plants and livestockmanagement. Many women also have skills(tailoring, sewing) that could bring the familyextra income.
Pashtun Zargun District, Herat Province(Adapted from Kerr-Wilson and Ghafori,DACAAR, 2004)
All three villages were badly affected byfighting between the communists and themujaheddin and also between separatemujaheddin factions such as that of JumaGul Palawan. Many of the mujaheddincommitted terrible atrocities in the villageand villagers were forced to provide foodand ammunition for both. The villages wereattacked by land and air and many fled, buthave since returned.
Afghanistan Research and Evaluation Unit (AREU) 59
Rethinking Rural Livelihoods in Afghanistan
Village OneVillage one is the furthest away from theroad of the three villages. Most villagers areinvolved in agricultural activities and themain crops grown are wheat, vetch, cottonand millet for pigeons. Villagers have beenunable to grow rice for four years due to alack of water. As the village is surroundedby agricultural land and they do not have anyopen pasture to graze their animals in, theyhave little livestock. A high school has recentlybeen constructed near the village.
Village TwoVillage two is the richest village of the threeand is the nearest to the road, with thelargest population. Around one-third of thevillagers own orchards, the produce of whichthey sell in Herat. There is a school insidethe village as well as shops. Households inthis village are food self-sufficient for agreater part of the year compared to theother two villages, with the main crops beingcotton, wheat, vetch, a little rice andsunflowers.
Village ThreeThis is considered the poorest of the threevillages and is drier than the others. Whilethis village has more land than the other twovillages, there is not enough water to irrigateit. Plots of land are therefore divided intotwo halves with one half being cultivatedone year and the other half the next year.The main crops grown are wheat and barley.
There are fewer landowners here than in theother villages and therefore more landlesshouseholds, largely because one man owns300 jeribs, two-fifths of the total land in thevillage, and lives in Herat.
The villagers reported problems with overpopulation and conflicts with kuchis.
Alingar District, Laghman Province (Adaptedfrom Kerr-Wilson and Ghafori, DACAAR, 2004)
Many of the men from all three villages foughtwith the mujaheddin against the communistsand all of the villages suffered in terms of
loss of human life, destruction of homes, thekilling of livestock and the plundering ofvaluables. In 1979, the communists bombedvillages one and two, destroying houses andkilling a number of villagers. Two years later,the communists renewed their offensive,bombing village three by air and moving tanksinto villages one and two. In village two, toavoid fighting, many villagers escaped to themountains and hid in underground caves,while others fled on foot to Pakistan. Refugeesbegan returning to the villages around 1993.
Village OneVillage one is situated close to the river onthe valley floor and only about 1,000 m abovesea level. It is the wealthiest of the threeAlingar villages. At the entrance to the villagethere is a small shop owned by one of themore wealthy villagers, while wheat, riceand maize can be seen growing. In additionto privately owned land, there is about 200jeribs of commonly owned pasture land. Theland around this village is irrigated with waterfrom the Alingar River and a tributary streamcalled Nurullam.
Villagers live in compounds, where householdsfrom the same family live in separate roomswithin the compound. In some compounds,income and expenditure are shared betweenall members, while in others it is only sharedwithin households. Unlike village three, thewomen of village one belong primarily to theprivate world of compounds and areresponsible for housework and childcare. Themen, on the other hand, belong to the publicworld and are involved in agriculturalactivities, fishing, running shops and collectingwood. Some men from this village also migrateto Pakistan for casual labour. It is apredominantly Pashtun village, although thereare a few Pashaie households.
Village TwoVillage two is on the same side of the riveras village one, but thirty minutes away inthe direction of Mehterlam. The village sitson a mountain slope in a side valley calledSangar. The people in the village seem more
Afghanistan Research and Evaluation Unit (AREU)60
Synthesis Paper Series
desperate and unhappy than in the other twovillages, as the village has been seriouslyaffected by drought. Land in the village isirrigated by spring water and in normalconditions rice, mulberries and apples aregrown. However, because of the drought theorchards are bare and there is not enoughwater to grow much rice. According to thevillagers, the lack of water has meant thatthey have had to grow alternative crops,including cotton and poppy.
Like the other two villages, some men spendlong arduous hours going to far awaymountains to collect wood, while due to alack of available work in the village otherstravel to Pakistan or Iran for casual labour.As a result, the Pakistani rupee supplementsthe Afghani as the currency for manytransactions. Women in this village do notcollect wood, but do take part in agriculturalactivities alongside their male relatives.Some women also accompany their malerelatives to Pakistan and work as agriculturallabourers or do piecework, such as puttingtogether factory toy cars, at home.
Village ThreeVillage three is a 20-minute walk up a narrowpath between terraced fields; it is a beautifulplace, about 1,450 m above sea level, wherehouses jostle against each other on narrowmountain shelves.
Village three is the poorest of the threeLaghman villages with most households owningless than a jerib of land, although manyhouseholds, even landless ones, have walnuttrees whose nuts and wood they trade. Wheatis the main crop grown in the village, whilea little maize is grown when there is enoughwater in the tributary river.
This is a Pashaie village, where young menloll around on the sides of pathways, theireyes rimmed with kohl, hair dyed brightorange with henna. Kalashnikovs decoratedwith flowers can be seen in the village andhighlight the presence of local commanders.
Women with handmade beaded necklacesand brightly coloured, tatty dresses, are seenoutside working in the fields and carryingheavy baskets of wood down from mountainforests to the wood bazaar. Gender relationsin this village and in other Pashaie villagesare different from many places elsewhere inrural Afghanistan. Women can move freelywithin the village from house to house,although they do need the permission of malerelatives to travel outside the village.
Daulatabad District, Faryab Province(Adapted from EO/CA and CHA, 2004)
Daulatabad District is located 70kms, sometwo and a half hours drive, north of Maimana,the provincial capital of Faryab, on the mainroad to Andkhoi. The distinguishing geographicfeatures of the district are a wide plain areain the centre with surrounding low-lying clayhills, which constitutes a substantial area ofrain-fed cultivation.
Village OneVillage one is believed to have beenestablished in the 1860s and is entirelypopulated by Pashtuns with residents originallycoming from Qalat, Zabul Province. Settlerswere livestock owners who migratedseasonally to graze their livestock. After thedrought of 1971 when 80 percent of theirlivestock was lost they started cultivation ofland on a larger scale. The village populationwas estimated by the village shura to be2,050 families (10,000 individuals) in 2003.
Village one is ranked the poorest of the threevillages. Although crop production is commonin the village and crops grown are wheat,sesame, melon and watermelon, village onehas an identity of traditional livestock owners.
Village one was attacked and plundered during1989 by a militia commander supporting thecommunist regime and 6,700 sheep and goatswere taken away. During that period villagerswere displaced to Badghis Province and TurGhundy in Herat Province until 1998, whenthe Taliban took control of the area.
Afghanistan Research and Evaluation Unit (AREU) 61
Rethinking Rural Livelihoods in Afghanistan
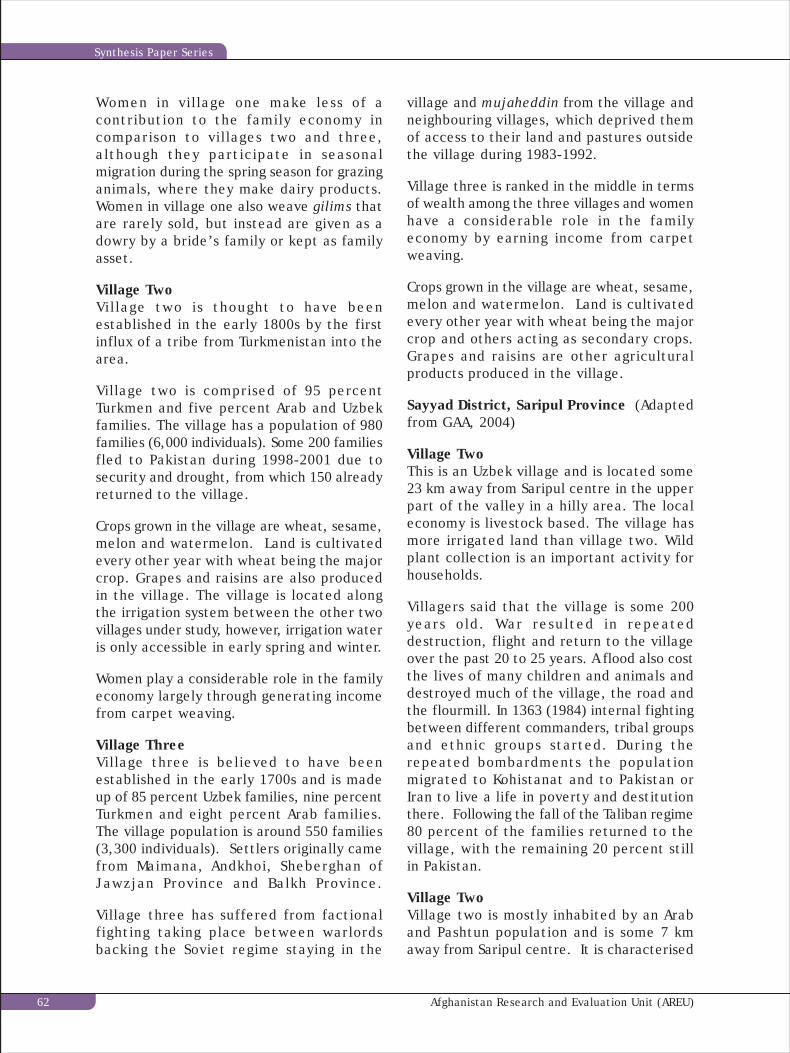
Women in village one make less of acontribution to the family economy incomparison to villages two and three,although they participate in seasonalmigration during the spring season for grazinganimals, where they make dairy products.Women in village one also weave gilims thatare rarely sold, but instead are given as adowry by a bride’s family or kept as familyasset.
Village TwoVillage two is thought to have beenestablished in the early 1800s by the firstinflux of a tribe from Turkmenistan into thearea.
Village two is comprised of 95 percentTurkmen and five percent Arab and Uzbekfamilies. The village has a population of 980families (6,000 individuals). Some 200 familiesfled to Pakistan during 1998-2001 due tosecurity and drought, from which 150 alreadyreturned to the village.
Crops grown in the village are wheat, sesame,melon and watermelon. Land is cultivatedevery other year with wheat being the majorcrop. Grapes and raisins are also producedin the village. The village is located alongthe irrigation system between the other twovillages under study, however, irrigation wateris only accessible in early spring and winter.
Women play a considerable role in the familyeconomy largely through generating incomefrom carpet weaving.
Village ThreeVillage three is believed to have beenestablished in the early 1700s and is madeup of 85 percent Uzbek families, nine percentTurkmen and eight percent Arab families.The village population is around 550 families(3,300 individuals). Settlers originally camefrom Maimana, Andkhoi, Sheberghan ofJawzjan Province and Balkh Province.
Village three has suffered from factionalfighting taking place between warlordsbacking the Soviet regime staying in the
village and mujaheddin from the village andneighbouring villages, which deprived themof access to their land and pastures outsidethe village during 1983-1992.
Village three is ranked in the middle in termsof wealth among the three villages and womenhave a considerable role in the familyeconomy by earning income from carpetweaving.
Crops grown in the village are wheat, sesame,melon and watermelon. Land is cultivatedevery other year with wheat being the majorcrop and others acting as secondary crops.Grapes and raisins are other agriculturalproducts produced in the village.
Sayyad District, Saripul Province (Adaptedfrom GAA, 2004)
Village TwoThis is an Uzbek village and is located some23 km away from Saripul centre in the upperpart of the valley in a hilly area. The localeconomy is livestock based. The village hasmore irrigated land than village two. Wildplant collection is an important activity forhouseholds.
Villagers said that the village is some 200years old. War resulted in repeateddestruction, flight and return to the villageover the past 20 to 25 years. A flood also costthe lives of many children and animals anddestroyed much of the village, the road andthe flourmill. In 1363 (1984) internal fightingbetween different commanders, tribal groupsand ethnic groups started. During therepeated bombardments the populationmigrated to Kohistanat and to Pakistan orIran to live a life in poverty and destitutionthere. Following the fall of the Taliban regime80 percent of the families returned to thevillage, with the remaining 20 percent stillin Pakistan.
Village TwoVillage two is mostly inhabited by an Araband Pashtun population and is some 7 kmaway from Saripul centre. It is characterised
Afghanistan Research and Evaluation Unit (AREU)62
Synthesis Paper Series

by rain-fed agriculture and livestock. Ascompared to village three, this village hasless land and many people do supplementtheir income by labour migration.
Village ThreeSince the market in Saripul is near, there isno market in village three. However, thereare shops offering goods for basic householdneeds, a pharmacy is available, and someshops selling agricultural inputs are available.Agriculture is characterised by rain-fed andirrigated cultivation (wheat, barley, melons,sesame, flax, vegetables, maize). Somegardens have poplar trees that are used forbuilding purposes, but are also sold at times.The area is also known for gilim weaving andhat production. The village is some 200 yearsold.
Villagers recall bombardments during theRussian occupation (1361/1982) andmentioned that all houses were destroyed inthe events and people lost animals. Manymigrated to the Kohistanat area and wereforced to earn their livelihoods through dailylabour, since the only assets that wereremaining were animals for transportinggoods.
After a short period of control by themujaheddin between 1362 (1983) and 1365(1985), some of the migrants returned andtried to rebuild their houses and livelihoodsbut the village was again taken over bygovernment forces in alliance with Russians.Villagers again lost orchards, livestock andhouses, and migrated again to Kohistanat andto Pakistan only to return some six yearslater. When the Taliban took over the villagein 1377 (1998) three-quarters of thepopulation migrated to Pakistan and againsold their assets for livelihood. After the fallof the Taliban regime in 1381 (2001) 85percent of the population returned. Theinfrastructure of the village was destroyedand the villagers faced difficulties in accessingsafe drinking water, shelter and restockingtheir livestock herds.
Kandahar District, Kandahar Province(Adapted from MC village descriptions)
Village OneVillage one is entirely populated by Pashtunsfrom five different tribes and has a populationof 100 families (several households withinone compound).
The village was heavily hit by the Russianbombardment in 1982 and again in 1984during which time most of the villagersmigrated, some to Pakistan and some to othervillages in the south. In 1992 many peoplereturned to the village but faced manydifficulties as the village was heavily minedand 12 people were killed by landmines. De-miners worked in the village for 2 years.During that time there were no workopportunities within the village.
The village is traditionally known for goodproduction of crops such as wheat. However,during the drought many of the villagers lostlivestock and people’s orchards dried up.Those who previously worked as farmers andfarm labour could not continue such workdue to a lack of water and many are nowinvolved in daily labour.
Village TwoSix Pashtun tribes as well as a small numberof Tajik families populate village two. Thevillage has a population of 260 families.
The village had a similar history of events asvillage one with heavy destruction andcasualties from the Russian bombardments.In 1980, 120 villagers were taken prisoner bythe Terakai regime and 60 were killed, leavingmany women widowed. Many of the villagersfled the area and 60 families are still inPakistan and Iran.
This village has fertile land but now producesvery little due to a lack of water. Fiftyfamilies used to be involved in sharecroppingbefore the drought but are now unable todue to this lack of water. The landless arenow involved in daily labour.
Afghanistan Research and Evaluation Unit (AREU) 63
Rethinking Rural Livelihoods in Afghanistan
Village ThreeVillage three is populated by seven Pashtuntribes and is made up 170 families. Villagethree also has a similar history to villagesone and two and also suffered huge damagesand casualt ies f rom the Russ ianbombardments that left 35 people in thevillage disabled and unable to work. Most ofthe villagers fled during the fighting as well
as during the drought and 100 of the 170families have still not returned.
As with village one this village was famousfor its good agricultural production, but sincethe drought little cultivation has taken placeand many people who had once worked inagriculture now work as daily labourers, oftenin Kandahar City, where they can go andreturn the same day.
Afghanistan Research and Evaluation Unit (AREU)64
Synthesis Paper Series
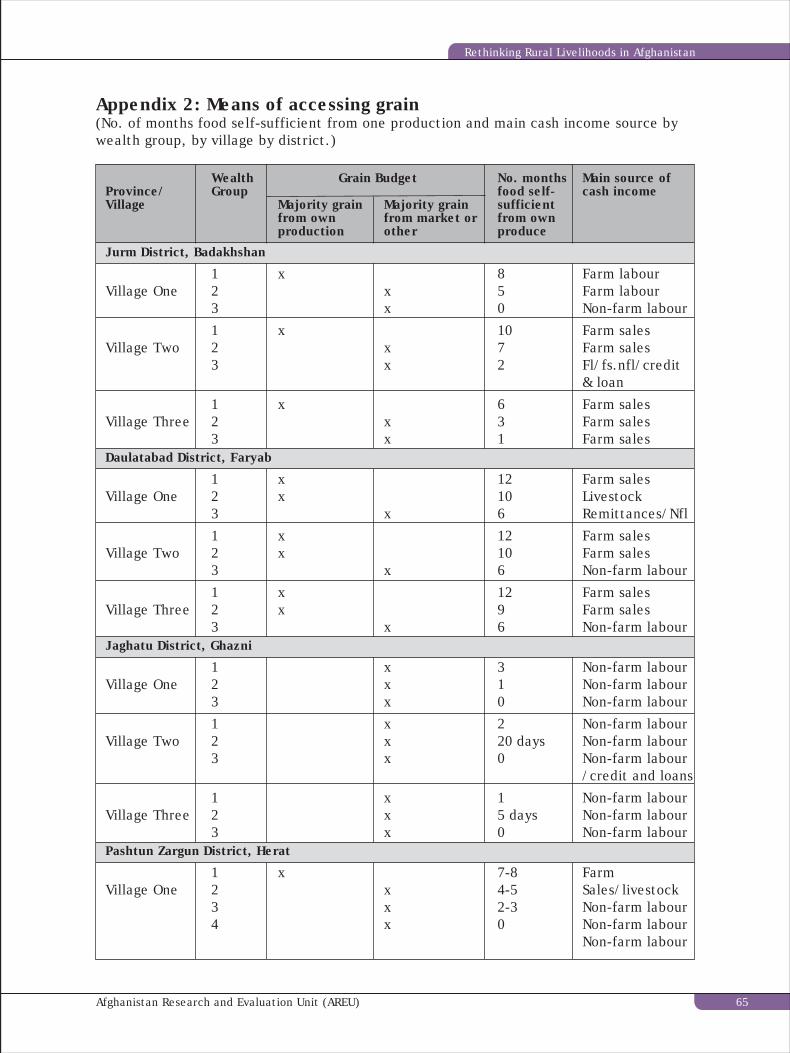
Appendix 2: Means of accessing grain(No. of months food self-sufficient from one production and main cash income source bywealth group, by village by district.)
Wealth Grain Budget No. months Main source ofProvince/ Group food self- cash incomeVillage Majority grain Majority grain sufficient
from own from market or from ownproduction other produce
Jurm District, Badakhshan
1 x 8 Farm labourVillage One 2 x 5 Farm labour
3 x 0 Non-farm labour
1 x 10 Farm salesVillage Two 2 x 7 Farm sales
3 x 2 Fl/fs.nfl/credit& loan
1 x 6 Farm salesVillage Three 2 x 3 Farm sales
3 x 1 Farm salesDaulatabad District, Faryab
1 x 12 Farm salesVillage One 2 x 10 Livestock
3 x 6 Remittances/Nfl
1 x 12 Farm salesVillage Two 2 x 10 Farm sales
3 x 6 Non-farm labour
1 x 12 Farm salesVillage Three 2 x 9 Farm sales
3 x 6 Non-farm labourJaghatu District, Ghazni
1 x 3 Non-farm labourVillage One 2 x 1 Non-farm labour
3 x 0 Non-farm labour
1 x 2 Non-farm labourVillage Two 2 x 20 days Non-farm labour
3 x 0 Non-farm labour/credit and loans
1 x 1 Non-farm labourVillage Three 2 x 5 days Non-farm labour
3 x 0 Non-farm labourPashtun Zargun District, Herat
1 x 7-8 FarmVillage One 2 x 4-5 Sales/livestock
3 x 2-3 Non-farm labour4 x 0 Non-farm labour
Non-farm labour
Afghanistan Research and Evaluation Unit (AREU) 65
Rethinking Rural Livelihoods in Afghanistan
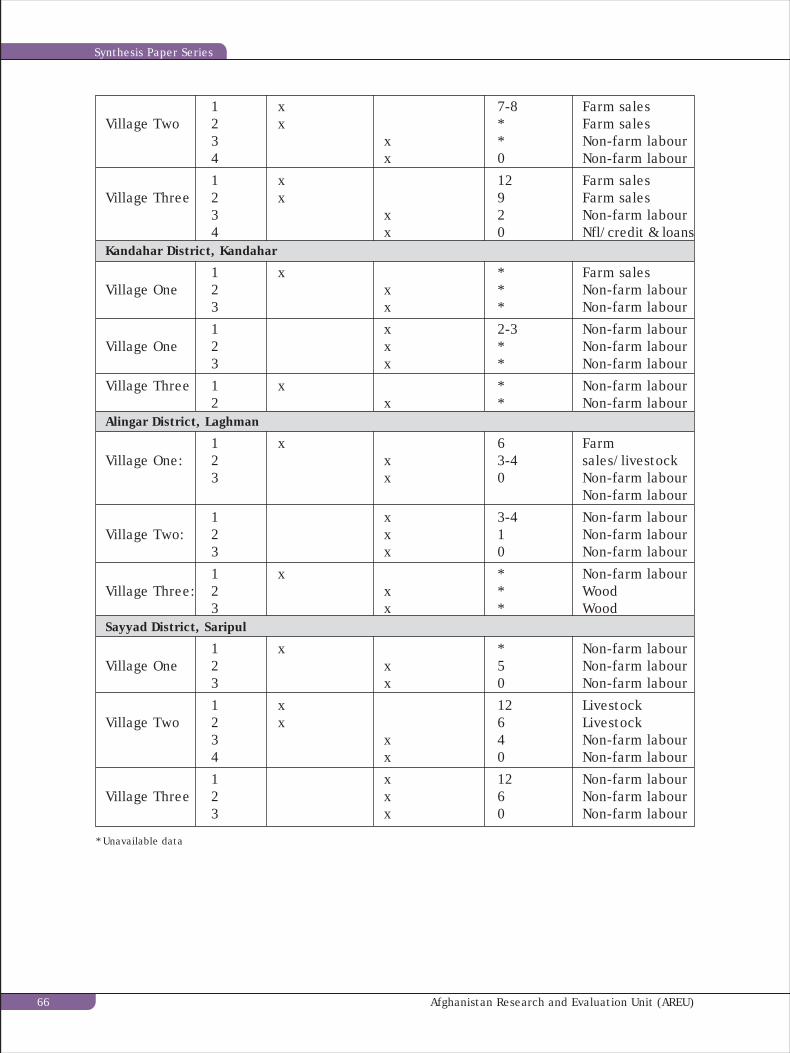
1 x 7-8 Farm salesVillage Two 2 x * Farm sales
3 x * Non-farm labour4 x 0 Non-farm labour
1 x 12 Farm salesVillage Three 2 x 9 Farm sales
3 x 2 Non-farm labour4 x 0 Nfl/credit & loans
Kandahar District, Kandahar
1 x * Farm salesVillage One 2 x * Non-farm labour
3 x * Non-farm labour
1 x 2-3 Non-farm labourVillage One 2 x * Non-farm labour
3 x * Non-farm labour
Village Three 1 x * Non-farm labour2 x * Non-farm labour
Alingar District, Laghman
1 x 6 FarmVillage One: 2 x 3-4 sales/livestock
3 x 0 Non-farm labourNon-farm labour
1 x 3-4 Non-farm labourVillage Two: 2 x 1 Non-farm labour
3 x 0 Non-farm labour
1 x * Non-farm labourVillage Three: 2 x * Wood
3 x * WoodSayyad District, Saripul
1 x * Non-farm labourVillage One 2 x 5 Non-farm labour
3 x 0 Non-farm labour
1 x 12 LivestockVillage Two 2 x 6 Livestock
3 x 4 Non-farm labour4 x 0 Non-farm labour
1 x 12 Non-farm labourVillage Three 2 x 6 Non-farm labour
3 x 0 Non-farm labour
* Unavailable data
Afghanistan Research and Evaluation Unit (AREU)66
Synthesis Paper Series
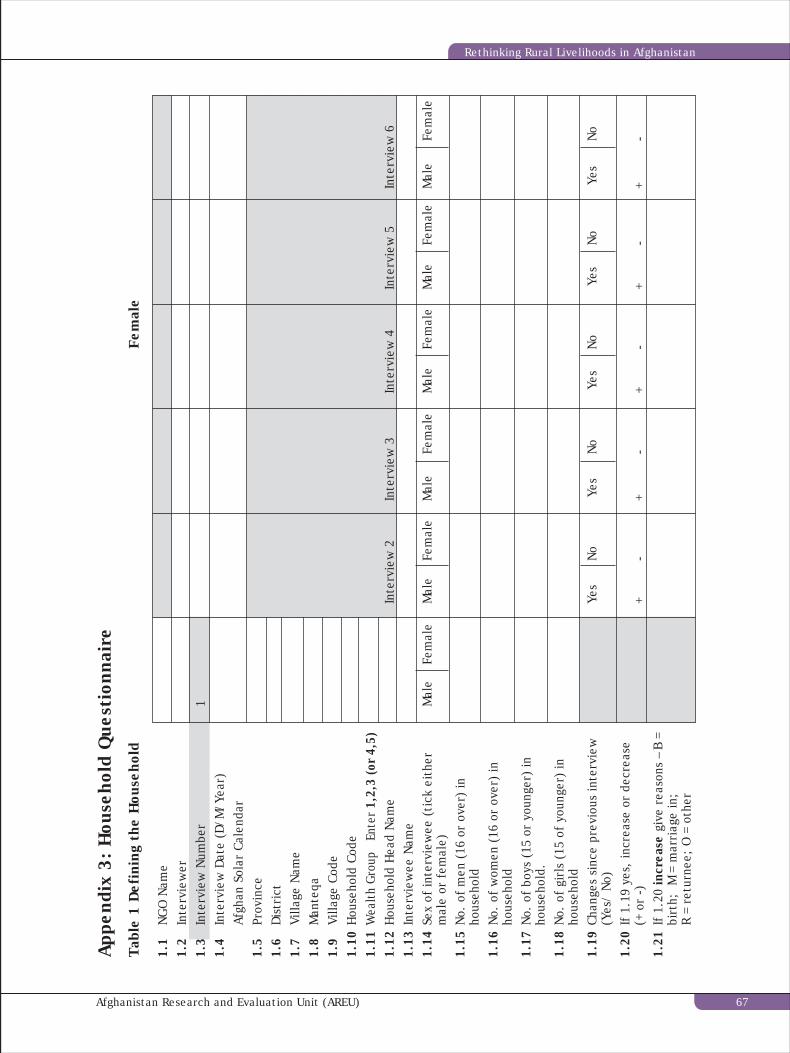
App
endi
x 3:
Hou
seho
ld Q
uest
ionn
aire
Tabl
e 1
Def
inin
g th
e H
ouse
hold
Fem
ale
1.1
NG
O N
ame
1.2
Inte
rvie
wer
1.3
Inte
rvie
w N
umbe
r1
1.4
Inte
rvie
w D
ate
(D/M
/Yea
r)Af
ghan
Sol
ar C
alen
dar
1.5
Prov
ince
1.6
Dist
rict
1.7
Villa
ge N
ame
1.8
Man
teqa
1.9
Villa
ge C
ode
1.10
Hou
seho
ld C
ode
1.11
Wea
lth
Gro
up
Ente
r 1,
2,3
(or
4,5)
1.12
Hou
seho
ld H
ead
Nam
eIn
terv
iew
2In
terv
iew
3In
terv
iew
4In
terv
iew
5In
terv
iew
61.
13In
terv
iew
ee N
ame
1.14
Sex
of in
terv
iew
ee (
tick
eit
her
Mal
eFe
mal
eM
ale
Fem
ale
Mal
eFe
mal
eM
ale
Fem
ale
Mal
eFe
mal
eM
ale
Fem
ale
mal
e or
fem
ale)
1.15
No.
of
men
(16
or
over
) in
hous
ehol
d1.
16N
o. o
f w
omen
(16
or
over
) in
hous
ehol
d1.
17N
o. o
f bo
ys (
15 o
r yo
unge
r) in
hous
ehol
d.1.
18N
o. o
f gi
rls
(15
of y
oung
er)
inho
useh
old
1.19
Chan
ges
sinc
e pr
evio
us in
terv
iew
Yes
No
Yes
No
Yes
No
Yes
No
Yes
No
(Yes
/ N
o)1.
20If
1.1
9 ye
s, in
crea
se o
r de
crea
se(+
or
-)+
-+
-+
-+
-+
-1.
21If
1.2
0 in
crea
se g
ive
reas
ons
– B
=bi
rth;
M =
mar
riag
e in
;R
= re
turn
ee;
O =
oth
er
Afghanistan Research and Evaluation Unit (AREU) 67
Rethinking Rural Livelihoods in Afghanistan
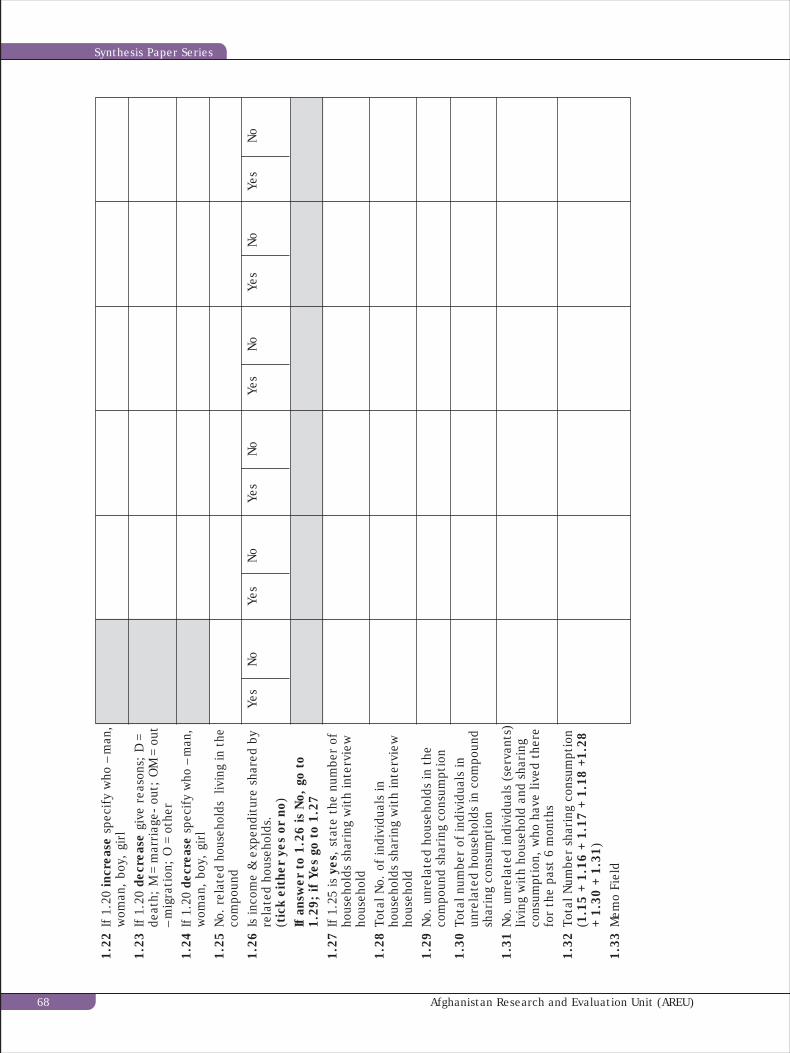
1.22
If 1
.20
incr
ease
spe
cify
who
– m
an,
wom
an,
boy,
gir
l1.
23If
1.2
0 de
crea
se g
ive
reas
ons;
D =
deat
h; M
= m
arri
age-
out
; O
M =
out
– m
igra
tion
; O
= o
ther
1.24
If 1.
20 d
ecre
ase
spec
ify
who
– m
an,
wom
an,
boy,
gir
l1.
25No
. re
late
d ho
useh
olds
liv
ing
in t
heco
mpo
und
1.26
Is in
com
e &
exp
endi
ture
sha
red
byYe
sN
oYe
sN
oYe
sN
oYe
sN
oYe
sN
oYe
sN
ore
late
d ho
useh
olds
.(t
ick
eith
er y
es o
r no
)If
answ
er t
o 1.
26 is
No,
go
to1.
29;
if Y
es g
o to
1.2
71.
27If
1.2
5 is
yes
, st
ate
the
num
ber
ofho
useh
olds
sha
ring
wit
h in
terv
iew
hous
ehol
d1.
28To
tal N
o. o
f in
divi
dual
s in
hous
ehol
ds s
hari
ng w
ith
inte
rvie
who
useh
old
1.29
No.
unr
elat
ed h
ouse
hold
s in
the
com
poun
d sh
arin
g co
nsum
ptio
n1.
30To
tal n
umbe
r of
indi
vidu
als
inun
rela
ted
hous
ehol
ds in
com
poun
dsh
arin
g co
nsum
ptio
n1.
31N
o. u
nrel
ated
indi
vidu
als
(ser
vant
s)liv
ing
wit
h ho
useh
old
and
shar
ing
cons
umpt
ion,
who
hav
e liv
ed t
here
for
the
past
6 m
onth
s1.
32To
tal N
umbe
r sh
arin
g co
nsum
ptio
n(1
.15
+ 1.
16 +
1.1
7 +
1.18
+1.
28+
1.30
+ 1
.31)
1.33
Mem
o Fi
eld
Afghanistan Research and Evaluation Unit (AREU)68
Synthesis Paper Series

Tabl
e 2
Hou
seho
ld M
embe
r Id
enti
tyFe
mal
e
2.1
Inte
rvie
w N
o2.
2H
ouse
hold
Cod
e2.
3H
Hld
Mem
ber
Code
2.4
Nam
e of
indi
vidu
al2.
5Se
x (M
ale/
Fem
ale)
2.6
Rela
tion
to
HH
ld h
ead
(tic
k)H
usba
ndW
ife
Child
Gra
nd-
Brot
her
/Si
ster
/pa
rent
Brot
her
in
Sist
er in
O
ther
law
law
2.7
Skill
s (e
ven
if n
ot p
ract
isin
g)
Gili
mCa
rpet
Se
win
gTa
ilori
ngCa
rpen
try
Mas
onM
echa
nica
lti
ck;
Spec
ify
for
othe
rW
eavi
ngW
eavi
ngO
ther
1O
ther
2O
ther
3O
ther
4O
ther
5O
ther
6O
ther
7
2.8
Hig
hest
Edu
cati
on L
evel
(ti
ck)
Cann
ot r
ead
Can
read
N
ot a
t M
adra
ssa
Scho
ol C
lass
U
nive
rsit
yO
ther
or w
rite
or w
rite
scho
ol(S
peci
fy)
Inte
rvie
w 1
Inte
rvie
w 2
Inte
rvie
w 3
Inte
rvie
w 4
Inte
rvie
w 5
Inte
rvie
w 6
2.9
Age
2.10
Mem
o fi
eld
Afghanistan Research and Evaluation Unit (AREU) 69
Rethinking Rural Livelihoods in Afghanistan
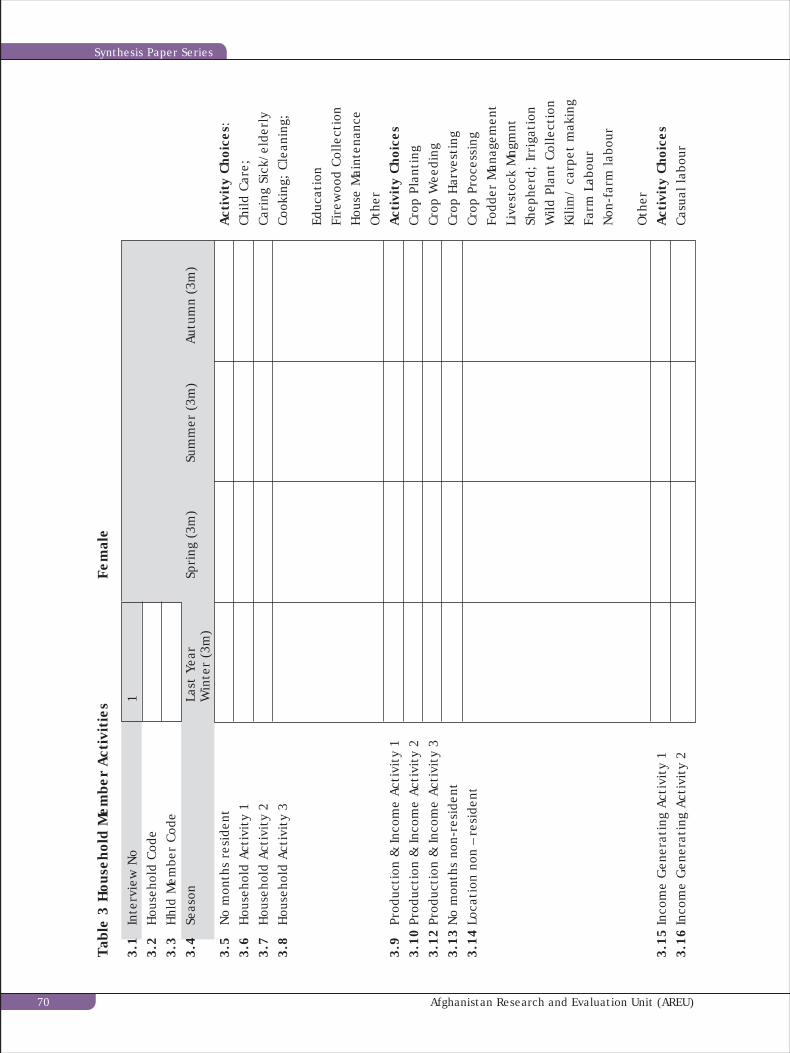
Tabl
e 3
Hou
seho
ld M
embe
r A
ctiv
itie
sFe
mal
e
3.1
Inte
rvie
w N
o1
3.2
Hou
seho
ld C
ode
3.3
Hhl
d M
embe
r Co
de3.
4Se
ason
Last
Yea
rSp
ring
(3m
)Su
mm
er (
3m)
Autu
mn
(3m
)W
inte
r (3
m)
3.5
No
mon
ths
resi
dent
A
ctiv
ity
Choi
ces:
3.6
Hou
seho
ld A
ctiv
ity
1Ch
ild C
are;
3.7
Hou
seho
ld A
ctiv
ity
2Ca
ring
Sic
k/el
derl
y3.
8H
ouse
hold
Act
ivit
y 3
Cook
ing;
Cle
anin
g;
Educ
atio
nFi
rew
ood
Colle
ctio
nH
ouse
Mai
nten
ance
Oth
er3.
9Pr
oduc
tion
& In
com
e Ac
tivi
ty 1
Act
ivit
y Ch
oice
s3.
10Pr
oduc
tion
& In
com
e Ac
tivi
ty 2
Crop
Pla
ntin
g3.
12Pr
oduc
tion
& In
com
e Ac
tivi
ty 3
Crop
Wee
ding
3.13
No
mon
ths
non-
resi
dent
Crop
Har
vest
ing
3.14
Loca
tion
non
– r
esid
ent
Crop
Pro
cess
ing
Fodd
er M
anag
emen
tLi
vest
ock
Mng
mnt
Shep
herd
; Ir
riga
tion
Wild
Pla
nt C
olle
ctio
nKi
lim/
carp
et m
akin
gFa
rm L
abou
rN
on-f
arm
labo
ur
Oth
er3.
15In
com
e G
ener
atin
g Ac
tivi
ty 1
Act
ivit
y Ch
oice
s3.
16In
com
e G
ener
atin
g Ac
tivi
ty 2
Casu
al la
bour
Afghanistan Research and Evaluation Unit (AREU)70
Synthesis Paper Series
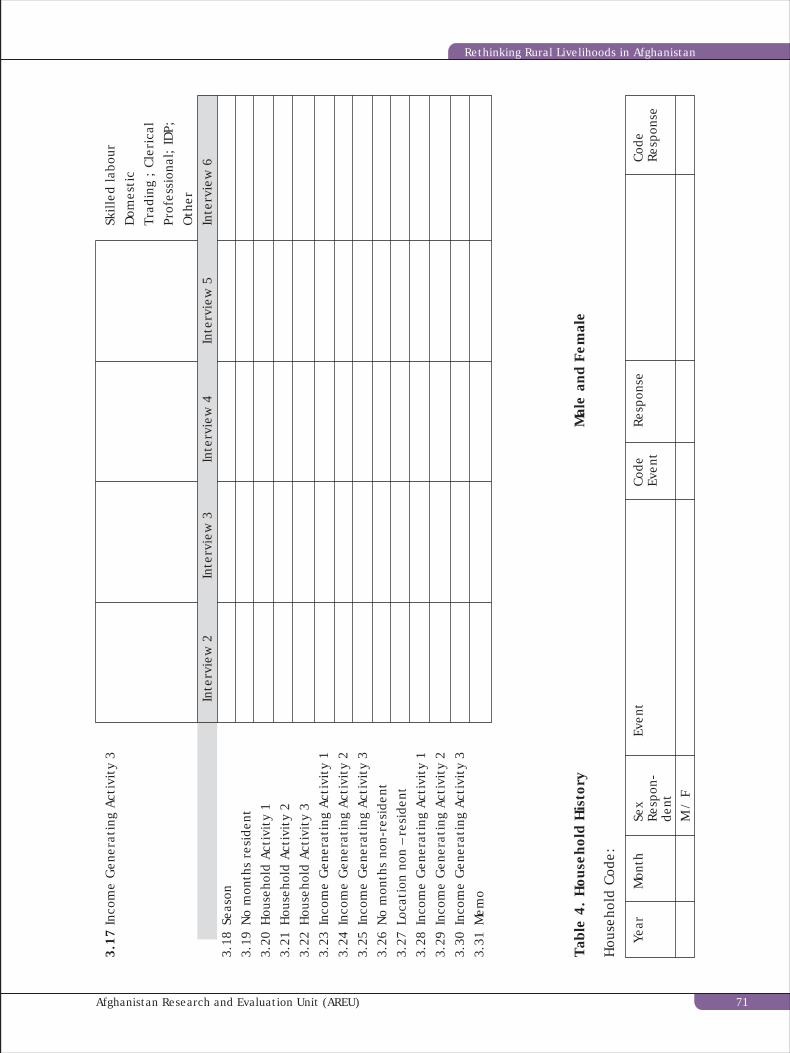
3.17
Inco
me
Gen
erat
ing
Acti
vity
3Sk
illed
labo
urD
omes
tic
Trad
ing
; Cl
eric
alPr
ofes
sion
al;
IDP;
Oth
erIn
terv
iew
2In
terv
iew
3In
terv
iew
4In
terv
iew
5In
terv
iew
63.
18Se
ason
3.19
No
mon
ths
resi
dent
3.20
Hou
seho
ld A
ctiv
ity
13.
21H
ouse
hold
Act
ivit
y 2
3.22
Hou
seho
ld A
ctiv
ity
33.
23In
com
e G
ener
atin
g Ac
tivi
ty 1
3.24
Inco
me
Gen
erat
ing
Acti
vity
23.
25In
com
e G
ener
atin
g Ac
tivi
ty 3
3.26
No
mon
ths
non-
resi
dent
3.27
Loca
tion
non
– r
esid
ent
3.28
Inco
me
Gen
erat
ing
Acti
vity
13.
29In
com
e G
ener
atin
g Ac
tivi
ty 2
3.30
Inco
me
Gen
erat
ing
Acti
vity
33.
31M
emo
Tabl
e 4.
Hou
seho
ld H
isto
ryM
ale
and
Fem
ale
Hou
seho
ld C
ode:
Year
Mon
thSe
xEv
ent
Code
Resp
onse
Code
Resp
on-
Even
tRe
spon
sede
ntM
/ F
Afghanistan Research and Evaluation Unit (AREU) 71
Rethinking Rural Livelihoods in Afghanistan
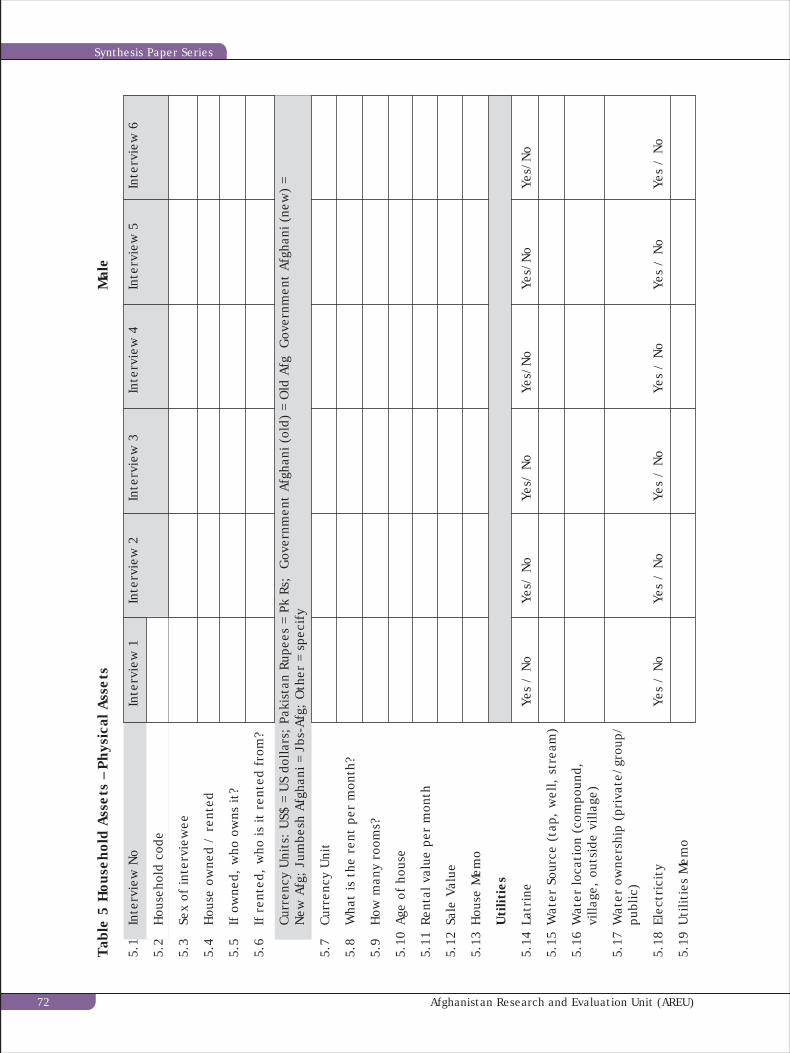
Afghanistan Research and Evaluation Unit (AREU)72
Synthesis Paper Series
Tabl
e 5
Hou
seho
ld A
sset
s –
Phys
ical
Ass
ets
Mal
e
5.1
Inte
rvie
w N
oIn
terv
iew
1In
terv
iew
2In
terv
iew
3In
terv
iew
4In
terv
iew
5In
terv
iew
6
5.2
Hou
seho
ld c
ode
5.3
Sex
of in
terv
iew
ee
5.4
Hou
se o
wne
d /
rent
ed
5.5
If o
wne
d, w
ho o
wns
it?
5.6
If r
ente
d, w
ho is
it r
ente
d fr
om?
Curr
ency
Uni
ts:
US$
= U
S do
llars
; Pa
kist
an R
upee
s =
Pk R
s; G
over
nmen
t Af
ghan
i (ol
d) =
Old
Afg
G
over
nmen
t Af
ghan
i (ne
w)
=N
ew A
fg;
Jum
besh
Afg
hani
= J
bs-A
fg;
Oth
er =
spe
cify
5.7
Curr
ency
Uni
t
5.8
Wha
t is
the
ren
t pe
r m
onth
?
5.9
How
man
y ro
oms?
5.10
Age
of h
ouse
5.11
Rent
al v
alue
per
mon
th
5.12
Sale
Val
ue
5.13
Hou
se M
emo
Uti
litie
s
5.14
Latr
ine
Yes
/ N
oYe
s/ N
oYe
s/ N
oYe
s/N
oYe
s/N
oYe
s/N
o
5.15
Wat
er S
ourc
e (t
ap,
wel
l, s
trea
m)
5.16
Wat
er lo
cati
on (
com
poun
d,vi
llage
, ou
tsid
e vi
llage
)
5.17
Wat
er o
wne
rshi
p (p
riva
te/g
roup
/pu
blic
)
5.18
Elec
tric
ity
Yes
/ N
oYe
s /
No
Yes
/ N
oYe
s /
No
Yes
/ N
oYe
s /
No
5.19
Uti
litie
s M
emo

Tabl
e 6
Hou
seho
ld A
sset
s –
Land
Ass
ets
[Not
e: It
is p
ossi
ble
that
a h
ouse
hold
mig
ht o
wn
or u
se la
nd in
mor
e th
an o
ne v
illag
e or
eve
n pr
ovin
ce;
if t
his
is t
he c
ase
then
a s
econ
d ta
ble
6 sh
ould
be
com
plet
ed f
or la
nds
owne
d or
use
d in
a s
econ
d (o
r th
ird)
pla
ce
Mal
e
6.1
Inte
rvie
w N
oD
oes
the
hous
ehol
d ow
n/ u
seYe
s /
No
If y
es e
nter
bel
ow w
here
thi
s la
nd is
&la
nd o
utsi
de t
his
villa
ge?
com
plet
e a
seco
nd T
able
6
6.2
Hou
seho
ld c
ode
Oth
er L
and
Prov
ince
Dis
tric
t
6.3
Land
ow
ned
& c
ulti
vate
d C
rop
Seed
am
ount
Pr
oduc
tion
No.
of
Tota
l Ow
ned
Area
How
man
y(l
ast
crop
)(s
eers
or
kg)
Parc
els
(jer
ibs
or h
a)ow
ners
?&
are
a /
no.t
rees
Al
l M
W
cult
ivat
ed
6.4
Irri
gate
d gr
ain
Area
:Se
ers
Seer
sJe
ribs
(no
land
/ w
heat
/ba
rley
KgKg
Ha.
/ pa
ddy
/ ot
her)
6.5
Irri
gate
d pa
stur
eAr
ea:
Seer
sSe
ers
Jeri
bs(
no la
nd /
alf
alfa
) K
g Kg
Ha
6.6
Irri
gate
d or
char
dAr
ea:
Seer
sJe
ribs
(mul
berr
y/ w
alnu
ts/
appl
e) Kg
Ha
6.7
Irri
gate
d vi
neya
rdAr
ea:
Seer
sJe
ribs
(no
land
/ d
ied
/ gr
apes
) Kg
Ha
6.8
Rain
fed
grai
nAr
ea:
Seer
sSe
ers
Jeri
bs(n
o la
nd /
whe
at /
bar
ley/
Kg
kgH
am
elon
/ ot
her)
6.9
Rain
fed
past
ure
Area
:Je
ribs
(no
land
/ dr
y/ u
sed)
Ha
Shar
ecro
pped
land
Crop
Seed
am
ount
Prod
ucti
onN
o. o
f Pa
rcel
sAr
ea/
no.p
lant
s
6.10
Shar
ecro
pped
wit
hSe
ers
Seer
sJe
ribs
land
lord
1Kg
KgH
a
6.11
Shar
ecro
pped
wit
h Se
ers
Seer
sJe
ribs
land
lord
1/2
Kg
KgH
a
Who
pro
vide
s?La
bour
Seed
Fert
ilise
rD
raug
ht p
ower
Crop
Sha
re (
%)Cr
op S
hare
%Fa
rmer
Land
lord
Afghanistan Research and Evaluation Unit (AREU) 73
Rethinking Rural Livelihoods in Afghanistan
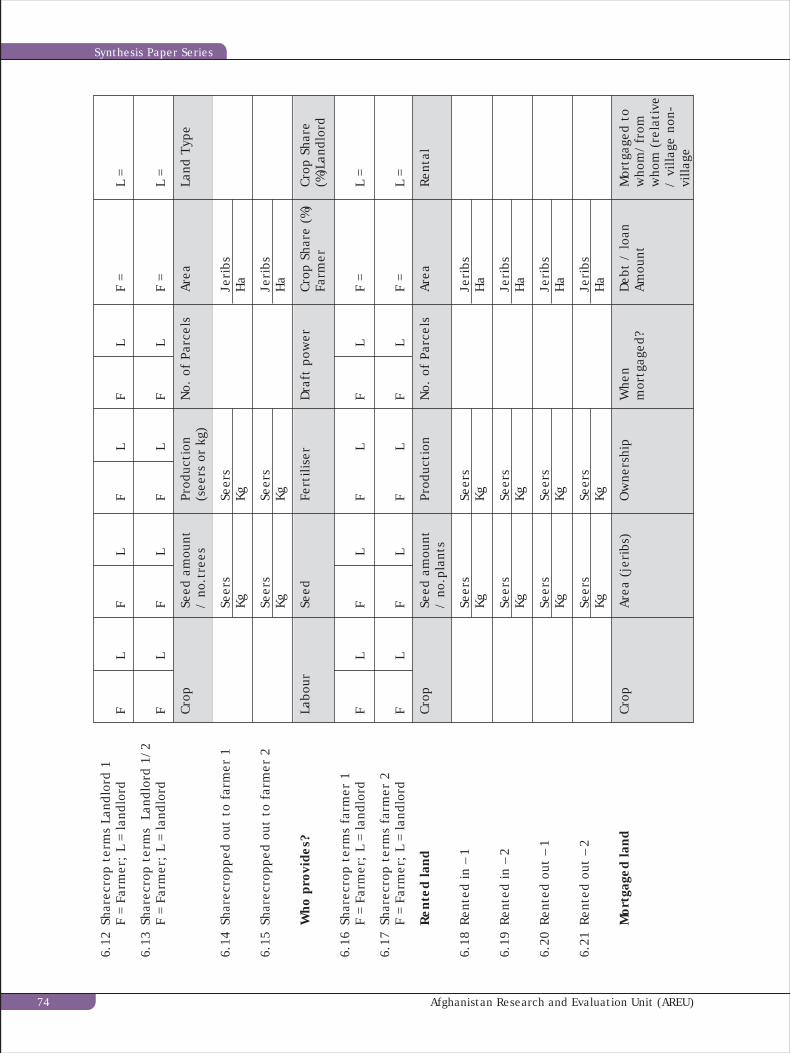
6.12
Shar
ecro
p te
rms
Land
lord
1F
= Fa
rmer
; L
= la
ndlo
rdF
LF
LF
LF
LF
=L
=
6.13
Shar
ecro
p te
rms
Lan
dlor
d 1/
2F
= Fa
rmer
; L
= la
ndlo
rdF
LF
LF
LF
LF
=L
=
Crop
Seed
am
ount
Prod
ucti
on
No.
of
Parc
els
Area
Land
Typ
e/
no.t
rees
(see
rs o
r kg
)
6.14
Shar
ecro
pped
out
to
farm
er 1
Seer
sSe
ers
Jeri
bsKg
KgH
a
6.15
Shar
ecro
pped
out
to
farm
er 2
Seer
sSe
ers
Jeri
bsKg
KgH
a
Who
pro
vide
s?La
bour
Seed
Fert
ilise
rD
raft
pow
erCr
op S
hare
(%)
Crop
Sha
reFa
rmer
(%)L
andl
ord
6.16
Shar
ecro
p te
rms
farm
er 1
F =
Farm
er;
L =
land
lord
FL
FL
FL
FL
F =
L =
6.17
Shar
ecro
p te
rms
farm
er 2
F =
Farm
er;
L =
land
lord
FL
FL
FL
FL
F =
L =
Rent
ed la
ndCr
opSe
ed a
mou
ntPr
oduc
tion
No.
of
Parc
els
Area
Rent
al/
no.p
lant
s
6.18
Rent
ed in
– 1
Seer
sSe
ers
Jeri
bsKg
KgH
a
6.19
Rent
ed in
– 2
Seer
sSe
ers
Jeri
bsKg
KgH
a
6.20
Rent
ed o
ut –
1Se
ers
Seer
sJe
ribs
KgKg
Ha
6.21
Rent
ed o
ut –
2Se
ers
Seer
sJe
ribs
KgKg
Ha
Mor
tgag
ed la
ndCr
opAr
ea (
jeri
bs)
Ow
ners
hip
Whe
n D
ebt
/ lo
anM
ortg
aged
to
mor
tgag
ed?
Amou
ntw
hom
/fr
omw
hom
(re
lati
ve/
villa
ge n
on-
villa
ge
Afghanistan Research and Evaluation Unit (AREU)74
Synthesis Paper Series
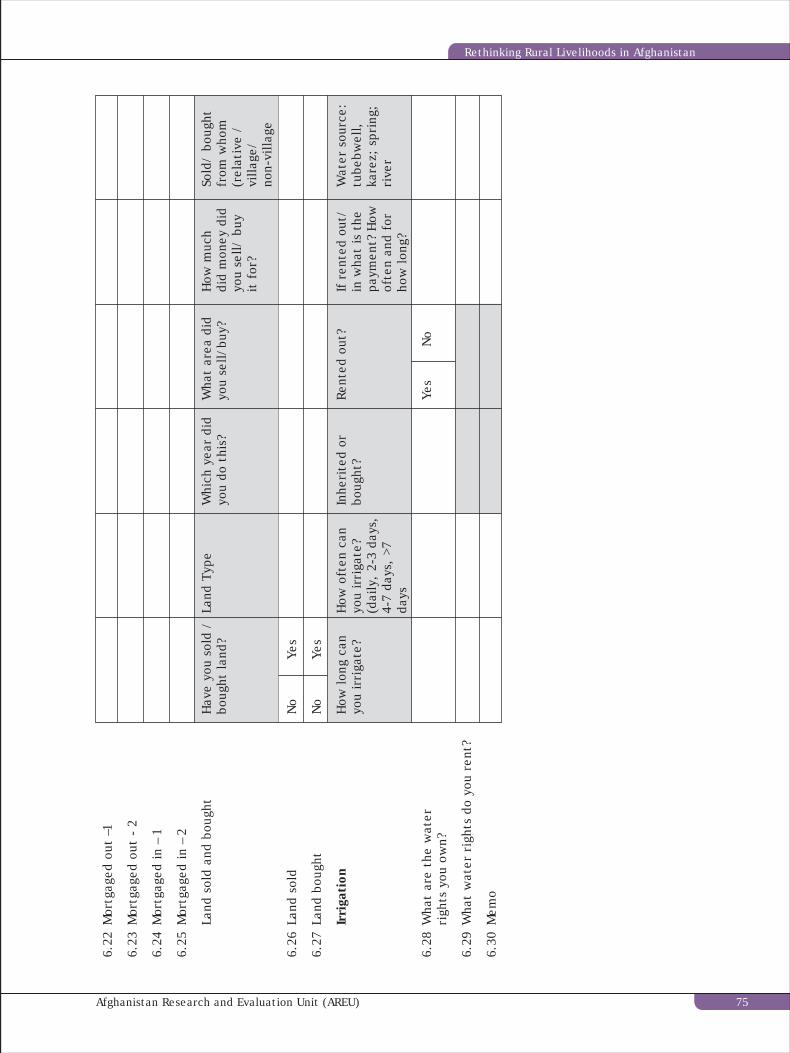
6.22
Mor
tgag
ed o
ut –
1
6.23
Mor
tgag
ed o
ut -
2
6.24
Mor
tgag
ed in
– 1
6.25
Mor
tgag
ed in
– 2
Land
sol
d an
d bo
ught
Hav
e yo
u so
ld /
Lan
d Ty
peW
hich
yea
r di
d W
hat
area
did
H
ow m
uch
Sold
/ bo
ught
boug
ht la
nd?
you
do t
his?
you
sell/
buy?
did
mon
ey d
idfr
om w
hom
you
sell/
buy
(rel
ativ
e /
it f
or?
villa
ge/
non-
villa
ge
6.26
Land
sol
dN
oYe
s
6.27
Land
bou
ght
No
Yes
Irri
gati
onH
ow lo
ng c
anH
ow o
ften
can
Inhe
rite
d or
Rent
ed o
ut?
If r
ente
d ou
t/W
ater
sou
rce:
you
irri
gate
?yo
u ir
riga
te?
boug
ht?
in w
hat
is t
hetu
bebw
ell,
(dai
ly,
2-3
days
,pa
ymen
t? H
owka
rez;
spr
ing;
4-7
days
, >7
ofte
n an
d fo
rri
ver
days
how
long
?
6.28
Wha
t ar
e th
e w
ater
Ye
sN
ori
ghts
you
ow
n?
6.29
Wha
t w
ater
rig
hts
do y
ou r
ent?
6.30
Mem
o
Afghanistan Research and Evaluation Unit (AREU) 75
Rethinking Rural Livelihoods in Afghanistan
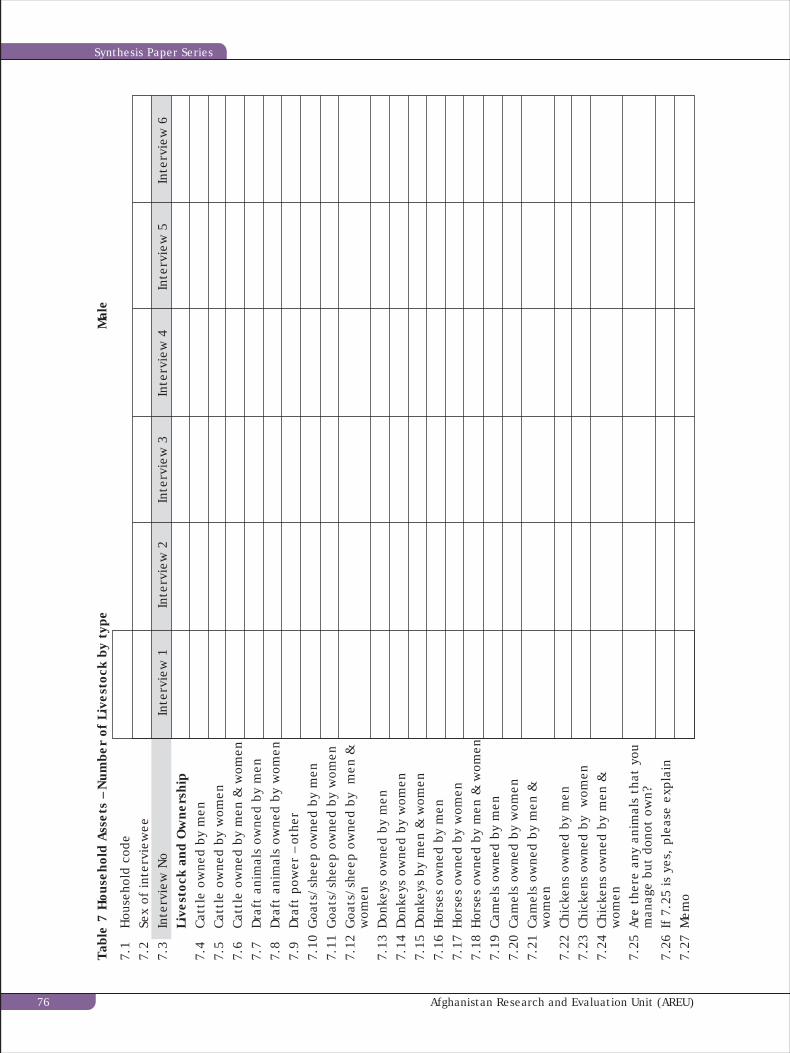
Tabl
e 7
Hou
seho
ld A
sset
s –
Num
ber
of L
ives
tock
by
type
Mal
e
7.1
Hou
seho
ld c
ode
7.2
Sex
of in
terv
iew
ee7.
3In
terv
iew
No
Inte
rvie
w 1
Inte
rvie
w 2
Inte
rvie
w 3
Inte
rvie
w 4
Inte
rvie
w 5
Inte
rvie
w 6
Live
stoc
k an
d O
wne
rshi
p7.
4Ca
ttle
ow
ned
by m
en7.
5Ca
ttle
ow
ned
by w
omen
7.6
Catt
le o
wne
d by
men
& w
omen
7.7
Dra
ft a
nim
als
owne
d by
men
7.8
Dra
ft a
nim
als
owne
d by
wom
en7.
9D
raft
pow
er –
oth
er7.
10G
oats
/she
ep o
wne
d by
men
7.11
Goa
ts/s
heep
ow
ned
by w
omen
7.12
Goa
ts/s
heep
ow
ned
by m
en &
wom
en7.
13D
onke
ys o
wne
d by
men
7.14
Don
keys
ow
ned
by w
omen
7.15
Don
keys
by
men
& w
omen
7.16
Hor
ses
owne
d by
men
7.17
Hor
ses
owne
d by
wom
en7.
18H
orse
s ow
ned
by m
en &
wom
en7.
19Ca
mel
s ow
ned
by m
en7.
20Ca
mel
s ow
ned
by w
omen
7.21
Cam
els
owne
d by
men
&w
omen
7.22
Chic
kens
ow
ned
by m
en7.
23Ch
icke
ns o
wne
d by
w
omen
7.24
Chic
kens
ow
ned
by m
en &
wom
en7.
25Ar
e th
ere
any
anim
als
that
you
man
age
but
dono
t ow
n?7.
26If
7.2
5 is
yes
, pl
ease
exp
lain
7.27
Mem
o
Afghanistan Research and Evaluation Unit (AREU)76
Synthesis Paper Series
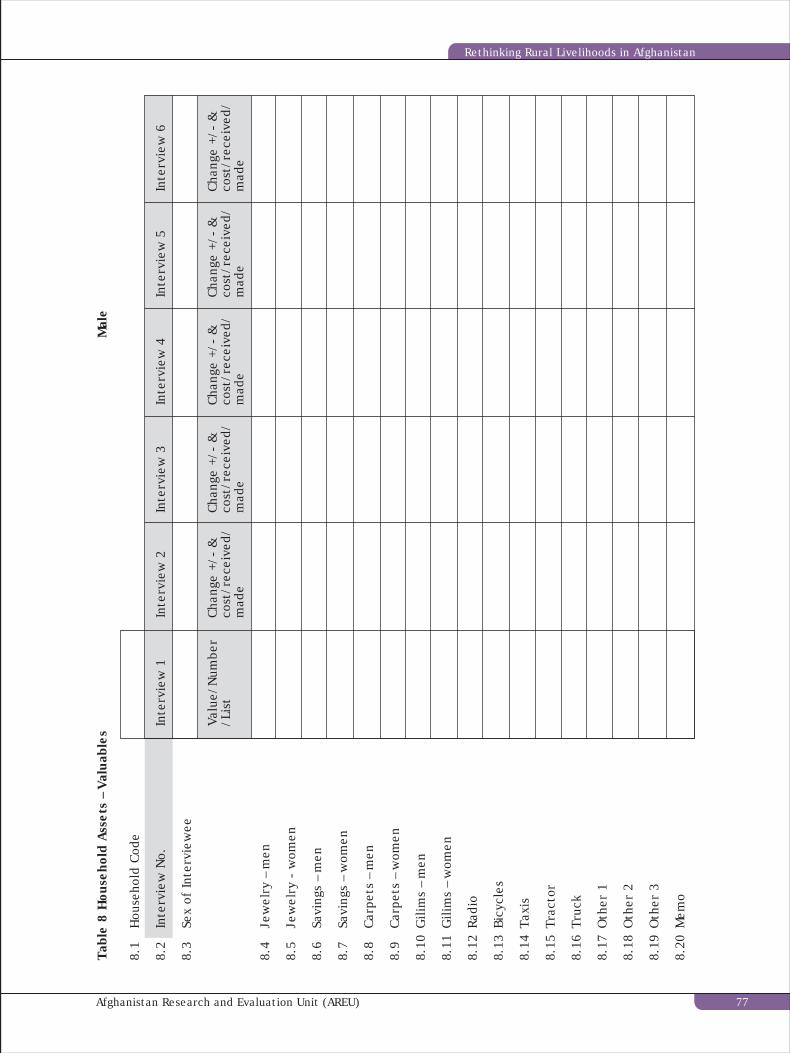
Tabl
e 8
Hou
seho
ld A
sset
s –
Valu
able
sM
ale
8.1
Hou
seho
ld C
ode
8.2
Inte
rvie
w N
o.In
terv
iew
1In
terv
iew
2In
terv
iew
3In
terv
iew
4In
terv
iew
5In
terv
iew
6
8.3
Sex
of In
terv
iew
ee
Valu
e/N
umbe
rCh
ange
+/-
&Ch
ange
+/-
&Ch
ange
+/-
&Ch
ange
+/-
&Ch
ange
+/-
&/L
ist
cost
/rec
eive
d/co
st/r
ecei
ved/
cost
/rec
eive
d/co
st/r
ecei
ved/
cost
/rec
eive
d/m
ade
mad
em
ade
mad
em
ade
8.4
Jew
elry
– m
en
8.5
Jew
elry
- w
omen
8.6
Savi
ngs
– m
en
8.7
Savi
ngs
– w
omen
8.8
Carp
ets
– m
en
8.9
Carp
ets
– w
omen
8.10
Gili
ms
– m
en
8.11
Gili
ms
– w
omen
8.12
Radi
o
8.13
Bicy
cles
8.14
Taxi
s
8.15
Trac
tor
8.16
Truc
k
8.17
Oth
er 1
8.18
Oth
er 2
8.19
Oth
er 3
8.20
Mem
o
Afghanistan Research and Evaluation Unit (AREU) 77
Rethinking Rural Livelihoods in Afghanistan
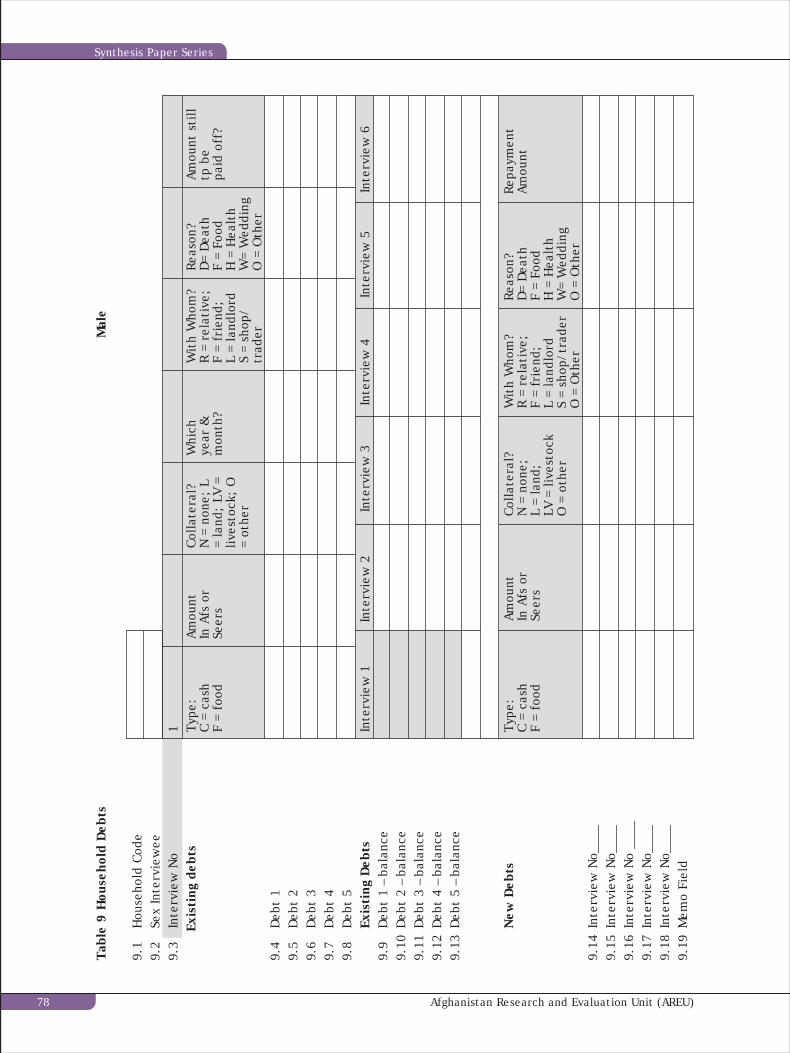
Tabl
e 9
Hou
seho
ld D
ebts
Mal
e
9.1
Hou
seho
ld C
ode
9.2
Sex
Inte
rvie
wee
9.3
Inte
rvie
w N
o1
Exis
ting
deb
ts
Type
:Am
ount
Colla
tera
l?W
hich
Wit
h W
hom
?Re
ason
?Am
ount
sti
llC
= ca
shIn
Afs
or
N =
non
e; L
year
&R
= re
lati
ve;
D=
Dea
thtp
be
F =
food
Seer
s=
land
; LV
=m
onth
?F
= fr
iend
;F
= Fo
odpa
id o
ff?
lives
tock
; O
L =
land
lord
H =
Hea
lth
= ot
her
S =
shop
/W
= W
eddi
ngtr
ader
O =
Oth
er9.
4D
ebt
19.
5D
ebt
29.
6D
ebt
39.
7D
ebt
49.
8D
ebt
5Ex
isti
ng D
ebts
Inte
rvie
w 1
Inte
rvie
w 2
Inte
rvie
w 3
Inte
rvie
w 4
Inte
rvie
w 5
Inte
rvie
w 6
9.9
Deb
t 1
– ba
lanc
e9.
10D
ebt
2 –
bala
nce
9.11
Deb
t 3
– ba
lanc
e9.
12D
ebt
4 –
bala
nce
9.13
Deb
t 5
– ba
lanc
e
New
Deb
tsTy
pe:
Amou
ntCo
llate
ral?
Wit
h W
hom
?Re
ason
?Re
paym
ent
C =
cash
In A
fs o
rN
= n
one;
R =
rela
tive
;D
= D
eath
Amou
ntF
= fo
odSe
ers
L =
land
;F
= fr
iend
;F
= Fo
odLV
= li
vest
ock
L =
land
lord
H =
Hea
lth
O =
oth
erS
= sh
op/t
rade
rW
= W
eddi
ngO
= O
ther
O =
Oth
er9.
14In
terv
iew
No_
___
9.15
Inte
rvie
w N
o___
_9.
16In
terv
iew
No
____
9.17
Inte
rvie
w N
o___
_9.
18In
terv
iew
No_
___
9.19
Mem
o Fi
eld
Afghanistan Research and Evaluation Unit (AREU)78
Synthesis Paper Series
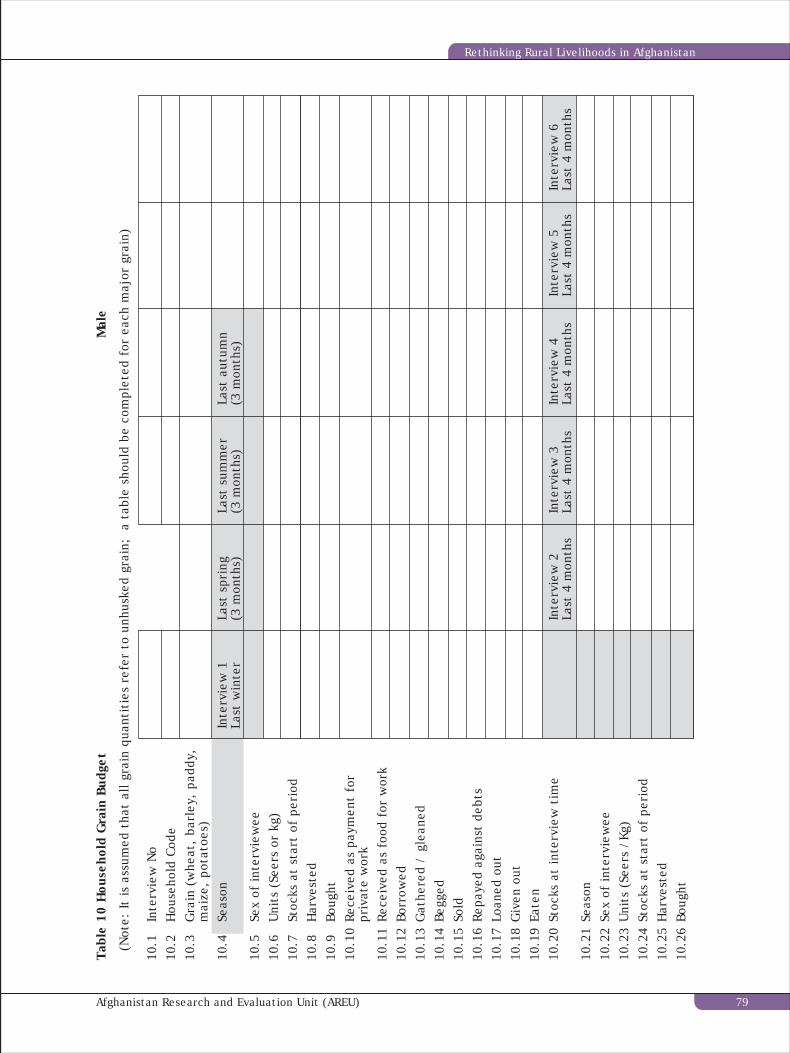
Tabl
e 10
Hou
seho
ld G
rain
Bud
get
Mal
e
(Not
e: It
is a
ssum
ed t
hat
all g
rain
qua
ntit
ies
refe
r to
unh
uske
d gr
ain;
a
tabl
e sh
ould
be
com
plet
ed f
or e
ach
maj
or g
rain
)
10.1
Inte
rvie
w N
o10
.2H
ouse
hold
Cod
e10
.3G
rain
(w
heat
, ba
rley
, pa
ddy,
mai
ze,
pota
toes
)10
.4Se
ason
Inte
rvie
w 1
Last
spr
ing
Last
sum
mer
Last
aut
umn
Last
win
ter
(3 m
onth
s)(3
mon
ths)
(3 m
onth
s)10
.5Se
x of
inte
rvie
wee
10.6
Uni
ts (
Seer
s or
kg)
10.7
Stoc
ks a
t st
art
of p
erio
d10
.8H
arve
sted
10.9
Boug
ht10
.10
Rece
ived
as
paym
ent
for
priv
ate
wor
k10
.11
Rece
ived
as
food
for
wor
k10
.12
Borr
owed
10.1
3G
athe
red
/ gl
eane
d10
.14
Begg
ed10
.15
Sold
10.1
6Re
paye
d ag
ains
t de
bts
10.1
7Lo
aned
out
10.1
8G
iven
out
10.1
9Ea
ten
10.2
0St
ocks
at
inte
rvie
w t
ime
Inte
rvie
w 2
Inte
rvie
w 3
Inte
rvie
w 4
Inte
rvie
w 5
Inte
rvie
w 6
Last
4 m
onth
sLa
st 4
mon
ths
Last
4 m
onth
sLa
st 4
mon
ths
Last
4 m
onth
s10
.21
Seas
on10
.22
Sex
of in
terv
iew
ee10
.23
Uni
ts (
Seer
s /K
g)10
.24
Stoc
ks a
t st
art
of p
erio
d10
.25
Har
vest
ed10
.26
Boug
ht
Afghanistan Research and Evaluation Unit (AREU) 79
Rethinking Rural Livelihoods in Afghanistan
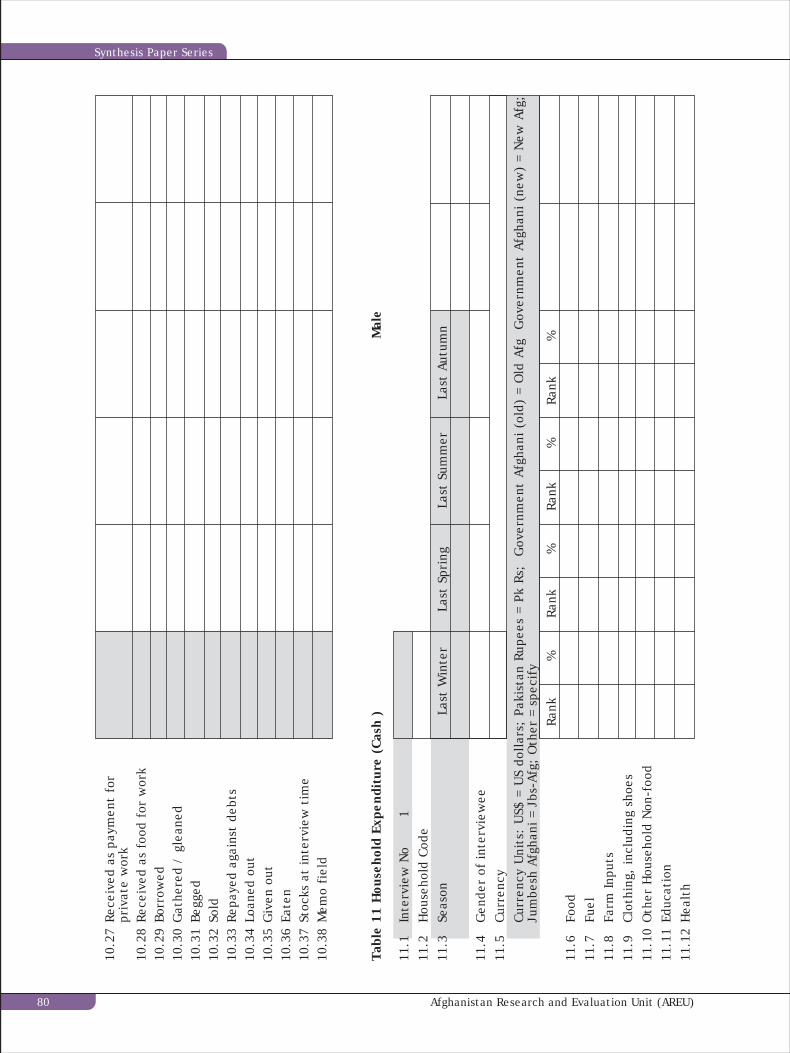
10.2
7Re
ceiv
ed a
s pa
ymen
t fo
rpr
ivat
e w
ork
10.2
8Re
ceiv
ed a
s fo
od f
or w
ork
10.2
9Bo
rrow
ed10
.30
Gat
here
d /
glea
ned
10.3
1Be
gged
10.3
2So
ld10
.33
Repa
yed
agai
nst
debt
s10
.34
Loan
ed o
ut10
.35
Giv
en o
ut10
.36
Eate
n10
.37
Stoc
ks a
t in
terv
iew
tim
e10
.38
Mem
o fi
eld
Tabl
e 11
Hou
seho
ld E
xpen
ditu
re (
Cash
)M
ale
11.1
Inte
rvie
w N
o1
11.2
Hou
seho
ld C
ode
11.3
Seas
onLa
st W
inte
rLa
st S
prin
gLa
st S
umm
erLa
st A
utum
n
11.4
Gen
der
of in
terv
iew
ee11
.5Cu
rren
cyC
urre
ncy
Uni
ts:
US$
= U
S do
llar
s; P
akis
tan
Rupe
es =
Pk
Rs;
Gov
ernm
ent
Afgh
ani
(old
) =
Old
Afg
G
over
nmen
t Af
ghan
i (n
ew)
= N
ew A
fg;
Jum
besh
Afg
hani
= J
bs-A
fg;
Oth
er =
spe
cify
Rank
%Ra
nk%
Rank
%Ra
nk%
11.6
Food
11.7
Fuel
11.8
Farm
Inpu
ts11
.9Cl
othi
ng,
incl
udin
g sh
oes
11.1
0O
ther
Hou
seho
ld N
on-f
ood
11.1
1Ed
ucat
ion
11.1
2H
ealt
h
Afghanistan Research and Evaluation Unit (AREU)80
Synthesis Paper Series
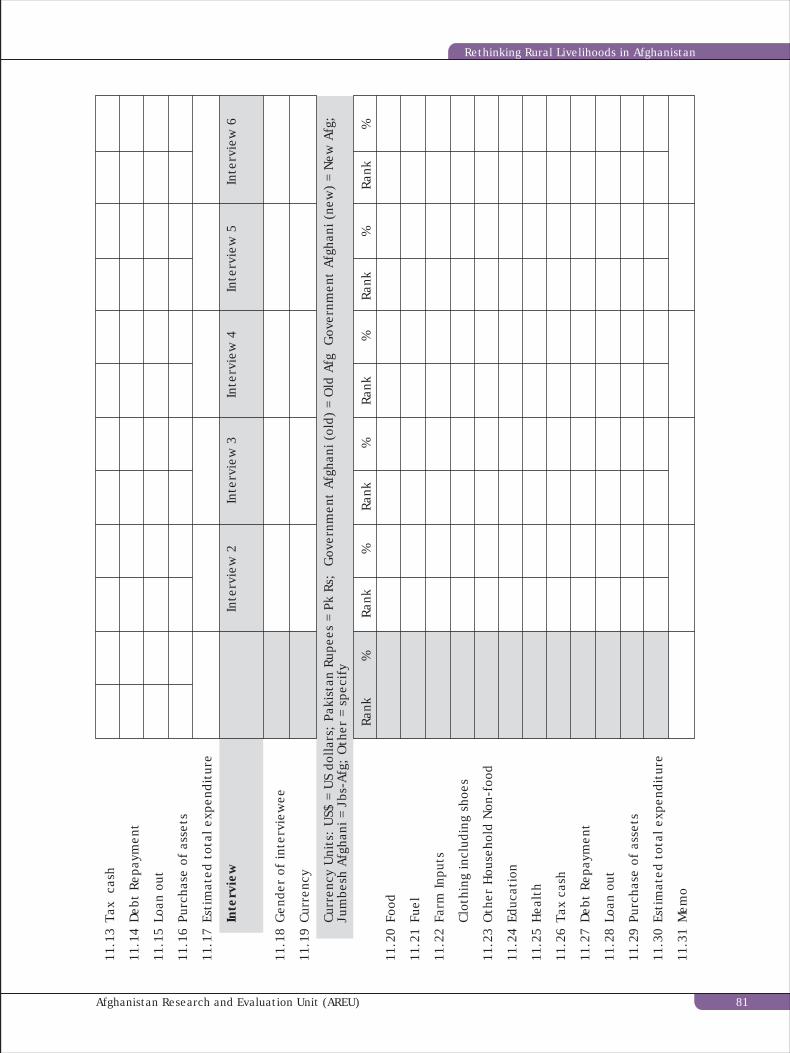
11.1
3Ta
x c
ash
11.1
4D
ebt
Repa
ymen
t
11.1
5Lo
an o
ut
11.1
6Pu
rcha
se o
f as
sets
11.1
7Es
tim
ated
tot
al e
xpen
ditu
re
Inte
rvie
wIn
terv
iew
2In
terv
iew
3In
terv
iew
4In
terv
iew
5In
terv
iew
6
11.1
8G
ende
r of
inte
rvie
wee
11.1
9Cu
rren
cy
Curr
ency
Uni
ts:
US$
= U
S do
llars
; Pa
kist
an R
upee
s =
Pk R
s; G
over
nmen
t Af
ghan
i (ol
d) =
Old
Afg
G
over
nmen
t Af
ghan
i (ne
w)
= N
ew A
fg;
Jum
besh
Afg
hani
= J
bs-A
fg;
Oth
er =
spe
cify
Rank
%Ra
nk%
Rank
%Ra
nk%
Rank
%Ra
nk%
11.2
0Fo
od
11.2
1Fu
el
11.2
2Fa
rm In
puts
Clot
hing
incl
udin
g sh
oes
11.2
3O
ther
Hou
seho
ld N
on-f
ood
11.2
4Ed
ucat
ion
11.2
5H
ealt
h
11.2
6Ta
x ca
sh
11.2
7D
ebt
Repa
ymen
t
11.2
8Lo
an o
ut
11.2
9Pu
rcha
se o
f as
sets
11.3
0Es
tim
ated
tot
al e
xpen
ditu
re
11.3
1M
emo
Afghanistan Research and Evaluation Unit (AREU) 81
Rethinking Rural Livelihoods in Afghanistan
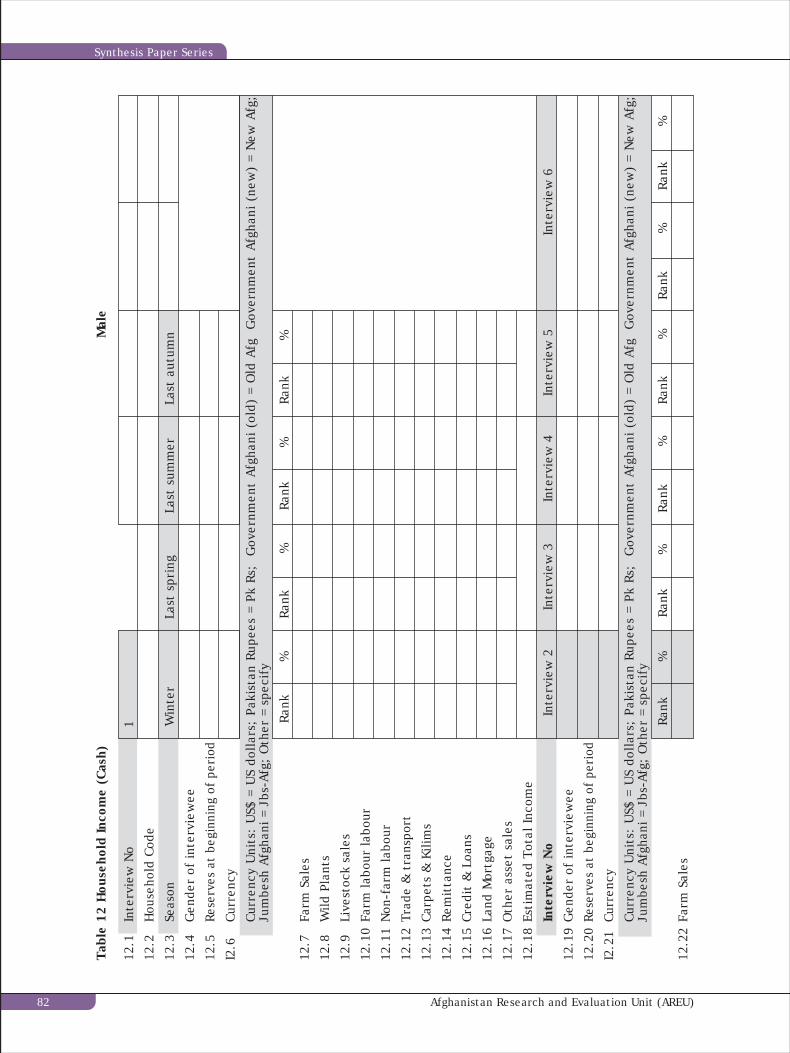
Tabl
e 12
Hou
seho
ld In
com
e (C
ash)
M
ale
12.1
Inte
rvie
w N
o1
12.2
Hou
seho
ld C
ode
12.3
Seas
onW
inte
rLa
st s
prin
gLa
st s
umm
erLa
st a
utum
n
12.4
Gen
der
of in
terv
iew
ee
12.5
Rese
rves
at
begi
nnin
g of
per
iod
I2.6
Curr
ency
Cur
renc
y U
nits
: U
S$ =
US
doll
ars;
Pak
ista
n Ru
pees
= P
k Rs
; G
over
nmen
t Af
ghan
i (o
ld)
= O
ld A
fg
Gov
ernm
ent
Afgh
ani
(new
) =
New
Afg
;Ju
mbe
sh A
fgha
ni =
Jbs
-Afg
; O
ther
= s
peci
fy
Rank
%Ra
nk%
Rank
%Ra
nk%
12.7
Farm
Sal
es
12.8
Wild
Pla
nts
12.9
Live
stoc
k sa
les
12.1
0Fa
rm la
bour
labo
ur
12.1
1N
on-f
arm
labo
ur
12.1
2Tr
ade
& t
rans
port
12.1
3Ca
rpet
s &
Kili
ms
12.1
4Re
mit
tanc
e
12.1
5Cr
edit
& L
oans
12.1
6La
nd M
ortg
age
12.1
7O
ther
ass
et s
ales
12.1
8Es
tim
ated
Tot
al In
com
e
Inte
rvie
w N
oIn
terv
iew
2In
terv
iew
3In
terv
iew
4In
terv
iew
5In
terv
iew
6
12.1
9G
ende
r of
inte
rvie
wee
12.2
0Re
serv
es a
t be
ginn
ing
of p
erio
d
I2.2
1Cu
rren
cy
Cur
renc
y U
nits
: U
S$ =
US
doll
ars;
Pak
ista
n Ru
pees
= P
k Rs
; G
over
nmen
t Af
ghan
i (o
ld)
= O
ld A
fg
Gov
ernm
ent
Afgh
ani
(new
) =
New
Afg
;Ju
mbe
sh A
fgha
ni =
Jbs
-Afg
; O
ther
= s
peci
fy
Rank
%Ra
nk%
Rank
%Ra
nk%
Rank
%Ra
nk%
12.2
2Fa
rm S
ales
Afghanistan Research and Evaluation Unit (AREU)82
Synthesis Paper Series
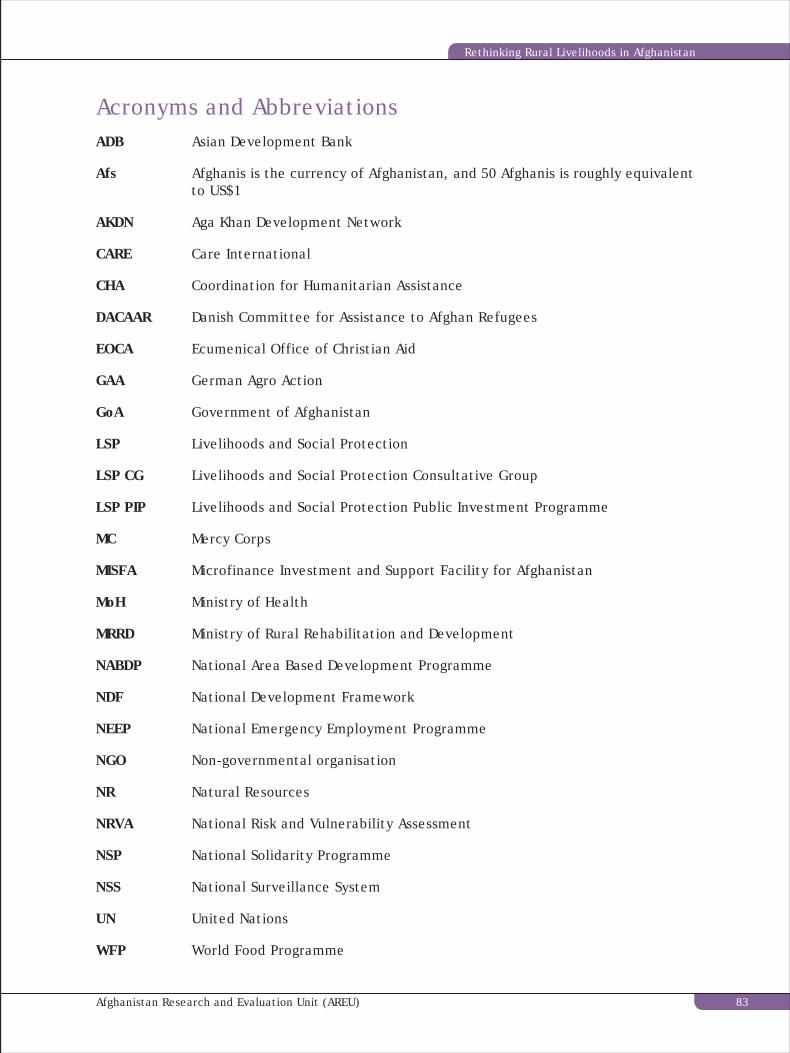
ADB Asian Development Bank
Afs Afghanis is the currency of Afghanistan, and 50 Afghanis is roughly equivalentto US$1
AKDN Aga Khan Development Network
CARE Care International
CHA Coordination for Humanitarian Assistance
DACAAR Danish Committee for Assistance to Afghan Refugees
EOCA Ecumenical Office of Christian Aid
GAA German Agro Action
GoA Government of Afghanistan
LSP Livelihoods and Social Protection
LSP CG Livelihoods and Social Protection Consultative Group
LSP PIP Livelihoods and Social Protection Public Investment Programme
MC Mercy Corps
MISFA Microfinance Investment and Support Facility for Afghanistan
MoH Ministry of Health
MRRD Ministry of Rural Rehabilitation and Development
NABDP National Area Based Development Programme
NDF National Development Framework
NEEP National Emergency Employment Programme
NGO Non-governmental organisation
NR Natural Resources
NRVA National Risk and Vulnerability Assessment
NSP National Solidarity Programme
NSS National Surveillance System
UN United Nations
WFP World Food Programme
Acronyms and Abbreviations
Afghanistan Research and Evaluation Unit (AREU) 83
Rethinking Rural Livelihoods in Afghanistan
Afghanistan Assistance Coordination Authority. The National Development Framework – Draftfor Comments. Kabul: AACA. 2002.
Aga Khan Development Network. Badakhshan Livelihoods Monitoring Report. UnpublishedPaper. Kabul: AKDN. 2004.
Alden Wily, L. Land Rights in Crisis: Restoring Tenure Security in Afghanistan. Kabul: AREU.2003.
Alden Wily, L. Faryab Land Case Study. Forthcoming. Kabul: AREU.
Asian Development Bank. Multi-Donor Mission, Natural Resources and Agricultural Sector,Comprehensive Needs Assessment, Draft Report. Kabul: ADB. 2002.
CARE. Final Report: CARE Afghanistan Livelihoods Monitoring Project. Unpublished. Kabul:CARE. 2004.
Christoplos, I. Out of Step? Agricultural Policy and Afghan Livelihoods. Kabul: AREU. 2004.
Coke, A. Wheat Seed and Agriculture Programming in Afghanistan: Its Potential to Impacton Livelihoods: Two Case Studies from Five Villages in Two Provinces. Kabul: AREU. 2004.
Dercon, S. “Income Risk, Coping Strategies, and Safety Nets.” The World Bank ResearchObserver. 2002. 17(2): 141-166.
Ellis, F. Rural Livelihoods and Diversity in Developing Countries. Oxford: Oxford UniversityPress. 2000.
Ghafori, J. The Politics of the Wood Economy in Laghman. Forthcoming. Kabul: DACAAR.2004.
Government of Afghanistan/International Agencies. Securing Afghanistan’s Future:Accomplishments and the Strategic Path Forward. Kabul: GoA/International Agencies. 2004.
Grace, J. One Hundred Households in Kabul: A Study Of Winter Vulnerability, CopingStrategies, and the Impact of Cash-for-Work Programmes on the Lives of the “Vulnerable.”Kabul: AREU. 2003.
Grace, J. Gender Roles and Agriculture: Case Studies from Five Villages in NorthernAfghanistan. Kabul: AREU. 2004.
Karimi, A. The Pharmaceutical System in Afghanistan. Unpublished. Kabul: AREU. 2004.
Kerr-Wilson, A., and Pain, A. Three Villages in Laghman: A Case Study of Rural Livelihoods.Kabul: AREU. 2004.
Kerr-Wilson, A., and Ghafori, J. Monitoring Afghan Rural Livelihoods: Six Villages in Alingarand Pashtun Zarghun South. Kabul: DACAAR. 2004
Lacoste, J. Savings Strategies of Poor Women in Zimbabwe: A Socio-Economic Perspective.
Bibliography
Afghanistan Research and Evaluation Unit (AREU)84
Synthesis Paper Series
Paper presented at Conference on Livelihoods, Savings and Debts. Wageingen, Netherlands.2001.
Lautze, S., Stites, E., Nojumi, N., Najimi, F. Qaht-e-Pool “A Cash Famine:” Food Insecurityin Afghanistan 1999-2002. Medford, Massachusetts: Feinstein International Famine Centre.2002.
Mansfield, D. “The Economic Superiority of Illicit Drug Production: Myth and Reality,” OpiumPoppy Cultivation in Afghanistan. Paper prepared for the International Conference onAlternative Development in Drug Control and Cooperation. Feldafing. 17- 22 September,2001.
MRRD/World Bank. Rural Poverty in Afghanistan: Initial Insights from the NRVA 2004. Kabul:MRRD/Kabul. 2004
Pain, A. Livelihoods Under Stress in Faryab Province, Northern Afghanistan, Opportunitiesfor Support. Islamabad: Save the Children, US. 2001.
Pain, A., and Lautze, S. Addressing Livelihoods in Afghanistan. Kabul: AREU. 2002.
Pain, A. The Impact of the Opium Poppy Economy on Household Livelihoods: Evidence fromthe Wakhan Corridor and Khustak Valley in Badakhshan. Kabul: AKDN. 2003.
Pain, A. Understanding Village Institutions: Case Studies on Water Management from Saripuland Faryab. Kabul: AREU. 2004.
Rutherford, S. The Poor and their Money. New Delhi: Oxford University Press. 2000.
UNODC. The Opium Economy in Afghanistan. Geneva: United Nations Office on Drugs andCrime. 2003.
Whitehead, A. “Tracking Livelihood Change: Theoretical, Methodological and EmpiricalPerspective from North-East Ghana.” Journal of Southern African Studies, 2002. 28(3): 576– 598.
Wulf, A. Findings from Livelihoods Monitoring in Three Villages in Saripul. Internal Document.Kabul: German Agro Action. 2004.
Afghanistan Research and Evaluation Unit (AREU) 85
Rethinking Rural Livelihoods in Afghanistan
Publications from 2002 are not listed here.
March 2003 Land Rights in Crisis: Addressing Tenure Insecurity in Afghanistan, byLiz Alden Wily
August 2002, 2003 The A to Z Guide to Afghanistan Assistance, 1st and 2nd editions
September 2003 One Hundred Households in Kabul: A Study of Winter Vulnerability, byJo Grace
September 2003 Land and the Constitution, by Liz Alden Wily
October 2003 Three Villages in Alingar, Laghman: Understanding Rural Livelihoods,by Alice Kerr-Wilson and Adam Pain
November 2003 Afghan Elections: The Great Gamble
December 2003 Ending Impunity and Building Justice in Afghanistan, by Rama Mani
February 2004 Land Relations in Bamyan Province: Findings from a 15 Village CaseStudy, by Liz Alden Wily
February 2004 Some Notes on the Livelihoods of the Urban Poor in Kabul, Afghanistan,by Pamela Hunte
March 2004 A Guide to Government in Afghanistan, by AREU and the World Bank
March 2004 Subnational Administration in Afghanistan: Assessment andRecommendations for Action, by AREU and the World Bank
March 2004 National Risk and Vulnerability Assessment 2003: A Stakeholder-Generated Methodology, by Andrew Pinney
April 2004 Gender Roles in Agriculture: Case Studies of Five Villages in NorthernAfghanistan, by Jo Grace
April 2004 Understanding Village Institutions: Case Studies on Water Managementfrom Faryab and Saripul, by Adam Pain
April 2004 Wheat Seed and Agriculture Programming in Afghanistan: Its Potentialto Impact on Livelihoods, by Alexia Coke
May 2004 Out of Step? Agrciultural Policy and Afghan Livelihoods, by Ian Christoplos
May 2004 The Shiwa Pastures, 1978 – 2003: Land Tenure Changes and Confict inNortheastern Afghanistan, by Mervyn Patterson
May 2004 Urban Vulnerability in Afghanistan: Case Studies from Three Cities, bySteffan Schutte
Publications from AREU
All AREU publications can be downloaded as soft copies from www.areu.org.af. Hard copiescan be purchased the AREU office in Kabul: Charahi Ansari (opposite the Insaf Hotel andPopolano’s Restaurant), Shahr-e-Naw, Kabul, Afghanistan. For further information on AREUand its publications email. [email protected].
Afghanistan Research and Evaluation Unit (AREU)86
Synthesis Paper Series
The Afghanistan Research and Evaluation UnitCharahi Ansari (opposite the Insaf Hotel and Popolano’s restaurant)Shahr-e-Naw, Kabul, AfghanistanEmail: [email protected]: www.areu.org.af