rethinking the causes of corruption: perceived corruption
TRANSCRIPT
ORI GIN AL ARTICLE
Rethinking the Causes of Corruption: PerceivedCorruption, Measurement Bias, and Cultural Illusion
Ning He1
Received: 21 November 2015 / Accepted: 14 March 2016 / Published online: 4 April 2016
� Fudan University and Springer Science+Business Media Singapore 2016
Abstract This paper extends the empirical research on determinants of corruption
conducted during the last 20 years. It argues that the apparent correlations between
cultural traditions and a country’s corruption level are not valid causal inferences.
Instead, these correlations are primarily the artifacts of measurement bias on the
dependent variable. Corruption measured by perception-based indicators can be
conflated with the cultural bias conceived by the respondents whose subjective
assessments are the main sources of these indicators. These assessments tend to
attribute clean government to specific cultural traditions, for example, Protestantism
and a long history of being a democracy. These claims are defended with a series of
tests that show first the perception-based indicators of corruption suffer substantial
weaknesses, especially systematic measurement bias; second, how the causal
mechanisms linking corruption to cultural traditions exhibit inherent theoretical
uncertainties; and third, that most of the statistical relationships between cultural
traditions and corruption disappear when perception-based indicators of corruption
are substituted with an experience-based measurement of corruption. In short, the
proposed causal relationships between cultural traditions and corruption are
spurious.
Keywords Corruption � Corruption perception � Cultural tradition � Measurement
bias
& Ning He
1 Fudan University, 220 Handan Rd., Yangpu District, Shanghai, China
123
Chin. Polit. Sci. Rev. (2016) 1:268–302
DOI 10.1007/s41111-016-0024-0
1 Introduction
How do we account for the variance of corruption levels between different countries
around the globe? This is one of the most prominent research topics covered by
economists, political scientists, and specialists from international organizations in
the last 20 years. Since the late 1990s, considerable empirical research on
determinants of corruption has emerged, which has produced a body of research
findings and policy implications. These studies have propounded various proposi-
tions, each of which links corruption to a factor that is claimed to have an effect on
the level of corruption.1 The factors that have been proposed as determinants of
corruption in previous literature can be classified into four different categories:
political institutions (for example: institutional democracy, federal structure,
freedom of press); development (for example: economic development, educational
attainment); economic policy and structure (for example: economic freedom,
inflation, economic openness); and cultural traditions (for example: religious
traditions, colonial traditions, legal traditions). Among these factors, institutional
democracy and decentralization, economic development, and freedom are the most
frequently examined determinants of corruption. While the academic circle has
accumulated a lot of literature and propositions on the causes of corruption, whether
these propositions are valid causal inferences remains a question, since previous
studies on determinants of corruption are mostly grounded in perception-based
indicators that some researchers have shown generate seriously flawed data. This
paper intends to examine the validity of part of the research findings on causes of
corruption based on perception-based indicators, which accords with re-examining
the final proposition in earlier scholarship, namely the relationship between cultural
traditions and corruption.
Cultural explanations of corruption are prevalent in previous literature. For
examples, La Porta et al. (1999) found countries that were ethno-linguistically
heterogeneous, used French or socialist laws, and those that had high proportions of
Catholics or Muslims exhibited inferior government performance. Treisman (2000)
extensively examined the relationships between different cultural traditions and
corruption and found that countries with Protestant traditions, histories of British
rule, and long exposure to democracy were less corrupt. Pellegrini and Gerlagh
(2008) also found that a medium-long exposure to uninterrupted democracy is
associated with lower corruption levels. Mensah (2014) found that religious
traditions as well as national cultural differences had significant effects on perceived
levels of corruption. These studies, which commonly assert that colonial tradition,
religious tradition, legal tradition, and the democratic tradition are significantly
correlated with corruption levels, seem to be well accepted by other scholars, since
subsequent studies often take these cultural tradition factors as control variables in
their regressions.
1 I have reviewed more than forty pieces of literature published between 1999 and 2015 that used cross-
national data to specify the determinants of corruption. In these papers, more than thirty factors were
proposed as the determinants of corruption.
Chin. Polit. Sci. Rev. (2016) 1:268–302 269
123
While previous research on determinants of corruption repeatedly affirmed the
seemingly robust statistical relationships between specific cultural traditions and
corruption, this study finds the proposed causal relationships between cultural
traditions and corruption are spurious, since, first, in the literature the data used to
measure corruption are systematically biased; and second, the causal mechanisms
linking corruption to cultural traditions are tenuous.
In this paper, critiques on the cultural explanations of corruption unfold into three
interrelated parts. First, I re-examine the quality of the perception-based indicators
of corruption and try to demonstrate that the sources and methodologies used for
aggregating these indicators are seriously flawed and lead to biased measurements. I
argue that these indicators do not assess corruption levels on the basis of objective
truth, but rather based on experts’ and international business professionals’
subjective perceptions. Those perceptions cannot precisely capture the rate of
corruption. On the contrary, they are systematically biased by ideology, cultural
prejudices, and other factors. That respondents gave a positive evaluation of a
country’s corruption level could simply be because they found the country had met
specific cultural criteria—the main reason that corruption was found to be correlated
with cultural traditions.
Second, I re-examine the plausibility of the causal mechanisms linking
corruption to different cultural traditions and present evidence that most of the
causal mechanisms proposed in previous literature are speculative and cannot
weather empirical examination. In fact, they are not effective causal explanations,
but rather the artificial ornaments for the statistical findings.
Third, I substantiate my claims by regressing corruption on different cultural
traditions. The regression results show that when corruption is measured by the
experience-based indicator, which does not have the significant problems that
perception-based indicators have, most of the significant correlations between
cultural traditions and corruption disappear. I further found that some of the cultural
tradition variables are significantly associated with the measurement bias on
perception-based indicators of corruption. These findings demonstrate that the
statistical associations between cultural traditions and corruption is not robust. The
significant correlations between cultural tradition variables and perceived corruption
may very well be the result of perceptual biases rather than a reflection of causal
relationships.
I mainly focus on four cultural traditions in the empirical examinations, namely
colonial tradition, religious traditions, legal traditions, and democratic tradition, all
of which were frequently proposed in previous literature as determinants of
corruption. In addition, these factors have much in common both conceptually and
theoretically. In conception, a country’s attributes, called ‘‘cultural traditions’’ in
this paper, are defined as a history of that country being dominated by a specific
political structure or value system that was in sharp contrast to those of other
countries. In other words, cultural tradition is the fixed character of a country. In
theory, causal explanations proposed to explain the correlations between different
cultural traditions and corruption by previous literature share substantial similarities
with each other, in which cultural traditions could influence a country’s corruption
level by shaping its current political values or policy preferences.
270 Chin. Polit. Sci. Rev. (2016) 1:268–302
123
In empirical testing, I found almost none of the cultural tradition factors was a
significant predictor of corruption level, and the proposed causal mechanisms are
spurious as well. Based on this evidence, I contend that the apparent statistical
associations between cultural traditions and perception-based indicators of corrup-
tion are not causal. They may just reflect the biased causal inferences conceived by
respondents whose perceptions were the main sources of the measurement of
corruption. It is noteworthy that while the proposed causal relations between
cultural traditions and corruption are spurious, the theme of this paper is not to
prove that no causal relation can exist between any cultural factors and corruption.
By questioning already existing research conclusions, this paper aims to highlight
the cost of using perception-based indicators to study the determinants of
corruption, as well as the cost of deviating from political and economic explanations
of corruption.
2 Weakness of Measurement
Before the 1990s, it was difficult for researchers to do cross-national comparative
studies on the issue of corruption. There was a lack of comparable cross-national
data on corruption. Then, thanks to international organizations and private
enterprises like Transparency International, the World Bank, and the PRS Group,
which have released cross-national data on corruption annually since the 1990s,
literature that empirically examines the causes and consequences of corruption on a
cross-national level exploded. Cross-national data on corruption have become a
highly useful and common tool for researchers to use to study corruption
empirically. Nevertheless, most of the corruption data used in previous cross-
national studies are perception based rather than experience based. One of the
reasons is experience-based data of corruption are very rare especially compared
with the perception-based data. During the last 10 years, a body of research has
demonstrated that the perception-based measurements of corruption, especially
perception-based composite indicators, have substantial limitations and even flaws
(Knack 2006; Abramo 2008; Andersson and Heywood 2009; Olken 2009;
Razafindrakoto and Roubaud 2010; Thomas 2010). In addition, there has been
intense debate on the quality and utility of perception-based cross-national
governance indicators (see Kaufmann et al. 2007a, b; Kurtz and Schrank 2007a,
b). The warnings and debate did not draw enough of the attention of researchers that
focus on the causes of corruption, since most cross-national quantitative studies on
the subject published in recent years still employ perception-based composite
indexes as the primary measurements of corruption. The most popular of those
indexes are the World Bank’s Control of Corruption Index (CCI) and Transparency
International’s Corruption Perception Index (CPI). On the other hand, literature that
uses experience-based data of corruption on dependent variables is very rare (see
Treisman 2007; Fan et al. 2009). It is understandable that most researchers prefer
perception-based composite indicators to other kinds of measurements of corruption
in their cross-national studies, as CCI and CPI are well known and have been
employed repeatedly in previous work. More importantly, perception-based
Chin. Polit. Sci. Rev. (2016) 1:268–302 271
123
composite indicators ensure researchers have the ability to construct a much larger
sample than any other measurement can because they cover many more observed
countries and years. Such convenience or advantage seemed to outweigh other
considerations in the majority of previous studies. However, concerns about the
quality of perception-based data are too pressing to be neglected in cross-national
studies on causes of corruption.
In the three parts of this section, I mainly discuss the quality of perception-based
composite indicators of corruption, combining research findings included in
previous literature and other new empirical evidence discovered in this research.
In the discussion, some key questions about the utility of CCI and CPI for cross-
national studies are answered. For example, is the large sample constructed from the
data of the CCI and CPI really reliable? Are measurements of corruption by the CCI
and CPI biased? Do the CCI and CPI capture the actual level of corruption?
2.1 Sacrificed Comparability
Perception-based composite indicators of corruption cover far more country-year
observations than other measurements. The first set of CPI data measured the
corruption level of 41 countries as of 1995. Since then data measuring countries’
corruption levels during the prior year has been released annually. CPI’s coverage
has enlarged since the 41 countries it analyzed in 1995. In 2014 the number of
countries covered by this index reached 175, which accounts for two-thirds of all the
countries in the world. CCI is another widely used perception-based composite
index of corruption; it covers 1996, 1998, 2000, and all years from 2002 to 2012,
taking into account more than two hundred countries. With the abundance of data
from CPI and CCI, it is not difficult to construct a time-serial cross-national panel
that can reach a sample size of thousands of observations.
Nonetheless, a large sample is not necessarily a good sample. For samples
constructed from data from CCI or CPI, there is a tradeoff between sample size and
the comparability between different observed values. In fact, too many observed
values from CCI or CPI are not comparable with each other. Both the CCI and CPI
are composite indicators that aggregate many different sources of corruption data to
get the final scores and rankings. These sources define corruption differently from
each other, and they came from different institutions that survey different
respondents and use different methodologies to construct them. In addition,
different sources cover different groups of countries. The aggregation procedures try
to make the indicators have a more extensive coverage by combining sources with
different coverage together but nonetheless makes different observed values on the
CCI and CPI come from different sources or combinations. As Knack (2006)
pointed out, composite indexes have no explicit definition, but instead are defined
by what goes into them. As a result, with the CCI and CPI, different observed values
reflect corruption under different definitions. Put another way, on the CCI and CPI,
different observed values represent or measure different objectives, although they
are all filed under the name ‘‘corruption’’ rather than the variance of corruption level
under a uniform definition. It is not appropriate to compare these values with each
272 Chin. Polit. Sci. Rev. (2016) 1:268–302
123
other because this cannot represent the true variance of corruption levels between
different countries.
For example, on CPI 2014, the number of sources used for different countries
varies from 3 to 9. Some country’s CPI scores come from only three sources, like
the Bahamas and North Korea while, for the United Arab Emirates and Belgium, as
many as seven sources are used for the aggregation of their scores. In the strictest
sense, scores using three sources are not comparable to those using seven as the
definitions of corruption behind the scores differ. In fact, the Bahama’s score of 71
and the score of 70 for the United Arab Emirates do not necessarily mean the
corruption level gap between the two countries is just one point. If we remove four
of the seven sources used for the score of the United Arab Emirates in order to make
its sources identical to those of the Bahamas, the corruption gap between the two
countries drastically jumps from 1 to 9 points on a 100-point indicator.
Even if the number of sources is the same for two different countries, their scores
still might not be comparable with each other. For example, Country X may use
Source A, Source B, and Source C, while Country Y may use Source B, Source C,
and Source D. The number of sources is equal, but the combinations are different. In
fact, there are as many as 64 different source combinations for the 175 observed
values on CPI 2014, each of which represents a unique definition of corruption. The
175 observed values on CPI 2014 should be divided into 64 different variables, each
of which covers a small number of countries.2
Moreover, as Treisman (2007) emphasized, since the sources used for the CCI
and CPI vary between different years, scores of different years also should not be
compared.3 It is not appropriate to construct a panel of data using data from the CCI
or CPI from different years.
In short, the scores on the CPI and CCI are neither comparable across countries
nor comparable over different years. Mixing these values as a single variable goes
against the basic principle that a variable should just reflect the variance of only one
object. In a relatively large sample comprised of these incomparable values from the
CCI or CPI, the true variation in corruption levels between different countries is
distorted to some extent. The main reason for the loss of comparability between
different observed values is the aggregation of so many different sources. Just as
Knack (2006) suggested, it is more appropriate to use data from a single source
rather than a composite indicator.
2.2 Measurement Bias
The perception-based measurement of corruption is very likely to be biased due to
the intrinsically subjective nature of perceptual assessment, which is highly
susceptible to being influenced by irrelevant factors. In the subjective evaluation
and comparison of corruption levels between different countries, whoever the
2 The combination with the maximum coverage of countries on CPI 2014 merely covers 16 countries.
There are 35 combinations each of which only covers one country, and the scores of these countries are
never comparable with any other scores or values on CPI 2014.3 Transparency International itself also emphasized on its website that ‘‘CPI scores before 2012 are not
comparable over time.’’ See http://www.transparency.org/cpi2014/in_detail#myAnchor7.
Chin. Polit. Sci. Rev. (2016) 1:268–302 273
123
respondent is (expert, businessperson, or ordinary person), he or she is supposed to
master the positive knowledge about the overall state of corruption in several
different countries. This is almost impossible. Although some of the respondents
may have had personal experiences with corrupt behavior, most of them can only
provide anecdotal evidence—merely a small part of the big picture. As a result,
when respondents were asked to evaluate the corruption level in one or several
countries, they had to appeal to these loose anecdotes for their evaluations rather
than appealing to systematic evidence of corrupt transactions occurring. The
anecdotes revolve around factors that the respondents themselves regard as related
to a country’s corruption level, and they tend to grade corruption levels based on the
existence or extent of these factors. For example, if someone believes that
democratic countries are less corrupt, he or she may well rate a democratic
country’s corruption level as low.
It seems quite arbitrary which factors respondents use as their reference for
corruption levels if we acknowledge that different people perceive corruption levels
from different perspectives. However, it is true that most of the respondents have
common perspectives.4 Some of them are right, which means the actual corruption
level is related to the factors considered by the respondents; while some of them are
wrong, which means the factors considered are not really associated with the actual
corruption level.5 When respondents view corruption levels from the wrong
perspectives, the resulting measurement reflects variations that are irrelevant but
nevertheless highly correlated with some other factors. These variations are just
systemic biases in the measurement of corruption levels, which are very common in
perception-based measurements of corruption.
Some previous studies have already shown the existence of such systemic biases
in perception-based measurements. Respondents’ perceptions are often susceptible
to irrelevant factors. For example, Razafindrakoto and Roubaud (2010) surveyed
350 experts in eight African countries on their opinions about the corruption levels
in these countries. The analysis found that these experts’ assessment of corruption
levels was ideologically biased. Experts as respondents who were in favor of the
withdrawal of state and liberalization significantly overestimated the extent of
corruption, and experts who felt there were too many civil servants more often over-
estimated the extent of corruption. Kurtz and Schrank (2007a) examined whether
government effectiveness, measured by one of the six perception-based Worldwide
Governance Indicators, is susceptible to recent economic performance, the result of
which has significant implications on the validity of perception-based measurement
of corruption.6 They found that a country’s government effectiveness could be well
4 For example, Kurtz and Schrank (2007a) argued that the Worldwide Governance Indicators, which are
all perception-based, are commonly susceptible to policy preference, cultural blinders and recent
economic growth.5 Even though the respondents capture the factors that are really associated with corruption level, it does
not necessarily mean they can give an accurate measurement since they cannot accurately predict to what
extent these factors are associated with corruption level, and there are many different factors to consider.6 Because both the control of corruption index (CCI) and the measurement of government effectiveness
come from the dataset of the Worldwide Governance Indicators, and they are both perception-based
indicators sharing very similar sources and methodologies of aggregation.
274 Chin. Polit. Sci. Rev. (2016) 1:268–302
123
predicted by the country’s recent GDP growth rate, even though theoretically
growth cannot have such an instantaneous effect on government effectiveness. The
reason is that the respondents unreasonably perceive countries growing fast as
countries governed well, which makes the perception-based measurement of
government effectiveness biased.
Perception-based measurements of corruption are also susceptible to sample
selection bias when the sample of respondents, whose assessments of corruption are
the primary sources, is not representative enough. Respondents included in the
sample may commonly overestimate or underestimate the corruption level in
specific countries. For example, as Kurtz and Schrank (2007a) argued:
They systematically censor the opinions of former investors who did not
succeed in the marketplace, or potential investors who were deterred from
entering local markets by pervasive malgovernance or corruption itself… By
contrast, investors who are competing successfully in the marketplace, and
therefore show up in the surveys, may be doing so precisely because they are
the beneficiaries of corruption and cronyism—and are therefore, unlikely to
report it accurately. And where malgovernance is effectively reported, this
may well be because it is not pervasive enough to create sufficiently strong
distortions in firm-level survival or investor behavior to induce selection bias.
Following the example of Kurtz and Schrank’s work (2007a), I try to empirically
examine whether CCI and CPI suffer the irrelevant factor bias and the sample
selection bias. First, I hypothesize that, like the perception-based measurement of
government effectiveness, CCI and CPI are also contaminated by respondents’
perception of recent economic growth, which does not have an instantaneous effect
on corruption level. Second, I hypothesize that the measurement of corruption levels
on CCI and CPI are affected by survey respondents’ country-background
distribution, which is a result of sample selection. As Andersson and Heywood
(2009) pointed out, the survey respondents of these indicators are mainly Western
business leaders and experts who do not evenly distribute in all countries covered by
the indicators. When international businesspeople were asked to compare the
corruption levels of their investment destinations and their home countries, they
tended to exaggerate the gap of corruption levels between the two countries, since
the two countries do not have equal opportunities to be observed. The business-
people have more chances to observe or even engage in corrupt transactions in their
investment destinations compared with their home countries, which leads to
underestimation of the home countries’ corruption level, or overestimation of the
investment destinations’ corruption level. The more likely businesspersons from a
certain country are chosen as survey respondents, the relatively better this country is
evaluated on corruption level. Obviously, this makes the measurement of corruption
biased.
Chin. Polit. Sci. Rev. (2016) 1:268–302 275
123
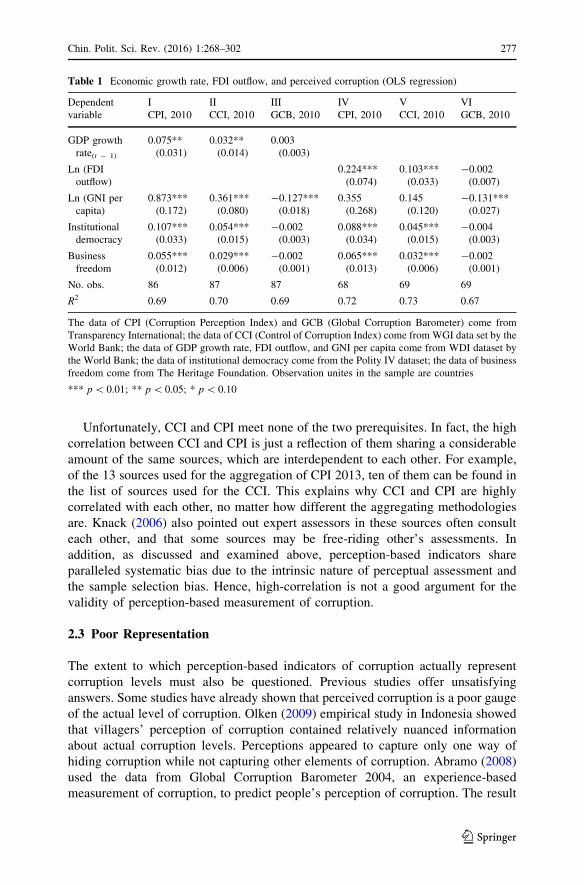
I regress CCI and CPI, respectively, on recent GDP growth rates and FDI
outflows7 with income level, regime type and economic freedom being controlled.
For comparison, I also regress an experienced-based indicator of corruption from
Global Corruption Barometer (GCB) on these variables.8 The results in Table 1
show the recent GDP growth rate is a significant predictor of both CCI and CPI,
while the coefficient of recent GDP growth rate is not significantly different from
zero when the dependent variable becomes the experience-based indicator of
corruption. It can be explained that respondents commonly take the recent economic
situations as reference when they are asked to rate a country’s corruption level
although it is quite spurious to infer that the two factors have a causal relationship
with each other. It can be argued that corruption can affect economic growth as
reversed to the previous hypotheses, which means recent economic growth and
corruption can be reasonably correlated in the manner that corruption has an effect
on recent economic growth. Specifically, a clean government leads to high
economic growth. However, the causal relationship between corruption level and
economic growth is not as simple as of being presented in Table 1 if such a causal
relationship exists at all. The relationship between corruption and growth always
depends on some other factors as well as the type of corruption, and it is possible
that specific types of corruption can lead to economic growth under specific
circumstances. In fact, a linear association between corruption level and recent
economic growth is not true in either direction.
Similarly, FDI outflow is significant of both CCI and CPI, but not for the
experienced-based indicator. It proves that the selection bias of respondents in the
surveys, which CCI and CPI are derived from, substantially bias the result of the
measurement.
Some researchers tried to validate the perception-based measurements of
corruption in a correlative manner (see Wilhelm 2002). They argued that
perception-based indicators are highly correlated with each other, which suggests
that these indicators have captured the common objective despite the different
sources and methodologies they came from (Treisman 2000). However, there are as
least two prerequisites for the inference that high correlation is an accurate signal of
measurement validity. First, the sources of the two indicators must be independent
of each other. In principle, they should not share the same sources. Second, the
measurement errors of these indicators are supposed to be random. High correlation
cannot support validity if measurement errors of the two indicators are systematic,
since the errors could be correlated.
7 Since the data of survey respondents’ background distribution is not available, I find a proxy for it,
which is the foreign direct investment (FDI) outflow. When a country (Country A, for example) has more
FDI outflow, there are more businesspersons from Country A investing to other countries, hence
international businesspersons from Country A have more chances to be selected and surveyed, and survey
respondents’ backgrounds have a higher probability of being Country A. While in other countries where
there are less FDI outflows, businessmen from these countries have less chance to be surveyed. According
to previous hypothesis, the corruption level of countries like Country A is more likely to be
underestimated on CCI and CPI.8 This experienced-based measurement of corruption will be introduced in details in the fourth section.
276 Chin. Polit. Sci. Rev. (2016) 1:268–302
123
Unfortunately, CCI and CPI meet none of the two prerequisites. In fact, the high
correlation between CCI and CPI is just a reflection of them sharing a considerable
amount of the same sources, which are interdependent to each other. For example,
of the 13 sources used for the aggregation of CPI 2013, ten of them can be found in
the list of sources used for the CCI. This explains why CCI and CPI are highly
correlated with each other, no matter how different the aggregating methodologies
are. Knack (2006) also pointed out expert assessors in these sources often consult
each other, and that some sources may be free-riding other’s assessments. In
addition, as discussed and examined above, perception-based indicators share
paralleled systematic bias due to the intrinsic nature of perceptual assessment and
the sample selection bias. Hence, high-correlation is not a good argument for the
validity of perception-based measurement of corruption.
2.3 Poor Representation
The extent to which perception-based indicators of corruption actually represent
corruption levels must also be questioned. Previous studies offer unsatisfying
answers. Some studies have already shown that perceived corruption is a poor gauge
of the actual level of corruption. Olken (2009) empirical study in Indonesia showed
that villagers’ perception of corruption contained relatively nuanced information
about actual corruption levels. Perceptions appeared to capture only one way of
hiding corruption while not capturing other elements of corruption. Abramo (2008)
used the data from Global Corruption Barometer 2004, an experience-based
measurement of corruption, to predict people’s perception of corruption. The result
Table 1 Economic growth rate, FDI outflow, and perceived corruption (OLS regression)
Dependent
variable
I II III IV V VI
CPI, 2010 CCI, 2010 GCB, 2010 CPI, 2010 CCI, 2010 GCB, 2010
GDP growth
rate(t - 1)
0.075**
(0.031)
0.032**
(0.014)
0.003
(0.003)
Ln (FDI
outflow)
0.224***
(0.074)
0.103***
(0.033)
-0.002
(0.007)
Ln (GNI per
capita)
0.873***
(0.172)
0.361***
(0.080)
-0.127***
(0.018)
0.355
(0.268)
0.145
(0.120)
-0.131***
(0.027)
Institutional
democracy
0.107***
(0.033)
0.054***
(0.015)
-0.002
(0.003)
0.088***
(0.034)
0.045***
(0.015)
-0.004
(0.003)
Business
freedom
0.055***
(0.012)
0.029***
(0.006)
-0.002
(0.001)
0.065***
(0.013)
0.032***
(0.006)
-0.002
(0.001)
No. obs. 86 87 87 68 69 69
R2 0.69 0.70 0.69 0.72 0.73 0.67
The data of CPI (Corruption Perception Index) and GCB (Global Corruption Barometer) come from
Transparency International; the data of CCI (Control of Corruption Index) come from WGI data set by the
World Bank; the data of GDP growth rate, FDI outflow, and GNI per capita come from WDI dataset by
the World Bank; the data of institutional democracy come from the Polity IV dataset; the data of business
freedom come from The Heritage Foundation. Observation unites in the sample are countries
*** p\ 0.01; ** p\ 0.05; * p\ 0.10
Chin. Polit. Sci. Rev. (2016) 1:268–302 277
123
also showed that perceived corruption was not a good predictor of experienced
corruption. Those who had experienced corruption did not report a significantly
higher perception of corruption than those who had not, and the relationship
between corruption experience and corruption perception varied between rich and
poor countries.
The correlations between perception-based indicators of corruption and experi-
ence-based indicators of corruption are also consistent with these findings. For
example, the coefficient of correlation between CCI 2010 and CPI 2010 is 0.99, but
they are not highly correlated with the experience-based data from GCB 2010, since
the coefficients are just 0.67 and 0.65. A coefficient above 0.6 indicates a strong
correlation between two independent variables, but not for two indicators trying to
measure the same objective.9 It is true that a subjective indicator and an objective
indicator can define corruption in distinguishable ways. The bribery rate of GCB
data is more of a reflection of the extent of administrative corruption while
subjective indicators, like CCI, as the World Bank claims, also aim to take state
capture into consideration when producing the indicator. However, the truth is
subjective indicators like CCI exhibit no substantial advantage in measuring state
capture compared with objective indicators. Using a democracy indicator as a proxy
for state capture, I found that correlation between CCI and the democracy indicator
was 0.47, and correlation between GCB and the democracy indicator was 0.43.
Subjective indicators and objective indicators predict state capture to similar extent,
and neither of them gauges state capture effectively. Hence, at least we can say the
substantial difference between subjective indicators and objective indicators is not
likely the result of different definitions of corruption between them.
Since perceived corruption is a poor gauge of corruption reality, the results of
regressions using perception-based indicators of corruption as dependent variables
could be rather misleading when these indicators are regarded as measurements of
corruption reality. Olken (2009) study shows that the same factors can affect
corruption perception and corruption reality very differently. For example, ethnic
heterogeneity is associated with higher level of perceived corruption, while this
association became negative when perceived corruption is replaced by the actual
level of corruption.
It can be shrewdly argued that perceived corruption and corruption reality are
essentially two different things. In other words, perception is perception, which is
important no matter how far away it deviates from the corruption realities, and one
should not evaluate the perceived corruption indicators using experience-based
measurements as a benchmark. Nevertheless, if the perception-based indicators do
not intend to capture the reality of corruption, what is the value of these indicators?
Why should we regress them on the factors that are theoretically related to
corruption activities? It should be noted that what we want to know is the actual
9 It could be argued that the CCI and CPI define corruption differently from what GCB defines as
corruption, which explains why they are not highly correlated with GCB. However, it is odd that the CCI
and CPI happen to define corruption so similarly while both define corruption so differently from the
GCB. Actually, these similarities and differences are determined by methodology rather than definition.
Neither the CPI nor CCI has an explicit definition on what they are measuring, since they aggregated so
many different sources.
278 Chin. Polit. Sci. Rev. (2016) 1:268–302
123
occurrence of corruption rather than some hint of it. To achieve this, researchers
should gauge it as accurately as possible. Unfortunately, usually we mistake
perceived corruption for corruption reality and pretend that it is not a mistake
needing to be corrected.
3 Theoretical Uncertainty
In this section, the theoretical uncertainties of the causal inference that cultural
traditions have effects on a country’s corruption level are discussed. Previous
studies commonly presumed that some kinds of cultural traditions can shape specific
social values or policy preferences that disincentivize corruption. However, I find
the proposed social values or policy preferences often exhibit no significant
difference between countries belonging to different categories of cultural traditions,
or the difference of social values is not the result of cultural traditions, which means
the proposed ‘‘effects’’ of cultural traditions on corruption may not be valid.
A country’s attributes, called ‘‘cultural traditions’’ in this paper, are defined as a
history of that country being dominated by a specific political structure (example:
British colonial rule and democratic rule) or value system (example: Protestantism)
that was in sharp contrast to those of other countries. In other words, cultural
tradition is a country’s fixed character that rarely changes over time. The
relationship between cultural factors and economic development has long been a
popular research topic since the publication of Max Weber’s The Protestant Ethic
and the Spirit of Capitalism, which inspired scholars to focus on the importance of
culture in the development of a society. Scholars who focus on the determinants of
corruption have also taken cultural factors into consideration. La Porta et al. (1999)
contributed an original work on this line of research. Their cross-national study
found countries that were ethno-linguistically heterogeneous, used French or
socialist laws, or had high proportions of Catholics or Muslims in the population
exhibited inferior governmental performance. Then a sophisticated comparative
study on the causes of corruption by Treisman (2000) extensively examined the
relationships between different cultural traditions and corruption. He found that
countries with Protestant traditions, histories of British rule, and long exposure to
democracy were less corrupt. Subsequently, Pellegrini and Gerlagh (2008)
reaffirmed that a medium-long exposure to uninterrupted democracy was associated
with lower corruption levels. Mensah (2014) also found that religious traditions as
well as national cultural differences had significant effects on perceived levels of
corruption.
In the following parts of this section, I will re-examine the theoretical plausibility
of these propositions, including the proposed causal relationships between
corruption and the British colonial tradition, religious traditions, legal traditions,
as well as democratic tradition. Evidence of theoretical uncertainties between
corruption and these cultural traditions is presented.
Chin. Polit. Sci. Rev. (2016) 1:268–302 279
123
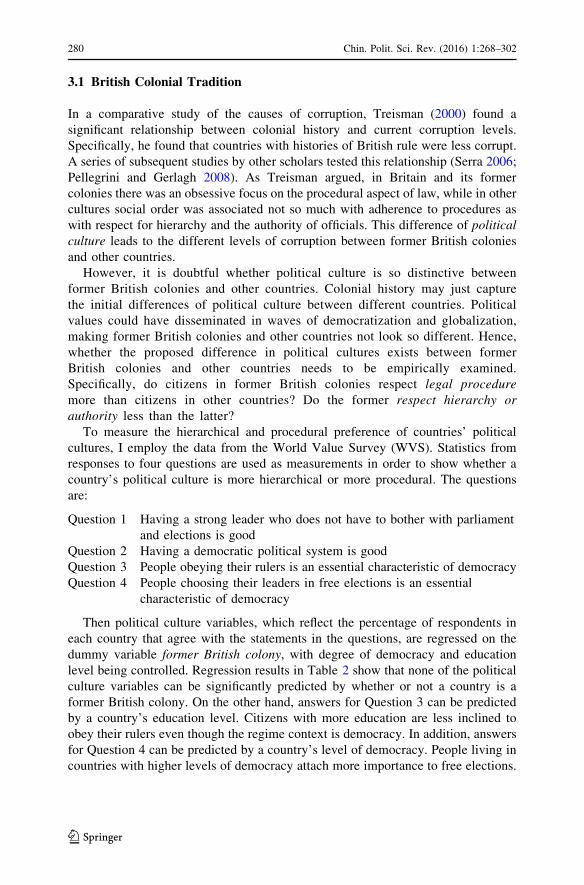
3.1 British Colonial Tradition
In a comparative study of the causes of corruption, Treisman (2000) found a
significant relationship between colonial history and current corruption levels.
Specifically, he found that countries with histories of British rule were less corrupt.
A series of subsequent studies by other scholars tested this relationship (Serra 2006;
Pellegrini and Gerlagh 2008). As Treisman argued, in Britain and its former
colonies there was an obsessive focus on the procedural aspect of law, while in other
cultures social order was associated not so much with adherence to procedures as
with respect for hierarchy and the authority of officials. This difference of political
culture leads to the different levels of corruption between former British colonies
and other countries.
However, it is doubtful whether political culture is so distinctive between
former British colonies and other countries. Colonial history may just capture
the initial differences of political culture between different countries. Political
values could have disseminated in waves of democratization and globalization,
making former British colonies and other countries not look so different. Hence,
whether the proposed difference in political cultures exists between former
British colonies and other countries needs to be empirically examined.
Specifically, do citizens in former British colonies respect legal procedure
more than citizens in other countries? Do the former respect hierarchy or
authority less than the latter?
To measure the hierarchical and procedural preference of countries’ political
cultures, I employ the data from the World Value Survey (WVS). Statistics from
responses to four questions are used as measurements in order to show whether a
country’s political culture is more hierarchical or more procedural. The questions
are:
Question 1 Having a strong leader who does not have to bother with parliament
and elections is good
Question 2 Having a democratic political system is good
Question 3 People obeying their rulers is an essential characteristic of democracy
Question 4 People choosing their leaders in free elections is an essential
characteristic of democracy
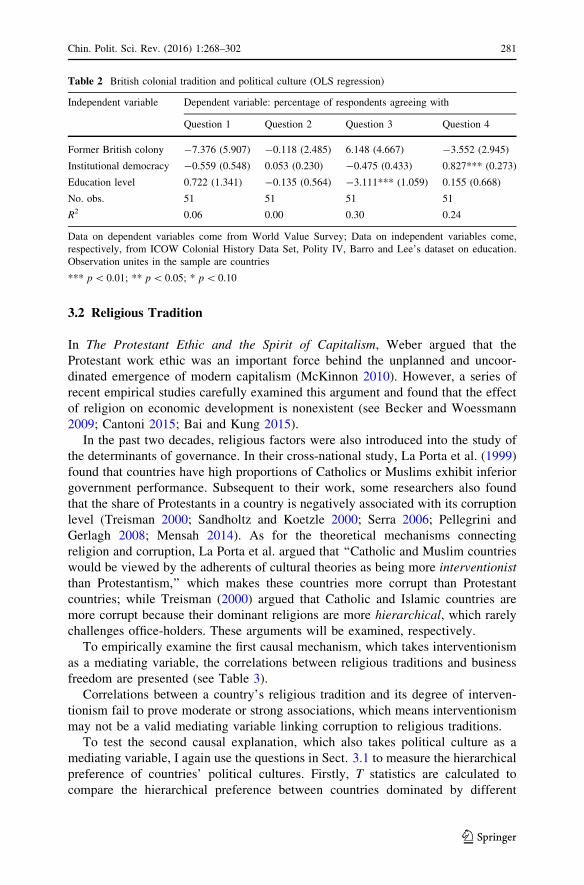
Then political culture variables, which reflect the percentage of respondents in
each country that agree with the statements in the questions, are regressed on the
dummy variable former British colony, with degree of democracy and education
level being controlled. Regression results in Table 2 show that none of the political
culture variables can be significantly predicted by whether or not a country is a
former British colony. On the other hand, answers for Question 3 can be predicted
by a country’s education level. Citizens with more education are less inclined to
obey their rulers even though the regime context is democracy. In addition, answers
for Question 4 can be predicted by a country’s level of democracy. People living in
countries with higher levels of democracy attach more importance to free elections.
280 Chin. Polit. Sci. Rev. (2016) 1:268–302
123
3.2 Religious Tradition
In The Protestant Ethic and the Spirit of Capitalism, Weber argued that the
Protestant work ethic was an important force behind the unplanned and uncoor-
dinated emergence of modern capitalism (McKinnon 2010). However, a series of
recent empirical studies carefully examined this argument and found that the effect
of religion on economic development is nonexistent (see Becker and Woessmann
2009; Cantoni 2015; Bai and Kung 2015).
In the past two decades, religious factors were also introduced into the study of
the determinants of governance. In their cross-national study, La Porta et al. (1999)
found that countries have high proportions of Catholics or Muslims exhibit inferior
government performance. Subsequent to their work, some researchers also found
that the share of Protestants in a country is negatively associated with its corruption
level (Treisman 2000; Sandholtz and Koetzle 2000; Serra 2006; Pellegrini and
Gerlagh 2008; Mensah 2014). As for the theoretical mechanisms connecting
religion and corruption, La Porta et al. argued that ‘‘Catholic and Muslim countries
would be viewed by the adherents of cultural theories as being more interventionist
than Protestantism,’’ which makes these countries more corrupt than Protestant
countries; while Treisman (2000) argued that Catholic and Islamic countries are
more corrupt because their dominant religions are more hierarchical, which rarely
challenges office-holders. These arguments will be examined, respectively.
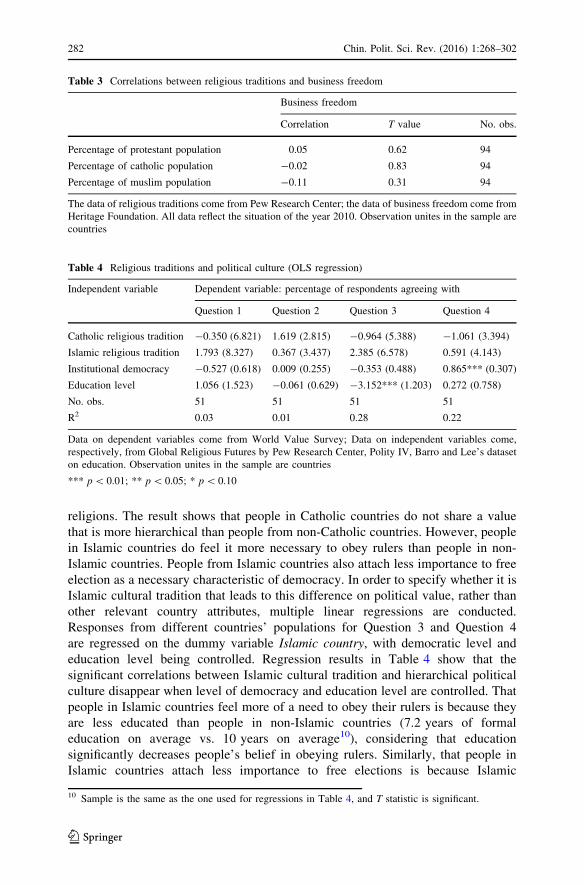
To empirically examine the first causal mechanism, which takes interventionism
as a mediating variable, the correlations between religious traditions and business
freedom are presented (see Table 3).
Correlations between a country’s religious tradition and its degree of interven-
tionism fail to prove moderate or strong associations, which means interventionism
may not be a valid mediating variable linking corruption to religious traditions.
To test the second causal explanation, which also takes political culture as a
mediating variable, I again use the questions in Sect. 3.1 to measure the hierarchical
preference of countries’ political cultures. Firstly, T statistics are calculated to
compare the hierarchical preference between countries dominated by different
Table 2 British colonial tradition and political culture (OLS regression)
Independent variable Dependent variable: percentage of respondents agreeing with
Question 1 Question 2 Question 3 Question 4
Former British colony -7.376 (5.907) -0.118 (2.485) 6.148 (4.667) -3.552 (2.945)
Institutional democracy -0.559 (0.548) 0.053 (0.230) -0.475 (0.433) 0.827*** (0.273)
Education level 0.722 (1.341) -0.135 (0.564) -3.111*** (1.059) 0.155 (0.668)
No. obs. 51 51 51 51
R2 0.06 0.00 0.30 0.24
Data on dependent variables come from World Value Survey; Data on independent variables come,
respectively, from ICOW Colonial History Data Set, Polity IV, Barro and Lee’s dataset on education.
Observation unites in the sample are countries
*** p\ 0.01; ** p\ 0.05; * p\ 0.10
Chin. Polit. Sci. Rev. (2016) 1:268–302 281
123
religions. The result shows that people in Catholic countries do not share a value
that is more hierarchical than people from non-Catholic countries. However, people
in Islamic countries do feel it more necessary to obey rulers than people in non-
Islamic countries. People from Islamic countries also attach less importance to free
election as a necessary characteristic of democracy. In order to specify whether it is
Islamic cultural tradition that leads to this difference on political value, rather than
other relevant country attributes, multiple linear regressions are conducted.
Responses from different countries’ populations for Question 3 and Question 4
are regressed on the dummy variable Islamic country, with democratic level and
education level being controlled. Regression results in Table 4 show that the
significant correlations between Islamic cultural tradition and hierarchical political
culture disappear when level of democracy and education level are controlled. That
people in Islamic countries feel more of a need to obey their rulers is because they
are less educated than people in non-Islamic countries (7.2 years of formal
education on average vs. 10 years on average10), considering that education
significantly decreases people’s belief in obeying rulers. Similarly, that people in
Islamic countries attach less importance to free elections is because Islamic
Table 3 Correlations between religious traditions and business freedom
Business freedom
Correlation T value No. obs.
Percentage of protestant population 0.05 0.62 94
Percentage of catholic population -0.02 0.83 94
Percentage of muslim population -0.11 0.31 94
The data of religious traditions come from Pew Research Center; the data of business freedom come from
Heritage Foundation. All data reflect the situation of the year 2010. Observation unites in the sample are
countries
Table 4 Religious traditions and political culture (OLS regression)
Independent variable Dependent variable: percentage of respondents agreeing with
Question 1 Question 2 Question 3 Question 4
Catholic religious tradition -0.350 (6.821) 1.619 (2.815) -0.964 (5.388) -1.061 (3.394)
Islamic religious tradition 1.793 (8.327) 0.367 (3.437) 2.385 (6.578) 0.591 (4.143)
Institutional democracy -0.527 (0.618) 0.009 (0.255) -0.353 (0.488) 0.865*** (0.307)
Education level 1.056 (1.523) -0.061 (0.629) -3.152*** (1.203) 0.272 (0.758)
No. obs. 51 51 51 51
R2 0.03 0.01 0.28 0.22
Data on dependent variables come from World Value Survey; Data on independent variables come,
respectively, from Global Religious Futures by Pew Research Center, Polity IV, Barro and Lee’s dataset
on education. Observation unites in the sample are countries
*** p\ 0.01; ** p\ 0.05; * p\ 0.10
10 Sample is the same as the one used for regressions in Table 4, and T statistic is significant.
282 Chin. Polit. Sci. Rev. (2016) 1:268–302
123
countries are commonly much more autocratic that non-Islamic countries (0.2 on
Polity score vs. 7.1 on Polity score11), considering that democratic regimes
significantly increase people’s identification with free election. Hence, the
observation that Islamic countries have a more hierarchical political culture is not
a causal inference, but rather the result of a coincidence between Islamic cultural
tradition and other country attributes. In addition, the association between Catholic
religious tradition and hierarchical preference is not significant either in multiple
regressions. Hence, I would argue that the proposed causal mechanisms linking
corruption to Catholicism or Islamism are not valid.
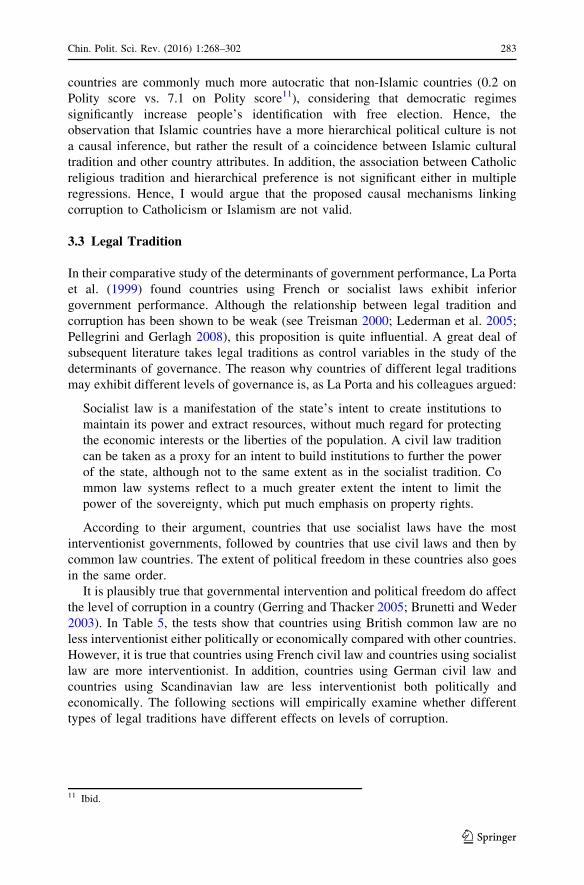
3.3 Legal Tradition
In their comparative study of the determinants of government performance, La Porta
et al. (1999) found countries using French or socialist laws exhibit inferior
government performance. Although the relationship between legal tradition and
corruption has been shown to be weak (see Treisman 2000; Lederman et al. 2005;
Pellegrini and Gerlagh 2008), this proposition is quite influential. A great deal of
subsequent literature takes legal traditions as control variables in the study of the
determinants of governance. The reason why countries of different legal traditions
may exhibit different levels of governance is, as La Porta and his colleagues argued:
Socialist law is a manifestation of the state’s intent to create institutions to
maintain its power and extract resources, without much regard for protecting
the economic interests or the liberties of the population. A civil law tradition
can be taken as a proxy for an intent to build institutions to further the power
of the state, although not to the same extent as in the socialist tradition. Co
mmon law systems reflect to a much greater extent the intent to limit the
power of the sovereignty, which put much emphasis on property rights.
According to their argument, countries that use socialist laws have the most
interventionist governments, followed by countries that use civil laws and then by
common law countries. The extent of political freedom in these countries also goes
in the same order.
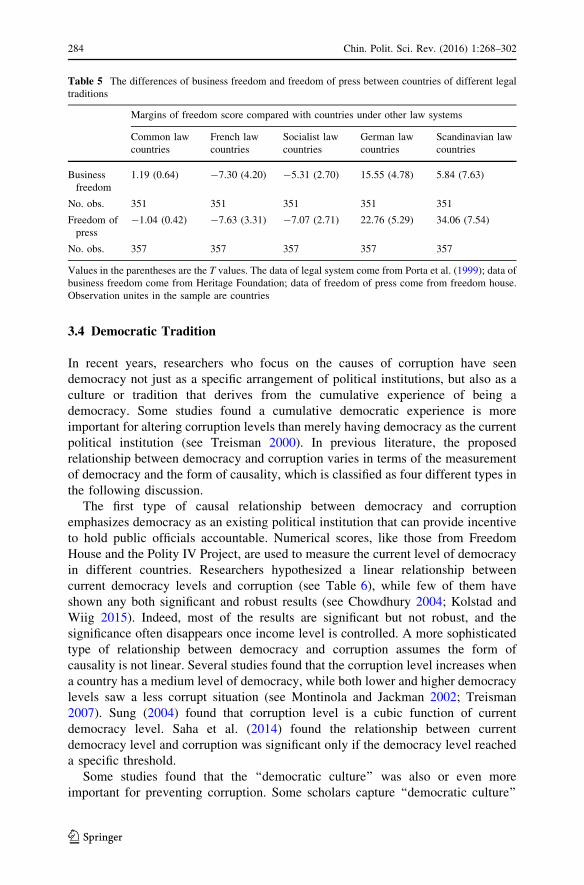
It is plausibly true that governmental intervention and political freedom do affect
the level of corruption in a country (Gerring and Thacker 2005; Brunetti and Weder
2003). In Table 5, the tests show that countries using British common law are no
less interventionist either politically or economically compared with other countries.
However, it is true that countries using French civil law and countries using socialist
law are more interventionist. In addition, countries using German civil law and
countries using Scandinavian law are less interventionist both politically and
economically. The following sections will empirically examine whether different
types of legal traditions have different effects on levels of corruption.
11 Ibid.
Chin. Polit. Sci. Rev. (2016) 1:268–302 283
123
3.4 Democratic Tradition
In recent years, researchers who focus on the causes of corruption have seen
democracy not just as a specific arrangement of political institutions, but also as a
culture or tradition that derives from the cumulative experience of being a
democracy. Some studies found a cumulative democratic experience is more
important for altering corruption levels than merely having democracy as the current
political institution (see Treisman 2000). In previous literature, the proposed
relationship between democracy and corruption varies in terms of the measurement
of democracy and the form of causality, which is classified as four different types in
the following discussion.
The first type of causal relationship between democracy and corruption
emphasizes democracy as an existing political institution that can provide incentive
to hold public officials accountable. Numerical scores, like those from Freedom
House and the Polity IV Project, are used to measure the current level of democracy
in different countries. Researchers hypothesized a linear relationship between
current democracy levels and corruption (see Table 6), while few of them have
shown any both significant and robust results (see Chowdhury 2004; Kolstad and
Wiig 2015). Indeed, most of the results are significant but not robust, and the
significance often disappears once income level is controlled. A more sophisticated
type of relationship between democracy and corruption assumes the form of
causality is not linear. Several studies found that the corruption level increases when
a country has a medium level of democracy, while both lower and higher democracy
levels saw a less corrupt situation (see Montinola and Jackman 2002; Treisman
2007). Sung (2004) found that corruption level is a cubic function of current
democracy level. Saha et al. (2014) found the relationship between current
democracy level and corruption was significant only if the democracy level reached
a specific threshold.
Some studies found that the ‘‘democratic culture’’ was also or even more
important for preventing corruption. Some scholars capture ‘‘democratic culture’’
Table 5 The differences of business freedom and freedom of press between countries of different legal
traditions
Margins of freedom score compared with countries under other law systems
Common law
countries
French law
countries
Socialist law
countries
German law
countries
Scandinavian law
countries
Business
freedom
1.19 (0.64) -7.30 (4.20) -5.31 (2.70) 15.55 (4.78) 5.84 (7.63)
No. obs. 351 351 351 351 351
Freedom of
press
-1.04 (0.42) -7.63 (3.31) -7.07 (2.71) 22.76 (5.29) 34.06 (7.54)
No. obs. 357 357 357 357 357
Values in the parentheses are the T values. The data of legal system come from Porta et al. (1999); data of
business freedom come from Heritage Foundation; data of freedom of press come from freedom house.
Observation unites in the sample are countries
284 Chin. Polit. Sci. Rev. (2016) 1:268–302
123
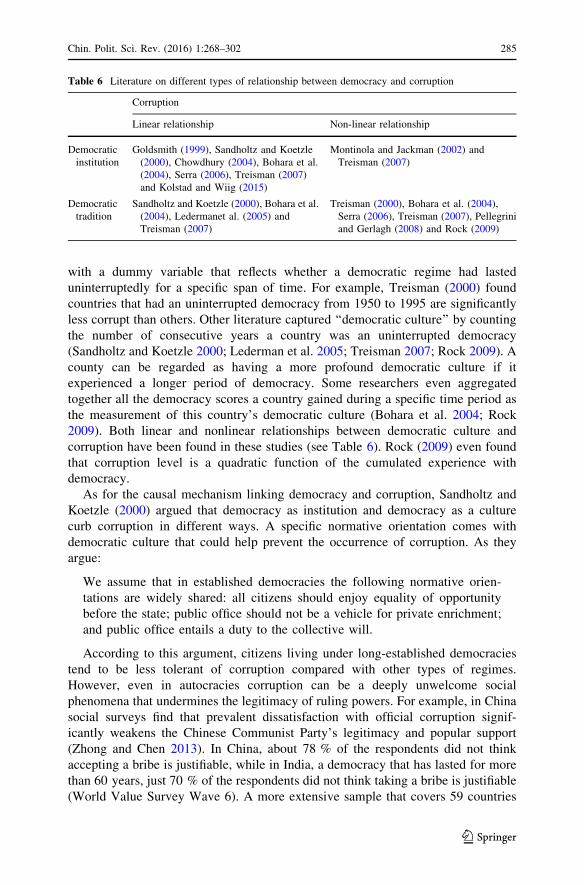
with a dummy variable that reflects whether a democratic regime had lasted
uninterruptedly for a specific span of time. For example, Treisman (2000) found
countries that had an uninterrupted democracy from 1950 to 1995 are significantly
less corrupt than others. Other literature captured ‘‘democratic culture’’ by counting
the number of consecutive years a country was an uninterrupted democracy
(Sandholtz and Koetzle 2000; Lederman et al. 2005; Treisman 2007; Rock 2009). A
county can be regarded as having a more profound democratic culture if it
experienced a longer period of democracy. Some researchers even aggregated
together all the democracy scores a country gained during a specific time period as
the measurement of this country’s democratic culture (Bohara et al. 2004; Rock
2009). Both linear and nonlinear relationships between democratic culture and
corruption have been found in these studies (see Table 6). Rock (2009) even found
that corruption level is a quadratic function of the cumulated experience with
democracy.
As for the causal mechanism linking democracy and corruption, Sandholtz and
Koetzle (2000) argued that democracy as institution and democracy as a culture
curb corruption in different ways. A specific normative orientation comes with
democratic culture that could help prevent the occurrence of corruption. As they
argue:
We assume that in established democracies the following normative orien-
tations are widely shared: all citizens should enjoy equality of opportunity
before the state; public office should not be a vehicle for private enrichment;
and public office entails a duty to the collective will.
According to this argument, citizens living under long-established democracies
tend to be less tolerant of corruption compared with other types of regimes.
However, even in autocracies corruption can be a deeply unwelcome social
phenomena that undermines the legitimacy of ruling powers. For example, in China
social surveys find that prevalent dissatisfaction with official corruption signif-
icantly weakens the Chinese Communist Party’s legitimacy and popular support
(Zhong and Chen 2013). In China, about 78 % of the respondents did not think
accepting a bribe is justifiable, while in India, a democracy that has lasted for more
than 60 years, just 70 % of the respondents did not think taking a bribe is justifiable
(World Value Survey Wave 6). A more extensive sample that covers 59 countries
Table 6 Literature on different types of relationship between democracy and corruption
Corruption
Linear relationship Non-linear relationship
Democratic
institution
Goldsmith (1999), Sandholtz and Koetzle
(2000), Chowdhury (2004), Bohara et al.
(2004), Serra (2006), Treisman (2007)
and Kolstad and Wiig (2015)
Montinola and Jackman (2002) and
Treisman (2007)
Democratic
tradition
Sandholtz and Koetzle (2000), Bohara et al.
(2004), Ledermanet al. (2005) and
Treisman (2007)
Treisman (2000), Bohara et al. (2004),
Serra (2006), Treisman (2007), Pellegrini
and Gerlagh (2008) and Rock (2009)
Chin. Polit. Sci. Rev. (2016) 1:268–302 285
123
from the World Value Survey also shows that tolerance to corruption, which is
measured by the percentage of respondents who think accepting a bribe is
justifiable, is almost the same between long-established democracies and other types
of regimes. In most countries people are conformably intolerant to corruption.
Since long-established democracies exhibit no unique and superior social norm
that could help deter corruption, a democratic tradition could have no effect on
corruption. The most untarnished countries in the world are often those with a long
tradition of democracy, while at the same time they are commonly more politically
stable, with higher incomes, higher educational attainment, and less interventionism
in their markets, all of which contribute to the prevention of corruption. The
apparent association between democratic tradition and corruption may just reflect
the effects of the other factors on corruption, rather than the effect of democratic
experience itself.
3.5 Cultural Factors Versus Other Factors
Previous discussions try to demonstrate that the causal mechanisms linking
corruption to colonial traditions, religious traditions, legal traditions, and demo-
cratic traditions are not as valid as expected because social values and public policy
can be independent from these traditions. Most assumptions that people from
different cultures are fundamentally divided on political values or public policy are
just stereotypes, for example, the belief that Islamic countries are more in favor of
interventionism. Although specific social values are sometimes different between
countries of different cultural traditions, it is not the cultural tradition but rather the
difference of institution and development that leads to the distinction, as shown
previously in this paper. Even if cultural background does have effects on people’s
acceptance of corruption, this effect is very unstable. For example, experiments
done by Barr and Serra (2010) found that participants’ cultural background was not
a robust predictor of their propensities to engage in bribery, and individuals’ norms,
values and beliefs relating to corruption may change following a change in context.
It could be inferred that, even if countries of different cultural traditions have
different social norms initially, the norms could change as the political and
economic context changes. It is inappropriate to conclude that social norms are fixed
with cultural traditions.
The evidence has shown that cultural traditions may not be effective explanatory
factors of corruption. On the other hand, institutional and economic factors still
account for much of the variance in corruption level between different countries.
The cultural explanations of corruption indicate that some countries are born to be
corrupt or clean in their governments, while many cases have shown that the
corruption situation in a country could exhibit remarkable change following
institutional change and economic change. For example, the United States, whose
government is among the cleanest in the world today, used to be no less corrupt than
most of today’s transitional economies and developing regions in its early stage of
modernization (Glaeser and Goldin 2007). Asian countries like Japan, South Korea,
and Taiwan all experienced a transition from corrupt to clean following their
economic takeoff and institutional change. The cities of Hong Kong and Singapore
286 Chin. Polit. Sci. Rev. (2016) 1:268–302
123
took just two decades to transform themselves from being among the most corrupt
governments to the global model of the construction of a clean government. In all
these cases, social and economic development, as well as institutional improvement
played crucial roles in the process of corruption prevention.
Previous cross-national quantitative studies have repeatedly tested the relation-
ships between various kinds of institutional and economic factors and corruption
level, although many of them are based on the problematic measurement of
corruption. Since the main focus of this study is to demonstrate the misleading
results of using perception-based measurements to study the determinants of
corruption rather than substantiating the causal relationships between institutional or
economic factors and corruption, this paper will not highlight the latter part. The
causal mechanisms of such relationships were well discussed in previous literature,
while further studies on these relationships should be careful about the proposed
theory. Most of the literature still hypothesizes each factor is associated with
corruption level independently and in a linear way, which cannot be substantiated as
fact.
4 Estimation Strategy
Previous discussions have demonstrated that the causal linkages between cultural
traditions and corruption are not theoretically valid. At the same time, perception-
based indicators of corruption, which are often found effectively predicted by
various kinds of cultural tradition variables, are proven to be systematically biased.
In light of this, I hypothesize that the apparent associations between cultural
traditions and corruption are not causal inference but an artifact of the systematic
measurement bias on the dependent variable. In other words, cultural tradition
variables are correlated with measurement bias on perception-based indicators,
rather than on corruption level itself.
The main strategy of the empirical examination is to find some measurement of
corruption that can avoid the weaknesses, especially the measurement bias, that the
CPI and CCI suffer, and regress it with the cultural tradition variables discussed
above. If the associations are still significant, the causal effects may stand; while if
the associations become insignificant, the causal effects of cultural traditions on
corruption are spurious. For comparison, CCI and CPI are also regressed on the
cultural tradition variables.
4.1 The Alternative Measurement
In this section, I will take advantage of an experience-based measurement of
corruption with data from Transparency International’s (TI) Global Corruption
Barometer (GCB), to test the main argument of this paper. Although it also comes
from TI, the source and methodology of this measurement are very different from
those of CPI. In the survey of GCB, there is a question that asks: ‘‘In the past
12 months, have you or anyone living in your household paid a bribe in any form?’’
From the statistical results, we can acquire the data of the percentage of respondents
Chin. Polit. Sci. Rev. (2016) 1:268–302 287
123
who reported paying a bribe in each country, and this occurrence rate of bribery is a
good reflection of a country’s corruption level.
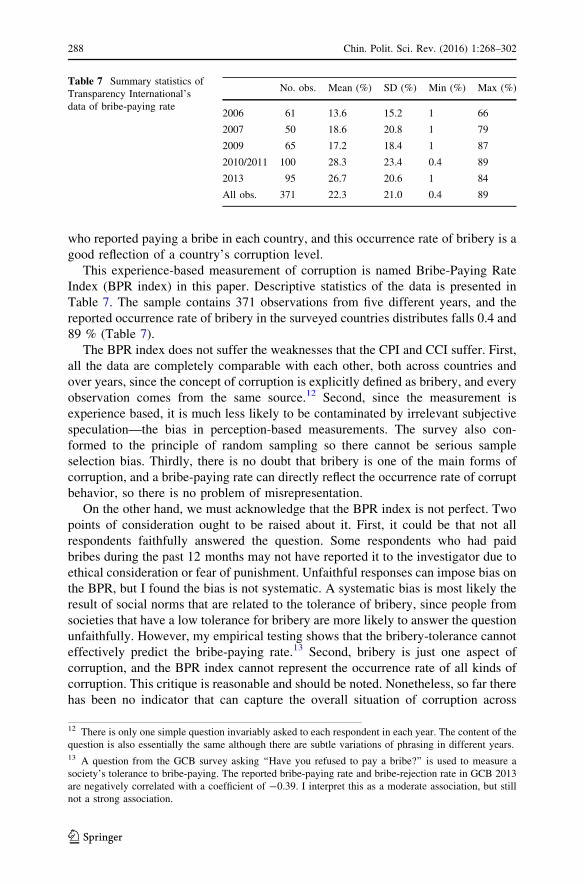
This experience-based measurement of corruption is named Bribe-Paying Rate
Index (BPR index) in this paper. Descriptive statistics of the data is presented in
Table 7. The sample contains 371 observations from five different years, and the
reported occurrence rate of bribery in the surveyed countries distributes falls 0.4 and
89 % (Table 7).
The BPR index does not suffer the weaknesses that the CPI and CCI suffer. First,
all the data are completely comparable with each other, both across countries and
over years, since the concept of corruption is explicitly defined as bribery, and every
observation comes from the same source.12 Second, since the measurement is
experience based, it is much less likely to be contaminated by irrelevant subjective
speculation—the bias in perception-based measurements. The survey also con-
formed to the principle of random sampling so there cannot be serious sample
selection bias. Thirdly, there is no doubt that bribery is one of the main forms of
corruption, and a bribe-paying rate can directly reflect the occurrence rate of corrupt
behavior, so there is no problem of misrepresentation.
On the other hand, we must acknowledge that the BPR index is not perfect. Two
points of consideration ought to be raised about it. First, it could be that not all
respondents faithfully answered the question. Some respondents who had paid
bribes during the past 12 months may not have reported it to the investigator due to
ethical consideration or fear of punishment. Unfaithful responses can impose bias on
the BPR, but I found the bias is not systematic. A systematic bias is most likely the
result of social norms that are related to the tolerance of bribery, since people from
societies that have a low tolerance for bribery are more likely to answer the question
unfaithfully. However, my empirical testing shows that the bribery-tolerance cannot
effectively predict the bribe-paying rate.13 Second, bribery is just one aspect of
corruption, and the BPR index cannot represent the occurrence rate of all kinds of
corruption. This critique is reasonable and should be noted. Nonetheless, so far there
has been no indicator that can capture the overall situation of corruption across
Table 7 Summary statistics of
Transparency International’s
data of bribe-paying rate
No. obs. Mean (%) SD (%) Min (%) Max (%)
2006 61 13.6 15.2 1 66
2007 50 18.6 20.8 1 79
2009 65 17.2 18.4 1 87
2010/2011 100 28.3 23.4 0.4 89
2013 95 26.7 20.6 1 84
All obs. 371 22.3 21.0 0.4 89
12 There is only one simple question invariably asked to each respondent in each year. The content of the
question is also essentially the same although there are subtle variations of phrasing in different years.13 A question from the GCB survey asking ‘‘Have you refused to pay a bribe?’’ is used to measure a
society’s tolerance to bribe-paying. The reported bribe-paying rate and bribe-rejection rate in GCB 2013
are negatively correlated with a coefficient of -0.39. I interpret this as a moderate association, but still
not a strong association.
288 Chin. Polit. Sci. Rev. (2016) 1:268–302
123
many countries. CCI and CPI only capture bribes as well. Corruption in
procurement and state capture are barely captured by the indexes (Knack 2006).
4.2 Key Independent Variables
British colonial tradition is a dummy variable capturing whether Britain used to be a
primary colonial power of a country. Religious traditions include Protestant
tradition, Catholic tradition, and Islamic tradition. They are measured by, first,
whether or not the largest religion by population in each country is Protestantism/
Catholicism/Islam, and second, the percentage of the population in each country
believing in Protestantism/Catholicism/Islam.14 Legal traditions include the British
common law tradition, the French civil law tradition, the socialist law tradition, the
German civil law tradition, and the Scandinavian law tradition. All these legal
traditions are measured in the form of dummy variables. The data come from La
Porta et al. (1999). Democratic tradition is a continuous variable measured by the
number of consecutive years that a democratic regime had lasted. For example, on
this variable, the United States is coded as 200 in 2009, and China is coded as 0 in
2009, while Iran is also coded as 0 in 2009 even though this country used to be a
democracy.15 The original data come from the Polity IV Program.
4.3 Control Variables
The first category of control variables is political institutions, including institutional
democracy and federal structure.16 Democracy is conceived as three essential,
interdependent elements. One is the presence of institutions and procedures through
which citizens can express effective preferences about alternative policies and leaders.
Second is the existence of institutionalized constraints on the exercise of power by the
executive. Third is the guarantee of civil liberties to all citizens in their daily lives and
in acts of political participation.17 In practice, these principles are reflected in free
elections, systems of checks and balances, as well as in rule of law. All of these
institutional arrangements could help, to some extent, prevent public officials from
abusing their power by revealing and punishing their misconduct. It is noteworthy that
although it seems to be consensus among scholars that democracy is a reflection of the
quality of institutions, and good institutions reduce corruption, relationships between
institutional democracy and corruption revealed by previous literature are not always
significant. Some observations also contradict the negative relationship between
democracy and corruption. For example, Hong Kong and Singapore, with the cleanest
14 Data for the dummy variables come from Cross-National Socio-Economic and Religion dataset, and
data for the continuous variables come from Global Religious Futures by Pew Research Center.15 A democracy which had broken-down is too weak to generate, maintain and leave the democratic
culture, even if we acknowledge that long-established democracies do have a unique ‘‘democratic
culture’’ which are good for controlling corruption. So I code countries like Iran as zero.16 Freedom of press and political stability may also have effects on corruption level, while they are
highly correlated with institutional democracy level. For avoiding multicollinearity, they are not
controlled in the regressions.17 See Polity IV Project: Dataset Users’ Manual.
Chin. Polit. Sci. Rev. (2016) 1:268–302 289
123
governments in the world, are not full-fledged democracies. On the other hand, long-
established democracies like India and the Philippines are rather corrupt. In short,
existent theory and evidence on the democracy-corruption nexus is not satisfying
enough. Further discussion on this topic is not the main purpose of this paper. I only
hypothesize that countries with a higher degree of democracy are less corrupt, with the
assumption that democracy can to some extent reflect the quality of institutions. The
data measuring democracy come from Polity IV Program.
Federal structure captures the extent of political and administrative decentral-
ization, which has been found to be more corrupt than unitary systems in previous
literature (see Treisman 2000). However, it is not very clear why federal systems
have more corruption than unitary systems. Some argued that a unitary predatory
government will moderate its demands, while if multiple officials regulate the
same actors and fail to coordinate, they may set the total bribe rate higher than
would be optimal for a unitary, bribe-maximizing government (Shleifer and
Vishny 1993). On the other hand, local governments under a federal structure are
closer to the electorates. The latter can hold local public officials accountable more
directly and effectively compared with unitary systems where local officials are
more of the agents of the central government. No matter which effect is true,
federal or unitary structure represents an important institutional arrangement in a
country that should be controlled in the analysis. In the regressions, federal
structure is a dummy variable. The data come from the dataset of the Institutions
and Elections Project.
The second category of control variable just includes economic development,
which is measured by the natural logarithm of GNI per capita. Economic development
increases education level, literacy, and depersonalized relationships, each of which
should raise the odds that an abuse will be noticed and challenged (Treisman 2000).
The third set of control variables is economic structure and policy, including
resource revenue and economic freedom. The resource revenue variable captures
the extent to which a country’s economy is dependent on the revenue of natural
resources, which is measured by the total natural resource rent as a percentage of
GDP. Some literature has found that dependence on natural resources increases
corruption where institutions are weak (Bhattacharyya and Hodler 2010; Vicente
2010). The resource revenue data come from the WDI dataset. Economic freedom is
represented by business freedom, which captures the number of procedures and time
it takes to start a business in each country. A lack of business freedom means the
government exerts more regulations on enterprises than an optimum standard, which
gives public officials more opportunities to solicit bribes. The data measuring
business freedom come from The Heritage Foundation.
In addition, although some literature argues that economic openness has an effect
on corruption levels, the preliminary regression shows the association between
import dependency, measured by import as a percentage of GDP, and the
occurrence rate of bribery is not significant, so this variable is not controlled.
Summary statistics of the data on the dependent variables, key independent
variables, as well as control variables are presented in Table 8.
290 Chin. Polit. Sci. Rev. (2016) 1:268–302
123
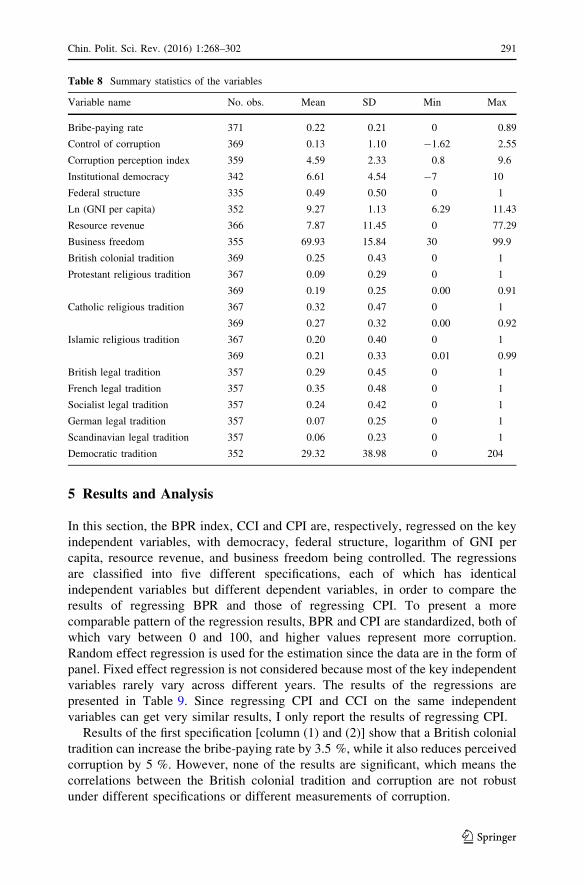
5 Results and Analysis
In this section, the BPR index, CCI and CPI are, respectively, regressed on the key
independent variables, with democracy, federal structure, logarithm of GNI per
capita, resource revenue, and business freedom being controlled. The regressions
are classified into five different specifications, each of which has identical
independent variables but different dependent variables, in order to compare the
results of regressing BPR and those of regressing CPI. To present a more
comparable pattern of the regression results, BPR and CPI are standardized, both of
which vary between 0 and 100, and higher values represent more corruption.
Random effect regression is used for the estimation since the data are in the form of
panel. Fixed effect regression is not considered because most of the key independent
variables rarely vary across different years. The results of the regressions are
presented in Table 9. Since regressing CPI and CCI on the same independent
variables can get very similar results, I only report the results of regressing CPI.
Results of the first specification [column (1) and (2)] show that a British colonial
tradition can increase the bribe-paying rate by 3.5 %, while it also reduces perceived
corruption by 5 %. However, none of the results are significant, which means the
correlations between the British colonial tradition and corruption are not robust
under different specifications or different measurements of corruption.
Table 8 Summary statistics of the variables
Variable name No. obs. Mean SD Min Max
Bribe-paying rate 371 0.22 0.21 0 0.89
Control of corruption 369 0.13 1.10 -1.62 2.55
Corruption perception index 359 4.59 2.33 0.8 9.6
Institutional democracy 342 6.61 4.54 -7 10
Federal structure 335 0.49 0.50 0 1
Ln (GNI per capita) 352 9.27 1.13 6.29 11.43
Resource revenue 366 7.87 11.45 0 77.29
Business freedom 355 69.93 15.84 30 99.9
British colonial tradition 369 0.25 0.43 0 1
Protestant religious tradition 367 0.09 0.29 0 1
369 0.19 0.25 0.00 0.91
Catholic religious tradition 367 0.32 0.47 0 1
369 0.27 0.32 0.00 0.92
Islamic religious tradition 367 0.20 0.40 0 1
369 0.21 0.33 0.01 0.99
British legal tradition 357 0.29 0.45 0 1
French legal tradition 357 0.35 0.48 0 1
Socialist legal tradition 357 0.24 0.42 0 1
German legal tradition 357 0.07 0.25 0 1
Scandinavian legal tradition 357 0.06 0.23 0 1
Democratic tradition 352 29.32 38.98 0 204
Chin. Polit. Sci. Rev. (2016) 1:268–302 291
123
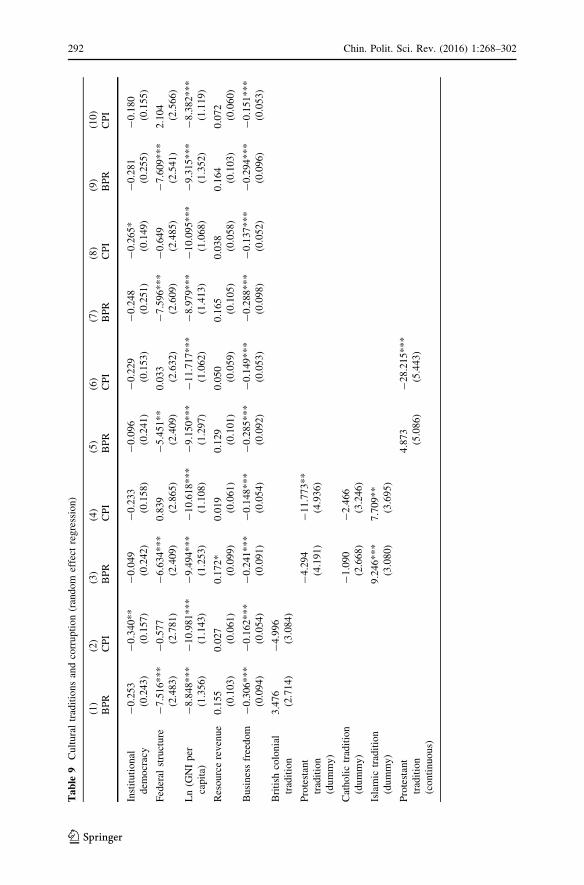
Table
9C
ult
ura
ltr
adit
ions
and
corr
upti
on
(ran
dom
effe
ctre
gre
ssio
n)
(1)
(2)
(3)
(4)
(5)
(6)
(7)
(8)
(9)
(10
)
BP
RC
PI
BP
RC
PI
BP
RC
PI
BP
RC
PI
BP
RC
PI
Inst
itu
tio
nal
dem
ocr
acy
-0
.253
(0.2
43
)
-0
.34
0*
*
(0.1
57)
-0
.049
(0.2
42)
-0
.233
(0.1
58
)
-0
.09
6
(0.2
41)
-0
.229
(0.1
53)
-0
.248
(0.2
51
)
-0
.265
*
(0.1
49)
-0
.281
(0.2
55)
-0
.18
0
(0.1
55
)
Fed
eral
stru
ctu
re-
7.5
16
**
*
(2.4
83
)
-0
.57
7
(2.7
81)
-6
.634
**
*
(2.4
09)
0.8
39
(2.8
65
)
-5
.45
1*
*
(2.4
09)
0.0
33
(2.6
32)
-7
.596
**
*
(2.6
09
)
-0
.649
(2.4
85)
-7
.609
**
*
(2.5
41)
2.1
04
(2.5
66
)
Ln
(GN
Ip
er
cap
ita)
-8
.848
**
*
(1.3
56
)
-1
0.9
81
***
(1.1
43)
-9
.494
**
*
(1.2
53)
-1
0.6
18
***
(1.1
08
)
-9
.15
0*
**
(1.2
97)
-1
1.7
17
**
*
(1.0
62)
-8
.979
**
*
(1.4
13
)
-1
0.0
95
**
*
(1.0
68)
-9
.315
**
*
(1.3
52)
-8
.38
2*
**
(1.1
19
)
Res
ou
rce
rev
enu
e0
.155
(0.1
03
)
0.0
27
(0.0
61)
0.1
72
*
(0.0
99)
0.0
19
(0.0
61
)
0.1
29
(0.1
01)
0.0
50
(0.0
59)
0.1
65
(0.1
05
)
0.0
38
(0.0
58)
0.1
64
(0.1
03)
0.0
72
(0.0
60
)
Busi
nes
sfr
eed
om
-0
.306
**
*
(0.0
94
)
-0
.16
2*
**
(0.0
54)
-0
.241
**
*
(0.0
91)
-0
.148
**
*
(0.0
54
)
-0
.28
5*
**
(0.0
92)
-0
.149
**
*
(0.0
53)
-0
.288
**
*
(0.0
98
)
-0
.137
**
*
(0.0
52)
-0
.294
**
*
(0.0
96)
-0
.15
1*
**
(0.0
53
)
Bri
tish
colo
nia
l
trad
itio
n
3.4
76
(2.7
14
)
-4
.99
6
(3.0
84)
Pro
test
ant
trad
itio
n
(du
mm
y)
-4
.294
(4.1
91)
-1
1.7
73
**
(4.9
36
)
Cat
ho
lic
trad
itio
n
(du
mm
y)
-1
.090
(2.6
68)
-2
.466
(3.2
46
)
Isla
mic
trad
itio
n
(du
mm
y)
9.2
46
**
*
(3.0
80)
7.7
09
**
(3.6
95
)
Pro
test
ant
trad
itio
n
(co
nti
nuo
us)
4.8
73
(5.0
86)
-2
8.2
15
**
*
(5.4
43)
292 Chin. Polit. Sci. Rev. (2016) 1:268–302
123
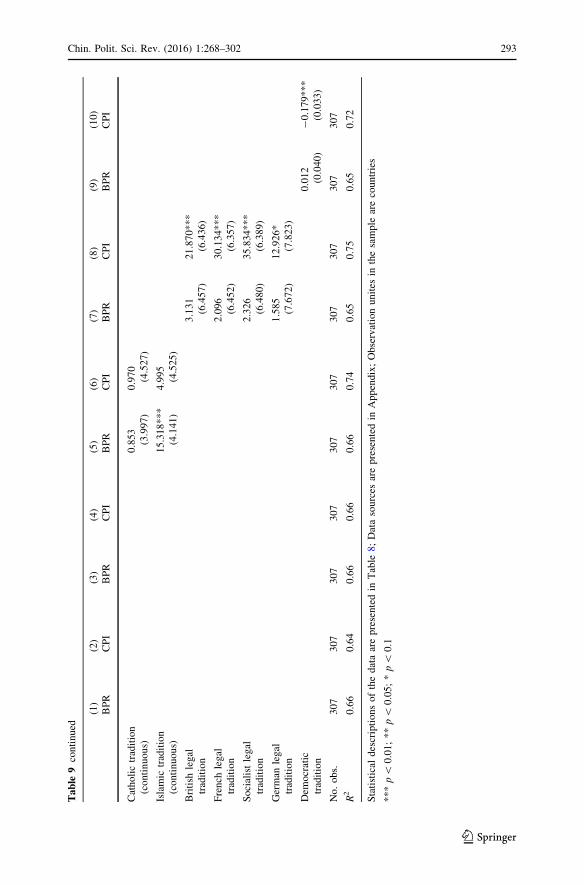
Table
9co
nti
nu
ed
(1)
(2)
(3)
(4)
(5)
(6)
(7)
(8)
(9)
(10
)
BP
RC
PI
BP
RC
PI
BP
RC
PI
BP
RC
PI
BP
RC
PI
Cat
ho
lic
trad
itio
n
(co
nti
nuo
us)
0.8
53
(3.9
97)
0.9
70
(4.5
27)
Isla
mic
trad
itio
n
(co
nti
nuo
us)
15
.31
8*
**
(4.1
41)
4.9
95
(4.5
25)
Bri
tish
leg
al
trad
itio
n
3.1
31
(6.4
57
)
21
.87
0*
**
(6.4
36)
Fre
nch
leg
al
trad
itio
n
2.0
96
(6.4
52
)
30
.13
4*
**
(6.3
57)
So
cial
ist
leg
al
trad
itio
n
2.3
26
(6.4
80
)
35
.83
4*
**
(6.3
89)
Ger
man
leg
al
trad
itio
n
1.5
85
(7.6
72
)
12
.92
6*
(7.8
23)
Dem
ocr
atic
trad
itio
n
0.0
12
(0.0
40)
-0
.17
9*
**
(0.0
33
)
No
.o
bs.
30
73
07
30
73
07
30
73
07
30
73
07
30
73
07
R2
0.6
60
.64
0.6
60
.66
0.6
60
.74
0.6
50
.75
0.6
50
.72
Sta
tist
ical
des
crip
tio
ns
of
the
dat
aar
ep
rese
nte
din
Tab
le8;
Dat
aso
urc
esar
epre
sente
din
Appen
dix
;O
bse
rvat
ion
unit
esin
the
sam
ple
are
countr
ies
**
*p\
0.0
1;
**p\
0.0
5;
*p\
0.1
Chin. Polit. Sci. Rev. (2016) 1:268–302 293
123
In regression (3) to (6), BPR index and CPI are, respectively, regressed on three
different kinds of religious tradition. The results show that a Protestant tradition can
significantly reduce perceived corruption by 12 %, while the relationship between a
Protestant tradition and the bribe-paying rate turn out to be insignificant. A Catholic
tradition is not a significant predictor of either perceived corruption or the bribe-
paying rate. However, the Islamic tradition is significantly associated with the bribe-
paying rate. Countries with Islamic traditions have a higher bribe-paying rate
compared with other countries. For example, the result of regression (3) shows that
the bribe-paying rate in Islamic countries is about 9 % higher than in non-Islamic
countries. The results are consistent when religious traditions are measured in a
different way [see regression (5)]. Nonetheless, the significance does not necessarily
mean the Islamic tradition is the cause of corruption. The causal mechanism linking
the Islamic tradition and corruption, as proposed in previous literature, has a
mediating variable—interventionism. If this mechanism were valid, controlling
business freedom in the regression would reduce the negative effect of an Islamic
cultural tradition on control of corruption. However, when independent variable
business freedom is removed from regression (3) or (5), the coefficient of Islamic
tradition exhibits a tiny decrease, which seems to be contrary to the proposed theory
linking corruption to Islamic tradition. Hence, the proposed causal relationship
between Islamic tradition and corruption is spurious. It is possible that Islamic
tradition leads to corruption in another way, but the specific causal mechanism
needs to be further explored.
In regression (7) and (8), the relations between different kinds of legal traditions
and corruption are tested. Results show that the British legal tradition, French legal
tradition, and socialist legal tradition could significantly increase a country’s
perceived corruption level, respectively, by 22, 30, and 36 %. The result is not very
consistent with the theories proposed in previous literature, which presume the
British legal tradition can help reduce corruption rather than increase it. On the other
hand, none of these legal traditions is significantly associated with the bribe-paying
rate. The proposed causal relationships between legal traditions and corruption are
also spurious.
Regression (9) and (10) test the relationship between democratic tradition and
corruption. Results show that a 10-year increase of democratic experience could
reduce perceived corruption levels by 1.8 %. However, the relationship between
democratic tradition and bribe-paying rate is not significant. The association
between democratic tradition and corruption may be nonlinear, which explains why
it is not significant in regression (9).
To test the proposed nonlinear relationship between democratic tradition and
corruption, I regress the BPR index on the natural logarithmic form of democratic
tradition, with institutional democracy, federal structure, resource revenue, business
freedom, and GNI per capita being controlled. The results are presented in Table 10.
The coefficients of democratic tradition are significant in the first two regressions,
but when business freedom and GNI per capita are controlled, the coefficients of
democratic tradition become insignificant. In addition, as more variables are
controlled in the regression, the coefficient of democratic tradition continues
diminishing. These results indicate that the nonlinear relationship between
294 Chin. Polit. Sci. Rev. (2016) 1:268–302
123
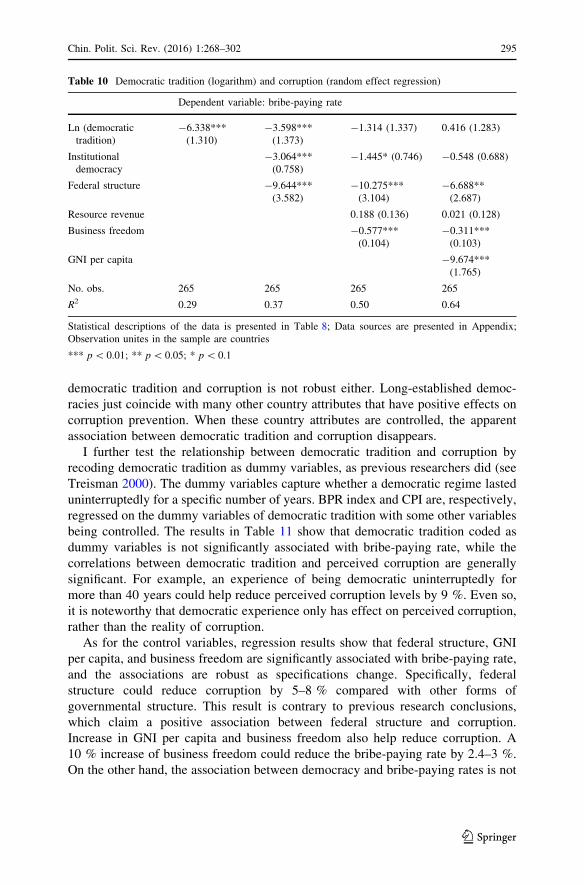
democratic tradition and corruption is not robust either. Long-established democ-
racies just coincide with many other country attributes that have positive effects on
corruption prevention. When these country attributes are controlled, the apparent
association between democratic tradition and corruption disappears.
I further test the relationship between democratic tradition and corruption by
recoding democratic tradition as dummy variables, as previous researchers did (see
Treisman 2000). The dummy variables capture whether a democratic regime lasted
uninterruptedly for a specific number of years. BPR index and CPI are, respectively,
regressed on the dummy variables of democratic tradition with some other variables
being controlled. The results in Table 11 show that democratic tradition coded as
dummy variables is not significantly associated with bribe-paying rate, while the
correlations between democratic tradition and perceived corruption are generally
significant. For example, an experience of being democratic uninterruptedly for
more than 40 years could help reduce perceived corruption levels by 9 %. Even so,
it is noteworthy that democratic experience only has effect on perceived corruption,
rather than the reality of corruption.
As for the control variables, regression results show that federal structure, GNI
per capita, and business freedom are significantly associated with bribe-paying rate,
and the associations are robust as specifications change. Specifically, federal
structure could reduce corruption by 5–8 % compared with other forms of
governmental structure. This result is contrary to previous research conclusions,
which claim a positive association between federal structure and corruption.
Increase in GNI per capita and business freedom also help reduce corruption. A
10 % increase of business freedom could reduce the bribe-paying rate by 2.4–3 %.
On the other hand, the association between democracy and bribe-paying rates is not
Table 10 Democratic tradition (logarithm) and corruption (random effect regression)
Dependent variable: bribe-paying rate
Ln (democratic
tradition)
-6.338***
(1.310)
-3.598***
(1.373)
-1.314 (1.337) 0.416 (1.283)
Institutional
democracy
-3.064***
(0.758)
-1.445* (0.746) -0.548 (0.688)
Federal structure -9.644***
(3.582)
-10.275***
(3.104)
-6.688**
(2.687)
Resource revenue 0.188 (0.136) 0.021 (0.128)
Business freedom -0.577***
(0.104)
-0.311***
(0.103)
GNI per capita -9.674***
(1.765)
No. obs. 265 265 265 265
R2 0.29 0.37 0.50 0.64
Statistical descriptions of the data is presented in Table 8; Data sources are presented in Appendix;
Observation unites in the sample are countries
*** p\ 0.01; ** p\ 0.05; * p\ 0.1
Chin. Polit. Sci. Rev. (2016) 1:268–302 295
123
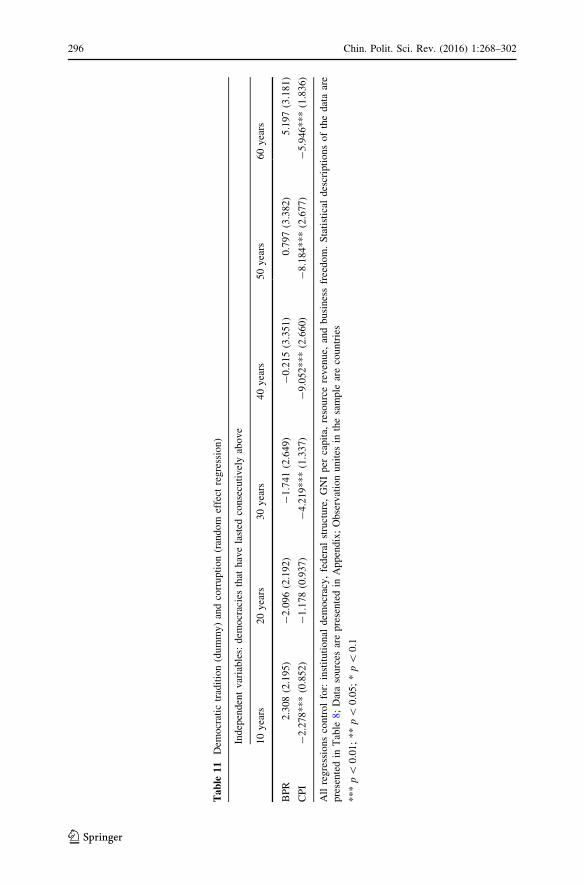
Table
11
Dem
ocr
atic
trad
itio
n(d
um
my
)an
dco
rru
pti
on
(ran
do
mef
fect
regre
ssio
n)
Ind
epen
den
tv
aria
ble
s:d
emo
crac
ies
that
hav
ela
sted
con
secu
tiv
ely
abo
ve
10
yea
rs2
0y
ears
30
yea
rs4
0y
ears
50
yea
rs6
0y
ears
BP
R2
.308
(2.1
95
)-
2.0
96
(2.1
92
)-
1.7
41
(2.6
49)
-0
.215
(3.3
51)
0.7
97
(3.3
82)
5.1
97
(3.1
81)
CP
I-
2.2
78
**
*(0
.85
2)
-1
.17
8(0
.93
7)
-4
.21
9*
**
(1.3
37)
-9
.052
**
*(2
.66
0)
-8
.18
4*
**
(2.6
77)
-5
.946
**
*(1
.83
6)
All
reg
ress
ion
sco
ntr
ol
for:
inst
itu
tio
nal
dem
ocr
acy
,fe
der
alst
ruct
ure
,G
NI
per
capit
a,re
sou
rce
reven
ue,
and
bu
sin
ess
free
dom
.S
tati
stic
ald
escr
ipti
on
so
fth
ed
ata
are
pre
sen
ted
inT
able
8;
Dat
aso
urc
esar
ep
rese
nte
din
Ap
pen
dix
;O
bse
rvat
ion
un
ites
inth
esa
mp
lear
eco
un
trie
s
**
*p\
0.0
1;
**p\
0.0
5;
*p\
0.1
296 Chin. Polit. Sci. Rev. (2016) 1:268–302
123
significant. The relationship between resource revenue and bribe-paying rates is not
significant either.
6 Further Discussion
While there is distinctive contrast between regression results based on CPI and BPR,
it is still not certain that the significant associations between cultural traditions and
CPI are results of perception bias, unless it can be proven that cultural traditions are
significantly associated with the measurement bias on CPI or CCI. To test whether
cultural traditions are associated with the measurement bias on corruption or
corruption itself, we need to materialize the measurement bias on CPI or CCI, which
is reflected by the deviation of the corruption level measured by CPI or CCI from
the corruption level measured by BPR. While the bribe-paying rate is not a perfect
measurement of corruption level, it is much better at capturing the factual
occurrence rate of corruption than perception-based measurements. In addition, as I
argued previously, the discrepancy between perception-based indicators and
experience-based indicators is not the result of different definitions of corruption.
It is more likely the result of measurement bias on the perception-based indicators.
To calculate the measurement bias, the values of CPI, CCI, and BPR are
standardized, all of which vary between 0 and 10. The higher the value is, the more
corrupt the country is. Then the standardized values of BPR are, respectively,
subtracted from the values of CPI and CCI. The higher the absolute value is, the
more extensive the measurement bias is. The measurement bias of CPI is highly
correlated with that of CCI. In addition, countries’ corruption levels measured by
perception-based indicators are extensively higher than those measured by BPR
index. The maximum extent of overestimation could reach seven points on a ten-
point variable.
To examine whether the cultural tradition variables can explain the measurement
bias related to perception, the measurement bias on CPI is regressed on the cultural
tradition variables that are found to be significantly associated with CPI in Table 9,
with institutional democracy, GNI per capita, and business freedom being
controlled. Regression results are presented in Table 12. The result shows Protestant
religious tradition, socialist legal tradition, and democratic tradition are significantly
associated with the measurement bias on CPI. Protestant religious tradition and
democratic tradition are negatively associated with the measurement bias on CPI,
which means these cultural traditions can reduce the overestimation of a country’s
corruption level. The effects hold when other country attributes are controlled.
Perception-based indicators of corruption do systematically underestimate the
corruption level of Protestant countries and long-established democracies, although
no robust evidence has been found that these cultural endowments could affect
corruption reality in this study.
Chin. Polit. Sci. Rev. (2016) 1:268–302 297
123
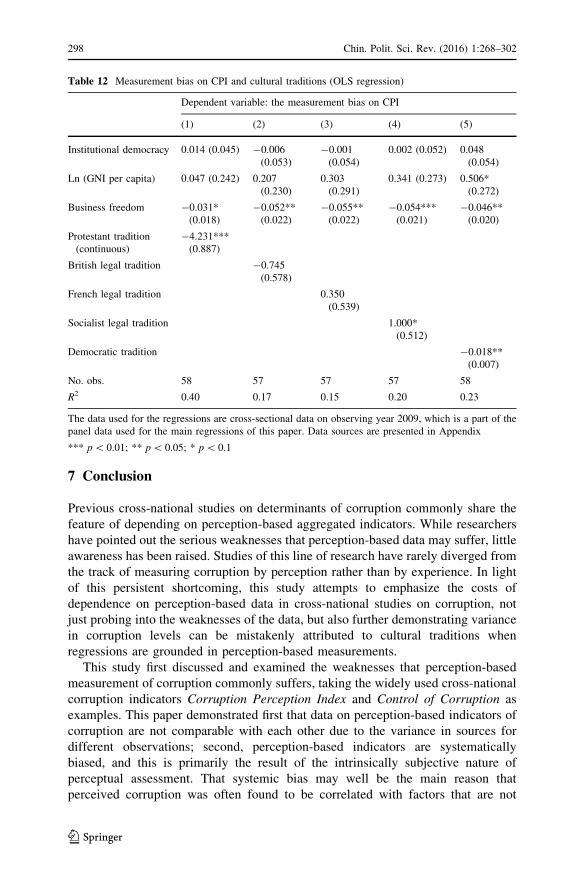
7 Conclusion
Previous cross-national studies on determinants of corruption commonly share the
feature of depending on perception-based aggregated indicators. While researchers
have pointed out the serious weaknesses that perception-based data may suffer, little
awareness has been raised. Studies of this line of research have rarely diverged from
the track of measuring corruption by perception rather than by experience. In light
of this persistent shortcoming, this study attempts to emphasize the costs of
dependence on perception-based data in cross-national studies on corruption, not
just probing into the weaknesses of the data, but also further demonstrating variance
in corruption levels can be mistakenly attributed to cultural traditions when
regressions are grounded in perception-based measurements.
This study first discussed and examined the weaknesses that perception-based
measurement of corruption commonly suffers, taking the widely used cross-national
corruption indicators Corruption Perception Index and Control of Corruption as
examples. This paper demonstrated first that data on perception-based indicators of
corruption are not comparable with each other due to the variance in sources for
different observations; second, perception-based indicators are systematically
biased, and this is primarily the result of the intrinsically subjective nature of
perceptual assessment. That systemic bias may well be the main reason that
perceived corruption was often found to be correlated with factors that are not
Table 12 Measurement bias on CPI and cultural traditions (OLS regression)
Dependent variable: the measurement bias on CPI
(1) (2) (3) (4) (5)
Institutional democracy 0.014 (0.045) -0.006
(0.053)
-0.001
(0.054)
0.002 (0.052) 0.048
(0.054)
Ln (GNI per capita) 0.047 (0.242) 0.207
(0.230)
0.303
(0.291)
0.341 (0.273) 0.506*
(0.272)
Business freedom -0.031*
(0.018)
-0.052**
(0.022)
-0.055**
(0.022)
-0.054***
(0.021)
-0.046**
(0.020)
Protestant tradition
(continuous)
-4.231***
(0.887)
British legal tradition -0.745
(0.578)
French legal tradition 0.350
(0.539)
Socialist legal tradition 1.000*
(0.512)
Democratic tradition -0.018**
(0.007)
No. obs. 58 57 57 57 58
R2 0.40 0.17 0.15 0.20 0.23
The data used for the regressions are cross-sectional data on observing year 2009, which is a part of the
panel data used for the main regressions of this paper. Data sources are presented in Appendix
*** p\ 0.01; ** p\ 0.05; * p\ 0.1
298 Chin. Polit. Sci. Rev. (2016) 1:268–302
123
supposed to be associated with corruption reality. Third, corruption levels measured
by perception-based indicators substantially deviate from experience-based mea-
surements. That deviation is not likely the result of a different definition of
corruption, but rather the result of different methods of measuring corruption. All
these weaknesses make perception-based measurement of corruption biased, and
biased data cannot generate valid regression results.
This study then re-examined the relationships between different cultural
traditions and corruption, which were commonly found to be significantly correlated
in literature that used perception-based data to measure corruption. I first tested the
causal mechanisms that attribute corruption to several cultural traditions, including
colonial traditions, religious traditions, legal traditions, as well as democratic
traditions. I found most of the causal mechanisms between different cultural
traditions and corruption were not as valid as proposed by other scholars. Second, I
regressed an experience-based measurement of corruption on the cultural traditions
to observe the proposed causal effects. When perception-based indicators are
substituted with the experience-based indicator, which does not suffer the
weaknesses that perception-based indicators do, the apparent correlation between
cultural traditions and corruption mostly disappeared.
To explain the pattern of cultural traditions commonly being correlated with
perceived corruption but not experienced corruption, I argued that it was the
perceptual bias of a perception-based index that was associated with cultural
traditions, not corruption reality itself. This argument was proved plausible when
the measurement bias of a perception-based index was regressed on cultural
traditions, since some of the results were significant. It could be that respondents’
perceptions of corruption are to some extent based on cultural traditions or some
other highly correlated attributes of a country, although no robust evidence has been
offered that these factors do have causal effects on actual levels of corruption. In
other words, the apparent associations between cultural traditions and the
perception-based indicators of corruption may not be positive causal inference,
but rather the causal inference that exists in the mind of the respondents whose
perception was used to measure corruption.
In addition to the primary findings, some other results also deserve attention.
First, the Islamic cultural tradition was found to be significantly associated with
bribery rates—the only significant correlation in the regression results. Although the
proposed causal mechanism to support such causal inference was proved to be
invalid, further study could explore other possible causal explanations and test the
robustness of such statistical associations in other specifications. Second, the
relationship between institutional democracy and bribery rates is not robust,
although the theory that democracy helps curb corruption has become quite
influential. There may be elements of truth in this theory, but the theory itself may
not be as simple as has been proposed in previous quantitative literature. Further
research could explore the specific conditions under which democracy can hold
public officials accountable. Third, federal structure was found to be negatively and
robustly associated with bribery rates, which contradicted common findings in
previous research. This indicates that relationships between decentralization and
corruption are even more complicated. Last, dependence on resource revenue did
Chin. Polit. Sci. Rev. (2016) 1:268–302 299
123
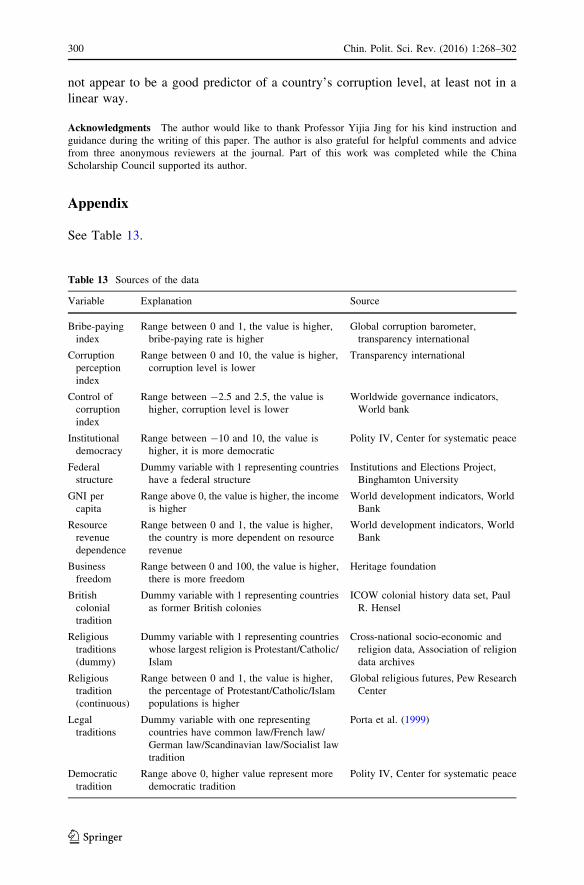
not appear to be a good predictor of a country’s corruption level, at least not in a
linear way.
Acknowledgments The author would like to thank Professor Yijia Jing for his kind instruction and
guidance during the writing of this paper. The author is also grateful for helpful comments and advice
from three anonymous reviewers at the journal. Part of this work was completed while the China
Scholarship Council supported its author.
Appendix
See Table 13.
Table 13 Sources of the data
Variable Explanation Source
Bribe-paying
index
Range between 0 and 1, the value is higher,
bribe-paying rate is higher
Global corruption barometer,
transparency international
Corruption
perception
index
Range between 0 and 10, the value is higher,
corruption level is lower
Transparency international
Control of
corruption
index
Range between -2.5 and 2.5, the value is
higher, corruption level is lower
Worldwide governance indicators,
World bank
Institutional
democracy
Range between -10 and 10, the value is
higher, it is more democratic
Polity IV, Center for systematic peace
Federal
structure
Dummy variable with 1 representing countries
have a federal structure
Institutions and Elections Project,
Binghamton University
GNI per
capita
Range above 0, the value is higher, the income
is higher
World development indicators, World
Bank
Resource
revenue
dependence
Range between 0 and 1, the value is higher,
the country is more dependent on resource
revenue
World development indicators, World
Bank
Business
freedom
Range between 0 and 100, the value is higher,
there is more freedom
Heritage foundation
British
colonial
tradition
Dummy variable with 1 representing countries
as former British colonies
ICOW colonial history data set, Paul
R. Hensel
Religious
traditions
(dummy)
Dummy variable with 1 representing countries
whose largest religion is Protestant/Catholic/
Islam
Cross-national socio-economic and
religion data, Association of religion
data archives
Religious
tradition
(continuous)
Range between 0 and 1, the value is higher,
the percentage of Protestant/Catholic/Islam
populations is higher
Global religious futures, Pew Research
Center
Legal
traditions
Dummy variable with one representing
countries have common law/French law/
German law/Scandinavian law/Socialist law
tradition
Porta et al. (1999)
Democratic
tradition
Range above 0, higher value represent more
democratic tradition
Polity IV, Center for systematic peace
300 Chin. Polit. Sci. Rev. (2016) 1:268–302
123
References
Abramo, Claudio Weber. 2008. How much do perceptions of corruption really tell us? Economics: The
Open-Access, Open-Assessment E-Journal 2(3): 1–56.
Andersson, Staffan, and Paul M. Heywood. 2009. The politics of perception: Use and abuse of
Transparency International’s approach to measuring corruption. Political Studies 57(4): 746–767.
Bai, Ying, and James Kai-sing Kung. 2015. Diffusing knowledge while spreading God’s message:
Protestantism and economic prosperity in China, 1840–1920. Journal of the European Economic
Association 13: 669–698.
Barr, Abigail, and Danila Serra. 2010. Corruption and culture: An experimental analysis. Journal of
Public Economics 94(11): 862–869.
Becker, S.O., and L. Woessmann. 2009. Was Weber wrong? A human capital theory of Protestant
economic history. The Quarterly Journal of Economics 124(2): 531–596.
Bhattacharyya, Sambit, and Roland Hodler. 2010. Natural resources, democracy and corruption.
European Economic Review 54(4): 608–621.
Bohara, Alok K., Neil J. Mitchell, and Carl F. Mittendorff. 2004. Compound democracy and the control
of corruption: A cross-country investigation. Policy Studies Journal 32(4): 481–499.
Brunetti, Aymo, and Beatrice Weder. 2003. A free press is bad news for corruption. Journal of Public
Economics 87(7): 1801–1824.
Cantoni, Davide. 2015. The economic effects of the protestant reformation: Testing the Weber hypothesis
in the German lands. Journal of the European Economic Association 13: 561–598.
Chowdhury, Shyamal K. 2004. The effect of democracy and press freedom on corruption: An empirical
test. Economics Letters 85(1): 93–101.
Fan, C.Simon, Chen Lin, and Daniel Treisman. 2009. Political decentralization and corruption: Evidence
from around the world. Journal of Public Economics 93(1): 14–34.
Gerring, John, and Strom C. Thacker. 2005. Do neoliberal policies deter political corruption?
International Organization 59(1): 233–254.
Glaeser, Edward L., and Claudia Goldin. 2007. Corruption and reform: Lessons from America’s
economic history. Chicago: University of Chicago Press.
Goldsmith, Arthur A. 1999. Slapping the grasping hand. American Journal of Economics and Sociology
58(4): 865–883.
Kaufmann, Daniel, Aart Kraay, and Massimo Mastruzzi. 2007a. Growth and governance: A reply.
Journal of Politics 69(2): 555–562.
Kaufmann, Daniel, Aart Kraay, and Massimo Mastruzzi. 2007b. Growth and governance: A rejoinder.
Journal of Politics 69(2): 570–572.
Knack, Stephen. 2006. Measuring corruption in Eastern Europe and Central Asia: A critique of the cross-
country indicators. World Bank Policy Research Working Paper No. 3968.
Kolstad, Ivar, and Arne Wiig. 2015. Does democracy reduce corruption? Democratization 1–21.
Kurtz, Marcus J., and Andrew Schrank. 2007a. Growth and governance: Models, measures, and
mechanisms. Journal of Politics 69(2): 538–554.
Kurtz, Marcus J., and Andrew Schrank. 2007b. Growth and governance: A defense. Journal of Politics
69(2): 563–569.
Lederman, Daniel, Norman V. Loayza, and Rodrigo R. Soares. 2005. Accountability and corruption:
Political institutions matter. Economics and Politics 17(1): 1–35.
McKinnon, Andrew M. 2010. Elective affinities of the Protestant ethic: Weber and the chemistry of
capitalism. Sociological Theory 28(1): 108–126.
Mensah, Yaw M. 2014. An analysis of the effect of culture and religion on perceived corruption in a
global context. Journal of Business Ethics 121(2): 255–282.
Montinola, Gabriella R., and Robert W. Jackman. 2002. Sources of corruption: A cross-country study.
British Journal of Political Science 32(1): 147–170.
Olken, B.A. 2009. Corruption perceptions vs. corruption reality. Journal of Public Economics 93(7):
950–964.
Pellegrini, Lorenzo, and Reyer Gerlagh. 2008. Causes of corruption: A survey of cross-country analyses
and extended results. Economics of Governance 9(3): 245–263.
Porta, La, Florencio Lopez-de-Silanes Rafael, Andrei Shleifer, and Robert Vishny. 1999. The quality of
government. Journal of Law Economics and Organization 15(1): 222–279.
Chin. Polit. Sci. Rev. (2016) 1:268–302 301
123
Razafindrakoto, Mireille, and Francois Roubaud. 2010. Are international databases on corruption
reliable? A comparison of expert opinion surveys and household surveys in Sub-Saharan Africa.
World Development 38(8): 1057–1069.
Rock, Michael T. 2009. Corruption and democracy. Journal of Development Studies 45(1): 55–75.
Saha, Shrabani, Rukmani Gounder, Neil Campbell, and J.J. Su. 2014. Democracy and corruption: A
complex relationship. Crime, Law and Social Change 61(3): 287–308.
Sandholtz, Wayne, and William Koetzle. 2000. Accounting for corruption: Economic structure,
democracy, and trade. International Studies Quarterly 44(1): 31–50.
Serra, Danila. 2006. Empirical determinants of corruption: A sensitivity analysis. Public Choice
126(1–2): 225–256.
Shleifer, Andrei, and Robert W. Vishny. 1993. Corruption. Quarterly Journal of Economics 108(3):
599–618.
Sung, Hung-en. 2004. Democracy and political corruption: A cross-national comparison. Crime, Law and
Social Change 41(2): 179–193.
Thomas, Melissa A. 2010. What do the worldwide governance indicators measure? European Journal of
Development Research 22(1): 31–54.
Treisman, Daniel. 2000. The causes of corruption: A cross-national study. Journal of Public Economics
76(3): 399–457.
Treisman, Daniel. 2007. What have we learned about the causes of corruption from ten years of cross-
national empirical research? Annual Review of Political Science 10: 211–244.
Vicente, Pedro C. 2010. Does oil corrupt? Evidence from a natural experiment in West Africa. Journal of
Development Economics 92(1): 28–38.
Wilhelm, Paul G. 2002. International validation of the corruption perceptions index: Implications for
business ethics and entrepreneurship education. Journal of Business Ethics 35(3): 177–189.
Zhong, Yang, and Yongguo Chen. 2013. Regime support in urban China. Asian Survey 53(2): 369–392.
Ning He is currently a graduate student at the School of International Relations and Public Affairs
(SIRPA), Fudan University, Shanghai, China.
302 Chin. Polit. Sci. Rev. (2016) 1:268–302
123