retinal pathway origins of the pattern erg of the mouse 2017... · retinal pathway origins of the...
TRANSCRIPT
lable at ScienceDirect
Experimental Eye Research 89 (2009) 49–62
Contents lists avai
Experimental Eye Research
journal homepage: www.elsevier .com/locate/yexer
Retinal pathway origins of the pattern ERG of the mouse
Gen Miura a,b, Minhua H. Wang a, Kevin M. Ivers a, Laura J. Frishman a,*
a University of Houston, College of Optometry, 4901 Calhoun Rd, 505 J. Davis Armistead Building, Houston, TX 77204-2020, United Statesb Chiba University, Department of Ophthalmology and Visual Science, Graduate School of Medicine, 1-8-1 Inohana, Chuo-ku, Chiba 260-8670, Japan
a r t i c l e i n f o
Article history:Received 1 December 2008Accepted in revised form 15 February 2009Available online 27 February 2009
Keywords:pattern ERGPERGERGretinal ganglion cellsmouse retina
* Corresponding author. Tel.: þ1 713 743 1972; fax:E-mail address: [email protected] (L.J. Frishman).
0014-4835/$ – see front matter � 2009 Elsevier Ltd.doi:10.1016/j.exer.2009.02.009
a b s t r a c t
This study investigated contributions from the retinal On and Off pathways, and the spiking and non-spiking activity of neurons in those pathways to the pattern ERG of the mouse. Light-adapted pattern andganzfeld ERGs were recorded from anesthetized C57BL/6 mice 3–4 months of age. Recordings were madebefore and after intravitreal injections of PDA (cis-2,3-piperidine-dicarboxylic acid) to block transmissionto hyperpolarizing 2nd order and all 3rd order neurons, TTX (tetrodotoxin) to block Naþ-dependentspiking, APB (2-amino-4-phosphonobutyric acid) to block synapses between photoreceptors and ON-bipolar cells, and APB þ TTX and PDA þ TTX cocktails. The pattern stimuli consisted of 0.05 cy/deggratings reversing in contrast at 1 Hz, presented at various contrasts (50–90%) and a rod saturating meanluminance. For flash ERGs, brief green ganzfeld flashes were presented on a rod-suppressing greenbackground. Recordings were made 39–42 days after unilateral optic nerve crush (ONC) in a subset ofanimals in which ganglion cell degeneration was subsequently confirmed in retinal sections. PatternERGs were similar in waveform for all contrasts, with a positive wave (P1) peak for 90% contrast around60 ms on average and maximum trough for a negative wave (N2) around 132 ms after each contrastreversal; amplitudes were greatest for 90% contrast which became the standard stimulus. ONC elimi-nated or nearly eliminated the pattern ERG but did not affect the major waves of the flash ERG. PDA andTTX both delayed P1 and N2 waves of the pattern ERG, and reduced their amplitudes, with effects of PDAon N2 greater than those of TTX. In the flash ERG, PDA reduced a-wave amplitudes, removed OPs buthardly affected b-wave amplitudes. In contrast, TTX reduced b-wave amplitudes substantially, aspreviously observed in rat. APB removed P1 of the pattern ERG, but left a negative wave of similar timingand amplitude to N2. In the flash ERG, APB removed the b-wave, producing a negative ERG. Addition ofTTX to the APB injection removed most of N2 of the pattern ERG, while other waves of the pattern andflash ERG resembled those after APB alone. Addition of TTX to the PDA injection had little effect on thepattern ERG beyond that of PDA alone, but it prolonged the b-wave of the flash ERG. In conclusion, thisstudy confirmed that a selective lesion of ganglion cells will practically eliminate the pattern ERG. Thestudy also showed that P1 of the mouse pattern ERG is dominated by contributions, mainly spiking, fromON pathway neurons, whereas N2 reflects substantial spiking activity from the OFF pathway as well asnonspiking contributions from both pathways.
� 2009 Elsevier Ltd. All rights reserved.
1. Introduction
The pattern electroretinogram (ERG), first described by Riggset al. (1964), is commonly recorded noninvasively at the cornea asthe voltage change that occurs in response to each reversal of thecontrast of a checkerboard or grating pattern under light-adaptedconditions. For such a stimulus, changes in local luminance occurwhen the pattern reverses, but the average luminance remainsconstant. This causes the linear signals that produce the ERG a- and
þ1 713 743 2595.
All rights reserved.
b-waves to cancel, leaving only the nonlinear signals in the response.The nonlinear signals that compose the pattern ERG are known todepend upon the functional integrity of retinal ganglion cells (Bachand Hoffmann, 2008 for review). Studies in several mammal haveshown that the pattern ERG is eliminated, while the a- and b-wavesof the flash ERG from more distal retina are still present, followingoptic nerve section or crush that causes the retinal ganglion axonsand subsequently their cell bodies to degenerate. These studies wereinitially done in cats (Maffei and Fiorentini,1982), but similar resultswere subsequently obtained in monkeys (Maffei et al., 1985), rats(Berardi et al., 1990) and mice (Porciatti et al., 1996). In a humanindividual (Harrison et al., 1987), accidental optic nerve transectionalso was found to eliminate the pattern ERG.
G. Miura et al. / Experimental Eye Research 89 (2009) 49–6250
The pattern ERG has been used widely in the clinic and inclinical research for assessing retinal ganglion cell function in eyeswith glaucoma and other diseases that affect the inner retina, forreview see Bach and Hoffmann (2008) and Holder (2001). Inhumans, the pattern ERG has potential for detecting earlydysfunction of retinal ganglion cells caused by ocular hypertension(Aldebasi et al., 2004; Arai et al., 1993; Bach et al., 2006; Pfeifferet al., 1993), and early glaucoma when visual field deficits areminimal (Bach et al., 1988; Hood et al., 2005; Ventura et al., 2005).
There is increasing evidence that the pattern ERG is a useful toolfor monitoring functional effects of glaucomatous neuropathy inmoue models of glaucoma. The DBA/2J mouse is a model ofinherited glaucoma that progresses from normal ganglion cellnumbers at two months of age to massive retinal ganglion celldegeneration by 12–14 months (Anderson et al., 2002; Jakobs et al.,2005; John et al., 1998). The pattern ERG in young DBA/2J mice is ofnormal amplitude, whereas it is practically eliminated in the oldermice while the light-adapted flash ERG amplitude is reduced toa lesser extent (Porciatti et al., 2007).
Pattern ERGs can be recorded as transient responses to lowreversal frequencies, i.e, 1–2 Hz, or as steady state responses tohigher frequencies, e.g. 8 Hz. The transient pattern ERG has an earlypositive and a later negative component named respectively P50and N95 in humans to denote the time in milliseconds that the peakand trough occur following a pattern reversal (Holder et al., 2007).Both waves of the transient pattern ERG in humans reflect ganglioncell activity, although P50 may include other signals (see Holder,2001). Recent studies of DBA/2J mice have used the transientpattern ERG, a robust signal in healthy eyes with an early positive(P1) and later negative (N2) component, different in exact time ofoccurrence, but similar in general appearance to the P50 and N95components in the humans (Porciatti, 2007 for review).
Given the importance of the mouse model for studies of retina,the diseases that affect it, and developing treatments for thosediseases (Chang et al., 2005; Peachey and Ball, 2003), a goodunderstanding of the origins of ERG waves is useful. Althougha ganglion cell origin is known for the pattern ERG, the contributionof the ON and OFF retinal pathways feeding signals to the ganglioncells, and the role of spiking activity remains to be established. Theretinal OFF pathway hardly contributes to the light-adapted flashERG in mice and rats (Shirato et al., 2008; Xu et al., 2003) whereas itdoes to a great extent in primates, e.g. (Sieving et al., 1994), makingthe presence of this pathway’s signals in the pattern ERG ofparticular interest.
Elimination of Naþ-dependent spiking activity has been shownto reduce the pattern ERG in several species, but not to completelyeliminate it (Ben-Shlomo et al., 2005; Trimarchi et al., 1990; Vis-wanathan et al., 2000). It is well-established that essentially allretinal ganglion cells, and some amacrine cells in mammals expressvoltage-gated Naþ channels that produce action potentials.However, there are recent reports of TTX-sensitive voltage-gatedNaþ channels in certain cone bipolar cells in rats as well, blockadeof which reduces inward Naþ currents and spiking (Cui and Pan,2008; Ma et al., 2005; Pan and Hu, 2000), and can reduce the light-adapted b-wave (Bui and Fortune, 2004; Mojumder et al., 2007,2008). This raises the possibility of multiple retinal loci for theeffects of TTX in the mouse as well.
The purpose of the present study was to identify the role of theretinal pathways, and spiking vs nonspiking responses in gener-ating the transient pattern ERG in the mouse using pharmacologicmanipulations. In order to confirm previous work and to compareeffects of ganglion cell lesions with pharmacologic studies, opticnerve crush (ONC) also was done to create a selective ganglion celllesion, and flash ERGs were recorded in all experiments. Results ofthese studies indicate that the P1 and N2 waves of the mouse
pattern ERG are dominated by retinal ganglion cell contributionsfrom the ON and OFF pathways respectively, and that both spikingand nonspiking activity contributes to the two components.
2. Methods
2.1. Subjects
The subjects were 25 C57BL/6 mice of both sexes (n ¼ 30 eyes)3–6 months of age. Mice were reared and housed in a room witha 12 h on (<40 lux)/12 h off light/dark cycle. All experimental andanimal care procedures were approved by the Institutional AnimalCare and Use Committee of the University of Houston, and adheredto the ARVO Statement for the Use of Animals in Ophthalmic andVision Research. Four of the animals had the optic nerve crushed inone eye; recordings from their fellow eyes were used for controldata.
2.2. Animal preparation for ERG recordings
Animal preparation was similar to that described previously(Saszik et al., 2002; Shirato et al., 2008). Animals were initiallyanesthetized with an intraperitoneal injection of ketamine(60 mg/kg) and xylazine (6 mg/kg), and anesthesia was maintainedwith 93% of the dose every 20–40 min via a subcutaneous needlefixed in the flank. The animal’s head was fixed in a head holder.Pupils were fully dilated to 3 mm in diameter with topical atropine(0.5%) and phenylephrine (2.5%). Body temperature was monitoredand maintained at 37 �C with a thermostatically controlled elec-trically heated blanket (CWE, Inc., Ardmore, PA, USA). Recordingperiods lasted 2–4 h. Nearly all mice recovered from anesthesiaafter recording sessions, and data were discarded from those fewthat succumbed during the session, and for which responses werefalling in amplitude and/or becoming prolonged in time courseover the session. ERGs were recorded using DTL fiber electrodes(Dawson et al., 1979) placed across the center of the cornea of thetested eye and the fellow eye which served as a reference. Thecornea of tested eye was covered with a contact lens heat-formedfrom clear film (ACLAR film, Honeywell, USA). For pattern ERGstudies, an artificial pupil was used to improve depth of field. Thecontact lens then was opaque (permanent black marker applied)except for a 0.8 mm diameter clear aperture in the center of thelens. The non-tested eye was covered with a black plastic (PVC)contact lens and a black aluminum foil cap that covered both theeye and the skull to block any scattered light. Electrodes weremoistened with methylcellulose sodium (Celluvisc, Allergan Inc.,USA) to ensure good electrical contact and to keep the corneashydrated during the experiment.
2.3. Visual stimulation
Pattern ERGs were recorded in response to contrast reversal ofhorizontal black and white square wave bar gratings with a meanluminance of 50 photopic (ph) cd/m2 (calibrated using a spotphotometer, model LS-100 Minolta Camera Co., Ltd. Osaka, JP), andmore appropriate for mouse M-cones, 45 scotopic (sc) cd/m2
(calibrated using model IL 1700 with a scotopic filter, InternationalLight, Peabody MA, USA). The standard grating contrast was 90%,with a 1 Hz reversal rate, and spatial frequency of 0.05 cy/deg. Itwas displayed on an RGB monitor 28 cm high by 34 cm wide (modelHL7955SFK; Mitsubishi Electric Corporation, Nagasaki, JP) ata distance of 20 cm from the mouse’s eye. The spatial frequency andapproximate contrast have been reported to maximize pattern ERGamplitude in the mouse (Porciatti, 2007). For a subset of animals,contrasts between 50 and 90% were used to ensure that the

G. Miura et al. / Experimental Eye Research 89 (2009) 49–62 51
amplitude of both positive (P1) and negative (N2) portions of theresponse was optimized. The stimulus display contained four fullcycles of the grating. The center of visual stimulus was aligned withthe projection of the pupil. A typical protocol consisted of a series of6 consecutive responses to 300 contrast reversals each, and thenthe1800 reversals were averaged.
Flash ERGs were measured after intravitreal drug injection(about 1 h – see below) and before the pattern ERG recording tomake sure that drug injections took effect adequately, and todocument effects on the flash ERG. The flash ERG stimulus con-sisted of a brief ganzfeld flash of short duration (<4 ms) on a rod-suppressing background of 2.6 log sc td (63 cd s/m2 seen througha 3 mm diameter pupil). These full-field flash stimuli were providedby green light-emitting diodes (LEDs) whose peak wavelength(lmax¼ 513 nm) was near that both of mouse M-cones (Jacobs et al.,1991; Lyubarsky et al., 1999) and rods (hence the scotopic calibra-tion). Stimulus strengths ranged from 0.4 to 2.5 log sc td s, witha flash interval of 1.0 s. The ganzfeld stimuli were produced bya monocular mini-ganzfeld stimulator (Espion Colorburst stimu-lator, Diagnosys Ltd, Lowell, MA, USA). Animals were adapted to thebackground light for 45 min before recording to ensure completelight adaptation and a stable photopic response (Kaneko et al.,2006). Time zero was taken to be the half-way through the flash.Responses were averages of 15 flashes for each of the stimulusenergies.
2.4. Intravitreal injections
Under a dissecting microscope (10�), a small hole was punc-tured in the eye just behind the limbus of one eye with a 30-gaugeneedle, and a glass pipette (tip w20 mm) was inserted through thehole. The following pharmacologic agents (all from Sigma Aldrich,USA) were injected (1.0–1.2 ml) using a Hamilton Microsyringe(Hamilton Company, Reno, NV, USA). PDA (cis-2,3-piperidine-dicarboxylic acid, 5.2 mM) to block transmission to hyperpolarizing(Off) bipolar, horizontal and inner retinal cells (Bush and Sieving,1994; Slaughter and Miller, 1983), TTX (tetrodotoxin, 5 mM) to blockNaþ-dependent spiking activity, APB (L-2 amino-4-phosphonobu-tyric acid, 1.4 mM) to block the activities of the postreceptoral ONpathway at depolarizing bipolar cells (Slaughter and Miller, 1981),and mixed solutions of APBþ TTX and PDA þ TTX. Final intravitrealdoses of drugs were based on an estimated vitreal volume of 20 ml.Concentrations of drugs were chosen on the basis of those used inprevious ERG studies in mice (Shirato et al., 2008), cats (Robson andFrishman, 1995) and primates (Rangaswamy et al., 2004; Viswa-nathan et al., 1999). After drug injection, the ERG was monitoreduntil no further change was seen in the response to ensure that datawere obtained only when the flash ERG had stabilized. Responsesgenerally stabilized within an hour of the time of injection.
2.5. Unilateral optic nerve crush (ONC)
Before crushing the optic nerve, pattern and flash ERGs wererecorded to confirm that responses were normal. Then undera dissecting microscope (10�), a small incision was made in theconjunctiva temporally, and it was gently peeled back to theposterior region of the eyeball with care not to cut any vessels. Theoptic nerve was then exposed using blunt forceps and a retractor.The nerve was crushed with the forceps for 3 s under direct visu-alization. Crush was done with a blunt instrument, instead oftransection with a sharp instrument because a sinus filled withblood impeded access to the nerve. After the forceps were removed,a drop of anti-microbial ointment (AK-Spore, Akorn, USA) wasapplied to the conjunctiva. We confirmed by direct ophthalmo-scopic inspection that there was no bleeding from retinal blood
vessels or retinal whitening due to retinal artery occlusion aroundthe optic nerve head that would indicate ischemic changes thatcould affect the ERG. After these procedures, all instruments andsurfaces were scrubbed with anti-microbial soap, and instrumentswere sterilized for future use (Hot Bread Sterilizer, Fine ScienceTools, Inc., USA). Since the loss of ganglion cells occurs over 3–4week period following ONC (Li et al., 1999), final recordings weredone 39–42 days post ONC to ensure that ganglion cells haddegenerated. Ganglion cell loss was confirmed in histologicalsections using immunocytochemical analysis. Animals in whichmany ganglion cells were still present in the retina subsequent toONC also were eliminated from the sample.
2.6. Cell counting
After mice were euthanized, the eyes were excised from thehead, and the corneas and lenses were removed. The eyecups werefixed in 4% paraformaldehyde in cocodylate buffer solution (pH 7.4)at room temperature for 30 min. After rinsing with PBS, eyecupswere cryoprotected in 30% sucrose in PBS for at least 24 h,embedded in OCT (Tissue-Tek, Elkhart, IN) and flash frozen in liquidnitrogen. Retinal blocks were stored at�80 �C prior to sectioning at10 mm. Immunolabeling was performed on frozen sections usingimmunofluorescent method as previously described (Sherry andHeidelberger, 2005; Sherry et al., 2003; Wang et al., 2003). Sectionswere thawed, rinsed with Nano-pure water, treated with 1% NaBH4
for 2 min and rinsed with Nano-pure water and PBS. After incu-bation in blocker (10% NGS, 5% bovine serum, 1% fish gelatin, and0.5% Triton X-100 in PBS) for 2 h at room temperature, sectionswere incubated with primary antibodies for 2 days at 4 �C. Toidentify the cell types, double labeling was done with specific cellmarker antibodies to a ganglion cell marker, Brn3a (ChemiconInternational, Temecula, CA, USA; host, mouse; dilution 1:30 to 50)and with 40,6 diamidino 2 phenylindole (DAPI), which stainsdouble-stranded DNA and hence labels nuclei of all retinal cells.Brn3a proteins are found in a large fraction of ganglion cells (w80%)(Xiang et al., 1995). In a few cases g aminobutyric acid (GABA) alsowas used (gift from Dr. DV Pow, University of Queensland, AU; host,rabbit; dilution, 1:1000). GABA is the inhibitory neurotransmitterreleased by many amacrine cells, and most displaced amacrine cells(Kao and Sterling, 2006; Perez De Sevilla Muller et al., 2007; Wassleet al., 1987). After sections were washed with PBS and incubated inblocker for 30 min, secondary antibodies were applied for 1 h atroom temperature. The following secondary antibodies were used:Alexa 488-coupled goat anti-rabbit IgG antibody (1:400; MolecularProbes, Eugene, OR), Cy3-coupled goat anti-mouse IgG antibody(1:400; Jackson Immunoresearch Laboratories, West Grove, PA).After PBS and nano-pure water rinses, sections were coverslippedin Vectashield mounting medium containing a fade-retardantmounting medium with DAPI (Vector Labs Inc, Burlingame CA,USA). For conventional microscopy, gray-scale images werecaptured from an Olympus IX 70 and frame-averaged (24–32frames/image) to reduce noise. For confocal microscopy, performedbut not illustrated in this paper, the sections were visualized andimaged using Leica TCS SP2 microscope and LCS software (LeicaMicrosystems, Exton, PA, USA). Stacks of serial optical sections werecollected and generated into a single image using maximumprojection. To avoid bleed through of signals, each fluorescencechannel was sequentially imaged. The images were imported intoPhotoshop Cs2 (Adobe Systems, Inc., Mountain View, CA, USA) forfurther analysis. To assess the colocalization in double labeling, thematching images taken via different channels were pseudocoloredand superimposed. Image scales were calibrated, and brightnessand contrast were adjusted if necessary. Single labeling appearedblue, green or red.
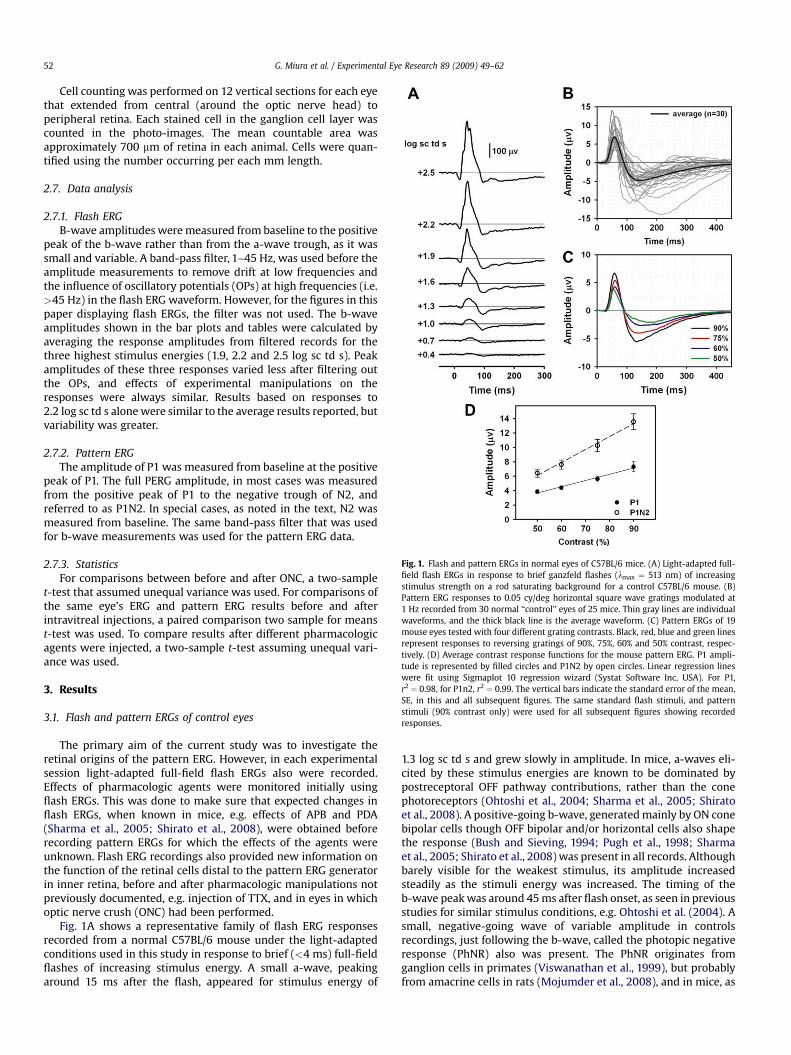
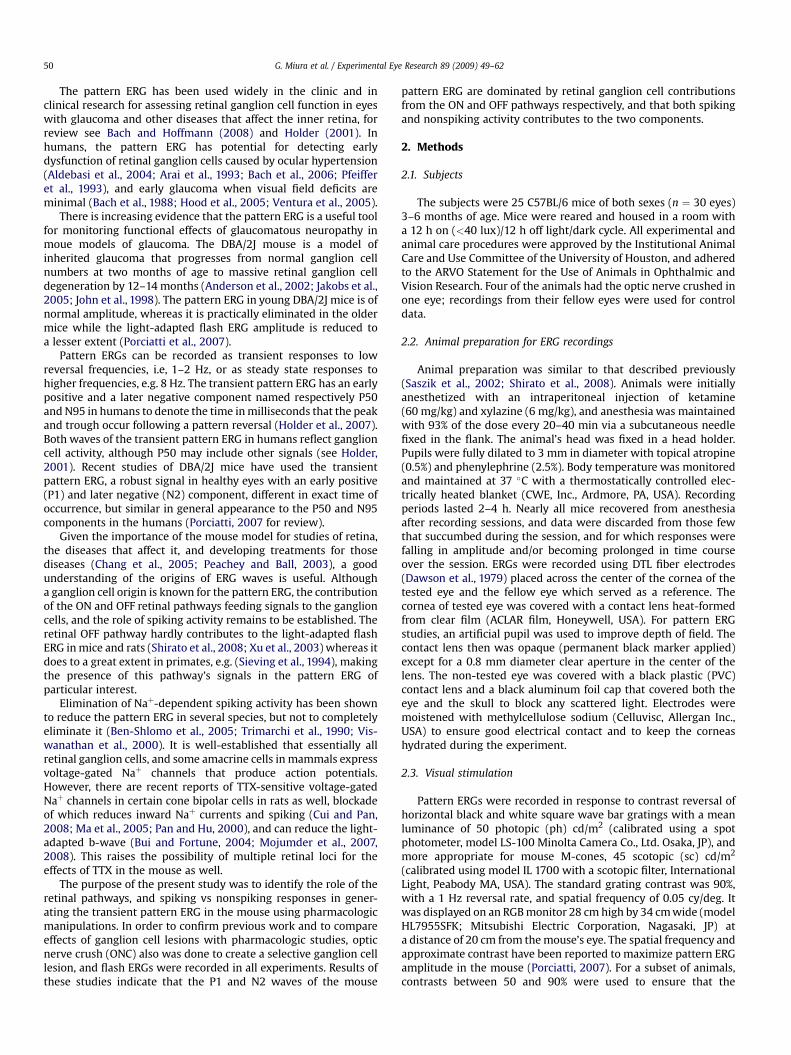
Fig. 1. Flash and pattern ERGs in normal eyes of C57BL/6 mice. (A) Light-adapted full-field flash ERGs in response to brief ganzfeld flashes (lmax ¼ 513 nm) of increasingstimulus strength on a rod saturating background for a control C57BL/6 mouse. (B)Pattern ERG responses to 0.05 cy/deg horizontal square wave gratings modulated at1 Hz recorded from 30 normal ‘‘control’’ eyes of 25 mice. Thin gray lines are individualwaveforms, and the thick black line is the average waveform. (C) Pattern ERGs of 19mouse eyes tested with four different grating contrasts. Black, red, blue and green linesrepresent responses to reversing gratings of 90%, 75%, 60% and 50% contrast, respec-tively. (D) Average contrast response functions for the mouse pattern ERG. P1 ampli-tude is represented by filled circles and P1N2 by open circles. Linear regression lineswere fit using Sigmaplot 10 regression wizard (Systat Software Inc, USA). For P1,r2 ¼ 0.98, for P1n2, r2 ¼ 0.99. The vertical bars indicate the standard error of the mean,SE, in this and all subsequent figures. The same standard flash stimuli, and patternstimuli (90% contrast only) were used for all subsequent figures showing recordedresponses.
G. Miura et al. / Experimental Eye Research 89 (2009) 49–6252
Cell counting was performed on 12 vertical sections for each eyethat extended from central (around the optic nerve head) toperipheral retina. Each stained cell in the ganglion cell layer wascounted in the photo-images. The mean countable area wasapproximately 700 mm of retina in each animal. Cells were quan-tified using the number occurring per each mm length.
2.7. Data analysis
2.7.1. Flash ERGB-wave amplitudes were measured from baseline to the positive
peak of the b-wave rather than from the a-wave trough, as it wassmall and variable. A band-pass filter, 1–45 Hz, was used before theamplitude measurements to remove drift at low frequencies andthe influence of oscillatory potentials (OPs) at high frequencies (i.e.>45 Hz) in the flash ERG waveform. However, for the figures in thispaper displaying flash ERGs, the filter was not used. The b-waveamplitudes shown in the bar plots and tables were calculated byaveraging the response amplitudes from filtered records for thethree highest stimulus energies (1.9, 2.2 and 2.5 log sc td s). Peakamplitudes of these three responses varied less after filtering outthe OPs, and effects of experimental manipulations on theresponses were always similar. Results based on responses to2.2 log sc td s alone were similar to the average results reported, butvariability was greater.
2.7.2. Pattern ERGThe amplitude of P1 was measured from baseline at the positive
peak of P1. The full PERG amplitude, in most cases was measuredfrom the positive peak of P1 to the negative trough of N2, andreferred to as P1N2. In special cases, as noted in the text, N2 wasmeasured from baseline. The same band-pass filter that was usedfor b-wave measurements was used for the pattern ERG data.
2.7.3. StatisticsFor comparisons between before and after ONC, a two-sample
t-test that assumed unequal variance was used. For comparisons ofthe same eye’s ERG and pattern ERG results before and afterintravitreal injections, a paired comparison two sample for meanst-test was used. To compare results after different pharmacologicagents were injected, a two-sample t-test assuming unequal vari-ance was used.
3. Results
3.1. Flash and pattern ERGs of control eyes
The primary aim of the current study was to investigate theretinal origins of the pattern ERG. However, in each experimentalsession light-adapted full-field flash ERGs also were recorded.Effects of pharmacologic agents were monitored initially usingflash ERGs. This was done to make sure that expected changes inflash ERGs, when known in mice, e.g. effects of APB and PDA(Sharma et al., 2005; Shirato et al., 2008), were obtained beforerecording pattern ERGs for which the effects of the agents wereunknown. Flash ERG recordings also provided new information onthe function of the retinal cells distal to the pattern ERG generatorin inner retina, before and after pharmacologic manipulations notpreviously documented, e.g. injection of TTX, and in eyes in whichoptic nerve crush (ONC) had been performed.
Fig. 1A shows a representative family of flash ERG responsesrecorded from a normal C57BL/6 mouse under the light-adaptedconditions used in this study in response to brief (<4 ms) full-fieldflashes of increasing stimulus energy. A small a-wave, peakingaround 15 ms after the flash, appeared for stimulus energy of
1.3 log sc td s and grew slowly in amplitude. In mice, a-waves eli-cited by these stimulus energies are known to be dominated bypostreceptoral OFF pathway contributions, rather than the conephotoreceptors (Ohtoshi et al., 2004; Sharma et al., 2005; Shiratoet al., 2008). A positive-going b-wave, generated mainly by ON conebipolar cells though OFF bipolar and/or horizontal cells also shapethe response (Bush and Sieving, 1994; Pugh et al., 1998; Sharmaet al., 2005; Shirato et al., 2008) was present in all records. Althoughbarely visible for the weakest stimulus, its amplitude increasedsteadily as the stimuli energy was increased. The timing of theb-wave peak was around 45 ms after flash onset, as seen in previousstudies for similar stimulus conditions, e.g. Ohtoshi et al. (2004). Asmall, negative-going wave of variable amplitude in controlsrecordings, just following the b-wave, called the photopic negativeresponse (PhNR) also was present. The PhNR originates fromganglion cells in primates (Viswanathan et al., 1999), but probablyfrom amacrine cells in rats (Mojumder et al., 2008), and in mice, as
G. Miura et al. / Experimental Eye Research 89 (2009) 49–62 53
subsequent figures in the present study suggest. Oscillatorypotentials (OPs) which also are thought to originate from amacrineand perhaps ganglion cells of the inner retina, for reviews seeFrishman (2005) and Wachtmeister (1998), could be seen super-imposed on the b-wave for most stimuli stronger than 1.3 log sc td.In some animals, and with some pharmacologic manipulations, theOPs were more or less prominent, as can be seen in later sections ofthe results. For measurement of b-wave amplitudes, shown insubsequent figures and Table 2, the OPs were filtered out, asdescribed in the Methods section.
Transient pattern ERG responses to reversals at 1 Hz of highcontrast (90%), with a rod saturating mean luminance, wereobtained from 30 normal ‘‘control’’ eyes of 25 C57BL/6 mice. Fig. 1Bshows the pattern ERG waveforms (gray lines) for all 30 eyes as wellas the average waveform (black line) for the group. The pattern ERGconsisted of a prominent positive component that peaked, onaverage, around 60 ms after each reversal (P1), with little variabilityacross animals and contrasts. P1 was followed by a slower negativecomponent (N2) whose trough was on average around 132 ms aftereach reversal for the highest contrast of 90%, 138 ms for 75%, 148 msfor 60%, and 189 ms for 50%. However the N2 timing was variable,and in few records measured at 90% contrast, the trough occurredas late as 200 ms after each pattern reversal. Although the exactpeak times are later in humans, these waves are similar inappearance to the P50 and N95 waves of the human pattern ERG,named for the peak (or trough) time. The human pattern ERG alsohas an initial negative component called N35, which would betermed, N1 in these mouse studies, if it were obvious in the records.For control mouse eyes, the pattern ERG was a robust response: themean peak amplitude (90% contrast) of P1, measured from thebaseline was 7.4 mV (SE ¼ 0.6), and the mean amplitude of the peakto trough (P1N2) was 13.3 mV (SE¼ 0.9). The ratio, P1N2/P1 was 1.9,indicating that the amplitude of P1, on average was just slightlygreater than that of N2.
Fig. 2. Flash and pattern ERGs following optic nerve crush and retinal ganglion cell degenerunilateral optic nerve crush (ONC) in four mice. The inset plots show flash ERGs for the same
To ensure that the highest contrast was the appropriate one touse, i.e. that it produced the largest P1 and N2 waves, but thatresponses were not saturated, pattern ERGs also were recordedusing three lower contrasts. Fig. 1C shows average pattern ERGs(n ¼ 19) for each of four contrasts ranging from 50% to 90%. ThePERG amplitude increased monotonically as contrast was increased(Fig. 1D) and the amplitudes of both waves were greatest for 90%contrast. Similar characteristics of the mouse PERG, and its relationto contrast have been described previously (Porciatti, 2007).
3.2. Effect of unilateral optic nerve crush (ONC) on the flashand pattern ERG
As noted in the Introduction, previous work in a number ofspecies, including mice, has shown that generation of the patternERG relies upon the functional integrity of the retinal ganglion cells.In the present work to confirm this finding for the strain of mice,C57BL/6, and stimulus and recording conditions used for ourstudies of pattern ERG origins, the effects of ganglion cell loss due tounilateral ONC were studied in four mice. Fig. 2(A–D) shows theflash ERG responses to the strongest flash (2.5 log sc td s) in theinsets to each plot, and the pattern ERGs in the main plots for eachof the four mice. The black lines show the control records acquiredbefore ONC, and the red lines show responses 39–42 days after theONC operations. Fig. 2 and Table 1 show that b-wave amplitudesbefore and 39–42 days after ONC were not significantly different.For this and subsequent figures, the b-wave amplitude measure-ment reflects the average of the responses to the three strongestflashes, for the range of stimulus energies illustrated in Fig. 1A. Asmall elevation of the tail of the b-wave after ONC in the region ofthe PhNR, occurred removing the response, at least at its normaltime of occurrence. Given the small size of the negative wave,results were not quantified. In contrast to the effects on the flashERG, the figure and table show that for the PERG, ONC led to
ation. (A–D) Individual pattern ERGs before (black line) and 39–42 days after (red line)ONC eye elicited by a þ2.5 log sc td s flash before (black line) and after (red line) ONC.

Table 1Effects of ONC on pattern ERGs, flash ERGs and number of cells in the ganglion cell layer.
A. Flash ERG and PERG amplitudes and P-values for comparison of amplitudes before and after ONC operationMouse P1 P1N2 P1N2/P1 b-Wave
Before After Before After Before After Before After
1281 7.4 1.2 21.3 2.6 2.9 2.2 178.0 194.51282 12.5 2.1 19.1 4.1 1.5 2.0 215.0 196.91283 9.4 0 13.7 0 1.5 0 181.7 157.41285 14.1 1.0 25.0 2.3 1.8 2.4 134.5 144.1
Average 10.8 � 1.5 1.1 � 0.4 19.8 � 2.4 2.3 � 0. 1.9 � 0.3 1.6 � 1.1 177.3 � 16.5 173.2 � 13.2P-value 0.007* 0.003* 0.59 0.71
B. Number of cells (per mm) and P-values for comparison of numbers before and after ONC operationBefore After P-value
DAPI (n ¼ 4) 100.16 � 1.7 69.91 � 3.3 0.0005*Brn3A (n ¼ 4) 39.83 � 0.46 1.91 � 0.5 2.2 � 10�9*
Average data are expressed as the mean � SE.For comparisons between before and after ONC, a two-sample t-test that assumed unequal variance was used.*P � 0.003.
G. Miura et al. / Experimental Eye Research 89 (2009) 49–6254
significant reductions in amplitude for both P1 and N2 (P1N2),leaving only small positive and negative waves, or no response at allin the case of mouse #1283.
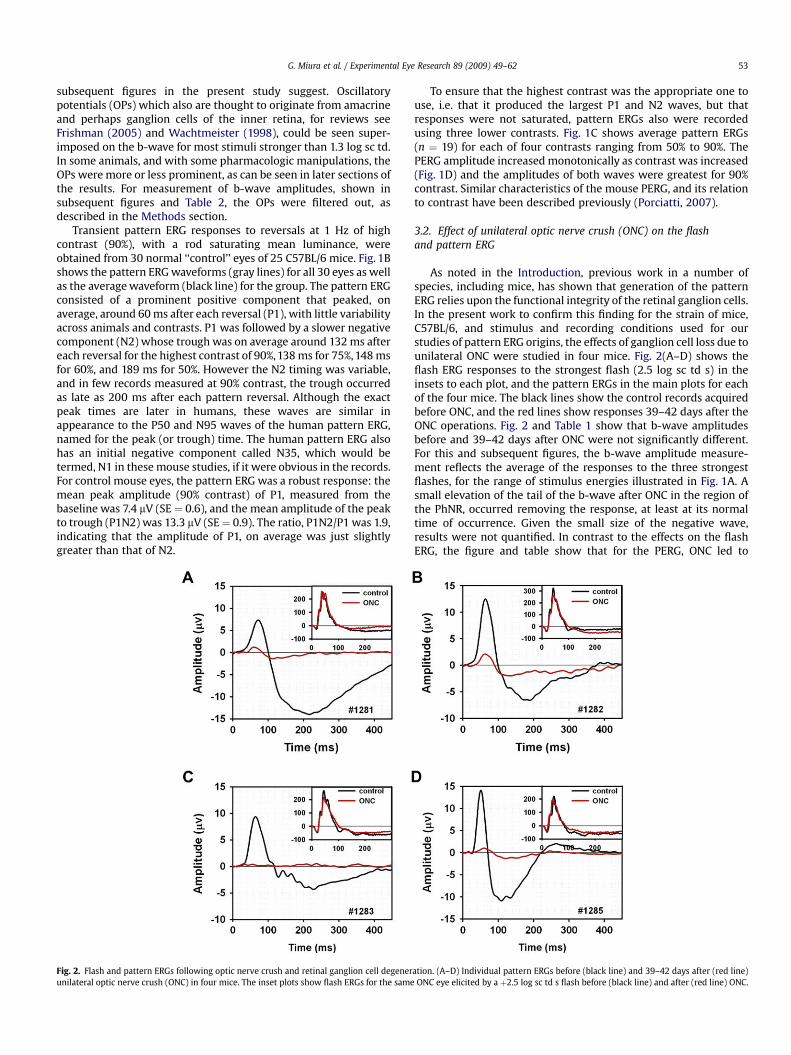
To confirm that the ONC procedure reduced the ganglion cellpopulation, retinas were removed for histological processing afterERG recordings were completed. Cell counts were made in theretinal ganglion cell layer of the eye after ONC, and its fellow eye.Retinas were stained with DAPI (blue) to show, as described in theMethods section, all cells’ nuclei, and Brn3a (green) to label, in thecontrol eye, about 80% of the retinal ganglion cells (Xiang et al.,1995). Fig. 3 shows DAPI and Brn3a-stained sections from an eyeabout 40 days after ONC, and its fellow eye. Inspection of the figureindicates that outer and inner nuclear layers were similar in the twoeyes, but in the ONC eye, the retinal ganglion cell layer was lackingcells, especially cells labeled for Brn3a. This figure also shows GABAstaining in red. GABA is released by many amacrine cells and theirprocesses distal to the ganglion cell layer, as well as most of thedisplaced amacrine cells in the ganglion cell layer (Kao and Sterling,2006; Perez De Sevilla Muller et al., 2007; Wassle et al., 1987). TheGABA staining was similar in the two eyes, in the inner nuclear, andinner plexiform layer, and in the ganglion cell layer, as well. Thepresence of normal GABA staining in the ganglion cell layer indi-cated that displaced amacrine cells, which make up about 60% ofthe cell population in the ganglion cell layer of mice (Jeon et al.,1998) were still present following ONC.
Fig. 3G and H illustrate, using bar graphs, for the four mice afterONC, the counted number of cells per mm in the ganglion cell layerin retinal sections from ONC and control fellow eyes stained withDAPI and Brn3a. The average values appear in Table 1 as well. DAPIstained cells in the ganglion cell layer were reduced to about 60% ofcontrol in three of the ONC eyes, and 75% in the remaining one,whereas Brn3a-stained cells were almost eliminated in all eyes,with less than 5% of control present in the eyes after ONC. Theseresults are consistent with substantial loss of retinal ganglion cellsin eyes following ONC.
3.3. Effect of TTX on the flash and pattern ERG
Sodium dependent action potentials occur in retinal ganglioncells, and some amacrine cells in the inner retina. As noted in theIntroduction recent studies in rat retina have indicated presence ofTTX-sensitive voltage-gated Naþ channels in cone bipolar cells inrats as well (Bui and Fortune, 2004; Cui and Pan, 2008; Ma et al.,2005; Mojumder et al., 2007, 2008; Pan and Hu, 2000). In order to
investigate the role of voltage-gated Naþ channels in generation ofthe flash ERG and pattern ERG in mice, one eye of each of foursubjects was injected with TTX.
Fig. 4A shows a typical flash ERG for one mouse eye before andafter TTX injection. In this and subsequent figures, the controlresponse before injection is shown by the black line, the response,about an hour after injection, is shown with a red line. The mostobvious effect of TTX on the flash ERG was a reduction of the b-wave in response to flash energies of 1.6 log sc td s or greater. TTXreduced the b-wave amplitudes, measured after filtering responsesto remove OPs, by about 60% for the four mice tested (Fig. 4C andTable 2), which was at least a great as the reduction seen in ratlight-adapted ERG (Bui and Fortune, 2004; Mojumder et al., 2008).Another effect of the TTX was to delay the rise of the b-wave. The a-wave amplitude was slightly increased because the wave lastedlonger before the b-wave began to rise. This small effect wasconsistent, but not quantified. TTX also caused the OPs to becomemore prominent in responses to the lower energies, and prolongedthe tail of the b-wave for the strongest two stimuli, therebyreducing the small PhNR that occurred after the b-wave in thecontrol eye.
Fig. 4B shows the average PERG (n ¼ 4) before and after TTXinjections; individual results after injection are shown in the insetin this and subsequent figures that illustrate pattern ERGs. Fig. 4Band C and Table 2 show that both PI and P1N2 were significantlyreduced by TTX. TTX reduced P1 amplitude by about 76% and P1N2amplitude by about 54%. TTX also delayed both components of thepattern ERG, P1 peak time by 12.5 ms (SE ¼ 3.2), and the trough ofN2 by 41.0 ms (SE ¼ 8.8). Mean P1N2/P1 ratios (Table 2) doubledafter TTX injection, reflecting the relatively larger amplitude of thenegative-going response, than the positive one after blockade ofspiking activity.
3.4. Effect of PDA on the flash and pattern ERG
Another pharmacologic agent that affects amacrine andganglion cell responses is the ionotropic glutamate receptorantagonist, PDA. In addition to blocking activation of amacrine andganglion cells, it also blocks activation of OFF bipolar cells andhorizontal cells (Slaughter and Miller, 1983). Fig. 5A shows the flashERG for one mouse eye before and after PDA injection. After PDAinjection, the a-wave was eliminated, as observed originally inmonkey (Bush and Sieving, 1994) and previously in mice as well forthese or similar stimuli (Sharma et al., 2005; Shirato et al., 2008),
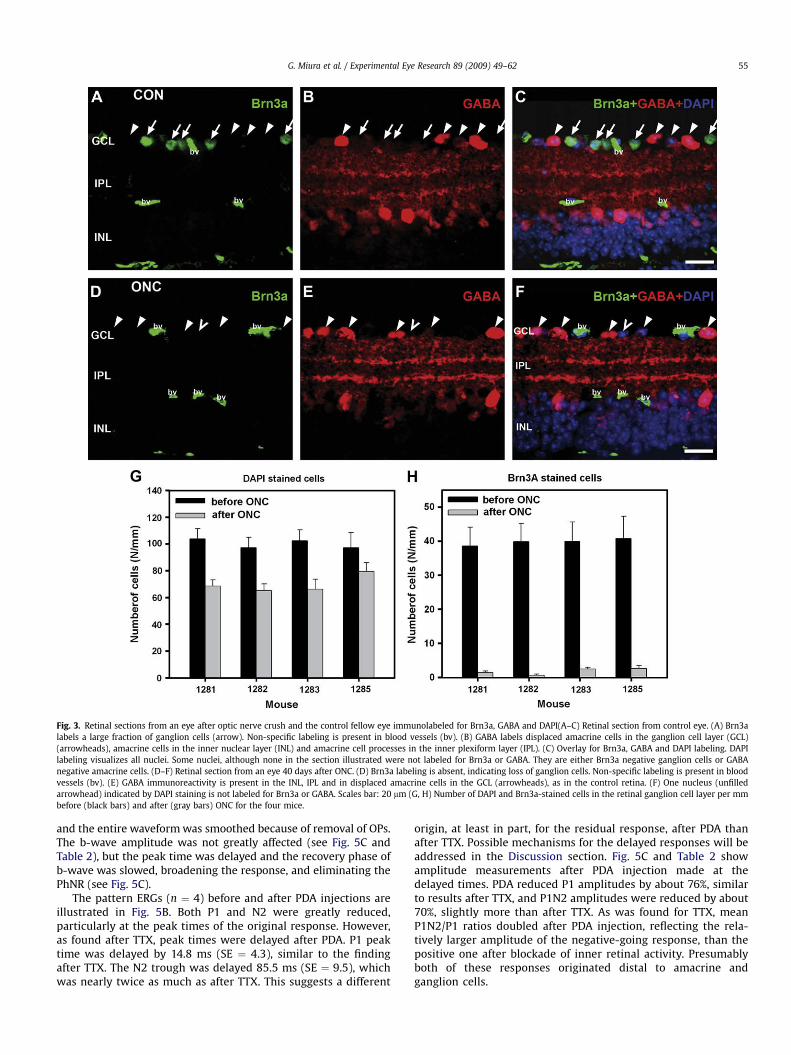
Fig. 3. Retinal sections from an eye after optic nerve crush and the control fellow eye immunolabeled for Brn3a, GABA and DAPI(A–C) Retinal section from control eye. (A) Brn3alabels a large fraction of ganglion cells (arrow). Non-specific labeling is present in blood vessels (bv). (B) GABA labels displaced amacrine cells in the ganglion cell layer (GCL)(arrowheads), amacrine cells in the inner nuclear layer (INL) and amacrine cell processes in the inner plexiform layer (IPL). (C) Overlay for Brn3a, GABA and DAPI labeling. DAPIlabeling visualizes all nuclei. Some nuclei, although none in the section illustrated were not labeled for Brn3a or GABA. They are either Brn3a negative ganglion cells or GABAnegative amacrine cells. (D–F) Retinal section from an eye 40 days after ONC. (D) Brn3a labeling is absent, indicating loss of ganglion cells. Non-specific labeling is present in bloodvessels (bv). (E) GABA immunoreactivity is present in the INL, IPL and in displaced amacrine cells in the GCL (arrowheads), as in the control retina. (F) One nucleus (unfilledarrowhead) indicated by DAPI staining is not labeled for Brn3a or GABA. Scales bar: 20 mm (G, H) Number of DAPI and Brn3a-stained cells in the retinal ganglion cell layer per mmbefore (black bars) and after (gray bars) ONC for the four mice.
G. Miura et al. / Experimental Eye Research 89 (2009) 49–62 55
and the entire waveform was smoothed because of removal of OPs.The b-wave amplitude was not greatly affected (see Fig. 5C andTable 2), but the peak time was delayed and the recovery phase ofb-wave was slowed, broadening the response, and eliminating thePhNR (see Fig. 5C).
The pattern ERGs (n ¼ 4) before and after PDA injections areillustrated in Fig. 5B. Both P1 and N2 were greatly reduced,particularly at the peak times of the original response. However,as found after TTX, peak times were delayed after PDA. P1 peaktime was delayed by 14.8 ms (SE ¼ 4.3), similar to the findingafter TTX. The N2 trough was delayed 85.5 ms (SE ¼ 9.5), whichwas nearly twice as much as after TTX. This suggests a different
origin, at least in part, for the residual response, after PDA thanafter TTX. Possible mechanisms for the delayed responses will beaddressed in the Discussion section. Fig. 5C and Table 2 showamplitude measurements after PDA injection made at thedelayed times. PDA reduced P1 amplitudes by about 76%, similarto results after TTX, and P1N2 amplitudes were reduced by about70%, slightly more than after TTX. As was found for TTX, meanP1N2/P1 ratios doubled after PDA injection, reflecting the rela-tively larger amplitude of the negative-going response, than thepositive one after blockade of inner retinal activity. Presumablyboth of these responses originated distal to amacrine andganglion cells.

Fig. 4. Effect of TTX on the flash pattern ERG. (A) Light-adapted flash ERGs recorded from a mouse eye before (black lines) and after (red lines) TTX injection. (B) Average patternERG before (black line) and after (red line) TTX injection for four mice. In this and subsequent figures, the flash ERGs were recorded from one of the four mice for which pattern ERGswere recorded. The inset plot shows the individual pattern ERGs (gray lines) for the four mice after TTX injection, and the same average waveform (red line) that is shown in themain plot. (C) Average amplitudes before (black bars) and after (gray bars) TTX injection of P1 and P1N2 of the pattern ERG, the P1N2/P1 ratio and the amplitude of the b-wave,averaged in this and subsequent figures over the responses to the three strongest flashes, filtered to include only those signals between 1 Hz and 45 Hz.
G. Miura et al. / Experimental Eye Research 89 (2009) 49–6256
3.5. Effect of APB on the flash and pattern ERG
To examine the role of ON and OFF retinal pathways in gener-ating the PERG, APB, a metabotropic glutamate receptor analoguewas used. APB prevents transfer of cone signals to ON cone bipolarcells, leaving the OFF pathway signaling intact (Slaughter andMiller, 1981).
Fig. 6A shows the typical effect of APB on the flash ERG. Asexpected from many previous studies, including studies in mice,e.g. Sharma et al. (2005), Shirato et al. (2008), APB eliminated the b-wave, leaving a negative ERG composed of cone photoreceptor, OFFpathway, and possibly glial responses. The late positive intrusionstarting about 40–50 ms after stimulus onset in mice lacking b-waves has been found to be PDA sensitive, and therefore has anorigin in the OFF pathway (Koyasu et al., 2008; Shirato et al., 2008).
Pattern ERGs (Fig. 6B, n ¼ 3) after APB injections no longercontained a P1 component, but N2 was present, commencing much
Table 2Pattern and flash ERG amplitudes before and after pharmacologic blockade.
Agent P1 P1N2
Before (mV) After (mV) Before (mV) After
TTX (n ¼ 4) 4.5 � 0.7 1.1 � 0.2* 9.7 � 1.0 4.5 �PDA (n ¼ 4) 7.1 � 1.5 1.7 � 0.7 13.8 � 3.0 4.2 �APB (n ¼ 3) 5.7 � 0.8 – 9.4 � 1.3 4.5 �APB þ TTX (n ¼ 3) 8.7 � 1.9 – 16.0 � 2.9 2.5 �PDA þ TTX (n ¼ 4) 7.5 � 0.8 1.5 � 0.3** 12.6 � 0.4 3.2 �
Data are expressed as the mean (mV) � SE.Statistics were not done for results after APB and APB þ TTX when P1 of the PERG and thein this table were calculated by averaging the response amplitudes from filtered records (paired comparison two sample for means t-test was used for these statistics where resu*P < 0.05; **P < 0.01; ***P < 0.001; and þP ¼ 0.056.
earlier than in control eyes, but then of similar time course andamplitude to the control responses. Fig. 6C and Table 2 showamplitudes for P1 and P1N2. After APB, P1 was eliminated, andtherefore no amplitude measurements were made. For measure-ments of P1N2, P1 was assumed to be at the zero amplitudebaseline, and the measured amplitude was just that of N2. Theamplitude of N2 after APB was, on average, about 0.8 mV larger thanthat of N2 before APB (P1N2 � P1), but this was not significant. Theearly onset of N2 may reflect the normal time course of N2, whennot obscured by P1.
3.6. Effect of APB þ TTX on the flash and pattern ERG
APB injection appeared to leave the N2 wave of the pattern ERGintact (Fig. 6), suggesting that N2 originates from the OFF pathway.However, it was possible that the remaining response includedsubstantial contributions from cells other than ganglion cells in the
P1N2/P1 b-Wave
(mV) Before After Before (mV) After (mV)
0.6** 2.2 � 0.2 4.5 � 0.9 239.1 � 4.4 94.3 � 5.0***0.5* 2.0 � 0.05 4.0 � 1.9 239.9 � 21.0 232.1 � 340.4þ 1.7 � 0.03 – 214.3 � 35.3 –0.2* 1.9 � 0.3 – 251.7 � 35.0 –0.6*** 1.7 � 0.2 2.2 � 0.2** 178.5 � 12.0 186.0 � 29
b-wave of the flash ERG were completely eliminated. The b-wave amplitudes shownto remove OPs) for the three highest stimulus energies (1.9, 2.2 and 2.5 log sc td s). Alts were compared for the same eye before and after injection.
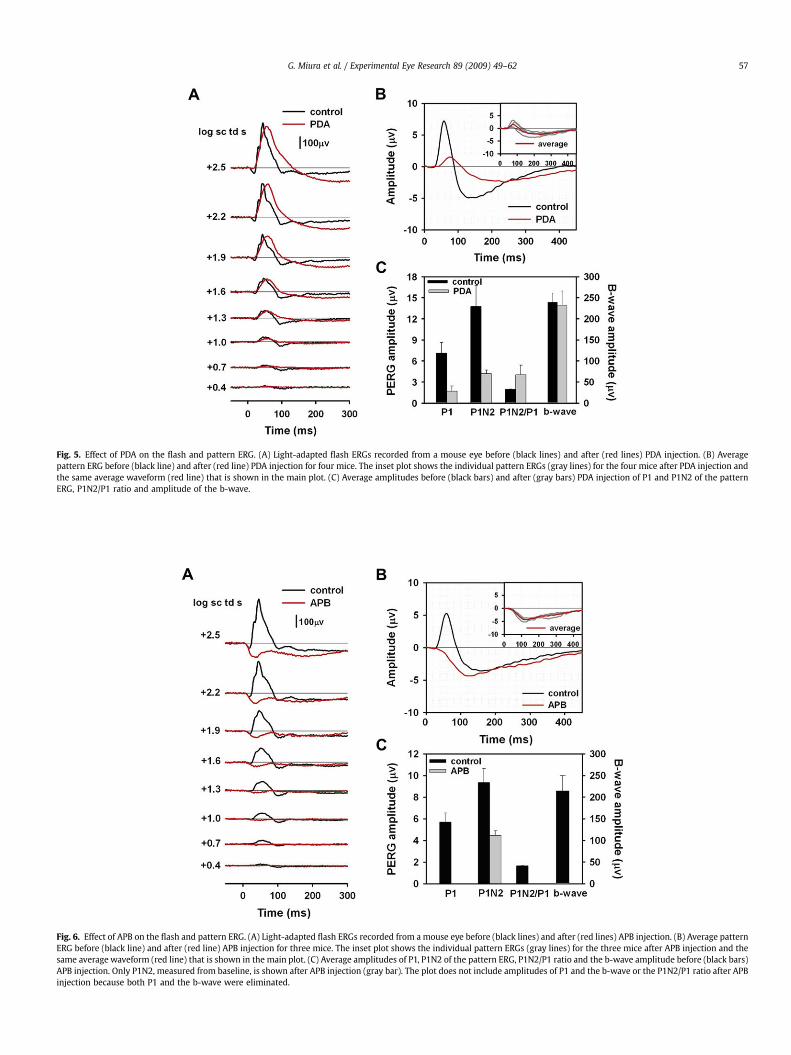
Fig. 5. Effect of PDA on the flash and pattern ERG. (A) Light-adapted flash ERGs recorded from a mouse eye before (black lines) and after (red lines) PDA injection. (B) Averagepattern ERG before (black line) and after (red line) PDA injection for four mice. The inset plot shows the individual pattern ERGs (gray lines) for the four mice after PDA injection andthe same average waveform (red line) that is shown in the main plot. (C) Average amplitudes before (black bars) and after (gray bars) PDA injection of P1 and P1N2 of the patternERG, P1N2/P1 ratio and amplitude of the b-wave.
Fig. 6. Effect of APB on the flash and pattern ERG. (A) Light-adapted flash ERGs recorded from a mouse eye before (black lines) and after (red lines) APB injection. (B) Average patternERG before (black line) and after (red line) APB injection for three mice. The inset plot shows the individual pattern ERGs (gray lines) for the three mice after APB injection and thesame average waveform (red line) that is shown in the main plot. (C) Average amplitudes of P1, P1N2 of the pattern ERG, P1N2/P1 ratio and the b-wave amplitude before (black bars)APB injection. Only P1N2, measured from baseline, is shown after APB injection (gray bar). The plot does not include amplitudes of P1 and the b-wave or the P1N2/P1 ratio after APBinjection because both P1 and the b-wave were eliminated.
G. Miura et al. / Experimental Eye Research 89 (2009) 49–62 57
G. Miura et al. / Experimental Eye Research 89 (2009) 49–6258
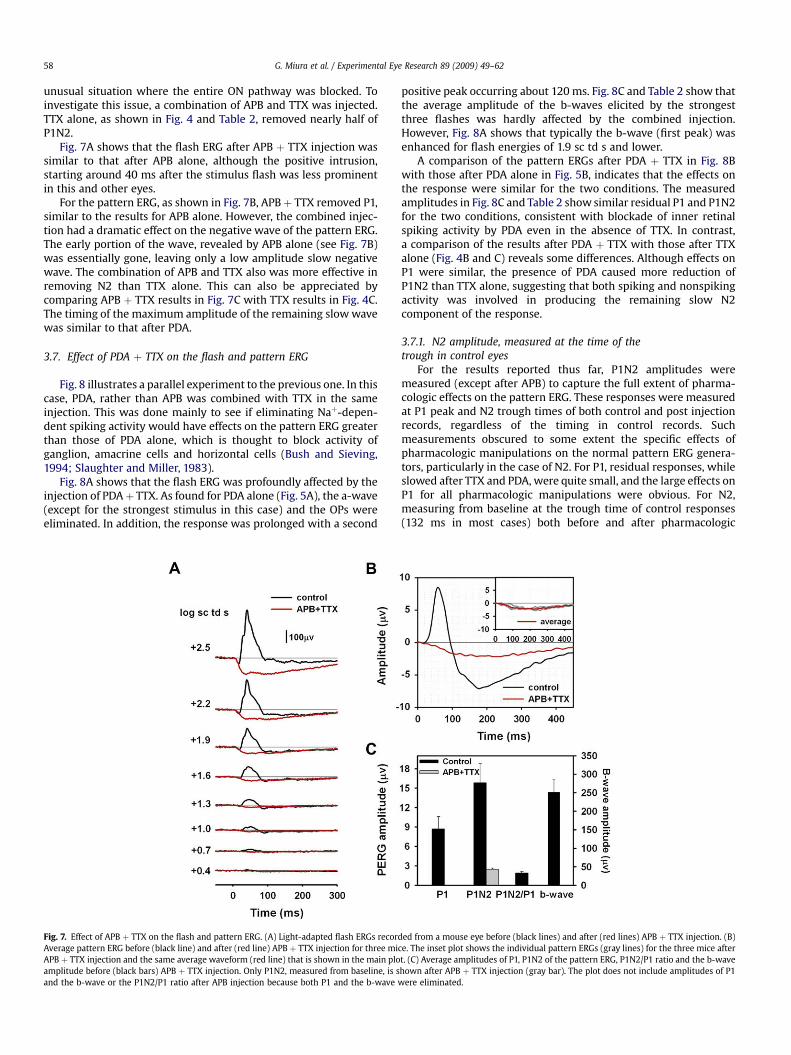
unusual situation where the entire ON pathway was blocked. Toinvestigate this issue, a combination of APB and TTX was injected.TTX alone, as shown in Fig. 4 and Table 2, removed nearly half ofP1N2.
Fig. 7A shows that the flash ERG after APB þ TTX injection wassimilar to that after APB alone, although the positive intrusion,starting around 40 ms after the stimulus flash was less prominentin this and other eyes.
For the pattern ERG, as shown in Fig. 7B, APBþ TTX removed P1,similar to the results for APB alone. However, the combined injec-tion had a dramatic effect on the negative wave of the pattern ERG.The early portion of the wave, revealed by APB alone (see Fig. 7B)was essentially gone, leaving only a low amplitude slow negativewave. The combination of APB and TTX also was more effective inremoving N2 than TTX alone. This can also be appreciated bycomparing APB þ TTX results in Fig. 7C with TTX results in Fig. 4C.The timing of the maximum amplitude of the remaining slow wavewas similar to that after PDA.
3.7. Effect of PDA þ TTX on the flash and pattern ERG
Fig. 8 illustrates a parallel experiment to the previous one. In thiscase, PDA, rather than APB was combined with TTX in the sameinjection. This was done mainly to see if eliminating Naþ-depen-dent spiking activity would have effects on the pattern ERG greaterthan those of PDA alone, which is thought to block activity ofganglion, amacrine cells and horizontal cells (Bush and Sieving,1994; Slaughter and Miller, 1983).
Fig. 8A shows that the flash ERG was profoundly affected by theinjection of PDAþ TTX. As found for PDA alone (Fig. 5A), the a-wave(except for the strongest stimulus in this case) and the OPs wereeliminated. In addition, the response was prolonged with a second
Fig. 7. Effect of APB þ TTX on the flash and pattern ERG. (A) Light-adapted flash ERGs recorAverage pattern ERG before (black line) and after (red line) APB þ TTX injection for three miAPB þ TTX injection and the same average waveform (red line) that is shown in the main ploamplitude before (black bars) APB þ TTX injection. Only P1N2, measured from baseline, is sand the b-wave or the P1N2/P1 ratio after APB injection because both P1 and the b-wave w
positive peak occurring about 120 ms. Fig. 8C and Table 2 show thatthe average amplitude of the b-waves elicited by the strongestthree flashes was hardly affected by the combined injection.However, Fig. 8A shows that typically the b-wave (first peak) wasenhanced for flash energies of 1.9 sc td s and lower.
A comparison of the pattern ERGs after PDA þ TTX in Fig. 8Bwith those after PDA alone in Fig. 5B, indicates that the effects onthe response were similar for the two conditions. The measuredamplitudes in Fig. 8C and Table 2 show similar residual P1 and P1N2for the two conditions, consistent with blockade of inner retinalspiking activity by PDA even in the absence of TTX. In contrast,a comparison of the results after PDA þ TTX with those after TTXalone (Fig. 4B and C) reveals some differences. Although effects onP1 were similar, the presence of PDA caused more reduction ofP1N2 than TTX alone, suggesting that both spiking and nonspikingactivity was involved in producing the remaining slow N2component of the response.
3.7.1. N2 amplitude, measured at the time of thetrough in control eyes
For the results reported thus far, P1N2 amplitudes weremeasured (except after APB) to capture the full extent of pharma-cologic effects on the pattern ERG. These responses were measuredat P1 peak and N2 trough times of both control and post injectionrecords, regardless of the timing in control records. Suchmeasurements obscured to some extent the specific effects ofpharmacologic manipulations on the normal pattern ERG genera-tors, particularly in the case of N2. For P1, residual responses, whileslowed after TTX and PDA, were quite small, and the large effects onP1 for all pharmacologic manipulations were obvious. For N2,measuring from baseline at the trough time of control responses(132 ms in most cases) both before and after pharmacologic
ded from a mouse eye before (black lines) and after (red lines) APB þ TTX injection. (B)ce. The inset plot shows the individual pattern ERGs (gray lines) for the three mice aftert. (C) Average amplitudes of P1, P1N2 of the pattern ERG, P1N2/P1 ratio and the b-wavehown after APB þ TTX injection (gray bar). The plot does not include amplitudes of P1
ere eliminated.

Fig. 8. Effect of PDA þ TTX on the flash and pattern ERG. (A) Light-adapted flash ERGs recorded from a mouse eye before (black lines) and after (red lines) PDA þ TTX injection. (B)Average pattern ERG before (black line) and after (red line) PDA þ TTX injection for four mice. The inset plot shows the individual pattern ERGs (gray lines) for the four mice afterPDA þ TTX injection and the same average waveform (red line) that is shown in the main plot. (C) Average amplitudes of P1, P1N2 of the pattern ERG, P1N2/P1 ratio and the b-waveamplitude before (black bars) and after (gray bars) PDA þ TTX injection.
Table 3N2 amplitude before and after pharmacologic blockade, measured at the time of theN2 trough in control recordings.
Agents N2 @ trough of control Comparison of percent change
Before (mV) After (mV) PDA APB þ TTX PDA þ TTX
TTX (n ¼ 4) 5.2 � 0.5 2.4 � 0.2** P ¼ 0.03a ns P ¼ 0.06a
PDA (n ¼ 4) 5.5 � 2.0 1.1 � 0.6* ns nsAPB (n ¼ 3) 3.7 � 0.3 3.7 � 0.4 P ¼ 0.02a
APB þ TTX (n ¼ 3) 5.0 � 1.3 1.9 � 0.3 ns nsPDA þ TTX (n ¼ 4) 5.3 � 0.7 0.9 � 0.4* ns ns
N2 amplitudes before and after agents listed in column one are expressed incolumns two and three as the mean (mV) � SE. A paired comparison two sample formeans t-test was used to compare results before and after injection in the same eye.*P < 0.05; **P < 0.01; ***P < 0.001.Percent changes in N2 amplitudes were compared for agents named in columns fourthrough six vs agents named in rows three through seven in the left hand column. Tocompare results after different pharmacologic agents were injected, a two-sample t-test assuming unequal variance was used. Results after injections of APB alone werenot compared with those after TTX or PDA, because APB alone did not affect N2amplitude, whereas effects of TTX and PDA were significant.
a The value for the pharmacologic agent in the column was significantly greaterthan the value in the one in the row to which this was compared.
G. Miura et al. / Experimental Eye Research 89 (2009) 49–62 59
manipulations, added additional information. Table 3 shows thatboth TTX and PDA reduced N2 amplitude significantly at time of thecontrol N2 trough, and the effect of PDA was significantly greaterthan that of TTX. Addition of TTX to the APB injection reduced N2amplitude significantly more than APB alone, and the effect ofcombining PDA with TTX showed a reduction beyond that with TTXalone that was nearly significant.
4. Discussion
The main goal of the present study was to investigate theretinal origins of the pattern ERG of a commonly studied mousestrain, C57BL/6. Although previous studies have strongly indi-cated a primary role for retinal ganglion cells in generating thepattern ERG in mice, as in several other species, further infor-mation about the retinal inputs to the response has been lacking.Of particular interest is the contribution of Naþ-dependentspiking activity and the ON and OFF pathways of the retina to theresponse. Findings in the present study in mice lacking ganglioncells following ONC, and after injection of TTX were consistentwith both spiking and nonspiking activity of retinal ganglioncells contributing to the P1 and N2 components of the mousepattern ERG. The study also revealed, using PDA and APB, thatthe positive, P1 component of the mouse pattern ERG originatesentirely from activity of neurons in the ON pathway, whereas thenegative, N2 component may be dominated by activity ofneurons in the OFF pathway.
Although this study was motivated by questions about theorigins of the pattern ERG, light-adapted full-field flash ERGswere recorded, as well, for every experimental manipulation.Effects on flash ERGs after intravitreal injections of APB to blockthe ON pathway and PDA to block OFF hyperpolarizing second
order, and all third order neurons (Slaughter and Miller, 1983)were consistent with previous reports, as acknowledged in theresults. New findings showed that loss of ganglion cells due toONC had no effect on the light-adapted flash ERG a- and b-waves, and created perhaps a small effect on the PhNR, butelimination of spiking activity with TTX dramatically reduced thelight-adapted b-wave as has been reported previously for rats(Bui and Fortune, 2004; Mojumder et al., 2007, 2008). Allmanipulations affecting inner retinal cells reduced the PhNR.These findings will be addressed more fully in a later section ofthe Discussion.
G. Miura et al. / Experimental Eye Research 89 (2009) 49–6260
4.1. The role of retinal ganglion cells and spiking activity ingenerating the pattern ERG
4.1.1. Retinal ganglion cellsThe pattern ERG was practically eliminated, with only small
residual waves or ganglion cell or other origin (see below) whenrecorded 39–42 days after ONC, whereas the flash ERGs were hardlyaffected. The effect on the pattern ERG of ONC is consistent withprevious reports for mice and other species including rats, cats andmonkeys with ganglion cell lesions due to optic nerve section or crush(Berardi et al., 1990; Maffei and Fiorentini, 1982; Maffei et al., 1985;Porciatti et al., 1996); or laser-induced or inherited glaucomatousneuropathy (Ben-Shlomo et al., 2005; Johnson et al., 1989; Porciatti,2007; Porciatti et al., 2007; Viswanathan et al., 2000). This suggeststhat the ganglion lesions in the present study were extensive. Cellcounts in ganglion cell layers of eyes following ONC and final flash andpattern ERG recordings in this study, were consistent with whatwould be predicted from previous studies. As shown in Table 1, theretinal ganglion cells (Brn3a positive) made up about 40% of all cells inthe ganglion cell layer (DAPI-labeled). This value agrees with previousstudies of mouse retina (Drager and Olsen, 1981; Jeon et al., 1998), orwithin 20% when taking into account the ganglion cells (w20% of thepopulation, not labeled for Brn3a Xiang et al., 1995). The averagedensity of ganglion cells was about 41 cells/mm, and this number wassimilar to previous work as well (Moon, 2005).
4.1.2. Spiking activityIn the present study, TTX blockade of the Naþ-dependent
spiking activity, which occurs mainly in ganglion and amacrinecells of the retina, reduced but did not eliminate P1 and N2 wavesfrom the mouse pattern ERG (see Fig. 4B). In previous studies in cat(Trimarchi et al., 1990) and in rat (Ben-Shlomo et al., 2005) TTX alsoreduced but did not eliminate the positive or negative portions ofthe response. Thus in these three species in which ganglion celllesions will essentially eliminate the pattern ERG, the pattern ERGdepends upon both spiking and nonspiking activity, likely to orig-inate from the ganglion cells. In contrast, in macaque monkey, theN95 (N2) was found to be completely eliminated by TTX (or severeexperimental glaucoma), giving spiking activity a larger role in thegeneration of the pattern ERG in this species. P50 (P1) in macaques,while reduced, was still present particularly for stimuli of lowspatial frequencies (Viswanathan et al., 2000). Residual P1 was seenin three of the four mouse eyes, as well as in the presence of PDA,raising the possibility for small contributions from more distalgenerators in mice as well. The retinal structure and the waves ofthe transient pattern ERG are sufficiently similar in macaquemonkeys and humans to predict similar results would occur forhumans. The reason for species differences in relative contributionsof spiking and nonspiking activity is not presently known.
TTX also was injected in combination with APB and PDA in thepresent study to further understand spiking and nonspikingcontributions with respect to ON and OFF pathways. APB alone,which blocks ON pathway activity, thereby isolating OFF pathwayactivity, eliminated the entire P1 response (see Fig. 6B), effectivelyisolating the N2 portion of the response, which was enlarged atearly times, probably due to the removal of P1. The addition of TTXto APB almost completely abolished the large isolated N2 compo-nent (see Fig. 7B). This finding, taken together with the finding thatganglion cell lesions also practically eliminate the pattern ERG,would be consistent with a large OFF ganglion spiking contributionto the early portion of the N2 component of the PERG. Some ofsmaller nonspiking contribution to N2, seen after TTX alone inFig. 4B, were removed by the APB/TTX mixture, perhaps a smallnegative-going contribution from ON pathway neurons in the postTTX N2 response. Studies using APB in cat (Trimarchi et al., 1990)
and more recently in monkey (unpublished observations, Luo, X.and Frishman, L.J.) indicate much more overlap of ON and OFFpathway spiking activity for both the positive and negativecomponents of the pattern ERG than seen in the present study ofthe pattern ERG of the mouse. Experiments analyzing the reason forthis species difference are in progress.
The effects of combining PDA and TTX were less dramatic, withonly small additional effect on N2 than TTX alone. The effects ofPDA and TTX on P1, were not additive, indicating that both removedspiking activity contributions to the wave. The origin of the slowedresidual P1 after PDA or TTX, or both, would logically occur in theON-bipolar cells. Recall that the entire wave was removed by APB.The origin of the slow negative wave after injection of PDA (Fig. 5B)alone or in combination with TTX (Fig. 8B) is not completelyestablished by these experiments. At least some of it is likely to bephotoreceptor driven, is indicated in preliminary experimentscombining APB and PDA injections (data not shown). Slow PIII, forexample, has been seen to contribute to the light-adapted ERG inmice when more proximal responses are removed (Shirato et al.,2008). But this is a complicated issue. The pattern ERG normallydisplays the nonlinear retinal responses that do not cancel. Injec-tion of pharmacologic agents that alter activity of second orderneurons, or even glial contributions to the ERG (APB and PDA, andeven TTX, see below) could disturb the balance so that responsesthat normally would cancel in the pattern ERG do not do soanymore. In any event, residual waves after elimination of innerretina activity are small.
4.2. Origins of the light-adapted flash ERG in mice
4.2.1. a- and b-WavesThe flash ERG data collected in these studies provided an
opportunity to consider findings related to the origins of the flashERG, as well as the pattern ERG. The origins of the major waves ofthe flash ERG, the a- and b-waves, have been well studied, andfindings in the present study paralleled that of previous work.Light-adapted a-waves represent a combination of cone photore-ceptor responses, and postreceptoral OFF pathway contributions tothe ERG (Bush and Sieving, 1994; Rangaswamy et al., 2004; Robsonet al., 2003; Sharma et al., 2005; Xu et al., 2003). b-Waves, whichcan be eliminated by APB, require function of depolarizing bipolarcells (Sharma et al., 2005; Shirato et al., 2008; Sieving et al., 1994). Itwas also found that ONC had virtually no effect on the light-adapted a- and b-waves in mice, as previous reported after opticnerve section in rat (Mojumder et al., 2008), although anotherstudy in rat reported, using a different surgical approach reportedsome decrease in b-waves (Bui and Fortune, 2004).
In contrast to ONC, blockade by TTX of voltage-gated Naþ
channels, had a profound effect on the b-wave of the light-adaptedERG, reducing the amplitude by more than a factor of two, as seenpreviously in rats (Bui and Fortune, 2004; Mojumder et al., 2008).In rat retina, using pharmacologic blockade of inner retina, thiseffect of TTX was traced to channels likely to be in the ON conebipolar cells themselves (Mojumder et al., 2007, 2008), rather thanin the more traditionally predicted inner retinal neurons, indicatedin studies of rabbit ERG (Dong and Hare, 2000). Supporting theresults in rat retina, TTX-sensitive Naþ currents in the somato-dendritic compartment of rat cone bipolar cells (Ma et al., 2005;Pan and Hu, 2000), as well as in the bipolar cells of other vertebrateretinas, originally reported fish retina (Miguel-Hidalgo et al., 1994;Pan and Hu, 2000; Zenisek et al., 2001) and also found in sala-mander (Ichinose and Lukasiewicz, 2005), but not to our knowl-edge, yet reported in mice.
The locus of the effect of TTX on the light-adapted b-wave inmice remains to be determined. When PDA was combined with
G. Miura et al. / Experimental Eye Research 89 (2009) 49–62 61
TTX, the flash ERG was not reduced in amplitude to the extent thatit was after TTX. This may have been due to PDA blockade of OFFbipolar cell or horizontal cell activity that normally reduces b-waveamplitude. However the result also could indicate blockade of innerretinal activity that in turn blocked the TTX effect on the b-wave inmice, originating from inner retina, as reported in rabbit (Dong andHare, 2000). The prolonged nature of the response, particularly forstrong stimuli where a second positive peak emerged, (Fig. 8), alsois not easy to explain, although an ON-bipolar cell origin, perhapsfrom a slowly peaking class would be a logical possibility, given thelikely lack of other second, or third order neuronal activity afterPDA injection.
4.2.2. PhNRIn macaque monkeys and humans, ganglion cell integrity is
essential for generation of the negative wave, the PhNR, that occursafter the b-wave in the flash ERG (Rangaswamy et al., 2004; Vis-wanathan et al., 1999, 2001). In fact it has been suggested that inmonkeys the generator for the PhNR and the N95 of the patternERG are in one the same (Viswanathan et al., 2000). In rodents,a ganglion cell origin is less likely for the PhNR. One study in rat,following optic nerve section reported a loss of PhNR (Li et al.,2005), but another, using a different surgical approach, did notobserve it (Mojumder et al., 2008). In the current study, PhNRswere small even in control eyes, and therefore not measured, andthe rise in the tail of the b-wave that could be seen in eyes after ONC(Fig. 2A), was variable. The effects of TTX and PDA on the PhNR wereeasier to appreciate, particularly for the strongest stimuli; bothagents elevated the tail of the b-wave, and eliminated the smallPhNRs. Therefore it is likely that the PhNR in mice (and rats), unlikein primates, arises from spiking and perhaps nonspiking activity ofamacrine cells, rather than ganglion cells. Perhaps this is due to thesmaller population of ganglion cells in rodents than in primates.
4.3. Methodological issues
The pattern ERGs recorded in the present study using squarewave gratings of 90% contrast were, on average, about 12 mV whenP1N2 was measured. This compares favorably with results fromother labs in mice (e.g. Porciatti, 2007), and with human andprimate recordings (Viswanathan et al., 2000). The peak times ofcomponents in mice appeared earlier than recently described inyoung DBA2/J mice (Porciatti et al., 2007): differences in labrecording procedures may have produced these small differences,existing work does not allow us to resolve this.
In our experiments, the range of amplitudes and timing wasrelatively more variable than for flash ERGs recorded in the samesession. The alignment of the eye with the pattern may havecontributed to the variability. Whereas humans will fixate thepattern in a central position, and it is possible to align the fovea ofan anesthetized primate using an indirect ophthalmoscope andrear projection (Viswanathan et al., 2000), for the mouse eye in thisstudy, only the center of the artificial pupil was aligned. This lessspecific alignment of the eye could have introduced some vari-ability in retinal stimulation. However, the mouse retina has lessdifference in cell density in central and peripheral regions thanprimates, probably making the imprecise alignment less delete-rious than it would be in those species with a fovea.
4.4. Summary
The pattern ERG is an important noninvasive tool for doc-umenting retinal ganglion cell function in normal and diseasedretinas. This study has begun to identify the contributions of thedifferent retinal pathways and spiking vs nonspiking neuronal
responses to the pattern ERG in mouse, which is an increasinglyimportant model for the study retinal pathology and potentialtreatment strategies. Further studies to gain a better understandingof the interesting differences in ON and OFF pathway contributionsto the response across species, as well as other mechanisms thatgenerate the response will further improve its value as a tool forstudy of the retina.
5. Financial disclosures
There are no financial disclosures.
6. Conflict of interest
There are no conflicts to report.
Acknowledgments
This work was supported by National Eye Institute grantsR01-EY06671 and P30-EY07751, and a University of HoustonSummer Undergraduate Research Fellowship (SURF) to KMI.
References
Aldebasi, Y.H., Drasdo, N., Morgan, J.E., North, R.V., 2004. S-cone, L þ M-cone, andpattern, electroretinograms in ocular hypertension and glaucoma. Vis. Res. 44,2749–2756.
Anderson, M.G., Smith, R.S., Hawes, N.L., Zabaleta, A., Chang, B., Wiggs, J.L.,John, S.W., 2002. Mutations in genes encoding melanosomal proteins causepigmentary glaucoma in DBA/2J mice. Nat. Genet. 30, 81–85.
Arai, M., Yoshimura, N., Sakaue, H., Chihara, E., Honda, Y., 1993. A 3-year follow-upstudy of ocular hypertension by pattern electroretinogram. Ophthalmologica207, 187–195.
Bach, M., Hoffmann, M.B., 2008. Update on the pattern electroretinogram in glau-coma. Optom. Vis. Sci. 85, 386–395.
Bach, M., Hiss, P., Rover, J., 1988. Check-size specific changes of pattern electro-retinogram in patients with early open-angle glaucoma. Doc. Ophthalmol. 69,315–322.
Bach, M., Unsoeld, A.S., Philippin, H., Staubach, F., Maier, P., Walter, H.S., Bomer, T.G.,Funk, J., 2006. Pattern ERG as an early glaucoma indicator in ocular hyperten-sion: a long-term, prospective study. Invest. Ophthalmol. Vis. Sci. 47,4881–4887.
Ben-Shlomo, G., Bakalash, S., Lambrou, G.N., Latour, E., Dawson, W.W., Schwartz, M.,Ofri, R., 2005. Pattern electroretinography in a rat model of ocular hyperten-sion: functional evidence for early detection of inner retinal damage. Exp. EyeRes. 81, 340–349.
Berardi, N., Domenici, L., Gravina, A., Maffei, L., 1990. Pattern ERG in rats followingsection of the optic nerve. Exp. Brain Res. 79, 539–546.
Bui, B.V., Fortune, B., 2004. Ganglion cell contributions to the rat full-field elec-troretinogram. J. Physiol. 555, 153–173.
Bush, R.A., Sieving, P.A., 1994. A proximal retinal component in the primate phot-opic ERG a-wave. Invest. Ophthalmol. Vis. Sci. 35, 635–645.
Chang, B., Hawes, N.L., Hurd, R.E., Wang, J., Howell, D., Davisson, M.T., Roderick, T.H.,Nusinowitz, S., Heckenlively, J.R., 2005. Mouse models of ocular diseases. Vis.Neurosci. 22, 587–593.
Cui, J., Pan, Z.H., 2008. Two types of cone bipolar cells express voltage-gated Naþchannels in the rat retina. Vis. Neurosci. 25, 635–645.
Dawson, W.W., Trick, G.L., Litzkow, C.A., 1979. Improved electrode for electroreti-nography. Invest. Ophthalmol. Vis. Sci. 18, 988–991.
Dong, C.J., Hare, W.A., 2000. Contribution to the kinetics and amplitude of theelectroretinogram b-wave by third-order retinal neurons in the rabbit retina.Vis. Res. 40, 579–589.
Drager, U.C., Olsen, J.F., 1981. Ganglion cell distribution in the retina of the mouse.Invest. Ophthalmol. Vis. Sci. 20, 285–293.
Frishman, L.J., 2005. Electrogenesis of the ERG. In: Ryan, S.J. (Ed.), Retina. Elsevier/Mosby, St. Louis, MO, pp. 103–135.
Harrison, J.M., O’Connor, P.S., Young, R.S., Kincaid, M., Bentley, R., 1987. The patternERG in man following surgical resection of the optic nerve. Invest. Ophthalmol.Vis. Sci. 28, 492–499.
Holder, G.E., 2001. Pattern electroretinography (PERG) and an integrated approachto visual pathway diagnosis. Prog. Retin. Eye Res. 20, 531–561.
Holder, G.E., Brigell, M.G., Hawlina, M., Meigen, T., Vaegan, Bach, M., 2007. ISCEVstandard for clinical pattern electroretinography – 2007 update. Doc. Oph-thalmol. 114, 111–116.
Hood, D.C., Xu, L., Thienprasiddhi, P., Greenstein, V.C., Odel, J.G., Grippo, T.M.,Liebmann, J.M., Ritch, R., 2005. The pattern electroretinogram in glaucoma

G. Miura et al. / Experimental Eye Research 89 (2009) 49–6262
patients with confirmed visual field deficits. Invest. Ophthalmol. Vis. Sci. 46,2411–2418.
Ichinose, T., Lukasiewicz, P.D., 2005. Inner and outer retinal pathways bothcontribute to surround inhibition of salamander ganglion cells. J. Physiol. 565,517–535.
Jacobs, G.H., Neitz, J., Deegan 2nd, J.F., 1991. Retinal receptors in rodents maximallysensitive to ultraviolet light. Nature 353, 655–656.
Jakobs, T.C., Libby, R.T., Ben, Y., John, S.W., Masland, R.H., 2005. Retinal ganglion celldegeneration is topological but not cell type specific in DBA/2J mice. J. Cell Biol.171, 313–325.
Jeon, C.J., Strettoi, E., Masland, R.H., 1998. The major cell populations of the mouseretina. J. Neurosci. 18, 8936–8946.
John, S.W., Smith, R.S., Savinova, O.V., Hawes, N.L., Chang, B., Turnbull, D.,Davisson, M., Roderick, T.H., Heckenlively, J.R., 1998. Essential iris atrophy,pigment dispersion, and glaucoma in DBA/2J mice. Invest. Ophthalmol. Vis. Sci.39, 951–962.
Johnson, M.A., Drum, B.A., Quigley, H.A., Sanchez, R.M., Dunkelberger, G.R., 1989.Pattern-evoked potentials and optic nerve fiber loss in monocular laser-inducedglaucoma. Invest. Ophthalmol. Vis. Sci. 30, 897–907.
Kaneko, M., Maeda, H., Frishman, L.J., 2006. Effects of prolonged light adaptation onthe amplitude of the a-wave of the flash ERG of the mouse. ARVO E-Abstracts,3095.
Kao, Y.H., Sterling, P., 2006. Displaced GAD65 amacrine cells of the guinea pig retinaare morphologically diverse. Vis. Neurosci. 23, 931–939.
Koyasu, T., Kondo, M., Miyata, K., Ueno, S., Miyata, T., Nishizawa, Y., Terasaki, H.,2008. Photopic electroretinograms of mGluR6-deficient mice. Curr. Eye Res. 33,91–99.
Li, B., Barnes, G.E., Holt, W.F., 2005. The decline of the photopic negative response(PhNR) in the rat after optic nerve transection. Doc. Ophthalmol. 111, 23–31.
Li, Y., Schlamp, C.L., Nickells, R.W., 1999. Experimental induction of retinal ganglioncell death in adult mice. Invest. Ophthalmol. Vis. Sci. 40, 1004–1008.
Lyubarsky, A.L., Falsini, B., Pennesi, M.E., Valentini, P., Pugh Jr., E.N., 1999. UV- andmidwave-sensitive cone-driven retinal responses of the mouse: a possiblephenotype for coexpression of cone photopigments. J. Neurosci. 19, 442–455.
Ma, Y.P., Cui, J., Pan, Z.H., 2005. Heterogeneous expression of voltage-dependentNaþ and Kþ channels in mammalian retinal bipolar cells. Vis. Neurosci. 22,119–133.
Maffei, L., Fiorentini, A., 1982. Electroretinographic responses to alternating gratingsin the cat. Exp. Brain Res. 48, 327–334.
Maffei, L., Fiorentini, A., Bisti, S., Hollander, H., 1985. Pattern ERG in the monkeyafter section of the optic nerve. Exp. Brain Res. 59, 423–425.
Miguel-Hidalgo, J.J., Snider, C.J., Angelides, K.J., Chalupa, L.M., 1994. Voltage-dependent sodium channel alpha subunit immunoreactivity is expressed bydistinct cell types of the cat and monkey retina. Vis. Neurosci. 11, 219–228.
Mojumder, D.K., Frishman, L.J., Otteson, D.C., Sherry, D.M., 2007. Voltage-gatedsodium channel alpha-subunits Na(v)1.1, Na(v)1.2, and Na(v)1.6 in the distalmammalian retina. Mol. Vis. 13, 2163–2182.
Mojumder, D.K., Sherry, D.M., Frishman, L.J., 2008. Contribution of voltage-gatedsodium channels to the b-wave of the mammalian flash electroretinogram. J.Physiol. 586, 2551–2580.
Moon, J., 2005. Changes in retinal neuronal populations in the DBA/2J mouse. CellTissue Res. 320, 51–59.
Ohtoshi, A., Wang, S.W., Maeda, H., Saszik, S.M., Frishman, L.J., Klein, W.H.,Behringer, R.R., 2004. Regulation of retinal cone bipolar cell differentiation andphotopic vision by the CVC homeobox gene Vsx1. Curr. Biol. 14, 530–536.
Pan, Z.H., Hu, H.J., 2000. Voltage-dependent Na(þ) currents in mammalian retinalcone bipolar cells. J. Neurophysiol. 84, 2564–2571.
Peachey, N.S., Ball, S.L., 2003. Electrophysiological analysis of visual function inmutant mice. Doc. Ophthalmol. 107, 13–36.
Perez De Sevilla Muller, L., Shelley, J., Weiler, R., 2007. Displaced amacrine cells ofthe mouse retina. J. Comp. Neurol. 505, 177–189.
Pfeiffer, N., Tillmon, B., Bach, M., 1993. Predictive value of the pattern electro-retinogram in high-risk ocular hypertension. Invest. Ophthalmol. Vis. Sci. 34,1710–1715.
Porciatti, V., 2007. The mouse pattern electroretinogram. Doc. Ophthalmol. 115,145–153.
Porciatti, V., Pizzorusso, T., Cenni, M.C., Maffei, L., 1996. The visual response ofretinal ganglion cells is not altered by optic nerve transection in transgenic miceoverexpressing Bcl-2. Proc. Natl. Acad. Sci. USA 93, 14955–14959.
Porciatti, V., Saleh, M., Nagaraju, M., 2007. The pattern electroretinogram as a tool tomonitor progressive retinal ganglion cell dysfunction in the DBA/2J mousemodel of glaucoma. Invest. Ophthalmol. Vis. Sci. 48, 745–751.
Pugh, E.N.J., Falsini, B., Lyubarsky, A.L., 1998. The origin of the major rod- and cone-driven components of the rodent electroretinogram and the effect of age andlight-rearing history on the magnitude of these components. In: Photostasisand Related Phenomena. Plenum Press, New York, pp. 98–128.
Rangaswamy, N.V., Frishman, L.J., Dorotheo, E.U., Schiffman, J.S., Bahrani, H.M.,Tang, R.A., 2004. Photopic ERGs in patients with optic neuropathies: compar-ison with primate ERGs after pharmacologic blockade of inner retina. Invest.Ophthalmol. Vis. Sci. 45, 3827–3837.
Riggs, L.A., Johnson, E.P., Schick, A.M., 1964. Electrical responses of the human eye tomoving stimulus patterns. Science 144, 567.
Robson, J.G., Frishman, L.J., 1995. Response linearity and kinetics of the cat retina:the bipolar cell component of the dark-adapted electroretinogram. Vis. Neu-rosci. 12, 837–850.
Robson, J.G., Saszik, S.M., Ahmed, J., Frishman, L.J., 2003. Rod and cone contribu-tions to the a-wave of the electroretinogram of the macaque. J. Physiol. 547,509–530.
Saszik, S.M., Robson, J.G., Frishman, L.J., 2002. The scotopic threshold response ofthe dark-adapted electroretinogram of the mouse. J. Physiol. 543, 899–916.
Sharma, S., Ball, S.L., Peachey, N.S., 2005. Pharmacological studies of the mouse coneelectroretinogram. Vis. Neurosci. 22, 631–636.
Sherry, D.M., Heidelberger, R., 2005. Distribution of proteins associated withsynaptic vesicle endocytosis in the mouse and goldfish retina. J. Comp. Neurol.484, 440–457.
Sherry, D.M., Wang, M.M., Frishman, L.J., 2003. Differential distribution of vesicleassociated membrane protein isoforms in the mouse retina. Mol. Vis. 9,673–688.
Shirato, S., Maeda, H., Miura, G., Frishman, L.J., 2008. Postreceptoral contributions tothe light-adapted ERG of mice lacking b-waves. Exp. Eye Res. 86, 914–928.
Sieving, P.A., Murayama, K., Naarendorp, F., 1994. Push–pull model of the primatephotopic electroretinogram: a role for hyperpolarizing neurons in shaping theb-wave. Vis. Neurosci. 11, 519–532.
Slaughter, M.M., Miller, R.F., 1981. 2-amino-4-phosphonobutyric acid: a new phar-macological tool for retina research. Science 211, 182–185.
Slaughter, M.M., Miller, R.F., 1983. An excitatory amino acid antagonist blockscone input to sign-conserving second-order retinal neurons. Science 219,1230–1232.
Trimarchi, C., Biral, G., Domenici, L., Porciatti, V., Bisti, S., 1990. The flash- andpattern-electroretinogram generators in the cat: a pharmacological approach.Clin. Vis. Sci. 6, 19–24.
Ventura, L.M., Porciatti, V., Ishida, K., Feuer, W.J., Parrish 2nd, R.K., 2005. Patternelectroretinogram abnormality and glaucoma. Ophthalmology 112, 10–19.
Viswanathan, S., Frishman, L.J., Robson, J.G., Harwerth, R.S., Smith 3rd, E.L., 1999.The photopic negative response of the macaque electroretinogram: reductionby experimental glaucoma. Invest. Ophthalmol. Vis. Sci. 40, 1124–1136.
Viswanathan, S., Frishman, L.J., Robson, J.G., 2000. The uniform field and patternERG in macaques with experimental glaucoma: removal of spiking activity.Invest. Ophthalmol. Vis. Sci. 41, 2797–2810.
Viswanathan, S., Frishman, L.J., Robson, J.G., Walters, J.W., 2001. The photopicnegative response of the flash electroretinogram in primary open angle glau-coma. Invest. Ophthalmol. Vis. Sci. 42, 514–522.
Wachtmeister, L., 1998. Oscillatory potentials in the retina: what do they reveal.Prog. Retin. Eye Res. 17, 485–521.
Wang, M.M., Janz, R., Belizaire, R., Frishman, L.J., Sherry, D.M., 2003. Differentialdistribution and developmental expression of synaptic vesicle protein 2 iso-forms in the mouse retina. J. Comp. Neurol. 460, 106–122.
Wassle, H., Chun, M.H., Muller, F., 1987. Amacrine cells in the ganglion cell layer ofthe cat retina. J. Comp. Neurol. 265, 391–408.
Xiang, M., Zhou, L., Macke, J.P., Yoshioka, T., Hendry, S.H., Eddy, R.L., Shows, T.B.,Nathans, J., 1995. The Brn-3 family of POU-domain factors: primary structure,binding specificity, and expression in subsets of retinal ganglion cells andsomatosensory neurons. J. Neurosci. 15, 4762–4785.
Xu, L., Ball, S.L., Alexander, K.R., Peachey, N.S., 2003. Pharmacological analysis of therat cone electroretinogram. Vis. Neurosci. 20, 297–306.
Zenisek, D., Henry, D., Studholme, K., Yazulla, S., Matthews, G., 2001. Voltage-dependent sodium channels are expressed in nonspiking retinal bipolarneurons. J. Neurosci. 21, 4543–4550.