returns to schooling around the...
TRANSCRIPT

BACKGROUND PAPER FOR THE
WORLD DEVELOPMENT REPORT 2013
Returns to Schooling around the World
Claudio E. Montenegro World Bank and Department of Economics, University of Chile &
Harry Anthony Patrinos The World Bank Group

1
Returns to Schooling around the World
Claudio E. Montenegro World Bank and Department of Economics, University of Chile
Harry Anthony Patrinos*
World Bank
Abstract – Rates of return to investments in schooling have been estimated since the late 1950s.
In the 60-plus year history of such estimates there have been several attempts to synthesize the
empirical results in order to ascertain patterns. This paper presents unified estimates of the latest
available surveys and patterns using the same specification and estimation procedure and data
from 131 economies and 545 harmonized household surveys. This effort to compile comparable
estimates addresses issues in the literature, such as: (i) the definition of the dependent variable;
(ii) the variables used as controls; (iii) sample definitions; and (iv) the estimation method. The
study holds constant the definition of the dependent variable, the set of control variables, the
sample definition, and the estimation method for all the surveys in the sample. The results show:
(i) private rates of return to schooling across a range of countries are more concentrated around
the mean than previously thought; (ii) the basic model used is more stable than one may have
expected; and (iii) private returns are higher/lower in the higher/lower schooling levels.
JEL codes: C13, J31
Keywords: Returns to schooling; Investments in education
* This was written as a background paper for the WDR (2013). Responsibility for the contents of this paper
is entirely that of its authors and should not be attributed to The World Bank, its Executive Directors or the
countries they represent. Comments and support received from the WDR team gratefully acknowledged.
We especially thank Kathleen Beegle, Jesko Hentschel and George Psacharopoulos for helpful comments.
All remaining errors are our own.

2
I. INTRODUCTION
Education is critical for economic growth and poverty reduction. Education systems
produce the global economy’s workers and expand knowledge. Schooling produces the
skills that propel individual labor productivity. A host of social and non-market benefits
are also produced by schooling, including but not limited to child well-being, health
status, efficiency of consumer choices, fertility and social capital. The individual
contribution of schooling has often been measured by labor market earnings.
The study of earnings by schooling has led to a number of empirical works testing
hypotheses on a great variety of social issues. These include, for example, racial and
ethnic discrimination (McNabb and Psacharopoulos (1981); Chiswick (1988)); gender
discrimination (Goldin and Polachek (1987)); income distribution (Mincer (1958)); the
determinants of the demand for education (Freeman (1976)); and the impact of
technology on wage differentials (Krueger (1993)). Under certain assumptions, earnings
differentials by level of education have been used to identify the sources of economic
growth (for example, Denison (1976)). But perhaps the quintessential application that has
used earnings is the estimation of the rate of return to investment in schooling. Earnings
of workers classified by some dimension have been at the core of empirical economics
and other social sciences for many decades, starting with the human capital revolution in
economic thought (Schultz (1961); Becker (1964)); Mincer (1974).
For 40 years, George Psacharopoulos alone or with colleagues (Psacharopoulos (1972),
Psacharopoulos (1973), Psacharopoulos (1985), Psacharopoulos (1989), Psacharopoulos
(1994), Psacharopoulos and Patrinos (2004), Psacharopoulos and Patrinos (2012)) has
reported on the patterns of estimated returns to schooling across developing economies
(see also Banerjee and Duflo (2005)). The returns are typically in the form of the
estimated proportional increase in an individual’s labor market earnings from an
additional year of schooling completed. Among the consistent findings across the various
surveys are:
1. Private returns to schooling are generally positive and the cross-economy average
is 10 percent per year of schooling
2. Returns seem to be higher in low or middle income economies than in
industrialized economies
3. Returns are highest at the primary schooling level and become smaller (although
still large) at the secondary and tertiary levels of schooling
4. Estimated returns to schooling are higher for women than for men
5. Returns to schooling have declined very modestly over time despite rising
average levels of schooling attainment, suggesting that the world demand for skills has
been increasing as world skill supply has also increased
3
As discussed by Psacharopoulos and Patrinos (2004), these conclusions are based on
compilations of studies that may not be strictly comparable. There are two main sources
of non-comparability: data sample coverage and methodology. One problem is that
survey samples may not accurately reflect population means. For cost or convenience,
surveys may concentrate on subpopulations that are easier or less expensive to reach,
focusing on firms rather than households or on urban populations while excluding rural
residents. Second, studies rarely use the same model to estimate returns. Variation in
control variables used can affect estimated returns, as can variation in the estimation
strategy used. Both of these problems leave open the possibility that the observed
variation in estimated returns is due to these differences in sample design or estimation
method and not to the true variation in returns.
Another methodological limitation, despite Becker’s warning (Becker (1964)), is that
many researchers feel obliged to include in the regression model many independent
variables. In effect, this procedure reduces part of the effect of education on earnings. Of
course, researchers who include other variables, such as occupation dummies, in earnings
functions do so because they are interested in modeling earnings, not necessarily in
estimating the rate of return to schooling. Obviously, such practices create a problem
when others interpret the schooling coefficient as a rate of return.
This paper presents new and comparable estimates of the private returns to schooling
using harmonized household surveys from 131 economies and a total of 545 harmonized
household surveys. The sample includes several countries for which there is more than
one survey available. Private rates of return are used to explain the behavior of
individuals in seeking different levels and types of schooling. Estimates of the returns to
schooling are a useful indicator of the productivity of education and incentive for
individuals to invest in their own human capital. This evidence can be used to guide
public policy in the design of programs and crafting of incentives that both promote
investment and ensure that low-income families make those investments.
The paper sets out to describe the patterns and trends using the same specification and
estimation procedure, by making use of the International Income Distribution Database
(I2D2), compiled by the World Bank’s World Development Report Unit over the period
2005-2012. The surveys have been harmonized to the extent possible to ensure that
conceptual variables are measured in the same way. While not all are random samples of
the economies’ populations, all samples can be made representative of the economies’
population using sample weights. The use of comparable data and methods should allay
the concerns that the cross-economy pattern of returns to schooling may be driven by
spurious factors. This effort to compile comparable estimates addresses the issues in the
literature, such as (i) the definition of the dependent variable; (ii) specification; (iii) the
variables used as controls; (iv) sample definitions; and (v) estimation method. The
estimates provided here are for wage workers, which means that in many countries, for
the majority of workers, we cannot estimate returns to schooling. One limitation of our
approach is that it does not address the issue of the endogeneity of schooling. Recent
work, however, shows that the traditional estimates presented here are very close to the

4
estimates provided in studies that attempt to control for endogeneity (see, for example,
Card 1995; Duflo 2001; Patrinos and Sakellariou 2012).
The present study holds constant the definition of the dependent variable, the set of
control variables, the sample definition, and the estimation method for all the surveys in
the sample. The results show: (i) returns to schooling are more concentrated around the
mean than previously thought; (ii) the basic model used is more stable than one may have
expected; and (iii) the returns are higher/lower in the higher/lower schooling levels.
II. METHODS
The private rate of return compares the costs and benefits of schooling as incurred and
realized by the individual student who undertakes the investment. Mincer (1974) has
provided a great service and convenience in estimating returns to schooling by means of
the semi-log earnings function (see also Becker and Chiswick (1966)). The now standard
method to estimate private returns per year of schooling is to estimate log earnings
equations of the form:
(1) iiiii XXSawLn
2
321)(
Where Ln(wi) is the natural log (of hourly or annual, depending on data) earnings for the
ith individual; iS is years of schooling (as a continuous variable); iX is labor market
potential experience (estimated as agei - Si - 6); Xi2 is potential experience-squared; and
i is a random disturbance term reflecting unobserved abilities. Therefore, 1 can be
viewed as the average private rate of return to years of schooling to wage employment.
The earnings function method can be used to estimate returns at different schooling levels
by converting the continuous years of schooling variable (S) into a series of dummy
variables, say Dp, Ds and Dt (where p is primary schooling, s is secondary schooling and
t is tertiary) to denote the fact that a person has achieved that level of schooling. The
omitted level is people with no schooling and that dummy is not in the equation to avoid
matrix singularity. The estimation equation in this case is of the form:
(2) Ln(wi) = α + βpDpi + βsDsi + βtDti + β1Xi + β2X2i + μi
After fitting this “extended earnings function” (using the above dummies instead of years
of schooling in the earnings function), the private rate of return to different levels of
schooling can be derived from the following formulas:
(3) rp = (βp)/(Sp)
(4) rs = (βs - βp)/(Ss - Sp)
(5) rt = (βt - βs)/(St - Ss)

5
where Sp, Ss and St stand for the total number of years of schooling for each successive
level. In the empirical analysis that follows we have assigned only three years of
foregone earnings to this group, following tradition (Psacharopoulos 1995).
III. DATA
We report our results based on the study of a large database constructed from existing
national household surveys. The data was prepared for the World Bank’s World
Development Report Unit over the period 2005-2011 and has been used in almost every
World Development Report during this period and also in several Human Development
Reports (see, for example, UNDP 2011; see also Montenegro and Hirn 2009). It covers
economies from developed and developing regions. There is no censoring of any kind in
the sample selection. If the survey was available and has all the needed variables, then it
was included. For most of the economies it covers at least one point in time and in many
cases several points in time. An enormous effort was undertaken in standardizing the
variable definitions across economies and time periods. The original data set includes 750
economies/years points that represent 158 economies. Not all of the economy/year points
available in the database are included in our analysis because some surveys lack the
necessary key variables. The basic specification (the one that requires the minimum set of
variables, and hence the one that has the most estimates) was calculated for 545
economy/years points, and covers 131 economies. The period under study is 1970 to
2011. However, only 4 percent of observations are from before 1990, and only 27 percent
before 2000.
Looking at the distribution of the sample by region, it is immediately obvious that Latin
America and the Caribbean region is the most represented in the sample, at 46 percent, or
249 data points, of all estimates. This is exclusively because of data availability. High
Income Economies follow at 17 percent, then Sub-Saharan Africa at 11 percent, with
Easter and Central Europe at 9 percent, East Asia and the Pacific at 8 percent, and finally
Middle East and North Africa and South Asia at 4 percent each.
The sample definition used in this study includes only waged employees. The same
variables and sample definitions are used for all surveys, which gives us comparable
economy/year results. As in many other such studies, school attainment is defined here
by the highest grade attended and completed; experience is defined as potential years of
experience, where this is defined as age minus years of schooling minus six (as the
typical school starting age). Both variables are measured in years.
IV. RESULTS
Overall, the average rate of return to another year of schooling is 10.4 percent, based on
545 observations from 131 economies between 1970 and 2011. In terms of latest year
available, the average rate of return is 9.9 percent. This is similar to many other reviews
of the literature. The fact that it was obtained after estimating the returns in a comparable
fashion shows just how stable this estimate is. The rate of return is also well-behaved and

6
has a normal distribution, as shown in Figure 1a for the 545 estimates and in Figure 1b
for the latest year available for each one of the 131 estimates included in the sample.1
Figure 1a: Returns to Schooling (total sample)
0
.05
.1.1
5.2
Den
sity
0 5 10 15 20Rate of return
Figure 1b: Returns to Schooling (latest period for each country)
0
.05
.1.1
5
Den
sity
0 5 10 15 20Rate of return
The returns to schooling by world region are highest in Sub-Saharan Africa, significantly
above the global average (Table 1). Returns are lowest in the Middle East/North Africa
region by a considerable margin. Healthy returns are also experienced in East Asia and
Latin America. Below average returns are in found in the relatively “schooled” Eastern
European economies and the much less schooled economies of South Asia.
1 We present the distribution of the latest year available for each country in order to avoid over
representation of those countries/regions with several data points.

7
Table 1: Returns to schooling by region
(latest available year between 2000-2011) Region Returns to
Schooling (%)
Years of
Schooling
GDP/pc (PPP
2005)
N
Middle East and North Africa 5.6 9.6 4,813 9
South Asia 7.0 6.5 2,661 7
Eastern and Central Europe 8.2 12.8 8,704 16
High Income Economies 10.0 12.7 29,538 25
East Asia and Pacific 10.3 10.5 4,996 13
Latin America and Caribbean 10.3 9.8 8,098 20
Sub-Saharan Africa 12.8 8.8 2,684 28
The returns to schooling by national income grouping overall are healthy, with lower than
average returns for lower middle income countries (Table 2). There are particularly high
returns for low income and upper middle income countries.
Table 2: Returns to schooling by income group
(latest available year between 2000-2011) Income group Returns to
Schooling (%)
Years of
Schooling
GDP/pc (PPP
2005)
N
World 10.0 10.4 10,540 118
Low income 10.5 8.0 971 23
Lower middle income 8.9 9.6 3,166 34
Upper middle income 10.7 11.3 10,332 36
High income 10.0 12.7 29,538 25
By level of schooling, the returns are highest at the tertiary level, on average at 16.8
percent, followed by primary at 10.3 percent and secondary at 6.9 percent (Table 3).
Returns to schooling are highest for all levels in Sub-Saharan Africa, reflecting the
scarcity of human capital in this region. High returns to tertiary show that high skills are
also in scarce supply, presenting considerable challenges for many countries in the
region. Low returns throughout in the Middle East/North Africa are puzzling, yet
relatively high returns to primary schooling signal this as a priority. There are very high
returns to tertiary schooling in South Asia. In East Asia and the Pacific there are high
returns at the primary and tertiary levels.

8
Table 3: Returns to schooling by educational level and region
(latest available year between 2000-2011) Region Primary Secondary Tertiary GDP/pc
(PPP 2005)
N
World 10.3 6.9 16.8 6,719 74
Middle East and North Africa 9.4 3.5 8.9 3,645 7
South Asia 9.6 6.3 18.4 2,626 4
Eastern and Central Europe 8.3 4.0 10.1 6,630 7
High Income Economies 4.8 5.3 11.0 31,748 6
East Asia and Pacific 11.0 6.3 15.4 5,980 6
Latin America and Caribbean 9.3 6.6 17.6 7,269 20
Sub-Saharan Africa 13.4 10.8 21.9 2,531 24
By country income group, the returns to primary schooling are highest in low income
countries (Figure 2). In fact, returns are highest at each level in low income countries,
reflecting the relative scarcity of human capital. Globally, except for high income
economies, the returns are healthy at the primary and tertiary levels. The returns to
secondary schooling are uniformly low at the secondary level.
Figure 2: Returns by schooling level and income group
(latest available year between 2000-2011)

9
Higher point estimates of the returns to schooling are associated with lower levels of
schooling in a country. This suggests that schooling increases respond to price signals. In
other words, it could be that as demand goes up and the supply follows, the price tends to
fall (see Figure 3).
Figure 3: Returns to schooling and mean years of schooling
Examining the trends by region, one can see that Africa has a low level of schooling and
high returns (Figure 4). Yet, schooling levels are even lower in South Asia, but returns
are low. Returns are very low in the Middle East/North Africa region, but schooling
levels are relatively high.

10
Figure 4: Average returns to schooling and average schooling mean, by region
(latest available year between 2000-2011)
In summary, this section shows that the returns to schooling continue to be healthy, at
about 10 percent a year globally. By level of schooling, the returns to schooling are
highest at the tertiary level, showing that the demand for higher levels of skills is
increasing and that the demand for skills is global. At the same time the returns to
schooling are high at the primary level, signaling continued need for basic skills. Overall
the returns to schooling are low at the secondary school level as a result of the increased
demand for skills, prompting the best secondary school students to continue their
education at the tertiary level. The returns to schooling are relatively higher in poorer
economies overall. They are uniformly high for primary schooling in low income
economies. But they are also high for tertiary in low income economies. In general, the
returns to schooling are low for secondary school graduates.
Trends
Over time, the returns to schooling tend to decrease, as shown in Figure 5. Our new
estimates, in black, show a sharp decline in returns during the past few decades. We
combine our data set with Psacharopoulos and Patrinos (2004) to reach further back. This
confirms the declining trend in returns to schooling.

11
Figure 5: Time trends of the Returns to schooling
There has been a tremendous increase in educational attainment in recent decades. In
2010, the world population aged 15 and above is estimated to have an average of 8 years
of schooling, having increasing steadily from 5.3 years in 1980 (Barro and Lee (2010)).
The returns to schooling have declined significantly since the 1980s, when they were
above 14 percent, to 10 percent in recent years (Table 4). This could be due at least partly
to the unprecedented expansion in schooling since the 1980s and especially since the late
1990s. Schooling has expanded by almost 50 percent since 1980, and the returns have
declined by one-third. Over a 30 year period the returns to schooling have declined by 4.5
percentage points, or 1 percent a year. At the same time, schooling increased by more
than 3 years, or 2 percent a year. On average, another year of schooling seems to coincide
with a reduction of the returns to schooling by one percentage point.
Table 4: Relation between change and years of schooling expansion
Period
Returns to
Schooling
Average Years
of Schooling
N
1980-1985 14.4 7.3 9
1986-1990 12.8 7.9 21
1991-1995 10.6 8.2 47
1996-2000 10.7 8.8 98
2001-2005 10.3 10.2 192
2006-2010 9.9 10.7 177

12
V. EXTENSIONS
The World Development Report 2013 stresses the transformational role of jobs. It also
emphasizes that different types of countries have different needs. To support the analysis
of the WDR we extend our analysis by including estimates of the returns to schooling by
country type. We then add control variables to the basic equation. This information is
available for 138 surveys. Four additional variables are included: firm size, urban-rural
location, occupation, gender and industry. In this case, we estimated our basic
specification (that includes schooling and years of potential experience), and we added
four dummies. We follow with a brief example of how the estimates of returns to
schooling can be used at the individual country level.
Country Type
We present estimates of the returns to schooling in several different types of countries
(Table 5). These include agrarian economies—where most people are still engaged in
agriculture, often in very small family farms, and cities are not yet a source of economic
dynamism; conflict-affected countries—undergoing or emerging from conflict, where
peace-keeping forces may still be needed or where deaths from conflict may still be high;
resource-rich countries—minerals account for a large share of exports, exploitation of
resources brings dramatic economic growth but undermines competitiveness and
encourages jobs based on transfers; small island nations; urbanizing countries—where
the share of the urban population is growing rapidly; countries with large youth
populations; formalizing countries—where the coverage of social protection systems is
large enough to envision extending it to the entire workforce; and aging societies—where
the share of the working-age population is declining and the costs of providing and caring
for the growing number of elderly is increasing, putting a double burden on living
standards.
In agrarian economies, such as Kenya, Myanmar and Senegal, for example, the returns
to schooling are high at all levels, probably as these are low income economies with a
scarcity of human capital. In conflict-affected states, such as Afghanistan, Liberia and Sri
Lanka, the premium to investing in primary schooling is high. In resource-rich
economies, such as Botswana, Papua New Guinea and Peru, returns to schooling are high
at all levels, suggesting that human capital skills are a complement to resources. Small-
island states, such as Fiji, Tonga and Tuvalu, the returns are relatively higher at the
primary level, emphasizing need for basic skills in such states. In urbanizing economies,
such as Bangladesh, China and Morocco, premiums are high at all levels; in youth bulge
economies, such as Egypt, South Africa and Tunisia, the returns to schooling are
relatively lower; in formalizing economies, such as: Brazil, Mexico and Turkey, the
returns to schooling are relatively lower; and in aging economies, such as Argentina and
Bulgaria, the returns are relatively lower.

13
Table 5: Returns to schooling by country type
(latest available year between 2000-2011)
Economy type
Returns
GDP/pc
N Total Primary Secondary Tertiary
Aging 8.5 6.3 5.2 12.6 8,485 8
Formalizing 9.2 8.2 5.5 14.0 8,043 23
Urbanizing 11.5 10.6 8.1 20.1 5,078 29
Agrarian 13.8 13.7 10.3 22.1 1,577 16
Resource rich 11.0 12.2 7.8 19.0 5,146 12
Conflict-affected 9.3 14.6 6.7 14.8 1,734 7
Youth bulge 9.3 8.3 5.1 14.7 6,112 14
Small island 9.4 10.4 5.0 12.7 5,645 6
Rich economy 8.9 4.3 4.4 10.9 31,258 5 Notes: Agrarian: a rural share of population of 60% or above in 2010 (WDI); Conflict-affected: (i) countries in Uppsala Conflict Data Program database with at least 1,000 battle deaths in an internal or internationalized internal conflict in 2010 or (ii) with UN
peace keeping and peace building missions (2012 World Bank fragility list); Resource: with mineral exports accounting for at
least 20% of total exports over 2005-10 (World Integrated Trade Solution); Small island: population less than 2 million (UN Office of the High Representative for the Least Developed Countries, Landlocked Developing Countries and Small Island
Developing States and WDI); Urbanizing: with 65% or less of population living in urbanized areas in 2000, and with an increase
of 4.5 percentage points by 2010 (WDI); Youth bulge: index score of 0.90 or above, based on total youth employment (2010) times youth unemployment rate (mean, 2001-10) divided by total population (WDI 2010); Formalizing: First Active Coverage
(total number of contributors/Labor Force) ratio 25-75% (World Bank Pension Database 2012); Aging: old age (65 years and
over) dependency ratio greater than 8 (WDI 2010) ; Rich economy: those that are classified as High Income Economies by the World Bank; country typologies are not mutually exclusive hence a country could be counted more than once.
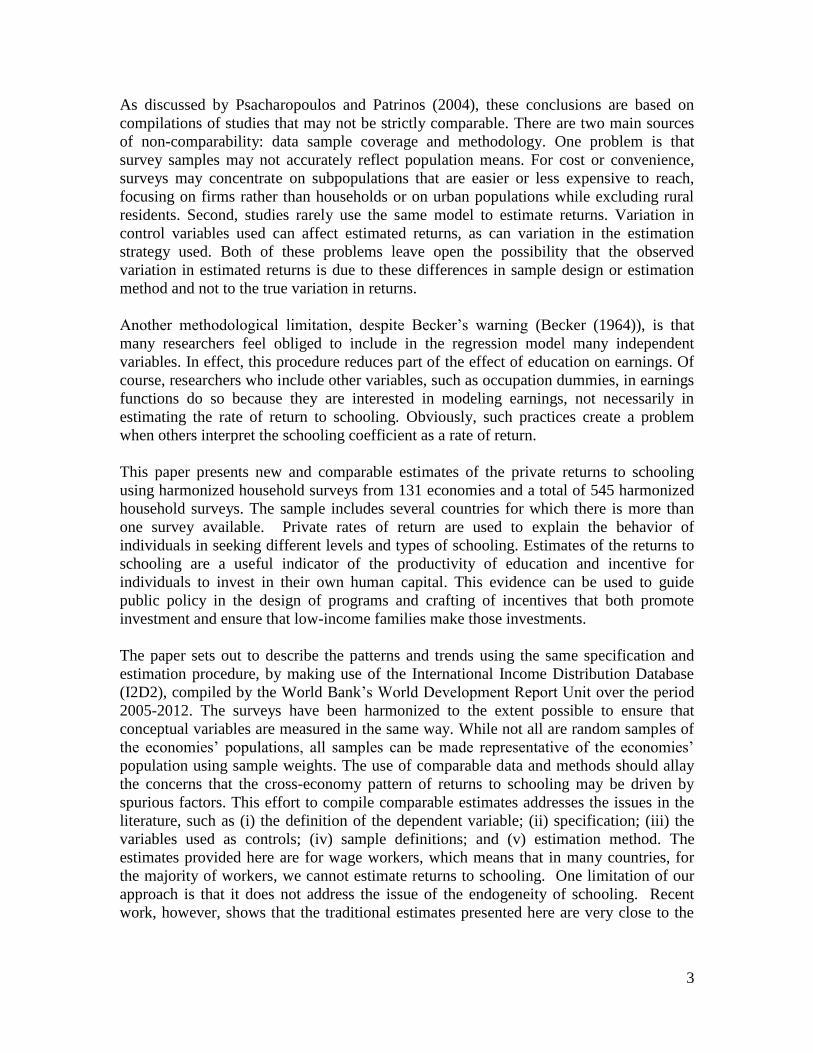
Firm Size
For each one of these surveys two dummy variables were created. The first one indicating
if the firm is small (defined as having between 10 to 50 workers). The other if the firm
size is large (50 or more). The default is microenterprises (that is, firms with less than 10
employees). After adding the dummy variables to the data set, we estimated 138
Mincerian equations where we control for the variables in our basic specification and we
added the two dummies that control for firm size. The firm size variable is only available
for 138 of the 545 surveys that are available for the estimation of the Mincerian equation.
We then extract the dummies’ coefficients and we analyzed their distribution. The results
are clear: firm size matters; that is, for identical schooling and experience, workers in
bigger firms tend to earn more than workers in small firms (Figure 6).
In this specification the estimated equation is:
(6) Ln(wi) = α + βsmallDsmalli + βlargeDlargei + β1Xi + β2X2i + μi
14
Figure 6: Firm Size
02
46
freq
ue
ncy (
%)
0 .2 .4 .6 .8wage difference, relative to microenterprises (%)
Small Large
kernel = epanechnikov, bandwidth = 0.0221
Other control variables
We also estimate a regression where we control for the basic Mincerian equation
variables and simultaneously include the following variables:
- Urban/rural where the dummy variable is 1 if the sector is urban, and zero otherwise
- Occupation where the dummy variable is 1 if the occupation is elementary
occupation, and zero otherwise
- Gender, where the dummy variable is one if the gender of the person is female, and
zero otherwise
- Agriculture, where the dummy variable is one if the person is employed in the
agricultural sector, and zero otherwise
The specification is as follows:
(7) Ln(wi) = α + βurbanDurbani + βoccupationDoccupationi +βgenderDgenderi +
βagricultureDagriculturei + βsSi + β1Xi + β2X2i + μi
These dummy coefficients are plotted separately against GDP per capita and here we
used the latest available year estimate for each country.
The estimated coefficients of the dummy variables are plotted against the log of GDP per
capita in PPP constant dollars of 2005. The results show that in relatively low income

15
countries, the negative impact of living in a rural area decrease significantly as countries
grow richer (Figure 7).
Figure 7: Rural-Urban Gap
If a person works in an elementary occupation – defined as a job where the knowledge
and experience necessary to perform it is mostly simple and routine, involving the use of
hand-held tools and in some cases considerable physical effort, and, with few exceptions,
only limited personal initiative or judgment. The main tasks consist of selling goods in
streets, door keeping and property watching, as well as cleaning, washing, pressing and
working as laborers in the fields of mining, agriculture and fishing, construction and
manufacturing. Most occupations in this major group require skills at the first ISCO
(International Standard Classification of Occupations, ISC0-88), skill level. Our results
show that working in an elementary occupation entails a large negative effect on worker
earnings as an economy grows richer (Figure 8).

16
Figure 8: Elementary Occupations Gap

17
Many studies find that the effect of schooling on earnings is greater for females than for
males, despite the fact that females tend to earn less, both absolutely and controlling for
personal characteristics (Dougherty (2005)). In other words, the returns to schooling tend
to be higher for women than for men in most countries. Figure 9 implies that this is true
in lower income countries, but that in higher income countries the effect is negative,
meaning that being a woman has a negative effect on earnings.
Figure 9: Gender Gap

18
The effect of working in agriculture on earnings is negative at lower national income
levels (Figure 10). As a country becomes richer the effect tends to fade.
Figure 10: Sectoral Gap
Country-specific patterns
We now turn back to equation (1) and we analyze the trend pattern for some specific
countries where we have several points in time. Country level estimates provide rich
information. A selection of countries for which we have at least 9 data points over time
are presented in Figure 11. Brazil is an interesting case. The returns were stable for much
of the 1980s, a time when average schooling levels increased only 11 percent (Barro and
Lee (2010)). Yet from 1990 to 2010, schooling levels increased by more than 69 percent,
and the returns to schooling declined significantly. Mexico has seen a more volatile
movement in the returns to schooling, having increased in the 1990s and declined steadily
since 2000. Returns to schooling have fluctuated widely in Thailand as well. Returns to
schooling are rising in Mauritius, even though average schooling levels have increased by
a full year during the same time. Both Turkey and South Africa display quite stable
returns over time, although at very different levels.

19
Figure 11: Comparable Returns to Schooling over Time, Selected Countries
The earnings function used here to estimate the returns to schooling includes a measure
of labor market experience. Experience in this model is potential labor market
experience estimated as age minus years of schooling minus six. With potential
experience-squared in the equation, this model allows us to estimate the potential returns
to years of experience. On average, across countries, the estimated rate of return to one
additional year of work experience in nonagricultural activities is roughly one-half the
return to one additional year of education at the beginning of work life.
Comparison with Alternative Estimates
Psacharopoulos and Patrinos (2004) and Psacharopoulos and Patrinos (2012) find that the
overall, average rate of return to another year of schooling is 10 percent. Estimates of the
returns to schooling by level of national income show that the highest returns are
recorded for low-income and middle-income economies. Average returns to schooling
are highest in the Latin America and the Caribbean region and for the sub-Saharan Africa
region. Returns to schooling for Asia are at about the world average. The returns are

20
lower in the high-income economies of the OECD. Average returns to schooling are
lowest for the non-OECD European, Middle East and North African group of economies.
The only differences that we find are the relatively low returns to schooling for South
Asia and the relatively high returns in high-income economies, though these differences
may be due to country coverage.
Both data sets show a decline in the rates of return over time. On average, the average
returns estimated by Psacharopoulos and Patrinos (2004) are slightly lower. This is most
likely due to additional control variables that are being used in the studies that
Psacharopoulos and Patrinos (2004) review. Also, Psacharopoulos and Patrinos (2004)
cover, in general, a period previous to our estimates.
Figure 12: Returns to Schooling Estimates, all data points
Source: Our estimates and the reviews of Psacharopoulos and Patrinos (2004)
Comparing these new, consistent estimates with Psacharopoulos and Patrinos (2004), we
estimate, in terms of latest year available, for 131 economies, an average rate of return of
9.9 percent (with a standard deviation of 3.6 and a range of 1.5 to 20.7. Psacharopoulos
and Patrinos (2004), for 91 economies, estimate a rate of return of 9.4 percent (with a
standard deviation of 3.96, and a range of 0.3 to 28.8 percent. Our new estimates contain
40 more economies. Together, the two compilations cover 146 economies (76% of the
193 countries recognized by the United Nations). In terms of world population in 2010,
the country estimates reviewed in Psacharopoulos and Patrinos (2004) cover 84 percent
of the globe. This new study covers 92 of the world’s population. Combined, the two
studies cover more than 95 percent of the global population. In Figure 12 we plot all
estimates. It is interesting to see how consistent and stable the estimates are.

21
VI. CONCLUSION
Our new data set of comparable estimates of the returns to schooling covers 131
countries/economies. We use 545 harmonized household surveys to provide the estimates
that cover the period from 1970 to 2011. This compilation of comparable estimates
addresses several issues in the literature such as (i) the definition of the dependent
variable—which we keep consistent throughout; (ii) the variables used as controls – we
use the basic Mincerian specification; (iii) sample definitions – we limit the analysis to
the same samples throughout in terms of age, employment status and earnings; and (iv)
estimation method – which we apply consistently to every survey. The results show: (i)
returns to schooling are more concentrated around the mean than previously thought; (ii)
the basic model used is more stable than one may have expected; and (iii) the returns are
higher/lower in the higher/lower schooling levels. We also combine our new estimates
with the Psacharopoulos and Patrinos (2004) review in order to form a comparison. In
doing so, we mostly confirm previous findings and stylized facts – and create a time-
trend that goes back to the 1960s, confirming that returns to schooling do decline.
This comparable data set on returns to schooling should be helpful for a variety of
empirical work. Our comparable estimates provide a reasonable proxy for the value of
human capital for a broad group of countries. This new data set is useful for studying the
links across countries between schooling attainment and the returns to schooling.
Moreover, it can be used to examine economic growth, competitiveness, inequality,
democracy, institutions and political freedom. An early version of the data set was used
to test Theodore Schultz’s hypothesis that the returns to human capital are highest in
economic environments experiencing unexpected price, productivity, and technology
shocks that create “disequilibria” (King, Montenegro, and Orazem (2012)) and to look at
the returns to schooling in the context of job creation in the next World Development
Report 2013 on Jobs (World Bank (2012)).
22
References
The word processed describes informally reproduced works that may not be commonly
available through libraries.
Banerjee, Abhijit V. and Esther Duflo. 2005. "Growth Theory through the Lens of
Development Economics." In Handbook of Economic Growth, eds. Philippe
Aghion and Steven Durlauf. Amsterdam: Elsevier.
Barro, Robert J. and Jong-Wa Lee. 2010. "A New Data Set of Educational Attainment in
the World, 1950-2010." National Bureau of Economic Research Working Paper
Series 15902. Cambridge, MA.
Becker, Gary S. 1964. Human Capital: A Theory and Empirical Analysis. Cambridge,
MA: National Bureau of Economic Research.
Becker, Gary S. and Barry R. Chiswick. 1966. "Education and the Distribution of
Earnings." American Economic Review 56 (1/2): 358–69.
Card, David. 1995. "Using Geographic Variation in College Proximity to Estimate the
Return to Schooling." In Aspects of Labour Economics: Essays in Honour of
John Vanderkamp, edited by Louis Christofides, E. Kenneth Grant and Robert
Swindinsky. Toronto: University of Toronto Press.
Chiswick, Barry R. 1988. "Differences in Education and Earnings across Racial and
Ethnic Groups: Tastes, Discrimination, and Investments in Child Quality."
Quarterly Journal of Economics 103 (3): 571–97.
Denison, Edward F. 1976. "Why Growth Rates Differ?" Brookings Institution.
Washington, DC. Processed.
Dougherty, Christopher. 2005. "Why Are the Returns to Schooling Higher for Women
than for Men?" Journal of Human Resources 40 (4): 969–88.
Duflo, Esther. 2001. "Schooling And Labor Market Consequences Of School
Construction In Indonesia: Evidence From An Unusual Policy Experiment."
American Economic Review 91(4): 795-813.
Freeman, Richard. 1976. The Overeducated American. New York, NY: Basic Books.
Goldin, Claudia and Solomon Polachek. 1987. "Residual Differences by Sex:
Perspectives on the Gender Gap in Earnings." American Economic Review 77 (2):
143–51.
King, Elizabeth M., Claudio E. Montenegro, and Peter F. Orazem. 2012. "Economic
Freedom, Human Rights, and the Returns to Human Capital: An Evaluation of the
Schultz Hypothesis." Journal of Economic Development and Cultural Change 61
(1): 39–72.

23
Krueger, Alan B. 1993. "How Computers Have Changed the Wage Structure: Evidence
from Microdata, 1984-1989." Quarterly Journal of Economics 108 (1): 33–60.
McNabb, Robert and George Psacharopoulos. 1981. "Racial Earnings Differences in the
UK." Oxford Economic Papers 33 (3): 413–25.
Mincer, Jacob. 1958. "Investment in Human Capital and Personal Income Distribution."
Journal of Political Economy 66 (4): 281–302.
Mincer, Jacob. 1974. Schooling, Experience and Earnings. New York, NY: Columbia
University Press.
Montenegro, Claudio E. and Maximilian Hirn. 2009. "A New Disaggregated Set of Labor
Market Indicators using Standardized Household Surveys from around the
World." World Bank. Available on line at:
https://openknowledge.worldbank.org/bitstream/handle/10986/9033/WDR2009_0
015.pdf?sequence=1. Washington, DC. Processed.
Patrinos, Harry A. and Chris Sakellariou. 2011. "Quality of Schooling, Returns to
Schooling and the 1981 Vouchers Reform in Chile." World Development 39(12):
2245-2256.
Psacharopoulos, George. 1972. "Rates of Return on Investment in Education around the
World." Comparative Education 16 (1): 54–67.
Psacharopoulos, George. 1973. Returns to Education: An International Comparison.
Amsterdam, San Francisco: Elsevier and Jossey-Bass.
Psacharopoulos, George. 1985. "Returns to Education: A Further International Update
and Implications." Journal of Human Resources 20 (4): 583–604.
Psacharopoulos, George. 1989. "Time Trends of the Returns to Education: Cross-
National Evidence." Economics of Education Review 8 (3): 225–31.
Psacharopoulos, George. 1994. "Returns to Education: A Global Update." World
Development 22 (9): 1325–43.
Psacharopoulos, George. 1995. "The Profitability of Investment in Education: Concepts
and Methods." World Bank December. Washington, DC.
Psacharopoulos, George and Harry A. Patrinos. 2004. "Returns to Investment in
Education: A Further Update." Education Economics 12 (2): 111–34.
Psacharopoulos, George and Harry A. Patrinos. 2012. "Rates of Return to Investment in
Education: An International Comparison." World Bank, Human Development
Network. Washington, DC. Processed.

24
Schultz, Theodore W. 1961. "Investment in Human Capital." American Economic Review
51 (1): 1–17.
World Bank. 2012. World Development Report 2013: Jobs. Washington, DC: World
Bank.