reuse of treated water in cooling towers · pdf filewater in cooling towers ... the water...
TRANSCRIPT
Mentor: Raghu Banothu, Deputy Manager, Engineering & Projects SUMMER 2014 | GODFREY PHILLIPS INDIA LTD., NAVI MUMBAI
Reuse of Treated Water in Cooling Towers MANISH RATNA B.TECH. IN CHEMICAL ENGINEERING IIT BOMBAY
1 | Godfrey Phillips India Limited
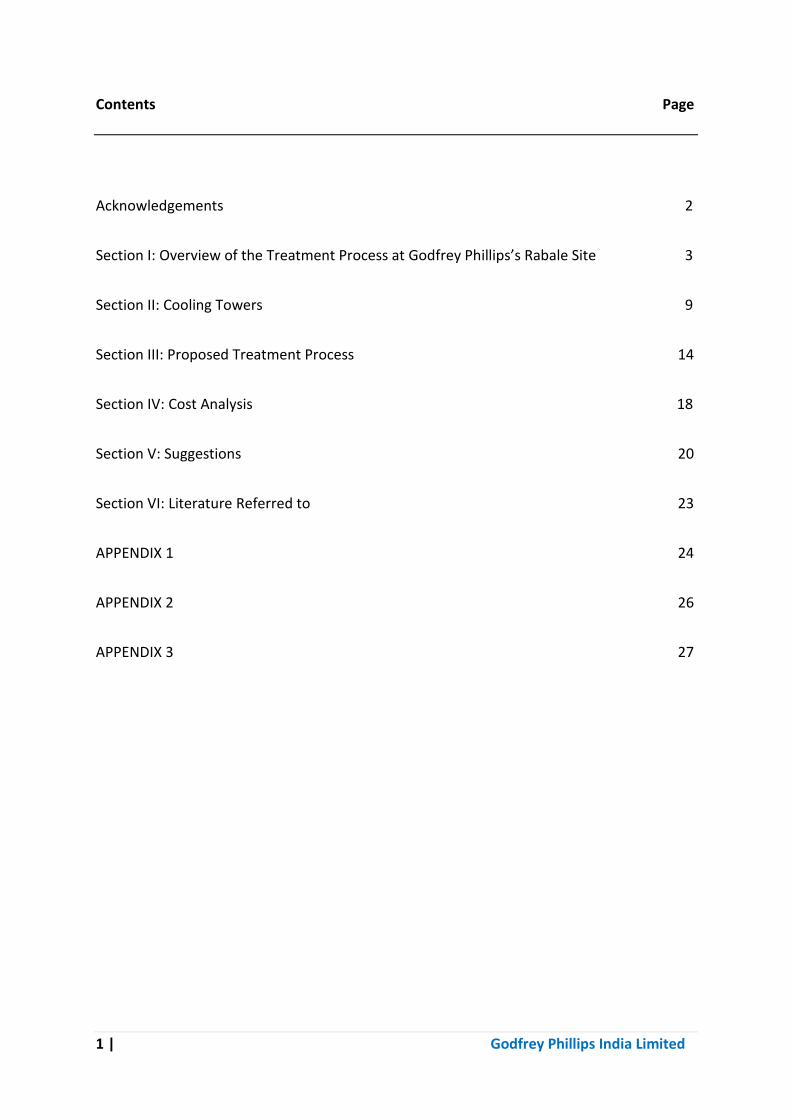
Contents Page
Acknowledgements 2
Section I: Overview of the Treatment Process at Godfrey Phillips’s Rabale Site 3
Section II: Cooling Towers 9
Section III: Proposed Treatment Process 14
Section IV: Cost Analysis 18
Section V: Suggestions 20
Section VI: Literature Referred to 23
APPENDIX 1 24
APPENDIX 2 26
APPENDIX 3 27

2 | Godfrey Phillips India Limited
Acknowledgements
This report has been prepared as a part of my internship project at Godfrey Phillips India Ltd.’s
Rabale plant.
I would like to express my gratitude to my mentor, Raghu Banothu, Deputy Manager –
Engineering & Projects Division. I appreciate his valuable assistance and precious advice
during the internship. I am very grateful to him for giving me the opportunity to contribute in
such an interesting project. Thanks to him, apart from this project, I also got an opportunity
to try my hands on some other areas as well, ranging from Energy Consumption in PMD-SMD
and HVAC system to Solar Photovoltaics setup and Partial Shifting to Open Access mode of
Power transmission.
I would like to thank Shailendra Karve, General Manager – Works, for giving me an insight into
how things work in an industry especially the way to conduct a proper cost analysis and
project management.
My sincere appreciation goes to Sunil Ghodke – Manager (Utilities) and Jaison Raphel – Officer
(Utilities) for being there to help me whenever I was stuck and clearing all the fundamentals
about industry and explaining me how real scenarios are different from ideal cases that we
study in classes.
Personal communications with Sameer, Ganesh and Pramod – Officers (Engg.) are
appreciated. I have been glad to interact with them in the past 2 months because they always
made me learn something new.
Special thanks to WWTP operators, Anil and Sunil, for being my one-stop-location to clear all
the water treatment related queries.
I appreciate the time devoted by Sandeep to make me understand the HVAC system.
The past 2 months was a great learning experience for me and I would like to thank all those
who made it possible.

3 | Godfrey Phillips India Limited
SECTION I
Overview of the Treatment Process at Godfrey Phillips’s Rabale Site
Introduction
The Rabale site of Godfrey Phillips India Ltd. manufactures a wide range of cigarettes including
Marlboro, Four Square, Red and White, Cavanders and Tipper.
The major source of wastewater generation are:
Product Manufacturing Unit – PMD and SMD
R & D Drum wash
Toilet Flushes
The WWTP plant is designed to handle both Effluent and Sewage. The designed parameter for
effluent inflow to WWTP plant is 130 m3/day and sewage inflow is 30 m3/day. The facility uses the
technology called Activated Sludge Process which is one of the most commonly used technologies in
wastewater plants. The process has been described in the next section. The process is designed to
treat the influent with the parameters tabulated below.
Table 1: Parameters at which WWTP plant was designed
STP Input ETP Input Output Units
Flow 30 130 160 m3/day
pH 6 – 8.5 5-9 7-8
TSS 290 350 <30 Mg/L
COD 650 7500 <100 Mg/L
BOD 500 1500 <10 Mg/L
TDS 650 1980 <2000 Mg/L

4 | Godfrey Phillips India Limited
Figure 1: Waste Water Treatment Process
5 | Godfrey Phillips India Limited
The WWTP plant employs the Activated Sludge Process for the treatment of waste-water
generated at the site before it is reused for Flushes, Gardening or discharged to CETP. The process is
explained below.
I. Primary Treatment
1. Bar Screen – This device features openings, generally of uniform size, that is used to retain
solids found in the influent wastewater to the treatment plant. The principal role of screening
is to remove the coarse materials from the flow streams that could damage the following
treatment process equipment or reduce the overall effectiveness of the treatment system and
process reliability.
2. Receiving Sump (ETP and STP) – All the process effluent from the plant passes through the
bar screen, oil/grease trap & collected in the receiving sump. From receiving sump, it is
pumped to the receptical tank. Air grid is provided in this tank.
3. Receptical Tank – This is a sort of storage tank having disc type coarse diffuser for mixing
purpose. Water from this tank is pumped to equalization tank.
4. Equalization Tank (ETP and STP) – In this tank, flow is equalized uniformly, which stabilizes
the effluent. Disc type coarse diffusers are provided in this tank for mixing purpose. In this
tank, Acid/Base dosing is provided as per pH requirement & this it works as a neutralization
tank also. Effluent is then pumped to Primary Tube Settler tank (via Flash Mixing Tank and
Flocculation Tank).
5. Mixing – Followed by the Equalization Tank, we have a Flash mixing tank and a Flocculation
Chamber. The function of the mixer is to blend chemicals and wastewater like Alum prior to
flocculation and settling. In the mixer, we add Alum and then Poly-electrolyte which are
known to enhance the flocculation process.

6 | Godfrey Phillips India Limited
Role of Alum: Alum is used as a coagulant which helps in the coagulation of the
colloidal suspensions. It is positively charged and hence will help in neutralizing the
anions.
Role of Poly-Electrolyte: Poly-Electrolytes are used mainly as flocculants because they
have the ability to form aggregates with the waste water particles, which increases
the mass of the floc and hence enhancing the rate of the flocculation.
6. Flocculation – Flocculation is used to form aggregates or flocs or finely divided particles from
chemically destabilized particles. Flocculation is a transport step that brings about the
collisions between the destabilized particles needed to form larger particles that can be
removed readily by settling or filtration. Flocculation helps in following ways:
Removal of suspended solids and BOD in primary settling facilities.
Improving the performance of secondary treatment facilities since this acts as a
pretreatment to its effluent.
7. Primary Tube Settler – The removal of suspended and colloidal materials from wastewater by
gravity separation is one of the most widely used unit operation in wastewater treatment and
this is done by a settling chamber. Because of alum & polyelectrolyte dosing in the flash mixer
& flocculator respectively, flocs are formed & those are settled & separated in this settler. If
carried out efficiently, it could result in reduction of COD and BOD by 15-20% along with 50-
70% removal of suspended solids.
II. Secondary Treatment
Secondary treatment is often termed as the biological treatment step in the wastewater
treatment process, as it involves the oxidation of dissolved and particulate biodegradable constituents
into acceptable end products.
7 | Godfrey Phillips India Limited
1. Aeration Tank – Water from collection-cum-equalization tank the sewage shall be pumped to
the Aeration Tank, which is proposed with diffused aeration system. This aeration is induced
for generation of bicarbonates by oxidation. This will form heavy flocks and generates H2S,
which will escape. The Aeration allowed helps to make the generated flocks in movement and
avoid settling. The outlet from Aeration tank is passed to settling tank for necessary settling
of heavy flocks & bicarbonates. Sludge from settling tank is re-circulated into the aeration tank
to maintain Food-to-Microbes ratio, passing the supernatant liquid to supernatant tank.
2. Secondary Settling Tank – The activated biomass developed in Aeration Tank shall be
separated from sewage in Secondary Settling tank. Sludge from Settling Tank then taken into
the Sludge Sump.
3. Supernatant Tank – The supernatant water from the secondary settling tank is collected in
supernatant tank where it is dosed with sodium hypo-chlorite for disinfection. The disinfected
treated supernatant is pumped through filter feed pump to Pressure Sand Filter and Activated
carbon filter.
Sodium Hypo-Chlorite: It is applied for water disinfection and oxidation. It has the
advantage that micro-organisms cannot build up any resistance to it. It is effective against
Legionella bacteria and bio-film, in which Legionella bacteria can multiply.
III. Tertiary Treatment
Tertiary treatment is the additional treatment carried out to remove suspended, colloidal and
dissolved constituents remaining after the conventional secondary treatment. Units involved at
Godfrey Phillips’s Rabale Site and their roles:
1. Pressure Sand Filter – It helps to remove the suspended solids present in the treated water.
It is known to remove particulate BOD as well. The Sand media removes the fine impurities
through graded filter beds & then water is passed to activated carbon filter.

8 | Godfrey Phillips India Limited
2. Activated Carbon Filter – This filter reduces the color and odor and polishes the supernatant
treated water through a carbon column designed. The outlet from Activated Carbon Filter is
collected in Treated water tank for further reuse.
Table 2: Quality of treated effluent and the standards of CETP discharge (22 June 2014)
Parameter WWTP outlet MBCB Limit Value Units
pH 7.4 5.5-9.0
COD 33 250 Mg/L
BOD 11 100 Mg/L
TDS 500 2100 Mg/L
TSS 20 100 Mg/L
Table 3: Quality of Inlet sewage and effluent to WWTP (22 June 2014)
Parameter Sewage Inlet Quality Effluent Inlet Quality Units
pH 6.8 5.9
COD 149 1709 Mg/L
BOD 47 480 Mg/L
TSS 48 110 Mg/L

9 | Godfrey Phillips India Limited
SECTION II
Cooling Tower
Continuously rising prices of fresh water and frequent drought and water shortages, have
prompted industries to look out for ways to conserve water. Use of recycled water can reap substantial
monetary benefits because of the large volumes of makeup water requirement in cooling towers.
Water reuse has been implemented successfully in many type of industries in India and abroad.
However, there have been failures, usually due to lack of understanding of how to effectively use the
recycled water.
Evaporative Cooling System
It comprises of two components: a heat exchanger (chiller) and a cooling unit (cooling tower).
The heat exchanger (or chiller) allows cooling water to transfer heat from production source without
direct contact, creating heated water. The main purpose of the cooling tower is to expel the heat from
the heated water efficiently. Heat is transferred to air through evaporation. Cooling tower packing
material or fill optimizes the contact of air and water, improving the heat transfer and efficiency of
the tower.
Evaporation: This is the primary function of the tower and is the method that transfers heat from the
cooling tower to the environment. The quantity of evaporation is not a subject for water efficiency
efforts, although improving the energy efficiency of the systems which is being cooled will reduce the
evaporative load on cooling tower.
Make-Up Water and Blow-Down: All water has some concentration of dissolved or suspended solids.
When water evaporates, the dissolved solids are left behind increasing the concentration in the
remaining water.

10 | Godfrey Phillips India Limited
Implications:
Concentrated solids can build up in the form of scale and cause blockages or corrosion in
cooling system materials.
The growth of algae and other biological matter, due to nutrients present in the water,
can also lead to corrosion.
Water treatment can reduce the impact of the solids and biological matter, however, after a
certain point impurities become too concentrated and solids and biological matter must be removed
from the system to avoid serious damage.
To stay below this minimum acceptable concentration and to maintain the tower’s water
balance, fresh make-up water is added and concentrated blowdown water is discharged.
Drift: A small quantity of water may be carried from the tower as mist or small droplets. Drift loss is
small compared to evaporation and blowdown, and is controlled with baffles and drift eliminators.
Cycles of Concentration (COC): A COC occurs when the water balance of evaporation, make-up water
and other losses concentrated solids by multiples of the make-up water. Determining the optimum
number of COC is a balancing act between savings in water and chemical costs and the increased risk
of scale that can occur with water having higher dissolved solids (TDS).
𝑬 =𝑹 ∗ ∆𝑻
𝟏𝟎𝟎𝟎
𝑩𝟓𝑪𝑶𝑪 =𝑬
(𝑪𝑶𝑪 − 𝟏)
𝑴𝟓𝑪𝑶𝑪 =(𝑬 ∗ 𝑪𝑶𝑪)
(𝑪𝑶𝑪 − 𝟏)
Where,
E = Evaporation Rate (gpm)
11 | Godfrey Phillips India Limited
R = Recirculation Rate (gpm)
∆T = Temperature Difference (⁰C)
B5COC = Blow-Down (gpm)
COC = Cycles of Concentration
M5COC = Make-Up (gpm)
Mass Balance on water flow:
𝑰𝒏 − 𝑶𝒖𝒕 + 𝑮𝒆𝒏𝒆𝒓𝒂𝒕𝒊𝒐𝒏 = 𝑨𝒄𝒄𝒖𝒎𝒖𝒍𝒂𝒕𝒊𝒐𝒏
Water going IN = Makeup water
Water coming OUT = Drift Loss, Blowdown and Leakage
Generation = ZERO
Accumulation = ZERO
𝑴 = 𝑬 + 𝑾 + 𝑫 + 𝑳
Where,
M = Make-Up W = Windage/Drift-Loss D = Blowdown
L = Leakage E = Evaporation
COC = (E+W+D)/ (W+D)
12 | Godfrey Phillips India Limited
Water Quality Consideration
The critical parameters for cooling water are: Conductivity, Total Dissolved Solids (TDS), Hardness, pH
and Alkalinity.
Total Hardness – The amount of dissolved calcium and magnesium in water determines its "hardness."
The total hardness is then broken down into two categories:
I. The carbonate or temporary hardness
II. The non-carbonate or permanent hardness
Hardness, particularly the temporary hardness, is the most common and is responsible for the
deposition of calcium carbonate scale in pipes and equipment. Technically, any bivalent metal ion such
as iron, manganese or tin would constitute hardness, but calcium and magnesium are the two most
prevalent forms.
pH – Control of pH is critical for the majority of cooling water treatment programs. In general, when
pH points to acidic environment, the chances for corrosion increase and when pH points to alkaline
environment, the chances for scale formation increase.
Total Alkalinity – The pH values above 7 signify alkalinity. At pH values less than 8.3, most of the
alkalinity in the water is in the bicarbonate form, and scale formation is normally not a problem.
However, when the pH rises above 8.3, the alkalinity converts from the bicarbonate to the carbonate
and the scale will start to form.
Conductivity and Total Dissolved Solids (TDS) – Conductivity is a measure of the ability of water to
conduct electrical current and it indicates the amount of the dissolved solids (TDS) in water. Pure
distilled water will have a very low conductivity (low minerals) and sea water will have a high
conductivity (high minerals). Dissolved solids present no problem with respect to the cooling capacity
of water, since the evaporation rate of seawater, which has 30,000 ppm total dissolved solids, is only
1% less than that of distilled water. The problem with dissolved solids is that many of the chemical

13 | Godfrey Phillips India Limited
compounds and elements in the water will combine to form highly insoluble mineral deposits on the
heat transfer surfaces generally referred to as “scale”. The scale stubbornly sticks to the surfaces,
gradually builds up and begins to interfere with pipe drainage, heat transfer and water pressure.
The primary maintenance objective in most circulating water systems is to minimize the formation of
scale deposits and conductivity can be used as the controlling value after the TDS/Conductivity
relationship is determined. Silica can produce difficult-to-remove deposits which impedes the heat
transfer rate.
Total Suspended Solid –
Can enter the system with the make-up water and can be generated in the system from
corrosion and scale by-products
TSS can be controlled through pre-treatment or through use of deposit control agents
Ammonia -
It is rapidly oxidized by certain bacteria to nitrite and nitrate – which consumes the fresh
oxygen in water
Promotes bio-film development in the heat exchangers and cooling tower fills
Combines with chloride to form chloramines which can negate the disinfecting effect of
chlorine
Phosphate –
At concentrations greater than 4 mg/L or less and pH controlled between 7.0 and 7.5,
phosphate may provide corrosion protection because it is an anionic inhibitor
It also acts as a nutrient for biofilms

14 | Godfrey Phillips India Limited
SECTION III
Proposed Treatment Process
Reverse Osmosis and Ultra Filtration
Membrane processes offer a number of advantages over conventional water and waste water
treatment processes including higher standards, reduced environmental impact of effluents, reduced
land requirements and the potential for mobile treatment units. Potential application areas range
from sludge dewatering, waste water disinfection, suspended solids and pathogen removal from
supply waters to reverse osmosis desalination.
To reuse the treated waste water in cooling towers and run at desired cycles of concentration,
industry is bound to use Reverse Osmosis technology. The primary reason behind this is that RO is
known to remove/reduce the total dissolved solids (TDS) present in the water whereas no
conventional technology can bring a drastic decrease in the TDS. In a lot of plants, RO system tend to
serve as the purpose of concentrating the feed streams for the evaporator.
But there are a lot of shortcomings of the RO system which demand a need for a pre-
treatment system. There have been a lot of studies conducted to determine the quality of the feed
stream for RO such that best results are obtained. Although a lot of it depends on the chemical
composition of the stream as well as the membrane but a general pre-treatment scheme has been
developed over the years which is:
Removal of suspended solids, commonly by a series of filters.
Adjustment and control of the pH value in the feed (vital factor especially for cellulose acetate
membranes).
Reduction in a tendency of the treated water to form scale (by acidification, water softening
using lime or lime soda, or addition of anti-scale agents).

15 | Godfrey Phillips India Limited
Disinfection and prevention of slime growth.
Prevention of chemical attack
Coagulation/flocculation followed by conventional filtration (Kieniewicz, 2006)
Following the treatment, it is expected that the RO stream is able to match this criteria:
Desired inlet characteristic for RO:
a. Silt Density Index < 3
b. TDS < 100
c. pH: 4.0-7.5
d. Heavy Metals ~ negligible
e. TSS < 25
As for the pre-treatment system, these are the available options which could vary depending on
the characteristics of water although the list is not exhaustive:
i. Pressure Sand Filter
ii. Activated Carbon Filter
iii. Ultrafiltration
iv. Anti-Scaling Dosing (Sodium Hexa-Meta-Phosphate)
v. Anti-Oxidant Scaling (Sodium Meta Bi-Sulphide)
With the Effluent treated water quality with BOD < 20, we will be needing an Ultra-Filtration plant
before RO section to protect the life of the membranes, which will be damaged due to continuous
organic contamination feed. Hence, if UF is installed the RO system will work effectively. Normally, in
any recycling plant (ETP or STP), UF system is offered to protect the RO system and membranes.
Since we already have a Pressure Sand Filter and an Activated Carbon Filter, we would require
chemical dosing of anti-scalants and anti-oxidants along with a UF pre-treatment unit. This will provide
us with a feed compatible with the RO unit.
16 | Godfrey Phillips India Limited
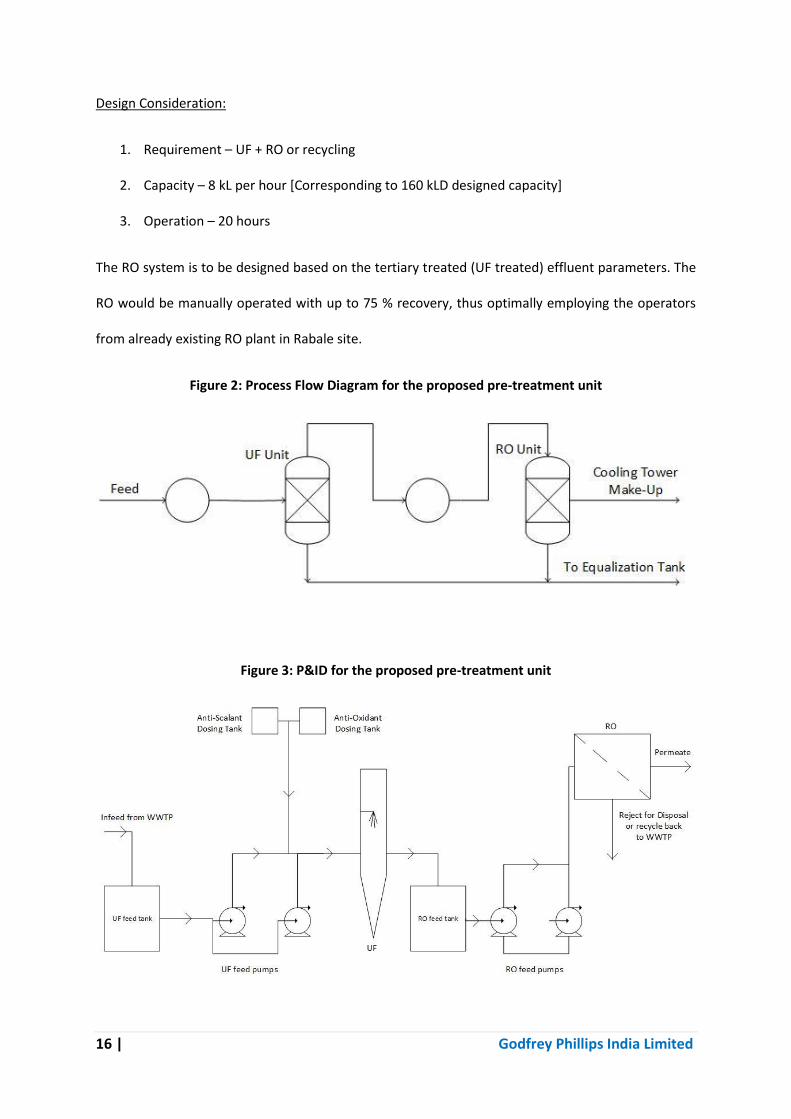
Design Consideration:
1. Requirement – UF + RO or recycling
2. Capacity – 8 kL per hour [Corresponding to 160 kLD designed capacity]
3. Operation – 20 hours
The RO system is to be designed based on the tertiary treated (UF treated) effluent parameters. The
RO would be manually operated with up to 75 % recovery, thus optimally employing the operators
from already existing RO plant in Rabale site.
Figure 2: Process Flow Diagram for the proposed pre-treatment unit
Figure 3: P&ID for the proposed pre-treatment unit
17 | Godfrey Phillips India Limited
Potential Use of the treated water:
1. Cooling Tower Make-Up Water – The RO permeate can be used to fulfill the make-up water
needs in a cooling tower, which is lost in form of evaporation, drift and blowdown.
2. Boiler Feed Water – Boiler is used to generate steam which is the heating medium across most
of the plant here. To maintain a minimum solids level (TDS), boiler water is drained
(blowdown) which could be made up using the recovered water.
3. Gardening Purposes – There is a lot of greeneries in Rabale’s site which needs to be sustained
using a lot of water. RO permeate will be void of essential nutrients and minerals, as it is purer
than tap water. The continuous re-use of WWTP water in the gardening purposes is
recommended as it meets the required criteria.
4. Flushes – Treated water can be easily incorporated under the flush water requirement.
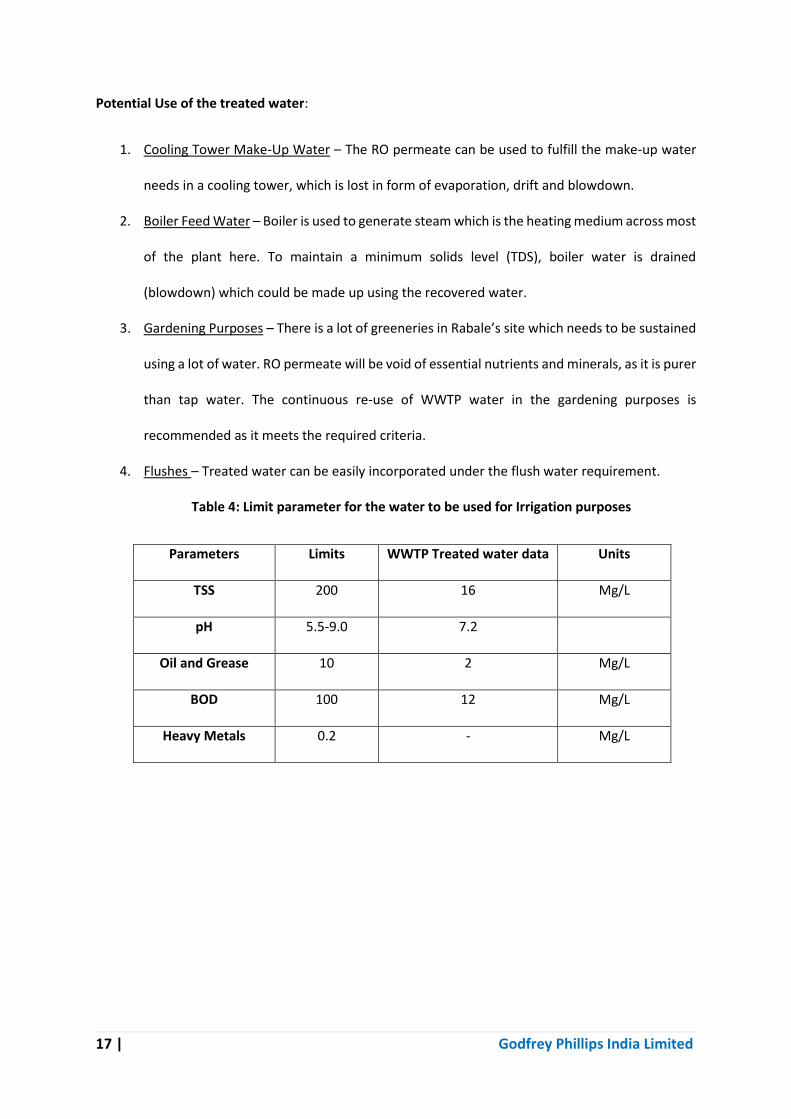
Table 4: Limit parameter for the water to be used for Irrigation purposes
Parameters Limits WWTP Treated water data Units
TSS 200 16 Mg/L
pH 5.5-9.0 7.2
Oil and Grease 10 2 Mg/L
BOD 100 12 Mg/L
Heavy Metals 0.2 - Mg/L
18 | Godfrey Phillips India Limited
SECTION IV
Cost Analysis
Currently, Rabale site uses MIDC water chiefly for variety of purposes, like, Product Manufacturing
Unit, Drum washes, Domestic uses, Soft water requirements, Boiler and Cooling Tower and Floor
Washing.
Designed capacity of the Treatment facility is 160 kL per day. Currently, effluent is being sent to
WWTP for treatment before it is used for other purposes such as Flushes, Gardening, etc. Using the
UF+RO system, up to 75% water can be recovered and reused in cooling towers and even boiler due
to high quality of permeate water.
Cost of water: INR. 38/kL
Monthly Savings (corresponding to 75% recovery): INR. 38*0.75*160*30 = INR. 1,36,800
Annual Savings: INR. 16, 41, 600
With completion of new buildings, the WWTP load will increase due to toilet and flush water as
well as the plant water consumption will increase due to the HVAC system of new buildings.
Investment Required
The fixtures required for UF and RO plant are being mentioned in Appendix 1 and their electric power
requirements in Appendix 2.
Their costing for supply of the 8 kL per hour UF system = INR. 8, 75,000.
Costing for supply of the 8 kL per hour RO system = INR. 12, 75, 000
Erection and commissioning charges for both systems = INR. 75, 000
Total expenses = INR. 22, 25, 000
19 | Godfrey Phillips India Limited
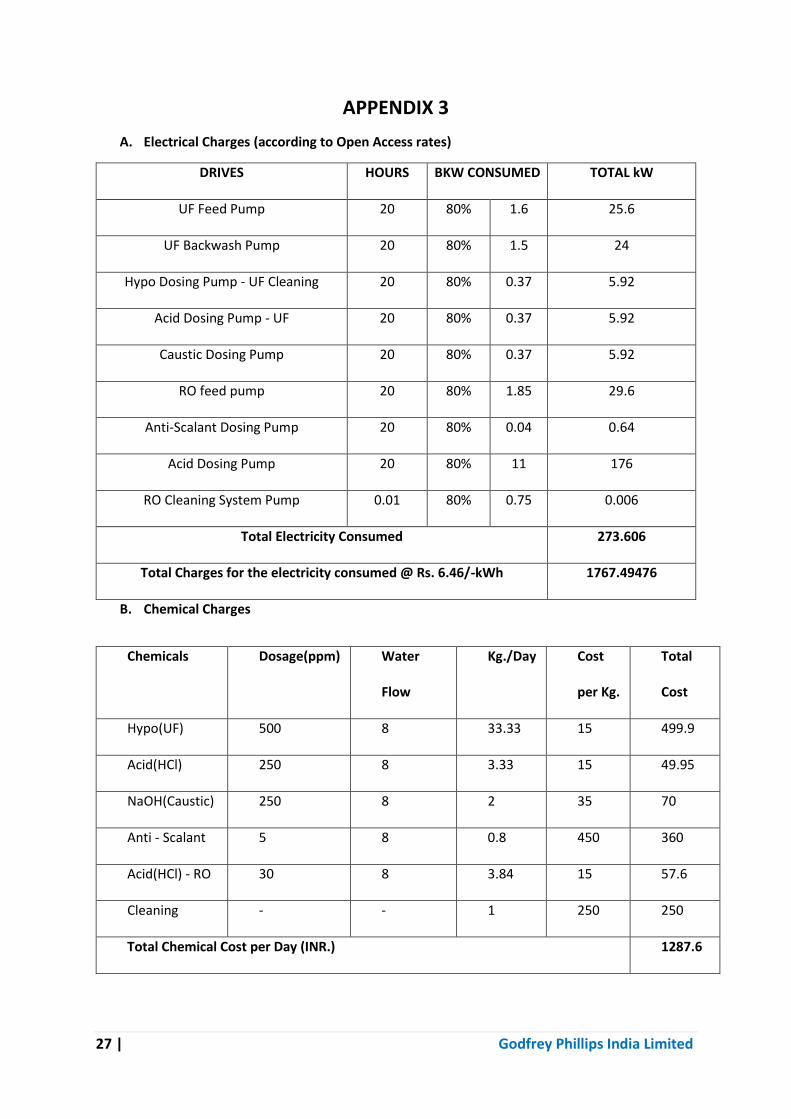
Operation and Maintenance Costs (Details in Appendix 3)
Apart from the one time fixed investment cost, there would be running operation and maintenance
costs as well, comprising of electrical charges and chemical charges.
The electrical load of each fixture required in UF and RO system is mentioned in Appendix 3.
Collectively, the electrical charges per day are INR. 1767.49 and the chemical charges are INR. 1287.6.
So, total O & M costs per day are INR. 3055.09 and amounts to INR. 91652.84 per month.
Payback Period
Considering the running O & M costs of INR. 91652.84 per month and one time investment of INR.
22, 25, 000 along with the savings of INR. 16, 41, 600 per month, the payback period came out to be
approximately 49 months (~4.1 years).

20 | Godfrey Phillips India Limited
SECTION V
SUGGESTIONS
I. Factors to be considered in future tests
Silica – Silica can form silicate deposits particularly in boiler systems/heated loops. They
mainly enter via the make-up water as sand particles. If silica deposits are formed, removal is
particularly difficult. Basically, they act as insulator, sometimes reducing the overall heat
transfer coefficient up to 50% of designed transfer capacity. Keeping a check and having the
silica concentrations in the recirculating water at the expected levels demonstrated that silica
deposits are not forming.
Silt Density Index – The silt density index is a measure for the fouling capacity of water in
reverse osmosis systems. The SDI gives the percent drop per minute in the flow rate of the
water through the filter, averaged over a period of time such as 15 minutes. Typically, spiral
wound reverse osmosis systems will need an SDI < 5, and hollow fiber reverse osmosis system
will need an SDI < 3. In this kind of systems, deep well waters (with a typical SDI of 3) could be
used straight from the source. This should be conducted for the treated effluent since this will
be the inlet to the RO system. (Yiantsios & Karabelas, 2002)
Nitrogen and Phosphorus: Their content may be checked in the RO reject stream if that
might be used for gardening, else the stream can be recycled back to the WWTP facility.

21 | Godfrey Phillips India Limited
II. Up-Scaling of current setup
The current WWTP facility is being designed for 160 m3/day. But it is being operated at a lesser
capacity, which is 80-90 m3 only. So, either the production capacity came down or the design
parameters have been exceeded.
On the other hand, the daily variation results say that the COD can range from 2000 mg/L to
4000 mg/L. This means that the COD of the influent may almost double on consecutive days. This
increases the chances of shock loading in the bacteria and result in decreased efficiency of the plant.
To address these highly variable COD levels, I suggest having an extra stage of biological
treatment.
Moving Bed Biofilm Reactor (MBBR): MBBR systems are based on reactors that are filled with plastic
carriers to provide a surface that is colonized by bacteria that grow into a biofilm. The reactors can be
operated under aerobic conditions for BOD removal and nitrification or under anoxic conditions for
de-nitrification. During operation, the carriers are kept in constant circulation. In an aerobic reactor,
circulation is induced through the action of air bubbles injected into the tank by a coarse bubble
diffuser system. In an anoxic reactor, a submerged mixer is typically supplied. The carriers can occupy
up to 70% of the reactor volume on a bulk basis.
Because MBBR is primarily an attached growth process, treatment capacity is a function
of the specific surface area (SSA) of the reactor. The SSA for a reactor is calculated as the quotient of
the total surface area on the carrier that is available for biofilm establishment and the reactor volume.
The media has its own characteristic SSA. It reflects the amount of surface area available for biofilm
development per unit volume of the media, on a bulk volume basis. The reactor SSA equals the SSA of
the media multiplied by the fraction of the total reactor volume that the media occupies.
Between Trickling Filters, Rotating Biological Contactor and MBBR, MBBR has a greater
performance potential than the other conventional fixed film type processes.
22 | Godfrey Phillips India Limited
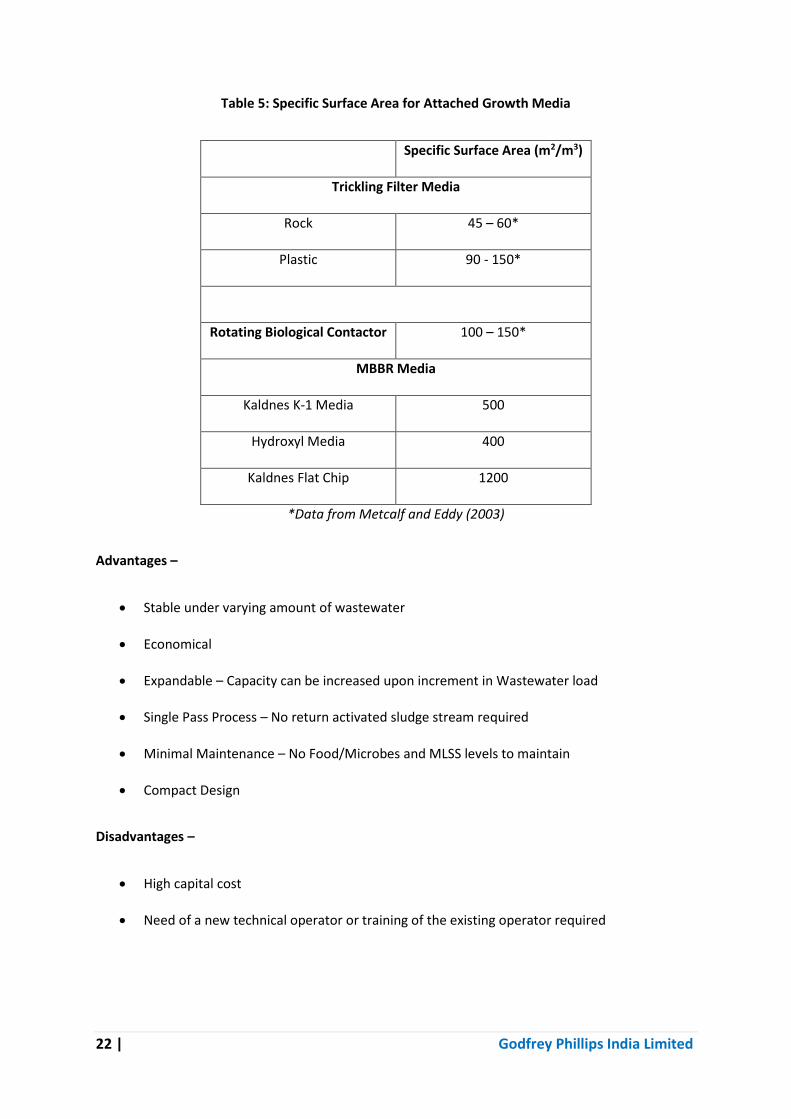
Table 5: Specific Surface Area for Attached Growth Media
Specific Surface Area (m2/m3)
Trickling Filter Media
Rock 45 – 60*
Plastic 90 - 150*
Rotating Biological Contactor 100 – 150*
MBBR Media
Kaldnes K-1 Media 500
Hydroxyl Media 400
Kaldnes Flat Chip 1200
*Data from Metcalf and Eddy (2003)
Advantages –
Stable under varying amount of wastewater
Economical
Expandable – Capacity can be increased upon increment in Wastewater load
Single Pass Process – No return activated sludge stream required
Minimal Maintenance – No Food/Microbes and MLSS levels to maintain
Compact Design
Disadvantages –
High capital cost
Need of a new technical operator or training of the existing operator required
23 | Godfrey Phillips India Limited
SECTION VI
Literature Referred to
1. Kieniewicz, A. (2006). A reverse osmosis (RO) plant for sewage treatment and nutrient
recovery - the influence of pre-treatment methods.
2. (2003) Water Reuse. In Metcalf, & Eddy, Wastewater Engineering - Treatment and Reuse
(pp. 1345 - 1446). New Delhi: McGraw Hil Education (India) Pvt. Ltd.
3. Yiantsios, S. G., & Karabelas, A. J. (2002). An assessment of the Silt Density Index based on RO
membrane colloidal fouling experiments with Iron Oxide particles.
4. Wikipedia. (n.d.). Silt Density Index. Retrieved from Wikipedia - The Free Encyclopedia:
http://en.wikipedia.org/wiki/Silt_Density_Index
5. Heng Li, Ming-Kai Hsieh, Shih-Hsiang Chien (2011). Control of mineral scale deposition in
cooling systems using secondary-treated municipal wastewater.
6. Kapil Kumar, T.R. Sreekrishnan (2014). Effect of mixed liquor volatile suspended solids
(MLVSS) and hydraulic retention time (HRT) on the performance of activated sludge process
during the bio-treatment of real textile wastewater
7. J. Arévalo, L.M. Ruiz (2012). Wastewater reuse after treatment by MBR. Microfiltration or
ultrafiltration?
8. Wenshi Liu (2012). Mineral scaling mitigation in cooling systems using tertiary-treated
municipal wastewater
9. Mauno Into (2004). Reuse of industrial wastewater following treatment with reverse osmosis
10. Ilda Vergili, Yasemin Kaya (2011). Techno-economic analysis of textile dye bath wastewater
treatment by integrated membrane processes under the zero liquid discharge approach

24 | Godfrey Phillips India Limited
APPENDIX 1
A. UF system for 8 kL/hr. feed flow
Sl. No. Description Quantity
1 Treated Effluent storage tank in RCC 1
2 UF feed pump 2
3 Bag filter in PVC with PP bag 1
4 UF system with skid and PLC skid 1
5 UF Modules (Team - Membrane Hitec) 3
6 Interconnecting pipe work in uPVC 1
7 Backwash cum CIP system pump in SS 316 1
8 HCL dosing system for CIP 1
9 Caustic dosing system for CIP 1
10 NaOCl dosing system for CIP 1
11 UF permeate cum backwash tank in RCC Civil 1
12 Control Panel with PLC and Cable in the skid 1
13 Electromagnetic flow meter at UF permeate 1
14 Pressure Gauges across UF inlet and outlet 2
15 Air Compressor for UF auto valve operation 1
B. RO system for 8 kL/hr. feed flow
Sl. No. Description Quantity
1 RO feed cum CIP pumps in SS 316 2
2 Anti-Scalant Dosing Pump 1
3 Anti-Scalant Dosing Tank 1

25 | Godfrey Phillips India Limited
4 Anti-oxidant Dosing Pump with Dump valve 1
5 Anti-oxidant Dosing Tank 1
6 Micron Filter For RO Feed with PP 5 micron Spun cartridges 1
7 High Pressure Pump for RO in SS 316 2
8 RO Block with skid & piping with required membranes and pressure tubes 1
9 RO membranes 8040 8
10 RO Membranes pressure tubes in FRP with 400 psi rating - 4 element long 2
11 Pressure Gauges 2
12 Pressure Switches (Low & High) 2
13 Level Switches (Float type) RO feed tank 1
14 Flow Meter in the RO skid wet panel 2
15 pH Meter 1
16 Conductivity Meter 1
17 Control panel with cable in the skid 1
18 RO CIP cleaning system tank in HDPE white 1
19 RO CIP Cartridge filter with PP 5 micron spun type cartridges 1
26 | Godfrey Phillips India Limited
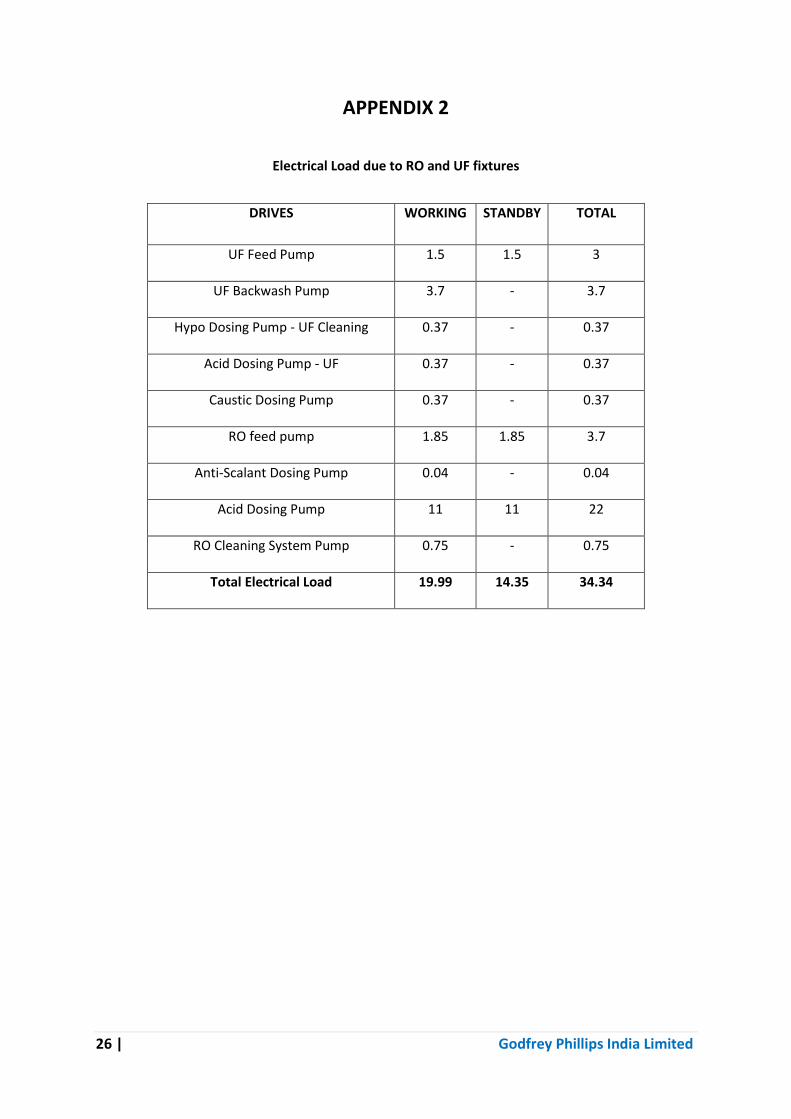
APPENDIX 2
Electrical Load due to RO and UF fixtures
DRIVES WORKING STANDBY TOTAL
UF Feed Pump 1.5 1.5 3
UF Backwash Pump 3.7 - 3.7
Hypo Dosing Pump - UF Cleaning 0.37 - 0.37
Acid Dosing Pump - UF 0.37 - 0.37
Caustic Dosing Pump 0.37 - 0.37
RO feed pump 1.85 1.85 3.7
Anti-Scalant Dosing Pump 0.04 - 0.04
Acid Dosing Pump 11 11 22
RO Cleaning System Pump 0.75 - 0.75
Total Electrical Load 19.99 14.35 34.34
27 | Godfrey Phillips India Limited
APPENDIX 3
A. Electrical Charges (according to Open Access rates)
DRIVES HOURS BKW CONSUMED TOTAL kW
UF Feed Pump 20 80% 1.6 25.6
UF Backwash Pump 20 80% 1.5 24
Hypo Dosing Pump - UF Cleaning 20 80% 0.37 5.92
Acid Dosing Pump - UF 20 80% 0.37 5.92
Caustic Dosing Pump 20 80% 0.37 5.92
RO feed pump 20 80% 1.85 29.6
Anti-Scalant Dosing Pump 20 80% 0.04 0.64
Acid Dosing Pump 20 80% 11 176
RO Cleaning System Pump 0.01 80% 0.75 0.006
Total Electricity Consumed 273.606
Total Charges for the electricity consumed @ Rs. 6.46/-kWh 1767.49476
B. Chemical Charges
Chemicals Dosage(ppm) Water
Flow
Kg./Day Cost
per Kg.
Total
Cost
Hypo(UF) 500 8 33.33 15 499.9
Acid(HCl) 250 8 3.33 15 49.95
NaOH(Caustic) 250 8 2 35 70
Anti - Scalant 5 8 0.8 450 360
Acid(HCl) - RO 30 8 3.84 15 57.6
Cleaning - - 1 250 250
Total Chemical Cost per Day (INR.) 1287.6