rev frbsf 195401 supp
TRANSCRIPT

C A L I F O R N I A A G R I C U L T U R E
A N D I N T E R N A T I O N A L C O M M O D I T Y D E V E L O P M E N T S
Supplement to
MONTHLY REVIEWJANUARY, 1954
F E D E R A L R E S E R V E B A N K O F S A N F R A N C I S C O
Digitized for FRASER http://fraser.stlouisfed.org/ Federal Reserve Bank of St. Louis
• • C O N T E N T S • •
Page
SUMMARY AND CONCLUSIONS................................ . 1
WORLD WAR II AND THE PATTERN OF COMMODITY TRADE . 4
INDIVIDUAL COMMODITY PROBLEMS AND POLICIES . . . 8
SOME IMPLICATIONS FOR PUBLIC POLICY . . . . . . 19
USEFUL SOURCE MATERIALS........................... . 21
Prepared by Boris C. Swerling, Associate Economist,
Food Research Institute, Stanford University, in cooperation with
the Research Department.
Digitized for FRASER http://fraser.stlouisfed.org/ Federal Reserve Bank of St. Louis

SUMMARY AND CONCLUSIONS
T h e main features of California agriculture combine to form a highly distinctive, if not unique, pattern. As
compared with other regions that enjoy a comparably high farm income— Iowa or Texas, New Zealand or Denmark— the role of animal products is relatively minor. But the diversity of crops suited to the state’s wide range of natural conditions is almost legendary. Such diversity implies a flexible agricultural economy and there is little land outside California’s irrigated interior valleys that can be transferred as readily from crop to crop in response to market opportunities of the moment. By contrast, the large areas devoted to orchards, committed to years of waiting before the first commercial harvest and many years of almost automatic productivity thereafter, rank with the most rigid and inflexible agricultural regions in the United States. Distinctive also, for so many individual products, is the extent to which specialization has been carried, the dependence on distant markets, and the large share of national output produced by this state.
The combination of diversity and flexibility, specialization and rigidity, lends particular importance to the external relations of California’s agriculture. Within the national market, developments of the last fifteen years have considerably altered the state’s competitive position in a number of crops. Mechanization of the harvest has given California some advantages over Colorado and Michigan in sugar beets and over the Southeast in cotton, while the introduction of frozen concentrates has operated in favor of the Florida orange grower. With consumer acceptance of margarine, cottonseed oil has put pressure on the local dairy industry and the dairy states of the Middle West. Cotton has been losing considerable ground to synthetic fibers and to paper containers, but there also have been new uses to offset some of the loss. For products as different as lettuce and potatoes, advances and retreats by competing regions of domestic production have been substantial.
Important as United States developments have been for California’s agriculture during the last decade and a half, there is no overlooking the local impact of changed patterns of international trade, foreign markets, and production abroad. Events overseas are particularly important to the California-grown commodities listed in Table 1. For the selected group, either much domestic production goes into export, or much domestic consumption is based on imports, or the commodity’s role in economic policy is particularly suggestive. A wide assortment of types and a wide network of relationships are reflected. Included in the Table are products that America has traditionally exported, like cotton and fresh fruits, along side others customarily imported, like sugar and wool. In flaxseed, the United States has shifted from major world importer to self-sufficient status, while for wool the reliance on foreign sources of supply is much greater today than prewar. In an impressive number of cases— barley, beet sugar, dry edible beans, and many individual fruits and nuts— no state contributes more than Cali
fornia does to the national output. Only one state grew more oranges in 1952; only two produced more cotton, wool, or rice. In grapes, lemons, almonds, and dried figs, domestic supply originates almost exclusively here.
Commodities specified in Table 1 occupy a respectable proportion of California’s crop acreage and are responsible for a substantial share of the state’s farm income. About 11 million acres were used for all crops in 1952, and the cash receipts from the state’s agricultural output (including animal products) amounted to some $2.7 billion. About 3.8 million acres and over $600 million of these totals were contributed by listed field crops alone, with cotton very much in the lead. The fruit and nut orchards, which are well represented in the list, were responsible for an additional 1.3 million acres and $480 million of product. While California’s huge surplus of fresh and canned vegetables primarily serves the national market, listed commodities frequently compete with unlisted ones for irrigated land or harvest labor.
Table 1 rather understates than exaggerates the importance to California of commodity developments abroad. Since competition is close between cottonseed and soybeans, between linseed oil and soybean oil, and between edible tree nuts and peanuts, there are close ties to American export crops not commercially produced within the state. Rice and wheat are competitive grains for some consumers in the Orient. Even North Carolinian tobacco may be regarded as a substitute for California deciduous or citrus fruit by a country that must choose between these competing uses for its scarce dollar exchange. In short, the agricultural fortunes of the state depend on markets in such broad commodity categories as grains, fibers, vegetable oilseeds, fruits, and nuts. Links are therefore intimate with a wide assortment of products grown exclusively outside the United States, including copra and palm oil, bananas and jute.
The external relations of California’s agriculture cover as wide a range of territory as they do of commodities. Areas that offer competition to its products will be found in the Far East (rice, cotton, sugar, copra), the Southern Hemisphere (wool, linseed, fruits), the Caribbean (sugar), the Mediterranean (fruits, nuts, rice), and even Africa (cotton and vegetable oilseeds). The state’s interest in markets is equally global. Exports depend on the fortunes of the Japanese, British, and Indian textile industries; the rice supplies and requirements of India, Indonesia, Ceylon, Korea, and Japan; the rising prosperity of Canada, upon which fruit and vegetable exports now largely depend; and the prospects for a sufficiently healthy economy in Western Europe (including Germany) to absorb traditional export commodities.
Domestic price and cost relationships may appear to have accounted for the spectacular shifts in recent years in the composition of California farm output as illustrated in Charts 1-5. By 1953 as compared with 1941, cotton production had more than quadrupled, rice had tripled, barley
1
Digitized for FRASER http://fraser.stlouisfed.org/ Federal Reserve Bank of St. Louis

had doubled, and sugar beets were up one-third. Flaxseed, on the other hand, had been cut by two-thirds and shorn wool by a third. For cotton and rice, the trends have been persistent ones. Cottonseed, though its fortunes reflect developments in the market for oilseeds, varies along with cotton, the fiber with which it is jointly produced. The trough in wool production was passed in 1948, and a slow rise has proceeded since then. The greatest irregularity has been characteristic of flaxseed and sugar beets. Under the stimulus of wartime and immediate postwar price incentives, flaxseed reached peak levels in 1943 and in 1948, but has since reverted to more customary figures. Sugar beets, which had climbed to almost 3 million tons by 1940, fell 60 percent during the wartime years of sugar shortage but relatively unremunerative domestic sugar prices. Recovery to 4 million tons came by 1950, a year when acreage restrictions were imposed on cotton. With cotton under control in 1954, beets will again be on the rise.
Events overseas, even when their bearing on California has not been obvious, have frequently been crucial to many of these adjustments. World War II was responsible for a series of jolts to the international trading system, which finds direct counterparts in the agricultural economy of this state. Wartime disruption of trading relationships, transitory postwar deficiencies in liber
ated countries, and new territorial alignments, all have had important local repercussions. The war cut directly across the peacetime links between importing regions and customary sources of supply. For lack of access to continental Europe and Japan, world stocks of wool and cotton climbed sharply. Neither commodity was particularly attractive to California growers during the war. By contrast, incentives were strong to expand domestic output of flaxseed for protective coatings, since the long ocean supply lines from Argentina were vulnerable. Shipping was unavailable for customary United States imports of fruits, nuts, and dried figs from Central America or the Mediterranean, and domestic supplies preempted the market. Renewed availability of offshore supplies in recent years creates sales difficulties for the relevant domestic producers and. policy dilemmas for the Federal Government. Of the agricultural commodities that continued to move eastward across the Atlantic during the war, California’s fresh fruit was of necessity sacrificed to canned tomatoes and raisins, while concentrated protein foods held obvious advantages over shipment of feed barley.
Shifting military operations and the economic disorganization that followed in the wake of victory created drastic but temporary increases in Europe’s import re-
T a b l e 1
P r o d u c t io n a n d F o r e ig n T r a d e , P r e w a r a n d P o s t w a r , S e le c te d C o m m o d it ie s
Sugar, DryWool cane and edible
(apparel) Rice Grain Cottonseedi beet beansCotton (thousands (thousands of Barley sorghums Flaxseed oil (thousands of (thousands of
U N I T E D S T A T E S (thousands of lbs. 100# bass. (thousands (thousands (thousands (millions short tons. 100# bags.Production of bales) actual wt.) rough basis) o f bu.) of bu.) o f bu.) of lbs.) raw value) clean basis)
1937-39 .................................. 14,235 424,297 23,999 252,234 63,479 11,569 1,565 4,020* 14,6371947-49 .................................. 14,288 280,798 38,080 278,159 124,300 46,132 1,609 3,865* 18,364
Net exports ( + ) ornet imports (— )1937-39 .................................. + 5,159 — 92,525 + 3,973 + 7,428 + 255* — 16,606 — 38 — 3,018 + 313 •1947-49 .................................. + 4,021 — 481,059 + 14,275 + 15,034 + 29,4092 + 1,782 + 88 — 3,665 + 1,544 •
Net exports ( + ) or net imports (— ) as percent ofproduction1937-39 .................................. + 36% — 2 2% + 17% + 3 % + 0 .4% — 144% — 2 % — 75% + 2 %1947-49 .................................. + 2 8% — 171% + 37% + 5% + 2 4 .0 % + 4 % + 5 % — 95% + 8 %
C A L IF O R N IAProduction, 1952 .................... 1,825 15,850* 11,880 53,892 3,990 1,408 7184 370* 3,873Percent share of
national production............ 12% 7 % a 2 4% 2 4% 5% 5 % 12% 26 % 5 25%State ranking, 1952 ............... 3rd 3rd 3rd 1st 4th 4th 3rd 1st 1st
(thousands of bu.) 155,382 111,730
13,305996
+ 9 % + 1%
8,820
10%4th
Apricots(tons)
280,450215,200
+ 103,651 + 21,426
+ 3 7 % + 10%
156,000
89%1st
Grapes Peaches PearsPlums
and prunesU N IT E D S T A T E S (thousands of (thousands (thousands (short tons.
Production short tons) of bu.) of bu.) fresh basis)1937-39 .................................. 2,615 59,398
74,14730,065 818,200
1947-49 .................................. 2,921 32,683 639,800Net exports ( + ) or
net imports (— )1937-39 .................................. + 287 + 3,464 + 5,430 + 2 3 8 ,9 6 01947-49 .................................. + 400 + 1,284 + 1,027 + 22 9 ,3 5 8
N et exports ( + ) or net imports (— ) as percent of production1937-39 .................................. + 11% + 6 % + 18% + 29%1947-49 .................................. + 14% + 2 % + 3 % + 36%
C A L IF O R N IA Production, 1952 .................... 2,976 30,127 16,084 390,500Percent share of
national production............ 94 % 4 8% 52% 80%State ranking, 1952............... 1st 1st 1st 1st
Oranges and tangerines Grapefruit
(thousands (thousands of boxes) of boxes)76,186 36,640
109,032 47,887
Lemons(thousands of boxes) 10,798 11,413
Figs,dried(tons)
28,73332,233
Hops(thousands
o f lbs.) 38,902 50,238
Almonds(short tons, unshelled)
18,90035,500
Walnuts(short tons, unshelled)
60,100 74,600
+ 6,076 + 7,962
+ 2,744 + 4,132
+ 658 + 56
— 2,562 + 2,294
— 2,033 + 7,165
— 3,308— 12,869
+ 88 — 1,724
+ 8 % + 7%
+ 7% + 9 %
+ 6 .0 %+ 0 .5 %
— 9 % + 7%
— 5% + 14%
— 18%— 36%
+ 0 .1 %— 2.0%
42,600 2,340 13,100 26,500 15,075 35,300 73,000
34%2nd
6 %4th
100%1st
100%1st
25%3rd
100%1st
90 %1st
4Cottonseed (thousands of tons). BRefined beet sugar, 1951-52 crop. In addi-1 Including receipts from Territories. 2Gross exports. sShorn wool only, tion, most of the Hawaiian cane sugar is refined in California.N ote: California’s share of national production of fruits refers to commercial production omly.Source: Mainly from United States Department of Agriculture, United States Farm Products in Foreign Trade (1953) and Crop Production Summary (D e
cember, 1952).
2
Digitized for FRASER http://fraser.stlouisfed.org/ Federal Reserve Bank of St. Louis

quirements. Some of these were more important to the wheat states, the Corn Belt, and the dairy regions than to California. But the 1943 high in flaxseed production was associated with Lend-Lease shipment to the Russians who, as a result of German conquest of the Ukraine, lost the normal source of what was for them an edible vegetable oil. While the rise of cotton as the major California field crop represents an interregional shift within the United States, scarcity of textile products overseas during the early postwar period created an external environment favorable to the shift. As prospects for United States exports of raw cotton and cotton textiles deteriorate, problems of interregional competition are intensified.
Japanese invasion of sources of supply in Southeast Asia left its legacy of commodity difficulties, especially for rice, sugar, and the vegetable oilseeds. In each case, the immediate loss had to be counteracted by greater output in the Western Hemisphere. The impact of Japanese conquest was broader than mere wartime destruction and postwar social disorganization. Local nationalistic sentiments were sharpened; export of primary commodities was, as a matter of public policy, held in low regard by some of the new nation-states throughout the years of postwar shortage; and there was a serious weakening of certain indirect links between Europe and the United States in the system of international payments. The entire expansion in California’s rice crop was motivated by export markets initially opened by the drop in Asian exports. Sugar beets, on the other hand, were a low priority crop in wartime because the alternative of expanding Cuban supplies of cane sugar was more attractive. Indeed, an incidental effect of American sugar policy has been to discourage domestic production when world supplies are tight but to encourage production in continental United States when supplies abroad are more abundant.1
The detailed discussion of some selected commodity problems and policies, beginning on page 8, has obvious limitations. Certainly a far more intensive treatment of specific products would be required before one could come to close grips with thorny questions of American agricultural policy. But there are compensating advantages in briefly ranging over a wide landscape. Breadth of coverage suggests that policy ought to recognize the peculiar environment of particular commodities and yet not attempt to deal with the problems of single commodities in complete isolation. Moreover, there are significant implications to be drawn for California’s agricultural welfare and for United States trade policy generally.
The postwar environment has made national security a prime goal of public policy. Consider some of California’s agricultural commodities purely from this standpoint of national defense. Cuba’s cane sugar is closer to the major deficit states of the Atlantic seaboard than are the beet surpluses of the Far West and the Intermountain region. Though ocean transport is required to move it, one can presume successful control of the Caribbean
1 For a more complete explanation of this point see p. 13.
area (with its access to the Panama Canal) by the United States Navy. Transcontinental rail haulage in any case becomes something of a bottleneck under the heavy demands of war. Continental beet sugar accordingly has serious limitations in a national emergency. Nor do potential wartime needs justify high peacetime protection for an annual crop, like flaxseed, which can quickly be introduced into field plantings when the emergency requires. The appropriate defense policy for wool is more complicated owing to the time lag to be undergone before domestic flocks can be brought into commercial production and long ocean supply lines. But some qualities of wool most appropriate for defense purposes are available only from abroad. Besides, larger peacetime imports and strategic stockpiling provide some insurance against wartime scarcity.
But concentrating on precautions against open hostilities had best not blind us to the serious dangers represented by nonmilitary Communist penetration abroad. The Soviet countries have, for example, recently opened an economic offensive that calls for closer trade relations with non-Communist countries. Whether there is anything substantial in Soviet Russia’s publicized promises to produce more consumer goods, or whether defense potential continues to receive top priority, the Soviet trade tactic can be expected to continue. For some commodities, moreover, Communist countries are in a particularly strategic position. Exportable surpluses of soybeans and peanuts now controlled by Red China made a significant contribution to the food supply of both Japan and Western Europe before the war. Almost all beet sugar surpluses in prewar Europe originated in regions that now form part of the Soviet bloc. In addition, political and social unrest fomented by Communist action in Southeast Asia place that Rice Bowl in considerable jeopardy.
If non-Communist countries face restricted outlets in the United States, they will be less able to resist attractive offers from non-dollar Communist sources. Not only will United States agriculture face increasing competition but there are dangers as well both to the growth of international trade and to our own national security. Trade relationships with Communist countries have few of the characteristics of normal commercial dealings. Soviet- style foreign trade is organized around state trading monopolies, bilateral agreements, and nonmarket considerations. Their trading partners must expect extended political negotiations, unfavorable terms of trade, jerky variations in trade volume and direction. The Communists may export whenever the propaganda impact seems sufficiently attractive, or absorb imports with the deliberate intention of creating Soviet-dependent economic sectors in foreign countries, regardless of internal consumption requirements or current rates of domestic production.
Though the volume of United States imports is a matter of major concern to foreign countries, a high level of foreign trade is less vital to the immediate economic wel
3
Digitized for FRASER http://fraser.stlouisfed.org/ Federal Reserve Bank of St. Louis

fare of this country than of most others. But greater self- sufficiency implies sacrificing those commodities that are relatively well-adapted to American conditions to those that are less so. At present price levels, an enormous domestic production of wheat and cotton is generated, far in excess of American consumption at those same prices. But an exclusively national supply of wool could not be gained without placing the entire woolen-textile industry at the mercy of synthetic-fiber manufactures. Cuba could expand sugar output in return for prices well below the level earned in California or Hawaii. But foreign growers of rice have responded far less spectacularly than those in California to recent prices for that commodity.
For California agriculture as a whole, which reacts so readily to shifting export requirements, there would thus seem to be a clear interest in a high aggregate volume of trade, almost regardless of the particular commodity composition of foreign demand. Much the same interest appears to hold for United States agriculture generally. The claim is frequently made that agriculture is being asked to shoulder the burden of import competition, while export expansion is alleged to benefit primarily manufactured goods. But the great peculiarity of the American trading position is the persisting importance of agricul
tural produce in the export shipments of this industrial nation. Though agriculture's share of exports has indeed been declining over the years, its contribution in this sphere has dropped off far less rapidly than its share in national output as a whole. In times of tight dollar supplies abroad, foreign countries seek to patronize nondollar sources (as in cotton), or dispense altogether with particular types of agricultural imports (like California’s deciduous fruits), or reduce takings of American agricultural crops in favor of United States capital equipment that fit into local plans for industrialization. Californian and American agriculture would appear to have more to fear from the competition of manufactured goods if total trade is low than if world trade is high.
At the present time, domestic agricultural programs and United States foreign economic policy are undergoing official review. As the preceding paragraphs have attempted to indicate, these are exceedingly complex and controversial areas of public policy, and strong arguments can be mustered on both sides of the issues. The following discussion, by considering war-induced changes in international trade and some typical commodity problems with which the nation and the state must now deal, may help place complex policy issues in their broader perspective.
WORLD WAR II AND THE PATTERN OF COMMODITY TRADE
T h e war, by requiring the husbanding of scarce shipping as well as by cutting peacetime links between im
porting regions and their customary sources of supply, had certain immediate effects on the direction of trade and the nature of commodities traded. For lack of access to Western Europe, unmarketable surpluses of wool, cotton, wheat, and corn could pile up in the Southern and Western Hemispheres outside the zones of land warfare at a time when civilians on the Continent were deprived by the lack of them. The long ocean supply lines necessary for United States imports of Argentina’s flaxseed for protective coatings, of India’s jute and burlap for bagging, became necessarily a matter of military concern. There were therefore strong incentives to expand domestic production, as was possible in flaxseed, or to push domestic substitutes, such as cotton or paper in place of jute. In the absence of customary fruit or nut imports from the Mediterranean region or Central America, domestic sources readily filled the gap. Of commodities that continued to move across the North Atlantic, concentrated foods like meat and dairy products, a high-protein vegetable like dry edible beans, a processed commodity of high vitamin content like canned tomatoes, or a dried fruit like raisins, held priority over fresh fruits or feed barley.
Within the zones of actual military operations, the succession of Axis invasion and occupation, naval blockade, and ultimate Allied victory brought a gradual decline of agricultural production. Fertilizers ceased to be available; equipment was run down for lack of proper maintenance. In Asia, draft animals were slaughtered in
the wake of war while meat animal populations fell off sharply in Europe for lack of imported feed. Disorganization was most complete in the several years after hostilities ended, when internal transport facilities also broke down. In the face of war-induced decline in production, liberation of North Africa, southern Italy, and Western Europe, and defeat of Japan, progressively increased the claims against exportable supplies available elsewhere, mainly in North America.
Even where dislocations in trade, production, or supplies seemed primarily temporary in character, they generated longer-term effects. Domestic production, once expanded to meet passing requirements abroad or to compensate for wartime lack of customary imports, cannot adjust painlessly to the return of more normal conditions. Moreover, war brought many shifts in the trade relationships between Europe on the one hand and Asia, Africa, and the Americas on the other, which are not likely to be reversed soon. Before the war, about one half of Latin America’s exports and imports were with European countries. Wartime difficulties in shipping South America’s exportable staples promoted inter-America trade at the expense of trans-Atlantic. Europe, for its part, looked increasingly to Africa for the oilseeds formerly available from the Far East and for the cotton and tobacco customarily imported from the Americas. For a large number of commodities related to California’s agriculture, the direct and indirect effects of World War II have been particularly striking. Eight years after the end of the war, these factors still leave their mark on the patterns of world trade.
4
Digitized for FRASER http://fraser.stlouisfed.org/ Federal Reserve Bank of St. Louis

While German-controlled Europe depended in peacetime on substantial imports of feed, food, and raw materials, the Southeast Asian region overrun by the Japanese had been rich in exportable surpluses of primary commodities. The area's virtual world monoply in natural rubber is well-known, but its pre-eminent position as a source of several basic foodstuffs is a less familiar story. The countries of Southeast Asia dominated world exports (though not world production) of rice hardly less completely than rubber. While for this commodity much of the commerce was intra-Asian, large tonnages had gone to Asiatic countries outside the area of conquest, such as India and Ceylon, and almost one-quarter of the supplies from the region went to destinations in Europe and Latin America. About one-sixth of the sugar that moved in ocean commerce in 1934-38 originated in the Netherlands East Indies and the Philippine Islands, even after a period of official crop restriction. As a source of oil, no vegetable seed was more important in international trade than copra, almost two-thirds of it from these same two territories. The Philippines supplied close to one half of total world exports of coconut oil, and the Dutch East Indies one-third of the trade in palm oil.
The blow to world supplies, especially of rice and oilseeds, had wide repercussions. The shortage of rice disorganized the food supply of traditional importing countries, some of them (like Ceylon) oriented to specialized production of export staples and high imports of food. Besides, Europe and the United States were net importers of oilseeds and sugar, and lack of supplies from Southeast Asia contributed to an extremely tight commodity position. While postwar deficiencies of sugar were compensated by larger production in Cuba, no comparable supplies of rice came forward to fill the gap. The Japanese legacy was not merely loss of supplies, wartime destruction, and social disorganization, but in addition local nationalistic sentiments were sharpened and links with metropolitan countries broken, some of them permanently. This tropical region, moreover, since it earned dollars by its trade surplus with the United States which were applied against a deficit on service account with Europe, played a pivotal role in Europe’s prewar balance of payments. In the postwar period the dollar surplus disappeared, the region shifted from net exporter to net importer of foodstuffs, and one method of offsetting Europe's dollar deficit ceased to exist.
New territorial arrangements: Germany
Though prewar Germany imported large quantities of tropical products, corn, and vegetable oilseeds, as well as industrial crops like cotton and wool, for many major agricultural commodities it was practically self-sufficient. Only about 1 percent of the national consumption of wheat, rye, barley, oats, and potatoes were supplied by imports. For animal and dairy products, the proportion was higher, though not more than 15 percent for butter and cheese dr 3 percent for méat and meat products. Of
J a p a n e s e c o n tr o l o f S o u t h e a s t A s i a refined beet sugar, the nation had a small exportable surplus.
Concealed behind these moderate national aggregates was an internal pattern of regional specialization and interregional exchange, which the Potsdam settlement severely disrupted. Despite their industrial strength, the regions marked out for occupation by the United States, France, and the United Kingdom formed a deficit area agriculturally. In 1936, the three Western Zones are estimated to have imported one-quarter of the wheat, rye, and sugar, one-tenth of the coarse grains, and one-twentieth of the potatoes, meat, butter, and cheese they consumed. Metropolitan Berlin of necessity had to depend on in-shipments for its entire supply of raw agricultural produce. Of the combined deficiencies in Berlin and the three Western Zones in 1936, about 30 percent of the sugar, 50 percent of the grains and potatoes, 50 percent of the butter and cheese, and almost the full deficit of meat were obtained from the so-called “separated areas," lands east of the Oder-Neisse line now ceded to Poland or the U. S. S. R. The remaining deficits in sugar, wheat, rye, barley, oats, and potatoes came for the most part from the territory that became the Soviet Zone of Germany.
These territorial changes, together with an influx of about 8 million people, clearly implied difficult problems of agricultural readjustment in the zones which became the Federal Republic of Germany. Even with no deterioration in East-West relations, commodities could not be expected to flow across national frontiers as easily as they had moved in domestic commerce. Lack of common currency and disappearance of former sources of commercial credit would have choked off trade even in the absence of new trade barriers. In the unsettled conditions immediately following the war, when production was disorganized in normally surplus and normally deficit regions alike, there was every incentive to husband any local food supplies and to promote domestic agricultural production. The stage was set for further dissection of the European agricultural system, such as had followed the breakup of the Austro-Hungarian Empire at the close of World War I. National agricultural policies, indeed, became a major barrier to the economic integration of postwar Europe.
East-West Trade in Europe
Problems arising from the territorial division of Germany overlap those resulting from worsening relations between the West and the Soviet bloc. Before the war such countries as Poland, Czechoslovakia, Bulgaria, Rumania, and Hungary traded little among themselves or with the U. S. S. R. Their foreign trade was largely with Western Europe, the source of 60 to 70 percent of their imports and the destination for an equally high proportion of their exports. As a proportion of the total trade of Western Europe, Eastern Europe did not bulk large, only some 7 or 8 percent. The total, however, conceals an important contribution to the food and feed supply of Western European nations. The Danubian basin was the gran
5
Digitized for FRASER http://fraser.stlouisfed.org/ Federal Reserve Bank of St. Louis

ary of Europe. Of the 12 million metric tons of bread grains imported to Western Europe (including prewar Germany) annually in the period 1934-38, Danubian countries together with the U. S. S. R. supplied one- quarter. The Danube was also an important source of corn while Poland, Czechoslovakia, and the U. S. S. R. produced the only significant exportable surpluses of beet sugar in the world. Poland also contributed somewhat to the bacon, butter, and egg imports of the United Kingdom. The combined share of Western Europe's prewar food imports shipped from the territory at present controlled by Eastern European countries and the unsatisfactory postwar recovery, are indicated in Table 2.
Agricultural disorganization and difficulties of land transport in the early postwar periods cut back Eastern European surpluses at the very time when food deficiencies in Western Europe were most severe. Measures for land reform in the East, which involved subdivision of commercial estates and consequently a decline in the marketable portion of crops, helped to perpetuate the unsettled agricultural situation, while further disturbance followed when Communist policy switched to aggressive introduction of collective farms. There is every reason to believe that the satellite countries, as late as 1950, had failed to raise crop production to prewar levels in the lands under their control. Export restrictions against shipment of strategic materials to Communist countries, enforced by the West since the Korean war broke out, are frequently held responsible for the poor recovery of East- West trade in Europe. By 1949, however, when the volume of all exports from West to East had recovered to a level only one-third below prewar, the flow in the reverse direction was still down fully two-thirds. Exports from the East have presumably been limited by a combination of low production, greater internal utilization, deliberate reorientation of trade away from the West, and hard bargaining by regions producing primary commodities (coal and timber as well as crops) in a period of world-wide
Table 2Western Europe's Net Import of Food Products
from Eastern Europe1Contribution to
t------------------- Volume------------------- ̂ (--------total net imports--------(thousand metric tons) (percent) 2
Commodity Prewar* 1947 1949 19514 Prewar* 1947 1949 1951«Grain, total5 ____ 5,600 220 2,140 1,675 22 1 10 8
Wheat and rye. 3,200 110 1,100 470 26 1 8 3Other ................. 2,400 110 1,040 1,205 20 2 12 17
Sugar ...................... 775 100 155 190 26 4 6 9Dry legumes . . . 165 8 15 — ,T 36 2 6 — TM e a t « ...................... 200 — T 40 60 12 — * 3 6E g g s ........................ 20 2 16 16 13 1 11 16
1 Eastern Europe defined as territory^ included within the present frontiers of U .S .S .R ., Poland, Czechoslovakia, Hungary, Rumania, Bulgaria, Albania, Soviet Zone of Germany, Yugoslavia (which is no longer a member of the Soviet bloc) and Finland (whose role as supplier is negligible).
2 Net imports from East Europe calendar years 1947-1951 compared with net imports from all countries in fiscal 1947-48 to 1951-52.
8 Prewar refers to 4 or 5 year average within period 1933-39.4 Preliminary estimate. Only for wheat and rye would 1952 figures show
substantial improvement over 1951; even their levels remain below 1949."Excluding rice.6 Carcass weight, including meat from imported live animals.7 Western Europe a net exporter.
Source: United States Department of Agriculture, “ Europe’s East-W est Trade in Food, 1950 and 1951” (by Lois Bacon), Foreign Agriculture, December 1952.
shortages. The decline in the terms of trade of Western Europe is obvious.
More important, however, than the actual level of trade was the new political environment in which exchange took place. Communist countries typically organize foreign trade around state trading monopolies, bilateral agreements, and nonmarket considerations. The bargaining power of the Soviet bloc was heightened by the tendency of the U. S. S. R. to negotiate sales of some wheat, corn, and sugar that in fact originated in satellite countries. Bilateral trading arrangements implied repeated political negotiations, interruptions of trade while new agreements were in the process of being drafted, with jerky variations in the volume of trade and arbitrary shifts in direction. Moreover, the decision to import or to export bore no direct relation to internal consumption requirements or to current production. Goods might be imported for the deliberate purpose of developing productive capacity abroad which, dependent on an outlet in Soviet markets, would become a vulnerable economic sector in the exporting countries. Exports, on the other hand, might be pushed for their immediate propaganda effect or for the longer-term advantages to be gained by Soviet influence over the importing economy. If livestock production expands and if urbanization proceeds in the Eastern Europe countries, or if Soviet policy puts greater emphasis on consumer goods than heretofore, the prospects for sustained outflow of the export staples in the prewar volume are extremely slim. But supplies can be expected to be available for export, almost regardless of the internal situation, in return for essential raw materials from Brazil or Pakistan, or in exchange for capital goods from Western Europe, or wherever shipment promises sufficient political gain. This is not the sort of trading environment that may be expected to nurture private importing and exporting in the West, nor does it add any predictable elements in international commodity markets.
New territorial arrangements: Japan and China
Interesting parallels to the postwar situation in Europe are to be found in the Far East. The Japanese empire by 1939 had attained a position of ostensible self-sufficiency in food. Self-sufficiency rested, however, on importing from colonial and dominated areas almost 20 percent of the caloric content of the diet on the home islands. About 2 million tons of rice had to be shipped, almost two-thirds from Korea and the remainder from Formosa. Including the 10 million or so tons produced at home, rice provided about one half the calories in the Japanese diet. Formosa also supplied in 1936-39 well over a million tons of sugar, about 95 percent of the national total. About one half the requirements of soybeans, the major vegetable protein, were imported from Manchuria.
Offshore sources of supply became increasingly precarious as the naval war progressed and, in an agricultural economy so little oriented to livestock products as Japan’s, there was little latitude for diverting feedstuff to human food use. For a variety of reasons, including
6
Digitized for FRASER http://fraser.stlouisfed.org/ Federal Reserve Bank of St. Louis
higher consumption by the growers, exportable surpluses of rice from Korea and Formosa had begun to fall off even before Pearl Harbor. Deficiencies as late as 1941-42 were more than compensated by increased supplies from Southeast Asia. By 1944-45 however, both rice and sugar imports had been literally decimated. Only the Manchurian sources of food supply, especially soybeans but also coarse grains, held up during the war and even increased moderately. In 1938 Manchuria was supplying about one-quarter of Japan’s food imports, but by 1945 the proportion had reached three-quarters.
The peace settlement, which restored Formosa and Manchuria to China and provided for an independent Korea, stripped Japan of its sources of offshore supplies. The change in territorial sovereignty alone meant that Japan would have to depend heavily upon foreign sources if anything approaching the prewar level of food consumption was to be attained. Moreover, the set of events since 1945 which saw the Chinese mainland gradually absorbed by Communist forces accentuated the problem. Exportable surpluses from Formosa continued to decline, and almost disappeared after the influx of Nationalist personnel from the mainland.
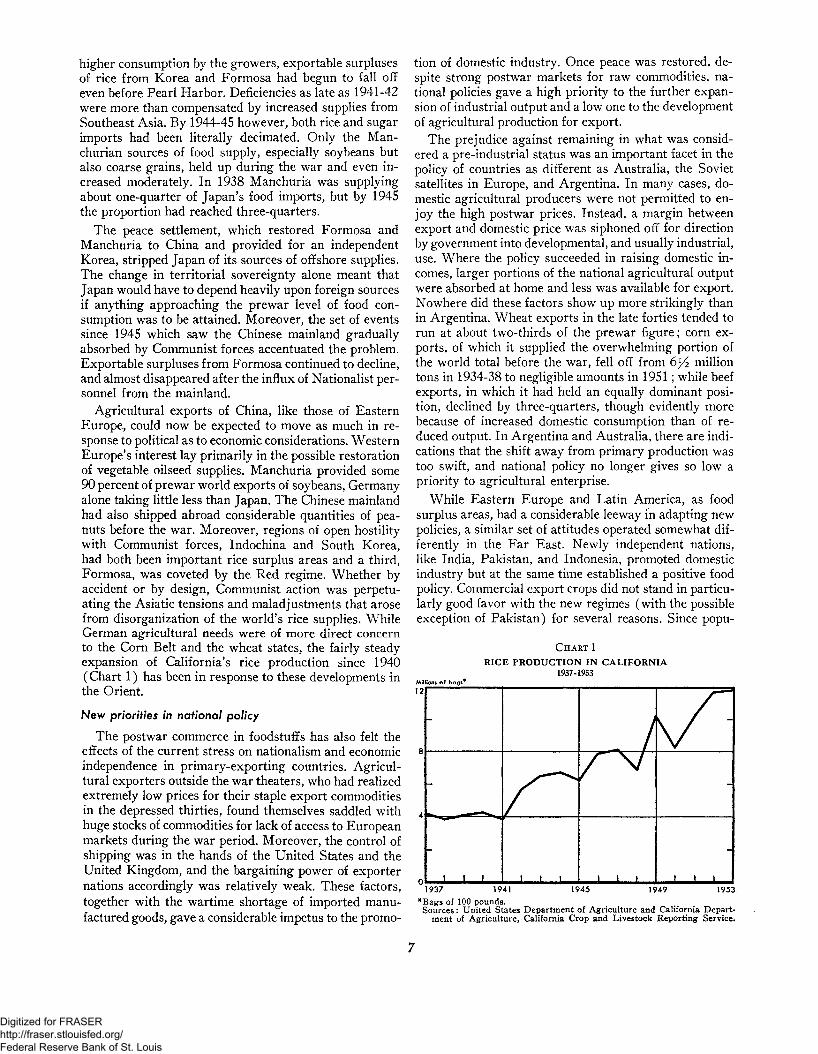
Agricultural exports of China, like those of Eastern Europe, could now be expected to move as much in response to political as to economic considerations. Western Europe’s interest lay primarily in the possible restoration of vegetable oilseed supplies. Manchuria provided some 90 percent of prewar world exports of soybeans, Germany alone taking little less than Japan. The Chinese mainland had also shipped abroad considerable quantities of peanuts before the war. Moreover, regions of open hostility with Communist forces, Indochina and South Korea, had both been important rice surplus areas and a third, Formosa, was coveted by the Red regime. Whether by accident or by design, Communist action was perpetuating the Asiatic tensions and maladjustments that arose from disorganization of the world’s rice supplies. While German agricultural needs were of more direct concern to the Corn Belt and the wheat states, the fairly steady expansion of California’s rice production since 1940 (Chart 1) has been in response to these developments in the Orient.
New priorities in national policy
The postwar commerce in foodstuffs has also felt the effects of the current stress on nationalism and economic independence in primary-exporting countries. Agricultural exporters outside the war theaters, who had realized extremely low prices for their staple export commodities in the depressed thirties, found themselves saddled with huge stocks of commodities for lack of access to European markets during the war period. Moreover, the control of shipping was in the hands of the United States and the United Kingdom, and the bargaining power of exporter nations accordingly was relatively weak. These factors, together with the wartime shortage of imported manufactured goods, gave a considerable impetus to the promo
tion of domestic industry. Once peace was restored, despite strong postwar markets for raw commodities, national policies gave a high priority to the further expansion of industrial output and a low one to the development of agricultural production for export.
The prejudice against remaining in what was considered a pre-industrial status was an important facet in the policy of countries as different as Australia, the Soviet satellites in Europe, and Argentina. In many cases, domestic agricultural producers were not permitted to enjoy the high postwar prices. Instead, a margin between export and domestic price was siphoned off for direction by government into developmental, and usually industrial, use. Where the policy succeeded in raising domestic incomes, larger portions of the national agricultural output were absorbed at home and less was available for export. Nowhere did these factors show up more strikingly than in Argentina. Wheat exports in the late forties tended to run at about two-thirds of the prewar figure; corn exports, of which it supplied the overwhelming portion of the world total before the war, fell off from million tons in 1934-38 to negligible amounts in 1951; while beef exports, in which it had held an equally dominant position, declined by three-quarters, though evidently more because of increased domestic consumption than of reduced output. In Argentina and Australia, there are indications that the shift away from primary production was too swift, and national policy no longer gives so low a priority to agricultural enterprise.
While Eastern Europe and Latin America, as food surplus areas, had a considerable leeway in adapting new policies, a similar set of attitudes operated somewhat differently in the Far East. Newly independent nations, like India, Pakistan, and Indonesia, promoted domestic industry but at the same time established a positive food policy. Commercial export crops did not stand in particularly good favor with the new regimes (with the possible exception of Pakistan) for several reasons. Since popu-
C h a r t 1
R IC E P R O D U C T IO N IN C A L IF O R N IA1937-1953
M illions o f b a g * *
ment of Agriculture, California Crop and Livestock Reporting Service.
7
Digitized for FRASER http://fraser.stlouisfed.org/ Federal Reserve Bank of St. Louis

lation and food supply are closely (some would say precariously) in balance, export crops appeared to compete for arable land that could little be spared from domestic food production. In the popular mind, exports were commonly associated with colonial status, and with alleged domination by foreign “capitalistic” enterprise. What might be accomplished with the foreign exchange that export crops could earn was not seriously weighed against the more obvious competing claim for land or the association with the politically dependent status so recently left behind. The export of vegetable oilseeds from India was choked off. In Indonesia the prospects for recovery of lowland plantation agriculture remained bleak. Moreover, there was a new emphasis on price stabilization in the interest of the domestic consumer, even at the risk of discouraging domestic production.
Prewar versus postwar volume of trade
There has been, in short, a succession of jolts to trading relationships since 1939. As a result, surpluses from prewar exporters and the import requirements of deficit areas were substantially changed in the early postwar years. At a time when production was low in every traditionally importing country, recorded supplies moving in interna-
INDIVIDUAL COMMODITY"\\o California crops have been fully insulated against 1 1 the commodity impact of the war, while for some the adjustments both at home and abroad have been particularly interesting. So far as volume of international trade is concerned, the early postwar deficiencies were most striking for fats and oils, feed grains, rice, and sugar (Table 3 )— all commodities linked directly to the state’s agriculture.
If attention is focused on major contrasts between prewar and postwar trade patterns, on how particular commodity deficiencies were overcome, and on the policy issues that have emerged, then vegetable oils and oilseeds, sugar, fibers, fruits and nuts, and rice present a wide variety of patterns. The detailed discussion that follows stresses external factors, which are likely to be less familiar than are the production adjustments that actually took place within the state. Space devoted to individual commodities is by no means proportional to their contribution to California farm income; in particular, only limitations of research time can excuse the extreme brevity with which orchard crops and rice1 have been treated. Nevertheless, as a background against which future developments may better be interpreted, these studies of typical commodity problems should prove highly suggestive.
Vegetable Oils and Oilseeds
Vegetable oils and oilseeds comprise a group of closely related commodities grown under widely different con-1 See also discussions on pp. 5-7.
tional trade (Table 3) fell far short of 1934-38 levels, themselves depressed by a decade of agriculture protectionism and economic nationalism. Although sugar had more than recovered the prewar figures by 1948, total trade in a number of staples remained depressed as late as1951. Even the 1951 level had artificial supports— the universal post-Korean rush for reserve stocks of food and raw materials, high export prices, and the dollars transferred into foreign hands by heavy American imports.
To the exports actually available, a flexible and productive American agriculture made an exceptionally high contribution. Indeed, one of the peculiar features of the postwar period has been the capacity of this leading industrial nation to generate exportable surpluses of agricultural products at a time when, despite the enormous world need, less industrialized countries held this type of export in relatively low repute. If corn moved less readily out of Argentina or rice out of Southeast Asia, barley or grain sorghums could be shipped from California and other American sources as feed to Europe or as human food (along with rice) to the Orient. Though the production achievement was impressive, a part of the overseas requirements were of necessity temporary, and a residue of commodity problems remain to be solved.
PROBLEMS AND POLICIESditions of production. Those important in world supply or trade include annual field crops of the temperate zone (linseed, soybeans, sunflower seed, rapeseed), tropical tree crops (copra from the coconut palm, palm oil and palm kernel oil from the oil palm), a tropical and semi- tropical annual of subterranean habits (peanuts), and one mere by-product of plantings for fiber (cottonseed). The United States also produces significant amounts of oil from corn, a minor outlet for this crop, the supply of which is therefore primarily related to the feed situation in the Corn Belt.
The ability to substitute various oils for each other promotes a high degree of inter-commodity competition and considerable diversity in national consumption patterns. Most vegetable oils are used for edible purposes (especially margarine and vegetable shortening), for soap, or for protective coatings. In the United States, soybean and cottonseed oil pre-empt most edible uses, while coconut and oil palm products are relegated to soap and minor industrial outlets, and only a small portion of the peanut crop is crushed for oil. But in the United Kingdom, coconut oil, palm kernel oil, peanut oil, and palm oil are the major components in margarine, while sunflower seed has recently led other vegetable oils in “compound cooking fat” (shortening). Vegetable fats claim a decreasing share of the soap market in the United States, but have been relatively more important in Europe. Linseed oil, a standard source of drying oils for paints, varnishes, and linoleum, is not strictly an “industrial” oil since it has substantial edible uses in Eastern Europe. Even where
8
Digitized for FRASER http://fraser.stlouisfed.org/ Federal Reserve Bank of St. Louis

particular oilseeds have inherent characteristics that give them a technical superiority in particular uses, research and technological change operate to level out the special advantage. Soybean oil, for example, offers increasing competition to linseed in protective coatings and can even serve in place of palm oil for dipping hot tinplate. In the Orient, by contrast, most soybeans find their way into direct human consumption as a vegetable, high in fat and protein content.
Relationships among the oilseeds and supplies available on world markets are influenced also by economic organization in producing regions. If the commercial extraction rate of oil is low, as is true of cottonseed, only a small portion of the crop may be crushed in more primitive economic systems and the major part directed to low- value uses such as fuel, fertilizer, or feed. Soap and edible fat production, however, are activities which customarily expand at an early stage in the industrial progress of a nation. New seed-crushing facilities may have the simultaneous effect of increasing the portion of the crop which enters commercial channels but reducing the exportable surplus of oilseeds or oil, as domestic outlets expand. By contrast, low oil yield means a high proportion of residualoil cake, important as a protein feed for livestock. The market for oil cake provided by the livestock economy of Western Europe has over the years promoted a local crushing industry based on imported oilseeds, and soybeans have been particularly popular because of the oilcake’s feed value. As seed processing has increased in producing regions, continental Europe has found itself saddled with excess crushing capacity. Developments in exporting regions have had particularly far-reaching effects, since the United Kingdom relied on imports for over 90 percent, and all of Western Europe (including Germany) for about three-quarters, of their prewar sup
ply of vegetable fats. Even the United States imported 10 to 20 percent of its total fat needs before the war, practically all of vegetable origin.
The present international position of the oilseeds is further complicated by developments affecting a wider network of commodities with which the oilseeds have particularly close links. Vegetable shortening competes directly with lard, margarine with butter. Inedible greases and tallow, production of which varies with the volume of animal slaughter, can take the place of vegetable oils in soap. Since supplies of animal fats reflect the availability of feed, lack of imported feedstuffs contributed to the postwar scarcity of fats and oils in Europe. More recently, European dairy herds have been shifted more toward the fluid milk market and away from creamery butter. Marine products also play a role in edible fat supplies abroad, as well as in the production of soap and drying oils. Finally, the postwar period has been one of spectacular competition from synthetic products, especially in the United States. Synthetic detergents, based chiefly on coal tar and petroleum derivatives, have forced a decline in United States soap production, while alkyd resins and latex compounds threaten to displace much vegetable oil in the manufacture of paints and varnishes.
Prewar versus postwar trade patterns
For no other major commodity group is the contrast between prewar and postwar patterns of international trade so sharp as for the vegetable oilseeds. As late as1952, soybean trade stood at about 75 percent, peanuts and cottonseed at less than 60 percent, and linseed at not more than one-third of the 1935-39 level, despite a somewhat better recovery in 1951. In each of these cases the postwar position of the nation that had dominated prewar exports was considerably complicated. There had been no
-Cereals
Table 3World Export of Selected Agricultural Products
-----------------------------N f-------------------------------------- Vegetable Oilseeds, Oil Nuts, and O ils-Wheat Sorghums
and and Palm Palm Cotton - OliveCalendar flour Rice Maize Barley millets Total1 Copra Peanuts Soybeans oil kernels seed Linseed oil Total2year (million metric tons) (thousand metric tons, oil equivalent)1934-38 average.. . 17.3 9.6 10.2 2.7 0.6 42.3 1,210 970 470 460 370 210 770 180 4,9301946 ....................... 20.2 2.3 3.2 1.7 0.3 29.5 670 390 60 230 240 45 290 22 2,1201947 ............. 24.1 2.8 6.2 2.0 1.0 37.6 1,100 400 80 290 270 60 320 30 2,7801948 , , , . ............. 26.0 3.8 4.9 2.8 0.9 41.0 1,030 530 80 380 350 80 240 85 3,0201949 ......... 4.1 5.8 3.1 1.3 43.1 1,100 580 310 500 380 120 300 55 3,5801950 ........................ 21.2 4.2 4.6 3.0 1.4 36.3 1,220 590 290 500 420 160 480 170 4,2101951 ........................ 29.2 5.2 4.5 4.0 2.5 47.8 1,510 520 460 480 370 120 520 80 4,420
.Fibers ■\ t-------------Miscellaneous--------------v
Oranges Dry Oilseedand Cotton, Wool, edible cakes and
Calendar tangerines Grapefruit Lemons Bananas Apples Grapes Raisins lint clean Jute Sugar5 beans mealyear (thousand metric tons—fresh fruit basis) (thousand metric tons) (thousand metric tons)1934-38 average 1,820 110 280 2,500 690 220 1,320 3,070 660 820 9,800 560 3,8001946 ......... ___ 960 130 80 1,640 340 100 760 2,290 680 360 6,600 350 1,0301947 ......... 150 120 2,000 340 110 760 1,990 750 310 8,800 440 1,5001948 ......... 140 180 2,200 420 130 1,200 2,010 800 5903 10,800 410 1,7001949 ......... . , . . 1,440 130 220 2,200 600 180 1,160 2,520 760 4003 10,450 380 1,9001950 ......... . , 1,600 110 220 2,150 490 210 1,280 2,9604 820 83 03 11,600 410 2,10019$1 ......... 120 230 2,250 750 210 880 2,6804 590 650» 11,650 39Q 2,100
2Total vegetable oilseeds and oils includes lesser amounts of rapeseed, sesame seed, sunflower 4United States exports of 1950-51 crop cotton were restricted by export controls.
1 Total cereals includes lesser amounts of rye and oats, seed, and castor beans. 3Excluding Pakistan’s exports to India.BExcluding United States trade with Hawaii and Puerto Rico.N o te : Estimates of total world trade are not entirely reliable. Shipments financed by foreign aid, exchanges under barter agreements, supplies absorbed
or made available locally by military forces, may not be properly reported or correctly estimated. Figures for Communist countries are rarely directly reported to the F. A . O ., and data on trade within the Soviet bloc is particularly sparse. Nevertheless, for listed commodities, Table 3 may be considered to reflect the postwar volume of exports available to non-Communist countries reasonably well. Data for 1952 are not yet available.
Source: Food and Agriculture Organization of the United Nations, Yearbook of Food and Agricultural Statistics, Part 2, Trade (various years).
Digitized for FRASER http://fraser.stlouisfed.org/ Federal Reserve Bank of St. Louis

important prewar supplies of exportable soybeans outside Manchuria, now subject to Communist disposition. Nor were there significant exports of linseed available from countries other than Argentina, where the crop is now produced at much lower rates as a result of unattractive prices to growers and subject, as well, to irregular shipment by virtue of the export monopoly exercised by a governmental trading agency. Peanuts from India and cottonseed from Egypt had dropped off to a trickle due to expansion of domestic consumption. Only the tropical palm products, among the major oilseeds, were being traded in the prewar volume. At that, palm oil from Indonesia still suffered from wartime damage to plantations while Philippine copra, the commodity in greatest abundance, required payment in dollars.
Some deficit regions were nonetheless better served with national supplies than before the war. Expanded cotton acreage in Mexico meant large quantities of seed for domestic crushing. Canada substantially increased production of soybeans and linseed, and Europe of rape- seed. The United Kingdom, the largest market in Western Europe, by 1950 could raise supplies almost 50 percent above prewar as a result of long-term arrangements with colonial producers of peanuts, palm oil, and palm kernels in West Africa, and of copra in the South Pacific. Belgium also benefited from the maturing of oil palm plantations in the Congo, and France from peanuts marketed by its West African possessions. Deficiencies in defeated nations, especially Germany and Japan, were not so quickly counteracted.
Of particular significance is the shift in the international commodity position of the United States. During 1935-39, the United States produced about 15 percent of the world’s fats and oils supply; by 1952, with output here almost doubled and output abroad not quite back to the prewar figure, the United States share had risen to one- quarter. Domestic soybean production was raised until it matched the formerly pre-eminent Chinese. In flaxseed, the United States climbed from a poor fourth to leading world producer. California alone, which had never planted as much as 50,000 acres of flaxseed commercially before 1939, planted more than 300,000 acres in 1943, when Lend-Lease shipments to the Soviet Union for food use were heavy, and production again responded to the heavy requirements of the early postwar years (Chart 2). United States peanut output was raised 50 percent, while at least one-third of the world’s cottonseed was already being produced in the United States before the war and at least an equal proportion since. Moreover, as the counterpart of high domestic consumption of meat, production of both lard and inedible tallows and greases about doubled. A net yearly import, equivalent to over 1 billion pounds of fats and oils during 1935-39, was converted into a net export surplus of over 1 billion pounds in 1951 and 1952. Instead of absorbing some 25 percent of world exports, the United States had become the source of one-sixth of the supplies available to importing countries. Incidentally, the shift meant less competition by the United States for
the limited shipments from exporters abroad and a larger residual available to Western European countries.
The customary prewar pattern had been United States export of food fats, mostly lard, which was more than outweighed by import of vegetable seeds and oils— especially copra, linseed, and products of the oil palm— for nonfood purposes. In the late thirties, such “edible” seeds or oils as cottonseed and peanuts were also imported, but that was an exceptional trade resulting from domestic drought, among other factors. The net import of nonfood fats was not reversed until 1952, though over-all the United States had become a net exporter in 1949.
Repercussions of the change in America’s net trade have disturbed the relative position of individual oils and oilseeds. In flaxseed, the United States has switched from foremost importer to substantial exporter. Shipments abroad since the end of the war, however, have never regained the levels reached in 1943 and 1944. In the early postwar years the United States even reverted temporarily to a net import status. Copra (and coconut oil) has been the dominant import since 1946, but the postwar peak came in 1947. The ensuing decline is ominous for this commodity, since its main American market is in soap. As a result, not only does copra suffer from competition with synthetic detergents, but also from domestic inedible greases and tallows, by-products of the high current slaughter, which increasingly displace imported vegetable oils within the soap industry. Oil palm products, which outranked linseed imports before the war, have lost ground in soap even more rapidly, and imports — mainly for special industrial purposes— are a small fraction of prewar.
On the export side, the spectacular developments concern inedible fats and soybeans. Since 1948, United States export of inedible tallows and greases have risen steadily and foreign markets now absorb about one-third of domestic output. These export shipments compensate for a sagging soap market at home and permit tropical palm
Chart 2FLAXSEED PRODUCTION IN CALIFORNIA
1937-1953MitKoro of bvsh«U
ment of Agriculture, California Crop and Livestock Reporting Service.
1 0
Digitized for FRASER http://fraser.stlouisfed.org/ Federal Reserve Bank of St. Louis

products to be directed from soap to edible uses in Europe. Of edible fats, lard shipments have approached the high levels of the late 1920’s. The United States for many years has been responsible for 70 to 90 percent of world lard exports, but it also has assumed an entirely new role as leading export source of soybeans and cottonseed.
Policy issues to be solved
Though so decisive a victory over the wartime and postwar fats shortage represents a notable production achievement, difficult policy issues remain to be solved. Levels of Governmental price support that formerly promoted the desired expansion of output now complicate domestic commodity relationships as well as foreign economic policy. Stocks of edible fats and oils in the United States have been running at record levels, with little likelihood of decline in 1953-54. Cottonseed oil acquired by the Commodity Credit Corporation under Government programs has in recent months comprised as much as 75 percent of the stocks of edible vegetable oils, and the Commodity Credit Corporation is similarly in possession of close to a full year’s requirements of linseed oil. At home, the price structure among various fats that emerged from Government programs has tended to favor margarine at the expense of butter, and soybean oil at the expense of cottonseed. Moreover, the domestic price premium of cottonseed oil over soybeans is not paralleled in the European market, where soybeans are preferred for crushing and peanut oil preferred to both as an edible vegetable oil. Inedible tallow and greases, prices of which have reacted to abundant supplies by declining below prewar levels, move relatively freely into foreign trade. By diverting palm oil products from soap to margarine and shortening, exports of inedible fats have the incidental effect of reducing export outlets for edible American oilseeds.
Foreign aid programs for some time masked the full significance of these factors. Fully 60 percent of the value of oils, fats, and oilseeds exported in fiscal 1949 and 1950 were directly financed by Government funds. This aid to exports has been accompanied by increased restrictions against import of oilseeds into the United States in recent years. As early as 1934, Philippine coconut palm products were being handicapped by a 3 cent processing tax levied against coconut oil. Copra accordingly offers no competition to domestic oils in edible uses. Flaxseed was able to overcome the prewar tariff of 65 cents per bushel, and indeed contributed to customs revenues. Import licenses for this commodity introduced on May 22, 1942 were at first more permissive than restrictive, but since 1948 a succession of measures has practically excluded foreign supplies. Most recently, under Presidential proclamation of June 8, 1953, an import fee of 50 percent ad valorem has been operative for flaxseed and linseed oil in place of the former prohibition under Section 104 of the Defense Production Act. The present action was taken under the authority of Section 22 of the Agricultural Adjustment Act, which provides for restrictions against imports which jeopardize a Government commodity-support program. The increase in CCC stocks of linseed oil has oc
curred despite the diversion of more than half its holdings to defense stockpiling in June 1951, at a book loss of $35 million. The recent tendency has been for world market prices to fall below United States support levels for vegetable oils and oilseeds generally, while funds available for foreign economic aid remain short. American exports become more difficult as supplies from other sources pre-empt foreign markets and threaten to enter the United States. Under such circumstances, the immediate pressure to raise United States trade barriers becomes greater still.
SugarLike the oilseeds, sugar overcame severe wartime and
postwar shortages, and now North America is saddled with productive capacity that had been geared to exceptional requirements abroad. But the policy issues raised by this commodity are rather different. Most of the expansion occurred in Cuba, which depends heavily on export of cane sugar for its economic life. For the United States, there is no prospect of a net exportable surplus or even national self-sufficiency, though any tightening or loosening of United States import restrictions has wide ramifications abroad.
While oilseeds are characterized by inter-commodity substitution and competition, most sugar is used in combination with other food ingredients. In the household or (increasingly) in food-processing industries, sugar supplements fats and cereals in bread and bakery items, fruits and vegetables in canning, milk in such dairy products as ice cream, and chocolate and nuts in confectionery. Corn sugar (or syrup) is an alternative sweetener in some processed foods, but the more important element of intercommodity competition is between tropical cane sugar and the beet sugar of North America and Europe.
Sugar is peculiarly vulnerable to the dislocations of war. Of total world output, about one-third— almost entirely cane— must move overseas before reaching the place of final consumption. The changing naval fortunes of World War II brought sudden shifts in the flow of traffic to consuming areas at the same time that military defeats, build-ups, and victories sharply altered the claims against available supplies. The shadow of approaching war before 1939, and the German invasion of Poland, created a demand for stockpiles and increased imports into the major deficit areas, the United States and Europe. With the fall of France in the spring of 1940, continental Europe and its beet sugar economy became a closed German preserve. For a time, especially with rationing in effect in the United Kingdom, exportable cane sugar went begging for markets.
In 1941 the situation outside the Axis countries steadily tightened. Shortage of shipping forced, and the Lend- Lease Act permitted, the United Kingdom to shift away from sources as distant as Australia and Mauritius and to depend more heavily on the British West Indies and dollar sources (Cuba, the Dominican Republic) in the Caribbean. After the Nazi invasion of the U. S. S. R., the important beet sugar supplies of the Ukraine were lost to
11
Digitized for FRASER http://fraser.stlouisfed.org/ Federal Reserve Bank of St. Louis

the Soviet Union, and this deficit too had to be filled from Western Hemisphere supplies. Finally, the Japanese gained control of the sugar surpluses of the Dutch East Indies and the Philippine Islands. Amply supplied from imperial sources (especially Formosa), Japan quickly cut cane output in the conquered islands to negligible amounts. For almost three years the world sugar economy was compartmentalized into three separate units: the Japanese, where potential supplies of cane sugar far exceeded requirements; the German, where beet production was adequate; and the Allied, where a restricted supply area had to serve the needs of an expanded consuming territory.
Under wartime conditions, when the resources of an economy are pushed to the limit, the relationship of sugar to other commodities becomes far more complex than that of joint food ingredient. Sugar cane mills turn out molasses as an automatic by-product in manufacturing raw sugar, but are capable of processing cane into a high- test molasses from which no sucrose has been extracted. Cane molasses is chiefly used for animal feed and as a raw material for conversion into industrial alcohol. This same alcohol, which has a variety of end uses in the field of industrial chemicals, was an important input in the wartime manufacture of synthetic rubber. For that strategic purpose, alcohol from grain, from cane molasses, or from cane sugar— in Europe, also from potatoes or sugar beets— was a substitute for synthetic alcohol produced from petroleum. Availability of these alternative raw materials in the United States depended on such superficially unrelated factors as the amount of petroleum required to supply high-octane aviation gasoline to the military forces, the volume of grain stocks, the rate of sinkings of molasses-carrying ocean tankers by submarines, the size of the animal population, and the availability of vegetable oils (a factor in the desirability of heavier feeding for lard hogs). Sugar rations therefore depended not merely on size of current or prospective crops but on developments over a wide commodity front. At that, it was well into 1944 before lack of physical supplies rather than transportation bottlenecks became the critical problem for the Allies.
Allied military successes at first accentuated rather than eased the strain on Western Hemisphere supplies from the Caribbean. North Africa, a sugar-deficit area, was the first region to be liberated from Axis control. Victory in Western Europe was accompanied by a lost beet harvest in 1945 and disorganized production for several years thereafter. Similarly, in the Far East, the liberation of the Philippines added nothing to available supplies but instead created a temporary need for imports. Philippine production has recovered since, but sugar exports from Indonesia show little promise of being restored. Nor did the old volume of surpluses in Formosa survive the fall of Japan or (later) the influx of Chinese Nationalists. The beet sugar surpluses of East Germany, Czechoslovakia, and Poland quickly passed to Soviet control.
Practically all such declines from exporters together with postwar deficits in French, German, Italian, and other foreign supplies, have been counteracted by expansion in Cuba. Propelled by an international shortage of this major carbohydrate, Cuban production was built up by 1952 to nearly 8 million short tons. This was accomplished without heavy use of fertilizer, with little irrigation, and without any serious attempt to develop varieties especially suited to local conditions. Such a crop represented more than 20 percent of world commercial production, the full equivalent of United States consumption, and one-third more sugar than actually moved between foreign nations before the war. By contrast, variations in California’s sugar beet production were somewhat perverse (Chart 3). With labor short and more attractive prices for competing crops, and despite domestic sugar rationing, fewer beets were grown during 1943-45 than in any year during the preceding decade. By the time prewar levels had been recovered, the world sugar shortage was over.
In the process, Cuba has enjoyed a considerable postwar prosperity, but she has also placed her entire economy in serious jeopardy. Local consumption absorbs scarcely 5 percent of her crop, and other export products are of minor significance. During the late twenties, Cuba was in a position to market three-quarters of her sugar in the preferential American market. Even in the 1930’s, conditions on the island were tolerable when exports stood at 2 million tons to the United States and half that volume to other countries. Sales to the United States in recent years have been running closer to 3 million tons. But in those postwar years when Cuba’s shipments were highest, more than half had to find a market elsewhere,
T h e r o l e o f C u b a
Chart 3SU G A R B EET P R O D U C T IO N IN C A L IF O R N IA
1937-1953
Sources : United States Department of Agriculture and California Department of Agriculture, California Crop and Livestock Reporting Service.
1 2
Digitized for FRASER http://fraser.stlouisfed.org/ Federal Reserve Bank of St. Louis
though a good portion was financed through United States foreign-aid programs. Prices available for such “free-market” sugar have been falling steadily since 1951. For lack of markets, Cuba restricted production severely in 1953 and now limps along at two-thirds of present capacity and a far lower fraction of obvious potential.
The International Sugar Agreement
World War II has done little to temper policies of national protectionism that led up to the International Sugar Agreement of 1937 and which complicate sugar trade today. The United States market is regulated by the terms of the Sugar Act of 1948, as amended. Total United States requirements are established by the Secretary of Agriculture, in conformity with criteria that leave a considerable margin of discretion. This aggregate figure is broken into specific statutory quotas— roughly 1 million tons each from Hawaii, Puerto Rico, and the Philippines, and 2i^ million more from the mainland (beet and cane) — with most of the remainder left for Cuba. An import- quota system thereby becomes the main instrument for protecting the domestic producers and supporting the market price. Since the tariff is low, Cuba enjoys much of this price benefit on sales to the United States. Mainland and offshore domestic growers receive in addition a direct subsidy, financed by an excise tax on all sugar marketed in the Continental market. Cuba, the largest single source, carries the heavy risks of residual supplier. Periods of depressed commodity prices tend also to be times of slackened economic activity in the United States and consumption of sugar tends consequently to suffer (though less so than many other products). But a stable price makes sugar crops relatively attractive in such periods, so that beet sugar output becomes relatively high.1 Cuba’s marketings in this country accordingly are doubly reduced and the very times when “world” sugar prices are low and sales to destinations abroad difficult.
As supplier to the United Kingdom, Cuba’s situation is even more anomalous. Here again the island makes the largest single contribution. The United States, however, processes its raw Cuban imports for consumption at home, while the United Kingdom’s has been largely paralleled by an export trade in refined during the past five years. Of sugar actually consumed, domestic beet has provided almost one-third. Of the remainder, two-thirds comes from the Commonwealth, mainly British West Indies, Mauritius, British Guiana, and Australia. Moreover, a long-term arrangement with the United Kingdom provides for considerable expansion in exports from Commonwealth sources by the late 1950’s.
Such policies, superimposed on the large surplus capacity currently available in Cuba, provide the backdrop for the International Sugar Conference held in London during July and August, 1953. The interests of leading import nations in a new international sugar agreement are by no means obvious. The United States, the leading im-1 Statutory quotas under the Sugar Act and limits of processing capacity
impose a ceiling on this expansion.
porter, is only indirectly involved, since the domestic price depends primarily on the level of domestic quotas. At present the resulting price of raw sugar in New York is about double the average price at which the British Ministry of Food has contracted to purchase 1 million tons of Cuban sugar. While such a differential between the American and the “world” price could conceivably be maintained indefinitely, sugar producers in the United States recognize the danger that a quota premium judged excessive might bring Congressional correction. Besides, if Cuba ships sugar more vigorously into the United States during the key months of the marketing year for lack of other outlets, prices in New York can weaken though total imports are not increased.
To the United Kingdom, the second ranking importer, world market conditions are of more direct interest. She pays the world price, as the United States does not, on sugar imported from Cuba and the Dominican Republic. Large quantities of Cuban raws will have to be retained for consumption now that fourteen years of rationing have finally come to an end. Further complications follow from the terms of the Commonwealth Sugar Agreement. Of the exports in prospect from Commonwealth producers overseas, the United Kingdom guarantees to purchase roughly two-thirds at a preferential and presumably profitable price to be negotiated annually. Since much of the remainder can be expected to be sold to Canada at the world price plus the Canadian preference, a “satisfactory” world price is a specific objective of the Commonwealth Agreement. Moreover, Commonwealth producers may feel inclined to bargain less hard with the United Kingdom during annual negotiations if returns from exports to other destinations are more attractive.
Candidates for export quotas represent a diverse crew. Almost 1 million tons move from the Dominican Republic, Peru, and Haiti to unprotected markets. Any considerable quota for Indonesia, which was largest of all in 1937, may be considered more contingent than practical, in view of the painfully slow recovery of postwar plantation output. Formosa, which formerly shipped a million tons within the Japanese empire, must now compete against all comers. Brazil, Mexico, and France represent countries which, though normally self-sufficient, look to an export safety valve for occasional surpluses. Moreover, under the International Agreement of 1937, beet sugar from Poland, Czechoslovakia, and the U. S. S. R. had an aggregate quota of more than 600,000 tons. Surpluses of the two satellites and of Eastern Germany have been largely absorbed by the Soviet Union in the postwar period. Any efforts to improve the consumption level of the Russian people might be expected to keep this sugar flowing east. Whether these countries officially adhere to a new Agreement, or remain outside, international sugar markets now face the prospect of substantial, erratic fluctuations in Eastern European beet sugar supplies in response more to political considerations than to economic stimulus.
1 3
Digitized for FRASER http://fraser.stlouisfed.org/ Federal Reserve Bank of St. Louis

The position of Cuba, however, is unique. All other participants, importers or exporters, are at least as concerned in raising the world price as in the question of quota levels. Cuba similarly stands to increase export receipts, in the short run, if an Agreement brings a somewhat higher price at the expense of a lower export quota. But Cuba’s chief competitive advantage on sales outside the United States is the low price she can accept when mills grind at close to their capacity rates. Under present conditions world prices could be substantially raised only at the cost of still greater restriction of Cuban production. Cuba would then be in the position of making expansion in the Philippines, Indonesia, and Formosa more attractive. Moreover, the financial penalty against occasional exports from Brazil, Mexico, or Eastern Europe would be reduced; and the deterrent to sugar protectionism in the British Commonwealth, the United States, Western Europe, and South America weakened. Low prices are also important in compensating for Cuba’s chief handicap : its sugar must generally be purchased with dollar exchange.
Cotton and WoolThe major natural “apparel” fibers share certain eco
nomic characteristics in common. A substantial portion of both cotton and wool moves into international trade in raw form, and there is besides an important traffic in the various textile products into which they are fabricated. Both are featured by important differences in quality and grade. Indeed, a series of sub-commodities, ranging from the very long to the very short staple cottons, or from the merino to the coarser crossbred wools, respond to somewhat separate market factors and display price movements that are not necessarily parallel. Competition from synthetic fibers has become of increasing concern, for cotton by the thirties though for wool largely since the end of World War II. For wool and cotton alike, all major areas of commercial production were located outside the theater of actual military operations, and as a result there was no problem of wartime scarcity of raw product among the Western Allies. While world output of cotton fell sharply, this decline resulted from a shortage of shipping which cut cotton-producing nations off from accustomed markets and, in some cases, created shortages of imported foodstuffs. Both commodities came into the postwar period with large excess stocks on hand in major exporting countries, and disposal of these surpluses was not expected to be easy.
Yet from most economic standpoints, the contrasts between wool and cotton are more significant than these similarities. Cotton is produced in sub-tropical regions and, outside the Americas, is typically associated with an abundant labor supply and relatively severe competition with food crops for land. It is an annual crop, subject to large year-to-year changes in output though in recent years more because of governmental measures in producing countries than as a result of natural scourges. Wool, however, is produced in relatively unchanging year-to-year volume from flocks that have taken three
years or so to reach their full commercial yield. Mass production of this fiber therefore tends to be localized in the Southern Hemisphere, in regions where abundant land permits an extensive agricultural operation. Moreover, the two fibers differ markedly in their contribution to the international trading system. Cotton is primarily a dollar commodity, long a leading United States export, still responsible for close to 10 percent of the value of United States commodity exports, and a product in which the size of the United States crop is the dominant factor in world markets. Wool is a major export of the Sterling Area, a leading American import, and a commodity that reacts far more to fluctuations in American demand than in American supply. While United States cotton serves as residual supplier to the world market, foreign producers are residual suppliers of American wool requirements.
Long-term developments
The position of both commodities in the postwar period is due far less to the aftermath of war than to developments underway for many years. The main exception to that statement has been the 45 percent decline in the wool clip of the United States, formerly the second largest producer in the world. Even the exception, however, is consistent with long-term trends: wool production has generally tended to shift away from the centers of intensive agriculture and towards agricultural frontiers. Certainly the predominance of the major exporters— Australia, Argentina, New Zealand, South Africa, and Uruguay— has gradually been increasing during the past five decades, with a steady two-thirds of world production entering trade throughout these years.
In cotton, the most conspicuous long-term developments have been the growing challenge to United States export leadership and the decline in the exported portion of world output. Higher consumption of cotton textiles comes at the earliest stages in improved economic wellbeing for a people, and world-wide improvement in material conditions between 1909-13 and 1934-38 is reflected in steady increase in production of raw cotton from about 20 million bales (500 pounds gross weight) to 30 million. World exports, however, barely held their own, remaining close to 13 million. Over this period, the United States cotton crop showed no increase, higher domestic consumption and rising stocks offsetting an absolute decline in exports from 8.8 million bales to 5.3 million. As a result, American output and exports alike declined in relative terms from two-thirds to two-fifths of the respective world figure, and the share of the United States crop that found its way into export fell by the identical proportion. Of the raw cotton consumed in mills outside the United States, the American crop supplied 60 percent at the earlier dates but only 25 percent at the later.
The set of factors responsible for the long-term trends in cotton trade do not readily lend themselves to brief summary, but a few were of primary importance. Reflecting its early industrial leadership, the United Kingdom dominated world textile trade until well into the 20th century. All the raw fiber had to be supplied from abroad,
1 4
Digitized for FRASER http://fraser.stlouisfed.org/ Federal Reserve Bank of St. Louis

and the United Kingdom alone was the market for half America’s cotton exports in 1909-13. During World War I, when the United Kingdom could not adequately supply its Far Eastern markets, Japanese production expanded to fill the gap. This new rival also based its exports on imported raw cotton. Indeed, differences in the British and the American attitudes to the international economic position of Japan are partly explained by the fact that in the 1930’s Japan had become the leading foreign market for American cotton but the proximate cause of chronic depression in the Lancashire textile industry.
Higher cotton exports to Japan never fully compensated for the reduced market in the United Kingdom because the former degree of international specialization was being undermined on several fronts. Cotton textiles lend themselves to local manufacture at an early stage in a nation’s industrial development. To an increasing extent, raw cotton tended to be absorbed at home by the new textile industries in exporting countries, most spectacularly India. Secondly, a new rayon industry had considerable appeal to countries bent on greater self-sufficiency to offset export difficulties or to reduce military vulnerability associated with heavy dependence on imported natural fibers. Production of rayon staple fiber, which competed more closely with raw cotton than did rayon filament yarn, was accordingly concentrated in the totalitarian economies of Germany, Japan, and Italy. More than a quarter of total fiber consumption in these countries was comprised of rayon in the late thirties, and the Axis nations produced about three-quarters of the world’s rayon, including almost 90 percent of world staple fiber manufacture. While rayon supplemented the natural fibers for certain purposes, the prewar rayon production represented a positive displacement of some 5 million bales of raw cotton. Thirdly, both the price-support programs of the United States Government and the cotton policies of metropolitan European importers promoted the expansion of non-dollar sources of supply at the expense of United States exports. Absolute exports from America’s closest rivals, India and Egypt, were somewhat higher in the late thirties than in 1909-13, while Brazil rose to the rank of a major supplier. There was also a growing contribution from a list of minor exporters in Latin America (Peru, Mexico, Argentina) and in Africa (Anglo-Egyp- tian Sudan, the Belgian Congo, and British East Africa). Finally, production in the U. S. S. R., which rose more than in any other country during the interwar period, served a domestic market exclusively and had little reflection in statistics of cotton trade.
The fibers and World War II
World War II cut sharply across the contemporary pattern of international trade in apparel fibers. Despite the new role of rayon, Japan was the leading importer of raw cotton before the war; France and Germany together imported as much as the United Kingdom, and Italy ranked next. For wool, the United Kingdom led, but the combined imports of France and Germany exceeded the United Kingdom figure, while Belgium im
ported slightly more and Japan only very slightly less than the United States. With so much of the export market located in Axis countries and on the European continent, wartime trade in cotton fell to minor proportions. Even the United Kingdom’s imports were cut sharply, since lack of shipping and concentration on munitions made export of textile products unfeasible. Wool shipments declined less in total volume but shifted abruptly in direction. The United States, which had taken less than 10 percent of the prewar trade, became the main wartime destination. High military requirements and the possibility of taking wool from Australia and New Zealand as return cargo on vessels that had shipped out military supplies to the South Pacific Theater tripled the rate of American imports, and they temporarily climbed still higher immediately after the war.
Under the circumstances there was little incentive to maintain fiber production. The world cotton crop fell one- third between 1940-41 and 1945-46, and recovered hardly at all the following year. Each major exporter registered a substantial decline. Local food shortages in Egypt and (especially after the loss of Burmese rice) in India brought the diversion of much cotton acreage to food crops. Even in the United States, policy promoted other commodities, including peanuts, rather than cotton. But with exports at the lowest levels since Civil War days, the United States textile bottleneck was in processing capacity and labor force rather than lack of raw material. Decline in world wool production was more moderate. Indeed the 1942 clip reached record heights and, despite lower American production and a severe wartime drought in Australia, the 1947 low was barely 6 percent under prewar. The pattern of California’s output of both cotton and wool is indicated in Charts 4 and 5. For rayon, expansion of American production at first kept pace with a gradual decline in Axis countries until economic disor-
Chart 4COTTON PRODUCTION IN CALIFORNIA
1936-1953ThomoiKh of bal*t*
ment of Agriculture, California Crop and Livestock Reporting Service.
1 5
Digitized for FRASER http://fraser.stlouisfed.org/ Federal Reserve Bank of St. Louis

ganization in defeated nations brought Japanese and German output to a halt in 1945. World production of staple fiber that year fell 45 percent below the prewar level.
Lower fiber output did not prevent a large carryover of stocks into the postwar period. By August 1, 1945, cotton stocks stood at 11.2 million bales in the United States and 17.5 million bales abroad, an aggregate figure more than double the annual world trade before the war. In 1938, when world stocks had been at their peacetime peak, the respective figures had only been 11.5 million and 11.2 million. Wool stocks on July 1, 1945 amounted to 5.36 billion pounds (greasy basis), close to double the world's annual clip during 1934-39.
Although wool trade quickly revived to its former volume and more, most of the prewar patterns continued to plague cotton. Despite heavy stocks available for shipment, in no postwar year has cotton trade exceeded the low level of the 1930’s. There has been a steady increase in the export from colonial and semi-colonial territories in Africa but, except when Brazil was unloading its wartime accumulations between 1945 and 1947, non-dollar supplies remained relatively scarce until 1953. Exports of raw cotton from the Indian sub-continent stayed fully 50 percent lower than before the war, while the pronounced expansion in Mexico represented Dollar Area supplies. Though United States exports managed to regain their prewar share of exports from 1948-49 through 1951-52, over 40 percent of the sales was directly financed under Government procurement authorizations. Moreover, per capita fiber consumption remained depressed in the Far East, while in the industrial Western nations any increases in per capita utilization tended to accrue to the synthetic substitutes.
Total trade in cotton textiles similarly failed to recover fully. India, however, completed a transition from the leading importer to the leading exporter, despite the complications in its supply of raw cotton as a result of partition. About one-third of the sub-continent's raw cotton was being produced in Pakistan territory, and trading
Chart 5S H O R N W O O L P R O D U C T IO N IN C A L IF O R N IA
1936-1953Millions of pounds
ment of Agriculture, California Crop and Livestock Reporting Service.
difficulties between the two young nations caused India to compete with Europe and Japan for supplies from Africa. Occasionally, as in 1949-50, raw cotton even moved in large volume to India from the United States. Since the recovery of textile production in Japan was inhibited until 1950 by policy of the occupational authorities and was not rapid in Europe, the United States as well as India enjoyed a considerable postwar export of textiles, an outlet for 5 to 10 percent of the domestic crop in recent years. By 1949, however, Japan was again the leading market for United States cotton and in 1951 it recovered its leadership in textile exports.
The postwar pattern of fiber prices
The postwar position of cotton and wool among the fibers and the issues opened up for public policy can best be illustrated by the postwar pattern of fiber prices. There have been striking developments in the relationships among domestic fiber prices, in the stability or instability of price movements, in the relations between export prices here and abroad, and in the structure of prices within various foreign countries.
In 1937, a prewar year of high business activity, the average monthly price per pound of basic grades of domestic fibers at wholesale ranked in the United States as follows: raw wool (scoured), $1.019; rayon (staple fiber), $0.270; raw cotton, $0.118. In 1948, which marked the peak of the first postwar inflation of commodity prices, the same grades were averaging $1.646, $0.360, and $0.338 respectively. There have even been months in the postwar period when rayon was cheaper than cotton, though it had formerly been several times more expensive. The substitution of rayon for cotton in apparel, or as a high-tenacity fiber in tire fabrics, has accordingly a strong price basis, and its relative advantage in foreign markets is greater still. In the United Kingdom, American cotton was more than 5 pence per pound cheaper than rayon staple fiber in 1937, but by 1948 it was 6 pence (about 30 percent) more costly.
Synthetic fibers generally have the additional advantage that price changes are infrequent and moderate, since the volume of production can readily be stepped up or down. Wool, by contrast, displays great regularity in size of annual clip, so that changes in demand tend to result in sharp price fluctuations. The time lag represented by the long ocean voyage operates in the same direction. These natural characteristics of wool prices were masked in several years after 1945. On July 31, 1945, United Kingdom-Dominion Wool Disposals Ltd. took over stocks accumulated under wartime programs, equivalent to a two-year clip in Australia, New Zealand, and South Africa. Although disposal had been expected to take a dozen years, by 1949 the great bulk had been put up for commercial sale on what proved to be a slowly rising market, strong enough to absorb Argentine and Uruguayan carryovers as well. Cotton prices, at least in the United States, tended to be even more stable between 1946 and early 1950. Stability reflected not disposal of stocks but
1 6
Digitized for FRASER http://fraser.stlouisfed.org/ Federal Reserve Bank of St. Louis

rather their accumulation, by virtue of the price-support operations of the Commodity Credit Corporation.
Once high postwar consumption was restricted to the size of the current clip, however, wool prices climbed up sharply and the Korean war accelerated the rise until record levels were reached early in 1951. Indeed, such exporter countries as Australia and New Zealand, to avoid inflating the domestic cost structure, found it desirable to insulate their producers against the full effect of a highly exaggerated demand upon a highly inelastic supply. This was done not by immediately appropriating a margin to the public treasury in the form of export taxes, but by devices that allowed accrual of illiquid assets to the account of private wool growers. The Argentine government, by contrast, tried to artificially prolong the peak export prices and considerable stocks were immobilized on a falling market during 1951-52. The United States, as an importer, was little insulated from either rise or fall. Heavy United States imports of raw wool from sterling sources at inflated prices incidentally highlighted the peculiar international position of the United Kingdom. During these months, dollar balances were accumulating rapidly in London from sales of sterling exports. But the United Kingdom, itself heavily reliant on imports of the same commodities, suffered a serious deterioration in its terms of trade as raw materials prices soared.
Domestic and international prices of cotton
For cotton prices, the Korean war resulted as much in a peculiar international structure as in a rise in the absolute level. Indeed, the relation between the export price of United States cotton and that from competing suppliers has gone through several stages since 1945. Early in the postwar period, with stocks heavy in all exporting countries and textile activity not yet recovered in Europe, non-dollar cottons pressed heavily on markets and their prices were relatively weak. Especially during the earlier months of the European Recovery Program, competitive cottons from soft currency areas began to command substantial price premiums. The margin began to fall late in1949, until a disappointing Brazilian crop and crop restrictions in Egypt tightened supplies by the spring of1950. Moreover, acreage allotments had been imposed on the 1950-51 American crop.
A resultant decline of 10 percent in world cotton production for 1950-51, like the exhaustion of war-accumulated stocks of wool, closely coincided with the outbreak of the Korean war. For an export commodity, relative stabilization of the United States price was feasible, though at the cost of exaggerating price fluctuations abroad. Export quotas were imposed to reserve more of the crop for domestic consumption and a ceiling was placed on price after it had risen some 50 percent. With American cotton temporarily out of the international market, high premiums were paid abroad for cotton from other sources, prices of which climbed to almost double the controlled United States level. By the spring of 1951,
when it became evident that new crop cotton would be in good supply, prices sagged below the ceiling in the United States. At first this movement was resisted in some exporting countries, notably Brazil and Egypt. During the commodity inflation, higher export taxes had been levied and the revenues of foreign governments became heavily involved in cotton prices. The attempt to support foreign prices made United States cotton extremely attractive, especially as it fell towards official support levels, and United States exports in 1951-52 were particularly satisfactory. More recently, world cotton production has come to exceed the prewar rate and some non-dollar cotton has fallen to a discount below the American export price.
Under conditions of easy supply, the determination of international cotton prices tends to become a highly arbitrary process. Within the United States, the main market factor becomes the price-support program of the Commodity Credit Corporation. At present support levels, there is every incentive to high domestic output and a further accumulation of stocks. While an export subsidy, an expanding margin between internal and external price, and heavy losses to the Treasury form one conceivable direction of policy, it is one that presents longer-run problems. The international price of cotton is strongly affected by the commercial policies of so important a supplier as the United States, and other exporting nations would match our price concessions. Though foreign aid programs and Export-Import Bank loans have provided an easier alternative during most of the postwar period, CCC storage operations come ultimately to require acreage restrictions or to invite rapidly falling export prices should stocks be forced heavily onto foreign markets.
Low world prices were the rule before the war, but cotton prices recently reflect a more sophisticated approach. Other exporting nations, while prepared to sell at a slight discount under the American price, are also prepared to restrict their crop or their export shipments. Stabilization operations of the Commodity Credit Corporation accordingly tend to hold up the world price level, not by active CCC purchases of foreign cotton but because American price leadership is followed abroad. Since, under such an arrangement, foreign cottons may nevertheless be expected to move more freely than American into export channels, the logical corollary of domestic policy is an international cotton agreement that divides up the world market among the various exporters. Intervention by the United States Government in the cotton market tends in this fashion to become self-perpetuating and global. In the process, raw cotton incidentally becomes priced to importing nations at levels that make synthetic fibers increasingly attractive. Nor are the effects limited to the fibers. Restrictions on cotton production in1954 will push more California acres into sugar beets and make acreage controls necessary for this crop as well. Higher beet sugar production means that less sugar will be absorbed from abroad, and the success of any international Sugar Agreement will be further jeopardized.
1 7
Digitized for FRASER http://fraser.stlouisfed.org/ Federal Reserve Bank of St. Louis

Fruit and fruit products throughout the 1930’s contributed more than 10 percent of the value of United States exports, a figure exceeded only by cotton and tobacco. But in various postwar years this group has been outranked by every major agricultural export in value terms, and its share by 1950 had declined to 4 percent. In physical volume of export, fruit declined while practically every other group rose. The portion of domestic fruit production moving into export is substantially lower than prewar, some 7 percent in 1948-52 as compared with 11.5 percent in 1934-38, but the aggregate masks the full extent of the decline in individual components and in export destinations. Some types and grades of product, developed specifically for the export trade or favored much more by consumers abroad than at home, have now lost their export market and plague domestic marketing of an entire crop. Of the fresh fruit, citrus exports are actually higher and deciduous crop exports correspondingly lower. The prewar fruit trade, moreover, hinged on sales to the United Kingdom, though less so for dried fruits than for other categories. Before the war this destination absorbed 85 to 95 percent of all canned fruits (except pineapple), but practically none today. Raisins were the only fruit licensed in any volume for import into the United Kingdom in recent years, and even that trade has been subject to wide year-to-year fluctuations in volume. In place of the United Kingdom, Canada has become the chief foreign market for American fruit, but only in fresh grapes and citrus has expansion there fully compensated for contraction elsewhere.
Among the deciduous fruits, pears well typify these trends. Between 15 and 25 percent of the pear crop went into export during the 1930’s, roughly half as fresh fruit. Practically all canned pears, and half those exported fresh, went to the United Kingdom, while dried pears went overwhelmingly to Europe. During 1935-39, the United States produced almost one-quarter of the world’s pear crop and provided more than one-third of world pear exports. While European consumption is now well above prewar, the increase has been largely based on Continental supplies. Some 70 percent of the world’s pears were produced in Europe even before the war, and commercial output there has been raised 50 percent as a result of new plantings in the thirties and improved orchard care. The Netherlands, formerly a small net importer, is now the world’s leading exporter, while importers depend increasingly on Italy and, among overseas countries, Argentina. The following figures (by crop year) indicate the extent of the decline in exports from the United States, by destination :
S h o r t e r C o m m o d i t y N o t e s
Pears, fresh........ 1934-38Total2,647
TotalEurope
2,008
UnitedKingdom
1,277Canada
364(thousand bus.) 1951 682 174 149
Pears, canned.... 1934-38 1,641 1,584 1,529 2(thousand cases 24/2 t f ) .......... .. 1951 102 10 10
Pears, dried........ 1934-38 3,489397
3,198 496 165(short tons) . . . 1951 260 . . . 38
With minor variations, the story is quite similar for apples, apricots, and peaches. Though the United Kingdom is attempting to develop Commonwealth sources of supply, its total fruit imports stand at half their prewar volume.
Trade in citrus fruit displays some of the same features as deciduous, but over-all prospects are brighter. For oranges, which represent close to 90 percent of world citrus trade, the United Kingdom has been replaced by France as the leading importing nation. United Kingdom takings of United States oranges have dropped to zero, while France is not a major American market. But larger United States exports to other European nations just about offset the decline in shipments to the United Kingdom, while Canada was the leading market for United States oranges before the war and has remained so. Even during the war, United States exports of fresh citrus fruits hardly declined at all, and its share of world trade is higher currently than in 1935-39. Besides, export of canned orange juice is now many times higher than prewar, and three-quarters of it is absorbed by the growing Canadian market.
For oranges (including tangerines), increased consumer consciousness of the role of vitamins in the diet has supported a 50 percent expansion in world output since prewar, and a small increase in world exports from most major suppliers. The United States supplied about one- third of the world crop before the war, and expansion has proceeded even more rapidly here than abroad. But only 5 percent of the crop is shipped abroad as fresh fruit, though this represents 10 to 15 percent of world exports. By far the greater part of international shipments originates in Mediterranean countries. Spain and Italy, which together produce only a fifth of the world crop, now supply more than half the world’s trade. These countries ship almost entirely to Western Europe and the United Kingdom. Though their exports were down during and immediately after World War II, both have now substantially improved their position as compared with prewar. The largest relative increase, however, has come in supplies moving from Algeria and French Morocco to metropolitan France. Israel, by contrast, which was second only to Spain as a prewar exporter, has had difficulty in maintaining its output, while an increasing proportion has been absorbed at home. For all these Mediterranean suppliers, 30 percent or more of the crop flows into export markets. Shipments occur mainly in winter and spring months, paralleling Florida’s marketing season more closely than California’s.
California’s tree fruit and nut crops, since they include importable as well as exportable products, illustrate the interplay of forces that make up foreign economic policy. Exchange controls and import restrictions that have closed European markets are defended abroad on the grounds that dollar exchange is too scarce to be used for what are considered semi-luxury purchases. American fruit growers naturally feel that foreign controls are unnecessarily restrictive, and an export-payments program
1 8
Digitized for FRASER http://fraser.stlouisfed.org/ Federal Reserve Bank of St. Louis

has been relied on to offset part of their handicap. These programs, using so-called “Section 32 funds,” have operated since fiscal 1936 under the terms of legislation which appropriates a portion of customs receipts for encouraging export and domestic consumption of agricultural (especially perishable) commodities. To foreign exporters who compete with American products in third- country markets, such export payments become a source of embarrassment and a cause for diplomatic protest. At the Seventh Session of the Contracting Parties of the General Agreement on Tariffs and Trade, held in October-November 1952, Greece and Turkey officially complained that they were being injured by the United States export subsidy on Sultana raisins.
Moreover, difficulties American fruit growers encounter in re-establishing markets cut off by war are rather similar to those faced by Mediterranean exporters of dried figs and edible tree nuts when they have re-entered the United States market. Encouraged by a 5 cent per pound duty in the Tariff Act of 1930, California's production of dried figs expanded throughout the thirties. Imports from Turkey, Greece, and Italy nevertheless remained at about 3,000 tons until war eliminated the trade. As late as 1949-50, imports had not recovered their prewar volume. Multilateral trade negotiations at Annecy in 1949 were the occasion for reducing the rate to 3 cents and a further concession to 2y2 cents was negotiated at Torquay, effective October 17, 1951. Within a year, President Truman had restored the rate to 4y2 cents, after the United States Tariff Commission had reported, in accordance with Section 7 of the Trade Agreements Extension Act of 1951, that the domestic industry was being injured. Greece and Turkey protested this action as well at the GATT session. Turkey was temporarily authorized to make compensating increases in duties it had lowered on certain goods from the United States.
Rice stands in sharp contrast to every commodity so far discussed. Rice was too minor a cereal in the American
diet for a critical domestic shortage to have resulted from the Japanese invasion of Southeast Asia. This was, on the other hand, not a traditional United States export subject to wartime loss of market. Nor have heavy postwar requirements for United States supplies as yet proved transitory. Prices received by farmers for rice held up long after those for other grains were sagging. A support price exists, but the market price remains above it by a considerable margin. For other commodities, CCC storage operations, domestic acreage controls, and competition from other supplying countries are matters of increasing concern. But as recently as September 1952 quotas had to be imposed on rice exports to assure supplies for American offshore territory and Cuba and to allocate shipments to Far Eastern deficit countries.
Some indication of the political significance and economic dislocation associated with the Far East rice shortage has already been given. To United States rice growers, war in the Pacific meant, first, new markets in deficit regions of the Western Hemisphere, which had formerly counted on the exportable surpluses of Southeast Asia. Increasingly, grain has also had to be shipped to Asia. By 1951-52, Asia had overwhelmingly become the leading export market for rice, and shipment of wheat and coarse grains to the Orient has also been heavy. A trivial exporter of rice before the war, the United States has become the third largest in the world, supplying almost 20 percent of the world’s exports and sending abroad a larger share of this than of any other major crop. Japan has been able to finance much of its recent imports by dollars earned as an incidental result of the Korean war, and shipments to South Korea in the recent past have been financed under special Government programs. But continuation of a commercial rice trade between the United States and the Orient, in place of the net grain surpluses formerly forthcoming from Southeast Asia, will further complicate Europe's problem of earning dollars in that region.
SOME IMPLICATIONS FOR PUBLIC POLICY
T h e limitations and the merits of so briefly summarizing postwar developments affecting a wide range of
commodities and of trading regions must be frankly recognized. Certainly a far more intensive treatment of individual products would be required before one could approach specific questions of American agricultural policy. Yet the breadth of coverage clearly suggests that monolithic policies which ignore the peculiar environment of particular commodities, as well as special measures which deal with the problems of single commodities in complete isolation, are likely to go seriously astray.
At issue are the economic implications, ramifications, and repercussions of particular policies. By creating unfavorable price relationships, price-support operations have penalized cottonseed in competition with soybeans, dairy products in competition with vegetable oilseeds,
vegetable oils in competition with inedible fats, domestic cotton or wool in competition with synthetic fibers. Fortunately effects in American markets soon become evident and corrective action is called for. Where policy involves trade across national frontiers, the risks of misjudging consequences and of failing to identify the long- run interest are high. The nation's military security and its position in world politics are directly involved in foreign economic policy. Mistakes in this area are accordingly extremely costly and, once made, set in motion a series of reactions that are not easily reversed.
Strategic interests do not require that United States needs be filled exclusively from domestic sources in wartime but only that they originate in defensible, reliable regions. Contiguous countries, like Mexico and Canada, come automatically within that category. Nor is the de
1 9
Digitized for FRASER http://fraser.stlouisfed.org/ Federal Reserve Bank of St. Louis

fense line properly drawn at the water's edge. Certainly the Caribbean area, probably the entire Western Hemisphere, and possibly additional territories overseas, can be protected by United States naval action.
But far more than precautions against open hostilities is at stake. The U. S. S. R. has been holding trade bait out to Western industrial nations and primary-producing countries alike, especially since the Moscow Economic Conference of 1952. Whether there is anything substantial in Soviet Russia's publicized promises to produce more consumer goods or whether defense industry continues to receive top priority in Soviet planning, this economic offensive can be expected to continue. Restriction in trade outlets among the free nations will strengthen the trading position of the Soviets.
The economic defense of capitalism rests on the virtues of market adjustments, the role of price incentives and noncoercive deterrents, and rewards for productive effort and creative ingenuity. Access to the dynamic American market, for commodities that enterprise develops abroad, is a perpetual reminder that these are virtues which America endorses abroad as well as at home. Tariffs, quotas, and restrictions shift the rules of the game and create windfall gains and losses. Accordingly, rewards may depend more on political favor than on performance of an economic service.
At that, increasingly bitter political friction is to be expected if the total volume of foreign trade shrinks. The current intersectional contest between Western and Southern cotton groups over the mechanics of crop restriction is a case in point. To the extent that agricultural price supports lead to large stock accumulations in the hands of the Commodity Credit Corporation and there is pressure for aggressive disposal abroad, domestic policy breeds international complications. Similarly, if dollars become harder to come by, United States exporters of manufactured goods will face increasingly intense competition from German, British, and Japanese products in third-country markets. These roads lead to that divisive rivalry and struggle for markets upon which the Communists rely for weakening the Western political alliance.
The purely economic advantages of trade can be foregone, but at an economic cost. Greater agricultural self- sufficiency would involve sacrificing those commodities
that are well adapted to American conditions to those that are less so. At present price levels in the United States, an enormous production of wheat and cotton is generated and abundant quantities are available for export. But the degree of protection that would be required for a strictly national wool supply would be sufficiently high to jeopardize the entire woolen-textile industry. There are individual products, in short, which could “flood" the United States. But if one considers the size of the American market relative to the rest of the free world, the role of American research in economizing on the use of imports, the high capital intensity of American enterprise, the expansibility of American production in response to commercial incentives, the difficult process of raising output abroad, and the world-wide demand for America's goods, then fears of foreign competition can be set in a more rational perspective. Without a healthy economy in the United States, the military security and the economic development of the Western world would be placed in jeopardy. Operation of the economy at a high level is nevertheless consistent with— and even facilitates — readjustment within many individual segments.
For California agriculture as a whole, which can respond so readily to shifting export requirements, there would seem to be a clear interest in a high aggregate volume of trade, almost regardless of the particular commodity composition. Much the same interest appears to hold for United States agriculture as a whole. The claim is frequently made that agriculture is being asked to shoulder the burden of import competition, while export expansion is primarily to the benefit of manufactured goods. But the great peculiarity of the United States trading position is the persisting importance of agricultural produce in the export shipments of this industrial nation. Though agriculture's share of exports has indeed been declining, its contribution in this sphere has dropped off far less rapidly than its share in national output as a whole. Moreover, in times of tight dollar supplies abroad, foreign countries seek to patronize non-dollar sources (as in cotton), or dispense with particular types of agricultural imports (like California's deciduous fruits), or reduce takings of American agricultural crops in favor of United States capital equipment that speed local industrialization programs. American agriculture would appear to have far more to fear from the competition of manufactured goods if total trade is low than if total trade is high.
20
Digitized for FRASER http://fraser.stlouisfed.org/ Federal Reserve Bank of St. Louis

USEFUL SOURCE MATERIALS
California Crop and Livestock Reporting Service, California Field Crop Statistics 1866- 1946, by Lowell M. Clarke and George A. Scott (Sacramento, 1947).
California Crop and Livestock Reporting Service, California Field Crop Statistics 1944-1952, by Lowell M. Clarke and George A. Scott (Sacramento, 1953).
Food and Agriculture Organization of the United Nations, Monthly Bulletin of Agricultural Economics and Statistics (Rome).
Food and Agriculture Organization of the United Nations, Yearbook of Food and Agricultural Statistics, Vol. VI, Part 1, Production (Rome, 1953), Part 2, Trade (Rome, 1953).
Johnston, Bruce F., Japanese Food Management in World War II (Stanford, 1953).United Kingdom, Commonwealth Economic Committee, Fruit (London, 1952).United Kingdom, Commonwealth Economic Committee, Industrial Fibers (London,
1953).United Kingdom, Commonwealth Economic Committee, Vegetable Oils and Oilseeds
(London, 1952).
United Nations, Economic Commission for Europe, Economic Bulletin for Europe (Geneva).
United Nations, Economic Commission for Europe, Economic Survey of Europe Since World War II (Geneva, 1953).
United Nations, Interim Coordinating Committee for International Commodity Arrangements, Review of International Commodity Problems 1952 (New York, 1953).
United States Department of Agriculture, Bureau of Agricultural Economics, The Fats and Oils Situation (Washington).
United States Department of Agriculture, Foreign Agricultural Service,Foreign Agricultural Circulars Foreign AgricultureUnited States Farm Products in Foreign Trade, Statistical
Bulletin No. 112 (Washington, 1953).United States Department of Agriculture, Production and Marketing Administration,
Sugar Branch, Sugar Statistics, Vol. I (Washington, 1953).United States Senate, Committee on Agriculture and Forestry, Foreign Trade in Agri
cultural Products, Hearings, 83rd Congress, First Session,Part 1, General Part 2, GrainsPart 3, Cotton, Livestock, Wool, Poultry Part 4, Dairy ProductsPart 5, Fats and Oils, Fresh Fruits and Vegetables, and Tobacco.
United States Tariff Commission, Edible Tree Nuts, Report to the President (1952).United States Tariff Commission, Figs, Dried, Report to the President (1952).
United States Tariff Commission, Flaxseed and Linseed Oil, Industrial Materials Series, Report No. M-7 (Washington, 1952).
21
Digitized for FRASER http://fraser.stlouisfed.org/ Federal Reserve Bank of St. Louis