revelstoke timber supply area - british columbiapublish/tfl... · web viewlandscape unit planning...
TRANSCRIPT

Tree Farm Licence 43
Timber Supply Analysis
Information Report / Analysis Report
Draft
September 21, 2009
Prepared for:
Kruger Products Limited
Prepared by:
Forsite Consulting Ltd.

TFL 43 Timber Supply Analysis Report
Acknowledgements
Contributions from the following people were instrumental in the completion of this document:
Kruger Products Limited Phil O’Connor
Key Forsite members that contributed to this project include Jeremy Hachey, Cam Brown, and Stephen Smyrl.
September 21, 2009 i
TFL 43 Timber Supply Analysis Report
Executive SummaryKruger Products Limited, the holder of Tree Farm Licence (TFL) #43 has completed this timber supply analysis in support of a new Annual Allowable Cut (AAC) determination. The AAC for this unique, predominately deciduous TFL is volume-based. It has been assessed here using an area-based approach, and subsequently converted to a yearly volume. This is largely due to the management objective of converting existing, previously harvested valley bottom deciduous stands to thrifty Hybrid Poplar. In the 2000 rationale, a volume based analysis was requested for the next TSR however this requirement is no longer necessary* and as such, this analysis has been completed using an area-based approach.
This combined report is being made available to the Public and First Nation for a period of sixty days. Although this represents a static time period for review and comment, communications with First Nations outside of this current process are ongoing and reflective of commitments to continued dialogue in approved Forest Stewardship Plans (FSP).
Unique to the current process has been the submission of both the Information and Analysis Reports as a single document. In the past both these documents were submitted with each receiving individual approval. In discussions with staff from the MoFR it was recognized that the relatively simplistic nature of the area based analysis / timber supply modeling greatly reduced the need of producing each document as a separate entity. Combining both documents does not increase the uncertainty or risk associated with the determination of a new AAC. The resulting process is however more streamlined representing a significant saving of both time and money for all parties involved in the new determination.
The Base Case analysis has a proposed harvest level for Management Plan 5 of 117.8 ha/year. The current AAC of TFL 43 is 108.2 ha/year. The Base Case harvest level represents an increase of 9.6 ha/year or 8.9% in annual harvest area in comparison to the AAC for MP 4. This results from a larger THLB area (less ESA and riparian reductions) and slightly shorter rotation ages in the Homathko and Kingcome Blocks (shorter regeneration delays assumed).
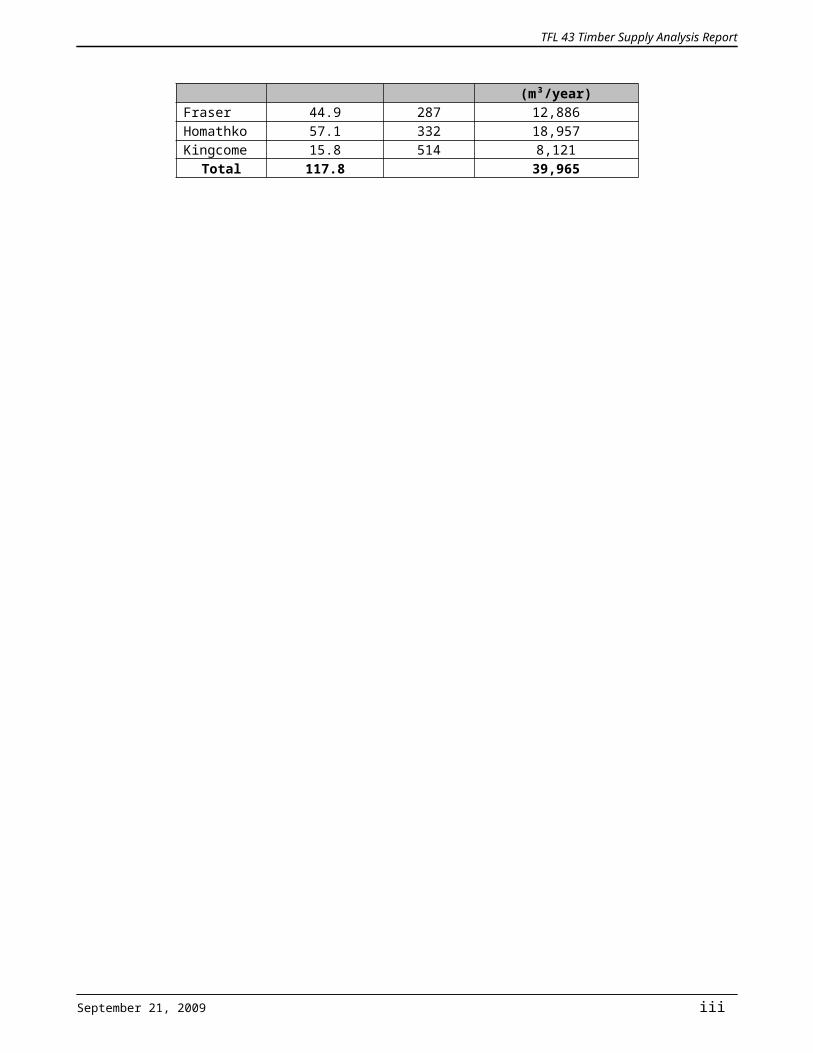
The table below shows the recommended annual harvest level for each of the three TFL Blocks.
Block
Proposed AAC (ha/year)
Wtd. Avg.Volume/ha
(m³/ha)
Approximate Volume Equivalent of Proposed
AAC (m³/year)Fraser 44.9 287 12,886Homathko 57.1 332 18,957Kingcome 15.8 514 8,121
Total 117.8 39,965
* Mike Clarkson, letter sent to Phil O’Connor. 19 November 2008. Ref: 19710-40/43
September 21, 2009 ii
TFL 43 Timber Supply Analysis Report
Table of Contents1.0 INTRODUCTION..............................................................................................................1
1.1 DESCRIPTION OF THE LAND BASE.......................................................................................21.2 INTEGRATED RESOURCE MANAGEMENT CONSIDERATIONS...................................................31.3 CURRENT ATTRIBUTES OF TFL 43......................................................................................3
1.3.1 Species Distribution..................................................................................................81.3.2 Age Class Structure..................................................................................................91.3.3 Site Index Profile.....................................................................................................10
2.0 TIMBER SUPPLY ANALYSIS METHODS....................................................................122.1 DATA SOURCES................................................................................................................132.2 FOREST COVER INVENTORY..............................................................................................132.3 TIMBER HARVESTING LAND BASE DETERMINATION............................................................132.4 EXCLUSIONS FROM THE PRODUCTIVE FORESTED LAND BASE.............................................16
2.4.1 Non-forest and non-productive forest.....................................................................162.4.2 Roads, trails, and landings.....................................................................................16
2.4.2.1 Existing classified roads..................................................................................162.4.2.2 Existing unclassified roads..............................................................................162.4.2.3 Future Roads, Trails, and Landings................................................................17
2.5 EXCLUSIONS FROM THE TIMBER HARVESTING LAND BASE..................................................172.5.1 Homathko Estuary Park..........................................................................................172.5.2 Non-commercial land..............................................................................................172.5.3 Inoperable/inaccessible..........................................................................................182.5.4 Environmentally sensitive areas.............................................................................182.5.5 Low productivity sites..............................................................................................202.5.6 Riparian reserves....................................................................................................202.5.7 Wildlife Habitat Areas – Grizzly..............................................................................202.5.8 Old Growth Management Areas.............................................................................21
2.5.8.1 Fraser River Block..........................................................................................212.5.8.2 Homathko River Block....................................................................................212.5.8.3 Kingcome River Block.....................................................................................21
2.5.9 Cultural Heritage Resources...................................................................................212.6 NON RECOVERABLE LOSSES.............................................................................................222.7 ROTATION LENGTHS.........................................................................................................22
2.7.1 Merchantability Criteria...........................................................................................222.7.2 Regeneration Delays..............................................................................................222.7.3 Espacement Trial....................................................................................................232.7.4 Permanent Sample Plot Data.................................................................................24
2.7.4.1 PSPs associated with Historic Management Practices..................................242.7.4.2 PSPs associated with Current Management Practices..................................25
2.7.5 Kruger’s Operational Experience............................................................................272.7.6 Selected Rotation Lengths......................................................................................27
2.8 INTEGRATED RESOURCE MANAGEMENT.............................................................................272.9 Green-up/adjacency...............................................................................................282.10 Visual resources.....................................................................................................282.11 Wildlife – Grizzly Bear.............................................................................................282.12 Biodiversity.............................................................................................................292.12.1 Landscape-level biodiversity...................................................................................292.12.2 Stand-level biodiversity — Wildlife Tree Retention.................................................30
2.13 CHANGES FROM MP4.......................................................................................................30
3.0 TIMBER SUPPLY ANALYSIS RESULTS.....................................................................32
September 21, 2009 iii
TFL 43 Timber Supply Analysis Report
3.1 FRASER BLOCK HARVEST LEVEL AND PROPOSED AAC CALCULATION................................323.2 HOMATHKO BLOCK HARVEST LEVEL AND PROPOSED AAC CALCULATION...........................333.3 KINGCOME BLOCK HARVEST LEVEL AND PROPOSED AAC CALCULATION............................343.4 TOTAL TFL AREA.............................................................................................................353.5 SENSITIVITY ANALYSIS......................................................................................................35
3.5.1 Rotation Lengths.....................................................................................................353.5.1.1 Sensitivity (-2 years).......................................................................................353.5.1.2 Sensitivity (+2 years)......................................................................................36
3.5.2 Size of the timber Harvesting Land Base (THLB)...................................................363.5.2.1 Sensitivity (THLB -5%)....................................................................................363.5.2.2 Sensitivity (THLB +5%)...................................................................................36
3.6 CONCLUSIONS / RECOMMENDED HARVEST LEVELS............................................................37
4.0 20 YEAR PLAN..............................................................................................................384.1 INTRODUCTION.................................................................................................................384.2 INTRODUCTION.................................................................................................................384.3 GUIDELINES AND OBJECTIVES...........................................................................................384.4 MAPS...............................................................................................................................394.5 PLAN DISCUSSION AND RESULTS......................................................................................39
4.5.1 Fraser Block............................................................................................................394.5.2 Homathko Block......................................................................................................414.5.3 Kingcome Block......................................................................................................44
5.0 REFERENCES...............................................................................................................466.0 GLOSSARY....................................................................................................................477.0 ACRONYMS...................................................................................................................51APPENDIX A - 20 YEAR PLAN MAPS.....................................................................................52
September 21, 2009 iv

TFL 43 Timber Supply Analysis Report
List of TablesTABLE 1. DATA INPUTS................................................................................................................13TABLE 2. TIMBER HARVESTING LAND BASE AREA NETDOWN SUMMARY...........................................14TABLE 3. LAND BASE REDUCTIONS FOR NON-FOREST AND NON-PRODUCTIVE AREA........................16TABLE 4. LAND BASE REDUCTIONS FOR EXISTING CLASSIFIED ROADS............................................16TABLE 5. LAND BASE REDUCTIONS FOR EXISTING UNCLASSIFIED ROADS........................................17TABLE 6. LAND BASE REDUCTIONS FOR THE HOMATHKO ESTUARY PARK.......................................17TABLE 7. LAND BASE REDUCTIONS FOR NON-COMMERCIAL COVER.................................................17TABLE 8. LAND BASE REDUCTIONS FOR INOPERABLE AREAS..........................................................18TABLE 9. LAND BASE REDUCTIONS FOR ENVIRONMENTALLY SENSITIVE AREAS..............................19TABLE 10. LAND BASE REDUCTIONS FOR RIPARIAN RESERVE AND MANAGEMENT ZONES.................20TABLE 11. LAND BASE REDUCTIONS FOR IDENTIFIED WILDLIFE......................................................21TABLE 12. LAND BASE REDUCTIONS FOR SPATIAL OGMA'S IN TFL: 43.........................................21TABLE 13. INFERRED HARVEST AGES BASED ON FRASER BLOCK RESULTS AND AVERAGE SITE INDICES.24TABLE 14. SELECTED ROTATION LENGTHS FOR TIMBER SUPPLY ANALYSIS...................................27TABLE 15. TIMBER HARVESTING LAND BASE AREA NETDOWN SUMMARY - FRASER BLOCK..............32TABLE 16. TIMBER HARVESTING LAND BASE AREA NETDOWN SUMMARY - HOMATHKO BLOCK..........33TABLE 17. TIMBER HARVESTING LAND BASE AREA NETDOWN SUMMARY - KINGCOME BLOCK...........34TABLE 18. SUMMARY OF PROPOSED ALLOWABLE ANNUAL CUT CALCULATIONS FOR TFL 43..........35TABLE 19. SENSITIVITY - ROTATION LENGTH DECREASED BY 2 YEARS...........................................35TABLE 20. SENSITIVITY - ROTATION LENGTH INCREASE BY 2 YEARS..............................................36TABLE 21. SENSITIVITY – THLB AREA DECREASED BY 5%...........................................................36TABLE 22. SENSITIVITY – THLB AREA INCREASED BY 5%............................................................36TABLE 23. RECOMMEND HARVEST LEVELS (HA/YEAR) FOR MANAGEMENT PLAN 5..........................37TABLE 24. FRASER BLOCK – 20 YEAR PLAN HARVEST AREA SUMMARY..........................................41TABLE 25. HOMATHKO BLOCK – 20 YEAR PLAN HARVEST AREA SUMMARY.....................................43TABLE 26. KINGCOME BLOCK – 20 YEAR PLAN HARVEST AREA SUMMARY......................................45
September 21, 2009 v

TFL 43 Timber Supply Analysis Report
List of FiguresFIGURE 1. TFL 43 LOCATION MAP..................................................................................................2FIGURE 2. TFL 43 LAND BASE DEFINITION MAP – FRASER..............................................................5FIGURE 3. TFL 43 LAND BASE DEFINITION MAP – HOMATHKO BLOCK............................................6FIGURE 4. TFL 43 LAND BASE DEFINITION MAP – KINGCOME BLOCK.............................................7FIGURE 5. TFL 43 AREA BY LEADING SPECIES - FRASER BLOCK.....................................................8FIGURE 6. TFL 43 AREA BY LEADING SPECIES - HOMATHKO BLOCK................................................8FIGURE 7. TFL 43 AREA BY LEADING SPECIES - KINGCOME BLOCK.................................................9FIGURE 8. TFL 43 CURRENT AGE CLASS STRUCTURE (2009) - FRASER BLOCK...............................9FIGURE 9. TFL 43 CURRENT AGE CLASS STRUCTURE (2009) - HOMATHKO BLOCK.........................10FIGURE 10. TFL 43 CURRENT AGE CLASS STRUCTURE (2009) - KINGCOME BLOCK........................10FIGURE 11. TFL 43 SITE INDEX PROFILE - FRASER BLOCK THLB.................................................11FIGURE 12. TFL 43 SITE INDEX PROFILE - HOMATHKO BLOCK THLB............................................11FIGURE 13. TFL 43 SITE INDEX PROFILE - KINGCOME BLOCK THLB.............................................12FIGURE 14. TFL 43 LAND BASE SUMMARY...................................................................................15FIGURE 15. AVERAGE DIAMETER BREAST HEIGHT (CM) FOR 4 CLONES PLANTED AT THE HARRISON MILL
NURSERY ESPACEMENT TRIAL ESTABLISHED IN 1987 WITH 4.5M X 4.5M SPACING...................23FIGURE 16. PSP DATA ASSOCIATED WITH ‘HISTORICAL’ MANAGEMENT PRACTICES – FRASER BLOCK25FIGURE 17. PSP DATA ASSOCIATED WITH ‘CURRENT’ MANAGEMENT PRACTICES – FRASER BLOCK. 26FIGURE 18. PSP DATA ASSOCIATED WITH ‘CURRENT’ MANAGEMENT PRACTICES – KINGCOME AND
HOMATHKO BLOCKS...............................................................................................................26FIGURE 19. TFL 43 FRASER BLOCK LAND BASE BREAKDOWN.......................................................40FIGURE 20. TFL 43 FRASER BLOCK THLB AGE CLASS DISTRIBUTION..........................................40FIGURE 21. TFL 43 HOMATHKO BLOCK LAND BASE BREAKDOWN..................................................42FIGURE 22. TFL 43 HOMATHKO BLOCK THLB AGE CLASS DISTRIBUTION......................................43FIGURE 23. TFL 43 KINGCOME BLOCK LAND BASE BREAKDOWN...................................................44FIGURE 24. TFL 43 KINGCOME BLOCK THLB AGE CLASS DISTRIBUTION.......................................45
September 21, 2009 vi

TFL 43 Timber Supply Analysis Report
1.0 IntroductionKruger Products Limited, the holder of Tree Farm Licence (TFL) 43 has completed this timber supply analysis / modeling in support of a new Annual Allowable Cut (AAC) determination. The purpose of timber supply analysis is to examine the short- and long-term effects of current forest management practices on the availability of timber for harvesting. The Timber Supply Modeling in this report consisted of determining an average area harvest flow. The volume was estimated and converted to an average expected volume harvest in five year periods. The 20 Year Plan is used to validate that volumes exist and therefore the methods used are appropriate for the Deputy Chief Forester to make a volume based AAC determination.
The Annual allowable cut determination for this TFL is by statute volume-based. It is unique however in that the AAC is first determined utilizing an area-based approach subsequently converted into a yearly volume. This is largely due to the management objective of converting existing, previously harvested valley bottom stands into thrifty Hybrid Poplar stands. In the 2000 rationale, a volume based analysis was requested for the next TSR however this requirement is no longer necessary† and as such, this analysis has been completed using an area-based approach.
A review of this type is normally completed at least once every five years to capture changes in data, practices, policy, or legislation influencing forest management in the TFL. The previous review (MP4) was completed in May, 1999 with a final Annual Allowable Cut (AAC) determination on March 1, 2000. Through legislation, a new timber supply review process should have been initiated in 2005. On May 14, 2004 the Deputy Chief Forester on a request from Kruger Products Limited postponed a new determination for 5 years (until 2010). This postponement by the Deputy Chief Forester was based on his Ministry’s belief that a new AAC determination would not result in a significant change in the AAC. Considering this direction the goal is to have a new AAC determination in place by January 31, 2010.
Unique to the current process has been the submission of both the Information and Analysis Reports as a single document. In the past both these documents were submitted with each receiving individual approval. In discussions with staff from the MoFR it was recognized that the relatively simplistic nature of the area based analysis / timber supply modeling greatly reduced the need of producing each document as a separate entity. Combining both documents does not increase the uncertainty or risk associated with the determination of a new AAC. The resulting process is however more streamlined representing a saving of both time and money to all parties involved in the new determination. An updated 20 Year Plan is included in this report confirming the availability of the timber resource in support of our recommended AAC.
This combined report is being made available to the Public and First Nation for a period of sixty days. Although this represents a static time period for review and comment, communications with First Nations outside of this current process are ongoing and reflective of commitments to continued dialogue in approved Forest Stewardship Plans (FSP).
† Mike Clarkson, letter sent to Phil O’Connor. 19 November 2008. Ref: 19710-40/43
September 21, 20091

TFL 43 Timber Supply Analysis Report
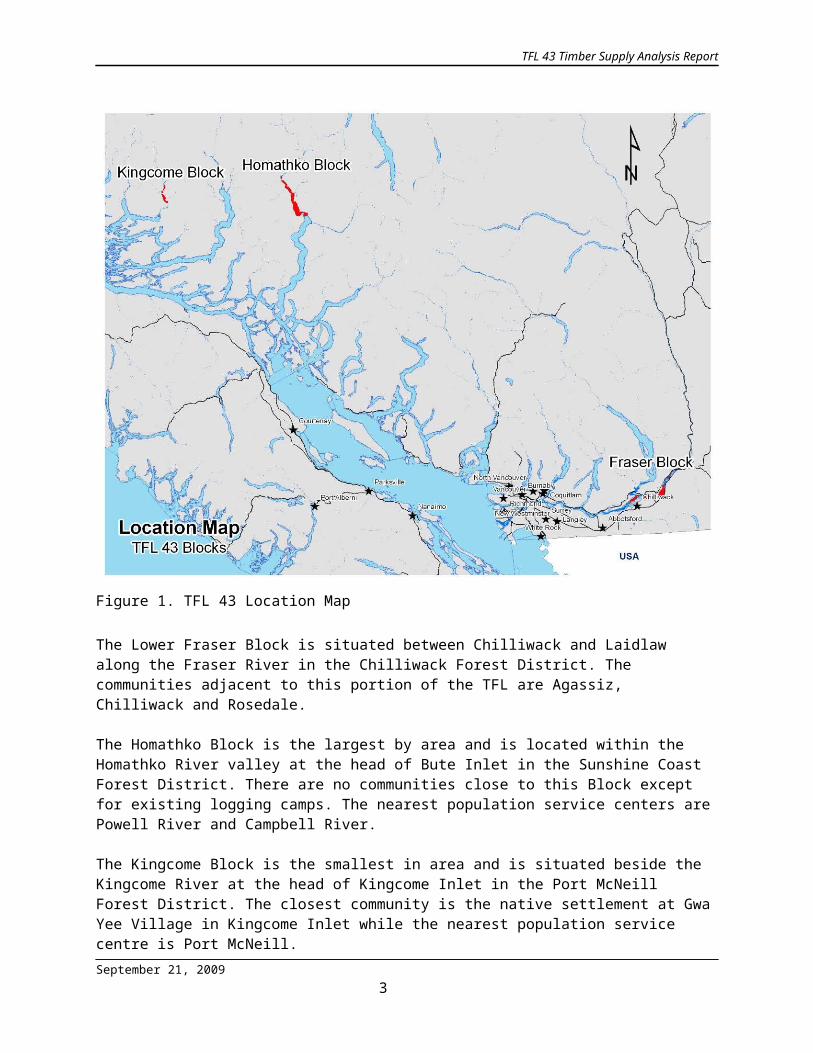
1.1 Description of the Land BaseTFL 43 is located in 3 geographically distinct Blocks within the coastal mountains in the southern portion of British Columbia. The TFL lands are situated on the flood plains of the Lower Fraser, Homathko and Kingcome Rivers (Figure 1). The total area of the TFL is 10,183 hectares of which 7,859 hectares are Crown land and 2,324 hectares are fee simple lands owned by Kruger Products.
Figure 1. TFL 43 Location Map
The Lower Fraser Block is situated between Chilliwack and Laidlaw along the Fraser River in the Chilliwack Forest District. The communities adjacent to this portion of the TFL are Agassiz, Chilliwack and Rosedale.
The Homathko Block is the largest by area and is located within the Homathko River valley at the head of Bute Inlet in the Sunshine Coast Forest District. There are no communities close to this Block except for existing logging camps. The nearest population service centers are Powell River and Campbell River.
The Kingcome Block is the smallest in area and is situated beside the Kingcome River at the head of Kingcome Inlet in the Port McNeill Forest District. The closest community is the native
September 21, 20092

TFL 43 Timber Supply Analysis Report
settlement at Gwa Yee Village in Kingcome Inlet while the nearest population service centre is Port McNeill.
All three Blocks of the TFL are located within the Coastal Western Hemlock (CWH) biogeoclimatic zone. The CWH zone, on average, receives the highest amount of rainfall in BC. The climate within this zone is characterized by cool summers (although hot dry spells can be frequent) and mild winters. Specifically, the Lower Fraser Block is found within the dry maritime coastal western hemlock subzone (CWHdm) which is characterized by warm, relatively dry summers and moist, mild winters with little snowfall. Growing seasons are quite long with plants experiencing minor water deficits throughout the year. The Homathko Block is located within the southern dry submaritime coastal western hemlock subzone (CWHds) with a climate transitional between the coast and interior, characterized by warm, dry summers and moist, cool winters with moderate snowfall. The Kingcome Block is situated within the most extensive biogeoclimatic subzone found on the coast, submontane very wet maritime coastal western hemlock variant (CWHvml). It has a wet, humid climate with cool summers and mild winters featuring relatively little snow.
1.2 Integrated Resource Management Considerations
Since the last analysis a number of land use planning processes have been completed. Where the results of these planning processes have impacted the landbase of TFL 43 they have been incorporated into this analysis by way of spatial reductions.
The Central Coast Land and Resources Management Plan (CCLRMP ) was by far the largest planning process completed since the last analysis. A series of Legal Objectives guiding management of the landbase covered by the plan were established. It was recognized that operations in the Kingcome portion of TFL 43 would be severely restricted by these Legal Objectives, as such the Legal Order establishing the Objectives exempted the Kingcome block of TFL 43. The impacts of the CCLRMP Legal Objectives were therefore not factored into this analysis.
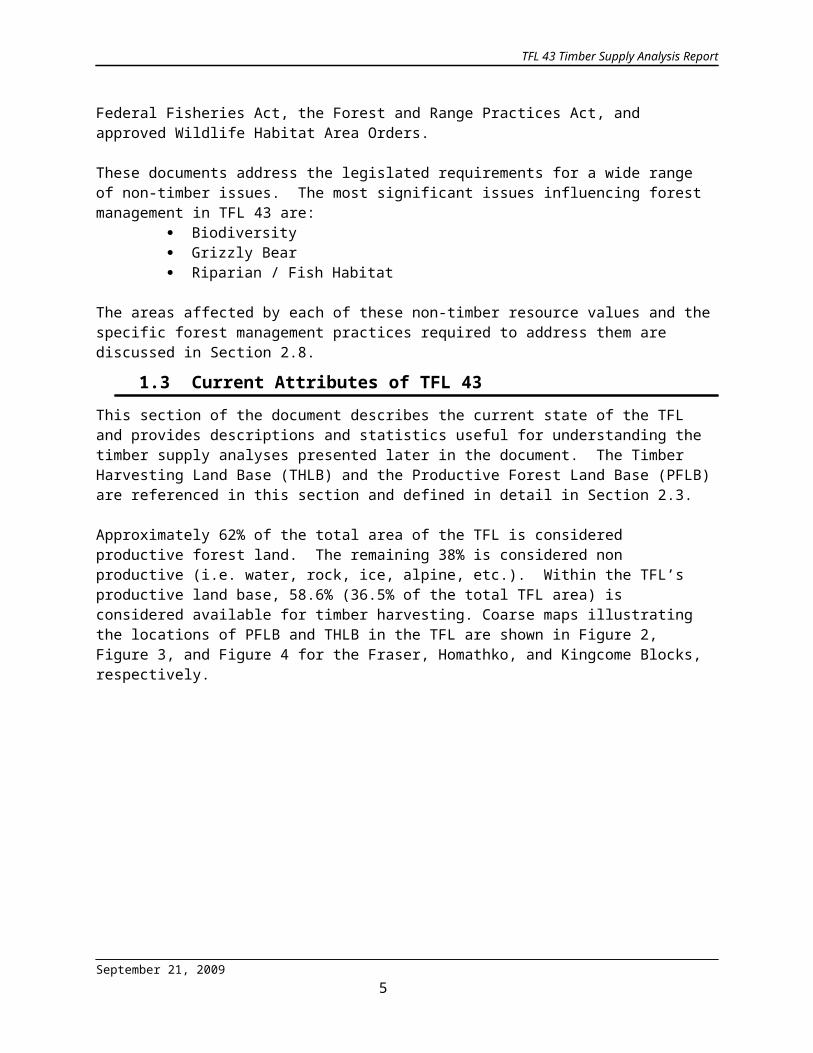
Integrated resource management is a basic premise for the practice of forestry in TFL 43. Timber harvesting is planned and managed in such a way that allows a wide range of other values to co-exist on the land base. The manner in which each value is considered is dictated by federal or provincial legislation or BC government policy and described by Kruger’s Management Plans. Examples of these are the Federal Fisheries Act, the Forest and Range Practices Act, and approved Wildlife Habitat Area Orders.
These documents address the legislated requirements for a wide range of non-timber issues. The most significant issues influencing forest management in TFL 43 are:
Biodiversity Grizzly Bear Riparian / Fish Habitat
The areas affected by each of these non-timber resource values and the specific forest management practices required to address them are discussed in Section 2.8.
1.3 Current Attributes of TFL 43This section of the document describes the current state of the TFL and provides descriptions and statistics useful for understanding the timber supply analyses presented later in the
September 21, 20093

TFL 43 Timber Supply Analysis Report
document. The Timber Harvesting Land Base (THLB) and the Productive Forest Land Base (PFLB) are referenced in this section and defined in detail in Section 2.3.
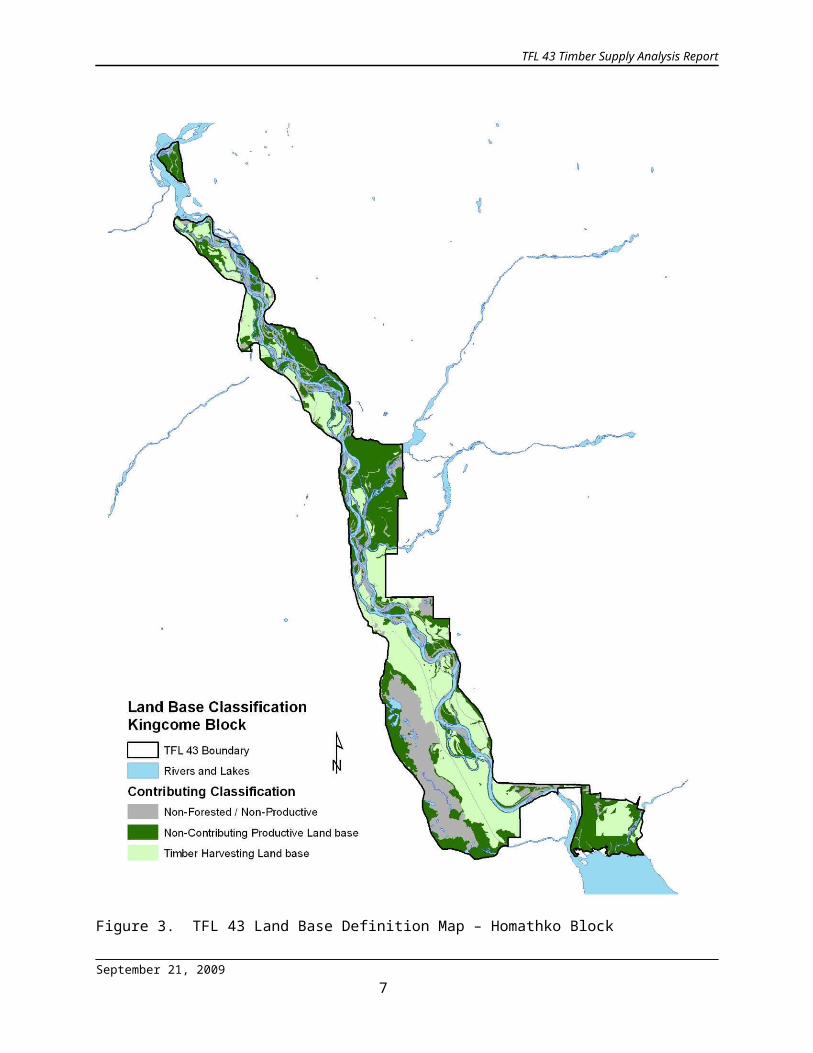
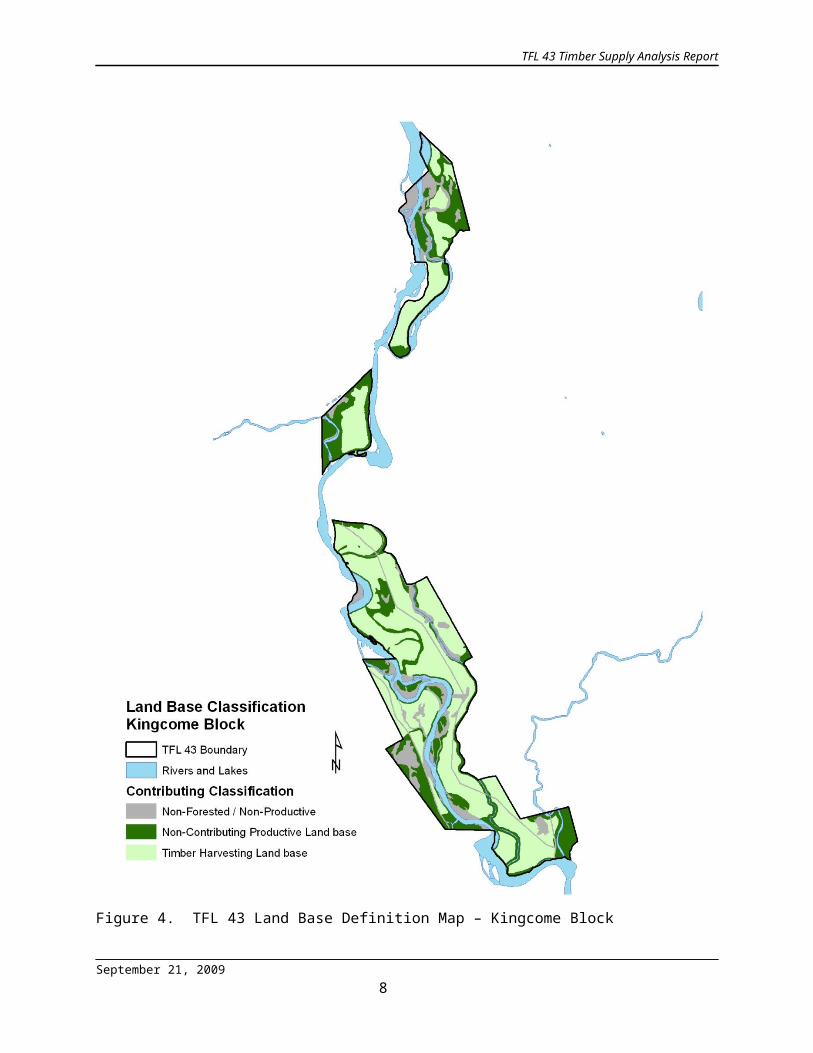
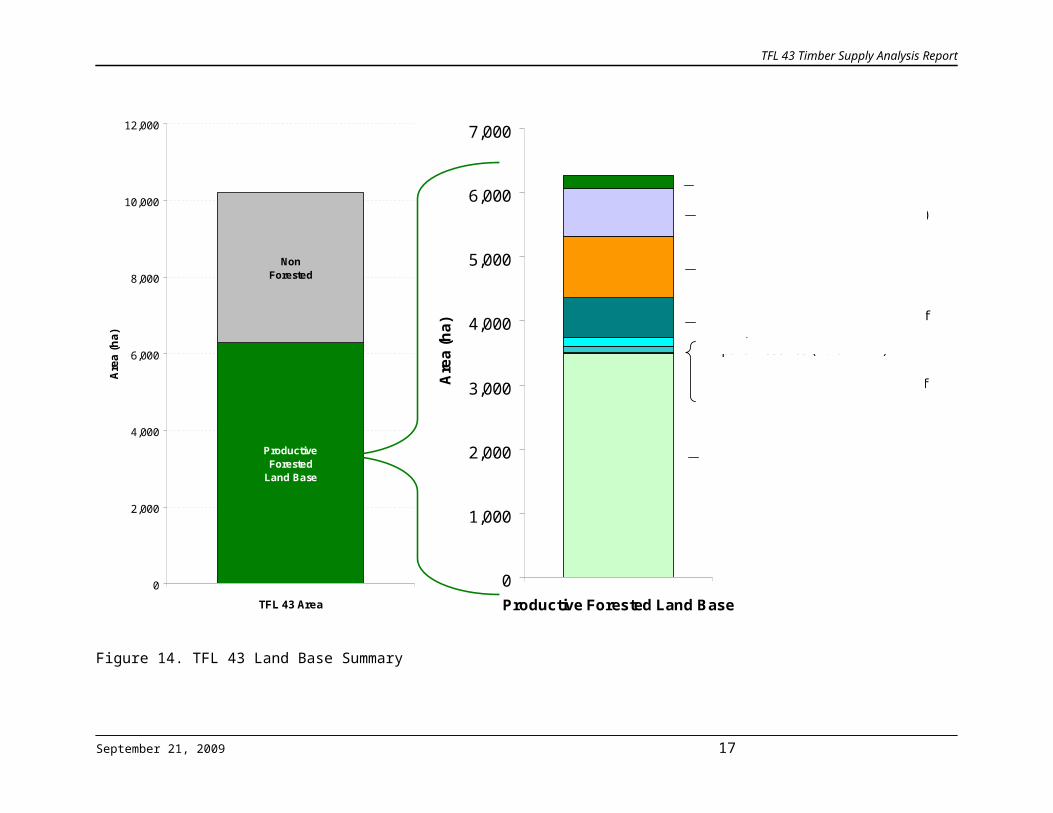
Approximately 62% of the total area of the TFL is considered productive forest land. The remaining 38% is considered non productive (i.e. water, rock, ice, alpine, etc.). Within the TFL’s productive land base, 58.6% (36.5% of the total TFL area) is considered available for timber harvesting. Coarse maps illustrating the locations of PFLB and THLB in the TFL are shown in Figure 2, Figure 3, and Figure 4 for the Fraser, Homathko, and Kingcome Blocks, respectively.
September 21, 20094
TFL 43 Timber Supply Analysis Report
Figure 2. TFL 43 Land Base Definition Map – Fraser
September 21, 2009 5

TFL 43 Timber Supply Analysis Report
Figure 3. TFL 43 Land Base Definition Map – Homathko Block
September 21, 20096
TFL 43 Timber Supply Analysis Report
Figure 4. TFL 43 Land Base Definition Map – Kingcome Block
September 21, 20097

TFL 43 Timber Supply Analysis Report
1.3.1Species Distribution
The forests of the TFL are dominated by Cottonwood and Alder. An overview of the area by leading species for TFL 43 in 2009 is provided in Figure 5, Figure 6, and Figure 7, for the Fraser, Homathko, and Kingcome blocks respectively.
0
200
400
600
800
1,000
1,200
1,400
Cottonw ood Cedar Non-CommercialBrush
Unknow n
Leading Species
Are
a (h
a)
PFLB not THLB
THLB
Figure 5. TFL 43 Area by Leading Species - Fraser block
0
200
400
600
800
1,000
1,200
1,400
1,600
1,800
2,000
Cottonwood Alder Cedar Sitka Spruce Birch BroadleafMaple
Douglas-fir Hemlock Pine Non-Commercial
Brush
Unknown
Leading Species
Are
a (h
a)
PFLB not THLBTHLB
Figure 6. TFL 43 Area by Leading Species - Homathko Block
September 21, 20098
TFL 43 Timber Supply Analysis Report
0
50
100
150
200
250
300
350
400
450
Cottonwood Alder Cedar Sitka Spruce Balsam Hemlock Non-Commercial
Brush
Unknown
Leading Species
Are
a (h
a)PFLB not THLBTHLB
Figure 7. TFL 43 area by Leading Species - Kingcome Block
1.3.2Age Class Structure
The age class structures of each of the three blocks is shown in Figure 8, Figure 9, and Figure 10 for the Fraser, Homathko, and Kingcome blocks respectively.
0
100
200
300
400
500
600
0-5 6-10 11-15 16-20 21-25 26-30 31-40 41-60 81-100
101-120
121-140
141-250
>250
Age Class
Are
a (h
a)
PFLB not THLBTHLB
Figure 8. TFL 43 current age class structure (2009) - Fraser Block
September 21, 20099
TFL 43 Timber Supply Analysis Report
0
100
200
300
400
500
600
700
800
900
1,000
0-5 6-10 11-15 16-20 21-25 26-30 31-40 41-60 81-100
101-120
121-140
141-250
>250
Age Class
Are
a (h
a)PFLB not THLBTHLB
Figure 9. TFL 43 current age class structure (2009) - Homathko Block
0
50
100
150
200
250
0-5 6-10 11-15 16-20 21-25 26-30 31-40 41-60 81-100
101-120
121-140
141-250
>250
Age Class
Are
a (h
a)
PFLB not THLBTHLB
Figure 10. TFL 43 current age class structure (2009) - Kingcome Block
1.3.3Site Index Profile
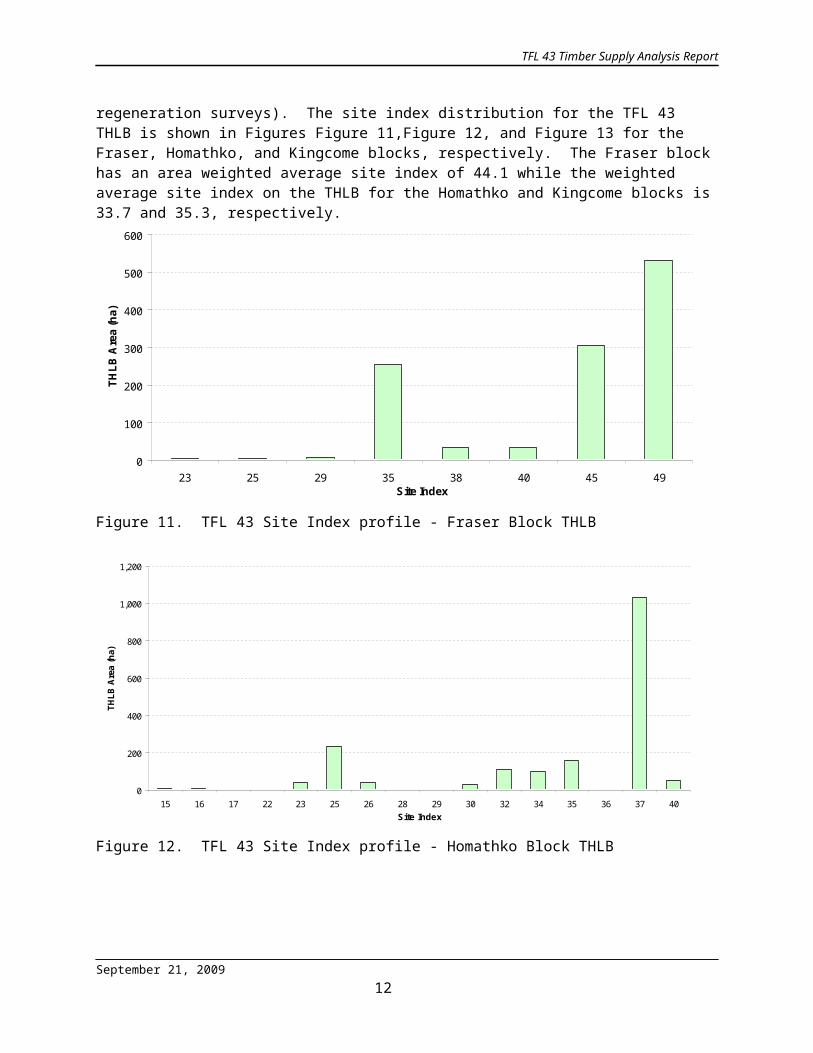
Site index values were primarily obtained from the forest cover inventory file used for MP#4. At the time, site index values were assigned using a combination of field reconnaissance data, permanent sample plot data and field observations. In cases where better information was available, that information was used (i.e. from regeneration surveys). The site index distribution for the TFL 43 THLB is shown in Figures Figure 11,Figure 12, and Figure 13 for the Fraser, Homathko, and Kingcome blocks, respectively. The Fraser block has an area weighted average
September 21, 200910

TFL 43 Timber Supply Analysis Report
site index of 44.1 while the weighted average site index on the THLB for the Homathko and Kingcome blocks is 33.7 and 35.3, respectively.
0
100
200
300
400
500
600
23 25 29 35 38 40 45 49Site Index
THLB
Are
a (h
a)
Figure 11. TFL 43 Site Index profile - Fraser Block THLB
0
200
400
600
800
1,000
1,200
15 16 17 22 23 25 26 28 29 30 32 34 35 36 37 40Site Index
THLB
Are
a (h
a)
Figure 12. TFL 43 Site Index profile - Homathko Block THLB
September 21, 200911

TFL 43 Timber Supply Analysis Report
0
20
40
60
80
100
120
140
160
180
200
20 23 25 28 29 31 34 35 36 40 45Site Index
THLB
Are
a (h
a)
Figure 13. TFL 43 Site Index profile - Kingcome Block THLB
2.0 Timber Supply Analysis MethodsSince the issuance of TFL 43 in the early 80’s, Kruger Products has utilized an analysis method focused on providing an area based equivalent harvest in contrast to the more conventional volume based approach. This is due to the company’s management objective of converting previously harvested, deciduous valley bottom sites to Hybrid Poplar.
The Analysis Methods and Timber Supply Modeling in this report consist of determining an average area harvest flow. The volume was estimated and converted to an average expected volume harvest in five year periods. The 20 Year Plan is used to validate that volumes exist and therefore the methods used are appropriate for the Deputy Chief Forester to make a volume based AAC determination.
The timber supply will be calculated for each Block of the TFL as each Block is managed as an individual operating unit. The following formula is used to calculate the TFL allowable annual cut:
Total TFL AAC (ha) =
THLB of the Fraser Block (ha)
Rotation Length of the Fraser Block
+THLB of the Homathko Block (ha)
Rotation Length of the Homathko Block
+THLB of the Kingcome Block (ha)
Rotation Length of the Kingcome Block
September 21, 200912

TFL 43 Timber Supply Analysis Report
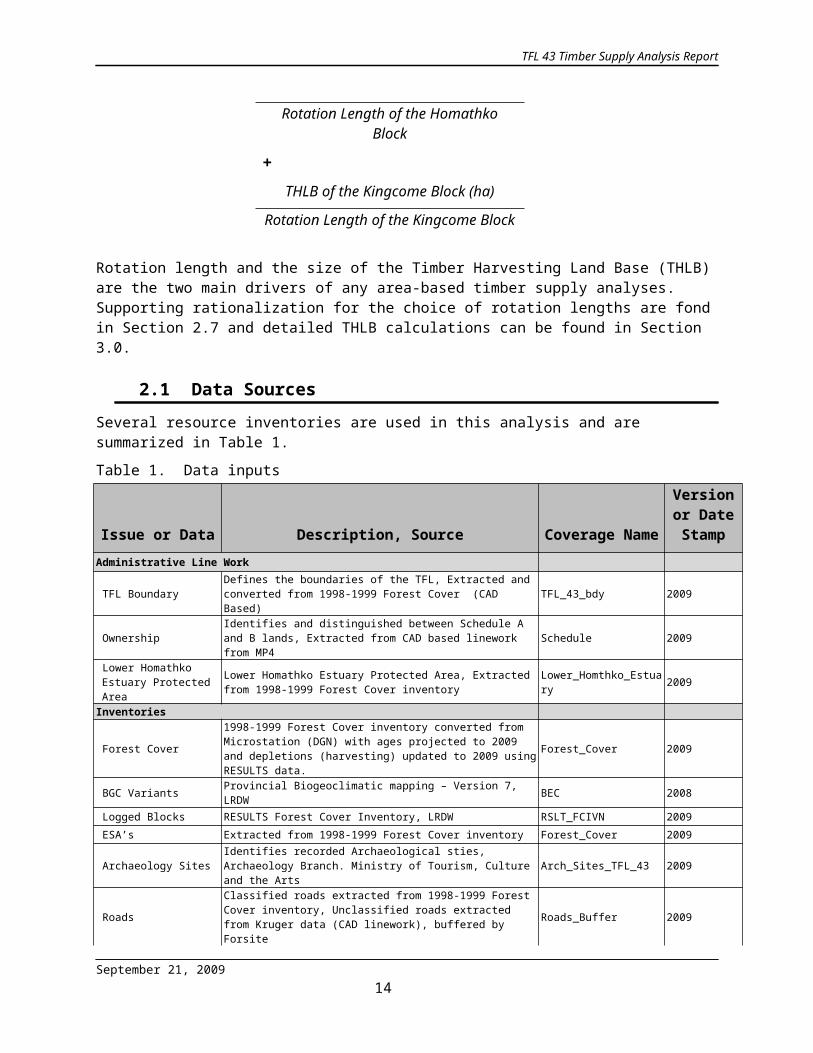
Rotation length and the size of the Timber Harvesting Land Base (THLB) are the two main drivers of any area-based timber supply analyses. Supporting rationalization for the choice of rotation lengths are fond in Section 2.7 and detailed THLB calculations can be found in Section 3.0.
2.1 Data SourcesSeveral resource inventories are used in this analysis and are summarized in Table 1.
Table 1. Data inputs
Issue or Data Description, Source Coverage Name
Version or Date
StampAdministrative Line Work
TFL Boundary Defines the boundaries of the TFL, Extracted and converted from 1998-1999 Forest Cover (CAD Based) TFL_43_bdy 2009
Ownership Identifies and distinguished between Schedule A and B lands, Extracted from CAD based linework from MP4 Schedule 2009
Lower Homathko Estuary Protected Area
Lower Homathko Estuary Protected Area, Extracted from 1998-1999 Forest Cover inventory Lower_Homthko_Estuary 2009
Inventories
Forest Cover1998-1999 Forest Cover inventory converted from Microstation (DGN) with ages projected to 2009 and depletions (harvesting) updated to 2009 using RESULTS data.
Forest_Cover 2009
BGC Variants Provincial Biogeoclimatic mapping – Version 7, LRDW BEC 2008 Logged Blocks RESULTS Forest Cover Inventory, LRDW RSLT_FCIVN 2009
ESA’s Extracted from 1998-1999 Forest Cover inventory Forest_Cover 2009
Archaeology Sites Identifies recorded Archaeological sties, Archaeology Branch. Ministry of Tourism, Culture and the Arts Arch_Sites_TFL_43 2009
RoadsClassified roads extracted from 1998-1999 Forest Cover inventory, Unclassified roads extracted from Kruger data (CAD linework), buffered by Forsite
Roads_Buffer 2009
Management Guidelines OGMAs Legal established Old Growth Management Area, LRDW OGMA 2009
WHAs Legally established Wildlife Habitat Areas, LRDW WHA 2009
2.2 Forest Cover InventoryThe original forest inventory for TFL 43 was completed in the 1980s to facilitate the issuance of the TFL. Since then, it has been maintained and updated by new operational cruises and other operational assessments. The forest cover data was updated on September 30, 1998 in preparation for the timber supply analysis for MP#4 and has been updated again in 2009 for this latest timber supply analysis. Updates for harvest depletions were made using RESULTS spatial and attribute information in conjunction with aerial photography flown in 2002 (to verify location of blocks) as well as Kruger staff input.
2.3 Timber Harvesting Land Base DeterminationThe Productive Forest Land Base (PFLB) is the subset of the TFL that is considered forested and able to contribute toward non-timber values such as biodiversity. The PFLB excludes non-crown land, woodlots, non-forest and non-productive areas. TFL 43 is largely composed of Schedule B land (provincial land in TFL) but also contains some Schedule A land in the Fraser Block.
September 21, 200913
TFL 43 Timber Supply Analysis Report
The Timber Harvesting Land Base (THLB) is the subset of the TFL where timber harvesting is anticipated to occur now or in the future. The THLB excludes areas that are inoperable or uneconomic for timber harvesting, or are otherwise reserved for non-timber values. The THLB is contained entirely within the PFLB. Table 2 summarizes the land base for TFL 43 and includes both Schedule A and B land. Differences from MP4 are summarized in Section 2.13.
Table 2. Timber harvesting land base area netdown summary
Factor
Effective Area (ha)% of TFL
% ofProductive Forest
Schedul
e ASchedul
e BTotal Area
Total TFL Area 1,195 8,981 10,175 100.0% Non-forest / Non-productive forest 459 3347 3806 37.4% Existing roads, trails and landings 0 92 92 0.9%
Total Productive Forest 736 5,541 6,277 61.7% 100.0%Less: In PFLB:
Protected Areas 0 212 212 2.1% 3.4%Non-Commercial Land (NC Br) 92 639 731 7.2% 11.6%Inoperable/Inaccessible 8 951 960 9.4% 15.3%Environmentally Sensitive Area 1 5 637 643 6.3% 10.2%Environmentally Sensitive Area 2 0 0 0 0.0% 0.0%Low Productivity Sites 0 0 0 0.0% 0.0%Riparian Reserves 12 116 128 1.3% 2.0%Wildlife Habitat Areas - Grizzly 0 97 97 1.0% 1.5%Old Growth Management Areas** 0 16 16 0.2% 0.3%Cultural heritage resources 0 0 0 0.0% 0.0%
Timber Harvesting Land Base –THLB (ha) 618 2,872 3,490 34.3% 55.6%Less Other Removals:
Estimate of Future Roads, Trails, and Landings (1%) 0 5 5 0.0% 0.1%
Effective Long-term THLB (ha) 618 2,868 3,486 34.3% 55.5%* Effective netdown area represents the area that was actually removed as a result of a given factor. Removals are applied in the order shown above, thus areas removed lower on the list do not contain areas that overlap with factors that occur higher on the list. For example, the parks netdown does not include any non forested area.
September 21, 200914

TFL 43 Timber Supply Analysis Report
Productive Forested
Land Base
Non Forested
0
2,000
4,000
6,000
8,000
10,000
12,000
TFL 43 Area
Area
(ha)
(38%)
(62%)
0
1,000
2,000
3,000
4,000
5,000
6,000
7,000
Productive Forested Land Base
Are
a (h
a)
Protected Areas (3% of PFLB)
Non-Commercial Brush (12% of PFLB)
Grizzly WHA (2% of PFLB)Old Growth Management Area (0.3% of PFLB)
THLB (56% of PFLB)
Inoperable (15.3% of PFLB)
Enviromentally Sensitive Areas (10% of PFLB)Riparian reserves (2% of PFLB)
Figure 14. TFL 43 Land Base Summary
September 21, 2009 15
TFL 43 Timber Supply Analysis Report
2.4 Exclusions from the Productive Forested Land Base2.4.1Non-forest and non-productive forest
All land classified as non-forest, non-productive (lakes, swamps, rock, alpine, etc.), or non-typed in the forest cover files were excluded from the timber harvesting land base. The non-forest and non-productive areas and descriptions used in the netdown process are listed in Table 3.
Table 3. Land base reductions for non-forest and non-productive area
Description
Total area (ha) Total Netdown Area (ha)Fraser Homathko Kingcome
Lake 0 38 0 38Mud / Slough 54 25 4 83Rock / Slide 0 15 2 16
River / Creek / Stream / Side Channel 1,110 520 79 1,708Sandbar 736 461 64 1,260
Swamp / Treed Swamp 2 644 49 695Non-Forested 3 10 0 13Kilby Nursery 6 0 0 6
Total 1,910 1,712 198 3,819
2.4.2Roads, trails, and landings
Quantifying the area that is, and will be, disturbed by roads, trails, landings (RTLs) and other access features in the TFL is an important part of determining the THLB. Area expected to remain non-productive was removed from the THLB as outlined below.
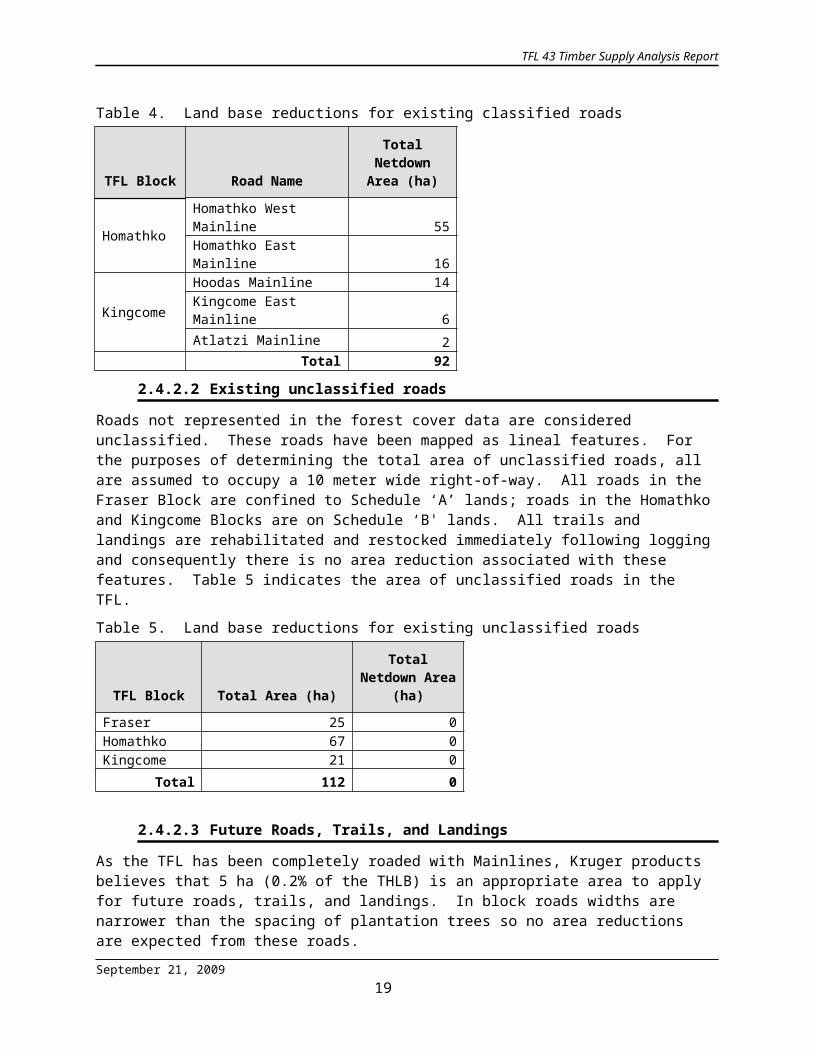
2.4.2.1 Existing classified roads
Classified roads, trails and landings are those that are mapped as polygons distinctly separate from adjacent polygons. Only the mainline roads have been identified as separate polygons (type "U") on the forest cover maps. Table 8 summarizes the areas of classified roads for each block of the TFL and the subsequent reductions applied to the total area.
Table 4. Land base reductions for existing classified roads
TFL Block Road NameTotal Netdown
Area (ha)
HomathkoHomathko West Mainline 55Homathko East Mainline 16
Kingcome
Hoodas Mainline 14Kingcome East Mainline 6Atlatzi Mainline 2
Total 92
2.4.2.2 Existing unclassified roads
Roads not represented in the forest cover data are considered unclassified. These roads have been mapped as lineal features. For the purposes of determining the total area of unclassified roads, all are assumed to occupy a 10 meter wide right-of-way. All roads in the Fraser Block
September 21, 200916
TFL 43 Timber Supply Analysis Report
are confined to Schedule ‘A’ lands; roads in the Homathko and Kingcome Blocks are on Schedule ‘B' lands. All trails and landings are rehabilitated and restocked immediately following logging and consequently there is no area reduction associated with these features. Table 5 indicates the area of unclassified roads in the TFL.
Table 5. Land base reductions for existing unclassified roads
TFL Block Total Area (ha)Total Netdown
Area (ha)
Fraser 25 0Homathko 67 0Kingcome 21 0
Total 112 0
2.4.2.3 Future Roads, Trails, and Landings
As the TFL has been completely roaded with Mainlines, Kruger products believes that 5 ha (0.2% of the THLB) is an appropriate area to apply for future roads, trails, and landings. In block roads widths are narrower than the spacing of plantation trees so no area reductions are expected from these roads.
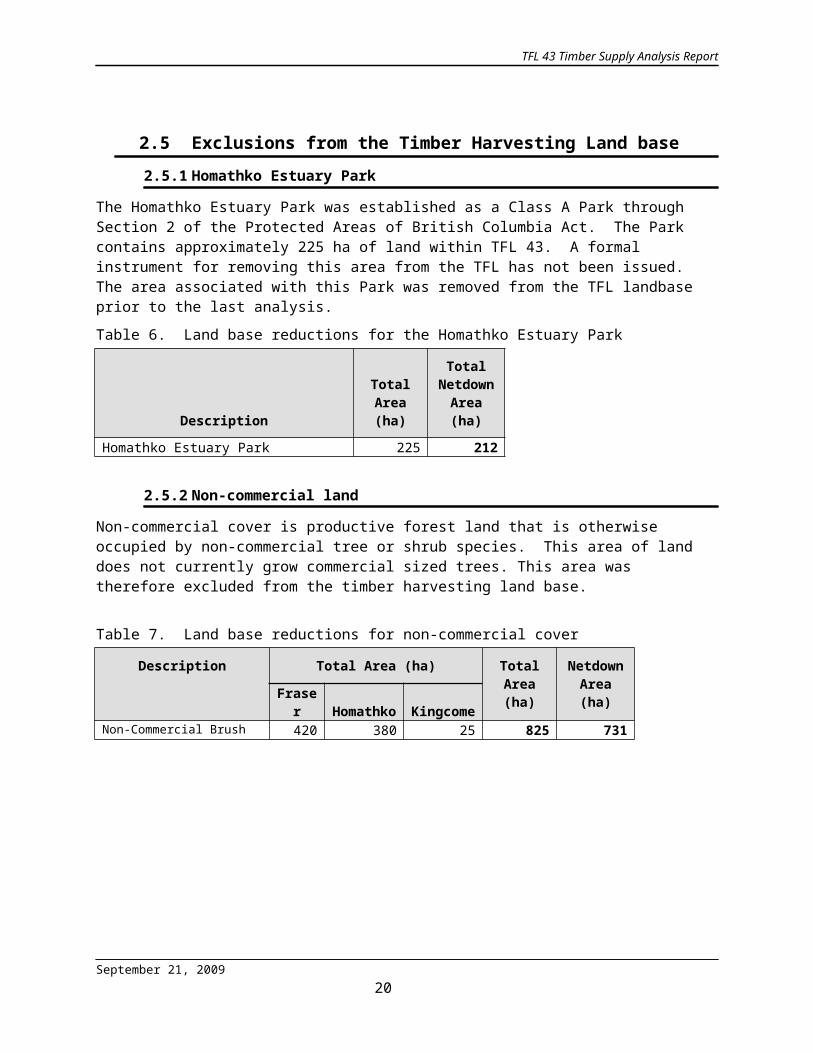
2.5 Exclusions from the Timber Harvesting Land base2.5.1Homathko Estuary Park
The Homathko Estuary Park was established as a Class A Park through Section 2 of the Protected Areas of British Columbia Act. The Park contains approximately 225 ha of land within TFL 43. A formal instrument for removing this area from the TFL has not been issued. The area associated with this Park was removed from the TFL landbase prior to the last analysis.
Table 6. Land base reductions for the Homathko Estuary Park
DescriptionTotal
Area (ha)
Total Netdown Area (ha)
Homathko Estuary Park 225 212
2.5.2Non-commercial land
Non-commercial cover is productive forest land that is otherwise occupied by non-commercial tree or shrub species. This area of land does not currently grow commercial sized trees. This area was therefore excluded from the timber harvesting land base.
Table 7. Land base reductions for non-commercial cover
Description Total Area (ha) Total Area (ha)
Netdown Area (ha)Frase
r Homathko KingcomeNon-Commercial Brush 420 380 25 825 731
September 21, 200917
TFL 43 Timber Supply Analysis Report
2.5.3Inoperable/inaccessible
There are two categories of inoperable areas defined within the forest inventory. The first category strictly relates to the area being physically inaccessible and thus not available for timber harvesting. The second category uses an economic criterion to determine operability. In the latter case, timber harvesting is not justifiable given the costs of harvesting and the expected value of the timber. Table 8 provides information on the area in the TFL which is classified as inoperable. The majority of this area is in the Homathko Block of TFL 43.
A large portion of the area between the Jewakwa River and Heakamie River drainages is classified as Economically Inoperable (EI). This area was classified as EI during the last MP as a result of the high costs associated with bridge crossings to access low value / low quality timber. If in the future suitable cost-sharing agreements are negotiated with other resource users in the area, the economic viability of harvesting would be greatly enhanced. At this time, Kruger Products considers it appropriate to maintain this strategy of removing the area from the timber harvesting land base. In the event significant improvements are realized in the market value of this timber, a bridge crossing would become a more economically viable option. Kruger Products will pursue future opportunities that would result in the re-inclusion of this area into the THLB of TFL 43.
Table 8. Land base reductions for inoperable areas
Description Total Area (ha) Total Area (ha)
Netdown Area (ha)Fraser Homathko Kingcome
I - Physically Inoperable 50 264 67 381 381EI - Economically Inoperable 0 579 0 579 579
Total 50 843 67 960 960
2.5.4Environmentally sensitive areas
Throughout the history of TFL 43 specific areas have been designated as Environmentally Sensitive Area (ESA). This ESA designation was developed and applied to areas of the land base which exhibited a number of valuable habitat characteristics for both fish and wildlife. The two categories of ESA utilized in past TSR were ESA1 and ESA 2. ESA1 areas for all practical purposes were netted down 100 %. ESA2 areas were netted down 50 %. This resulted in a reduction to the THLB and a spatial accounting of this valuable habitat. Our approach in this analysis has changed slightly in some areas of the TFL as a result of the various planning processes undertaken by Government since our last analysis.
Fraser BlockThe application of ESA to the Fraser portion of TFL 43 has not changed. The current designations will continue to protect valuable fish habitat and Bald Eagle nesting habitat wherever designated in the inventory. Slight changes may occur as a result of our land base conversion to a true GIS compatible inventory system.
Homathko BlockThe most dramatic changes to ESA designated lands since the last analysis has occurred in the Homathko block of TFL 43. Areas designated as ESA 1 for Wildlife to address habitat values for both Marbled Murrelet and Grizzly Bears have changed as a result of the completion of
September 21, 200918
TFL 43 Timber Supply Analysis Report
Government driven land use planning processes within the Homathko Valley. The preservation of valuable habitat features for both these species has been addressed through the creation of a number of Old Growth Management Areas (OGMA) and Wildlife Habitat Areas (WHA) throughout the Homathko Block of TFL 43. Although this has had little effect on the fisheries ESA in the valley a large percentage of the land base designated as ESA 1 for Wildlife has been reclassified without this designation.
Kingcome RiverNo changes to the ESA designations have occurred in the Kingcome portion of TFL 43 since the last analysis. Other than the completion of the Central Coast Land and Resource Management Plan, of which TFL 43 is exempt, no other similar land us planning process have been completed which would lead us to change the current ESA designations for either fish or wildlife.
Although extensive areas of moderately sensitive recreation areas have been identified by the recreation inventory due to fisheries and wildlife related activities, only a small portion has been given an ESA designation. This is due to the fact that recreational use in the Fraser Block is dispersed and is generally confined to non-forested areas (sand and gravel bars within the floodplain). A vast majority of this area is included in sensitive fisheries (riparian) and wildlife areas which have already been removed from the productive forest land base. Furthermore, much of the recreationally valuable area in the Kingcome and Homathko Blocks is remote and largely inaccessible therefore no recreation ESA designations have been applied.
Table 9. Land base reductions for Environmentally Sensitive Areas
ESA Category
ESA Description Total Area (ha) Total Area (ha)
% Reductio
n
Netdown Area (ha)
Fraser HomathkoKingcom
e
EF1
Fisheries Sensitive Zone (high) 0 5 297 303 100 394
EW1
Wildlife Sensitive Zone (high) 0 0 656 656 100 3
EF1W1
Fisheries Sensitive Zone (high) Wildlife Sensitive Zone (high) 0 0 189 189 100 217
EW1R2
Wildlife Sensitive Zone (high) Recreation (moderate) 0 0 0 0 100 6
EF1W2
Fisheries Sensitive Zone (high) Wildlife Sensitive Zone (moderate) 0 0 14 14 100 14
SubtotalAll ESAI Designated Areas 0 5 1,156 1,162 634
EF2
Fisheries Sensitive Zone (moderate) 0 61 0 61 0
SubtotalAll ESA2 Designated Areas 0 61 0 61 50 0
TotalAll ESA Designated Areas 0 67 1,156 1,223 634
September 21, 200919

TFL 43 Timber Supply Analysis Report
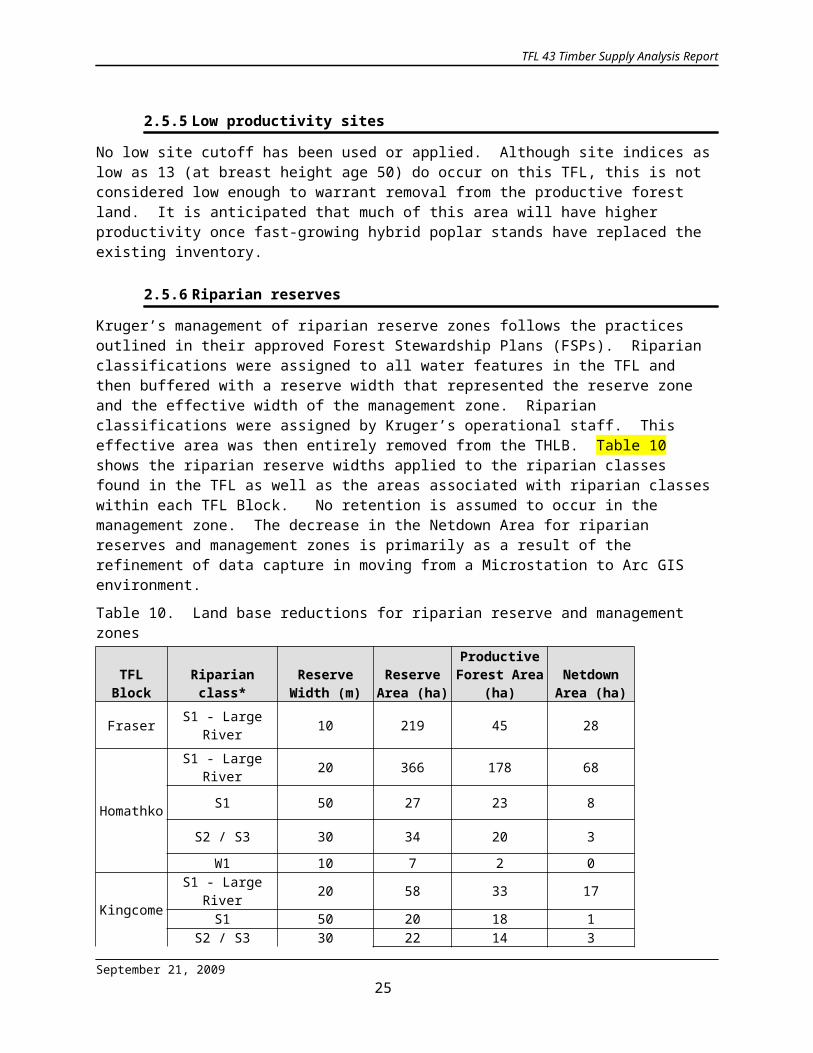
2.5.5Low productivity sites
No low site cutoff has been used or applied. Although site indices as low as 13 (at breast height age 50) do occur on this TFL, this is not considered low enough to warrant removal from the productive forest land. It is anticipated that much of this area will have higher productivity once fast-growing hybrid poplar stands have replaced the existing inventory.
2.5.6Riparian reserves
Kruger’s management of riparian reserve zones follows the practices outlined in their approved Forest Stewardship Plans (FSPs). Riparian classifications were assigned to all water features in the TFL and then buffered with a reserve width that represented the reserve zone and the effective width of the management zone. Riparian classifications were assigned by Kruger’s operational staff. This effective area was then entirely removed from the THLB. Table 10 shows the riparian reserve widths applied to the riparian classes found in the TFL as well as the areas associated with riparian classes within each TFL Block. No retention is assumed to occur in the management zone. The decrease in the Netdown Area for riparian reserves and management zones is primarily as a result of the refinement of data capture in moving from a Microstation to Arc GIS environment.
Table 10. Land base reductions for riparian reserve and management zones
TFL Block Riparian class*Reserve
Width (m)Reserve Area (ha)
Productive Forest Area
(ha)Netdown Area (ha)
Fraser S1 - Large River 10 219 45 28
Homathko
S1 - Large River 20 366 178 68
S1 50 27 23 8
S2 / S3 30 34 20 3
W1 10 7 2 0
KingcomeS1 - Large River 20 58 33 17
S1 50 20 18 1S2 / S3 30 22 14 3
Total 751 333 128 * Stream classes are as defined in the FPPR Sec. 47-49.
2.5.7Wildlife Habitat Areas – Grizzly
The provincial Identified Wildlife Management Strategy provides for the creation of wildlife habitat areas (WHAs), to protect key habitat features of listed wildlife species. Since the last TSR, a series of Grizzly Bear WHA have been spatially established within the Homathko portion of TFL 43. The area associated with the creation of these WHA in Homathko River has been excluded from the timber harvesting land base.
September 21, 200920
TFL 43 Timber Supply Analysis Report
Table 11. Land base reductions for Identified Wildlife
Description Total Area (ha) Total Area (ha)
Netdown Area (ha)Fraser Homathko Kingcome
Grizzly Bear WHA 0 828 0 828 97
2.5.8Old Growth Management Areas
Old Growth Management Areas( OGMA ) are spatially defined across the land base to maintain or recruit old growth ecosystem values. Where they were established, they were done so through the Landscape Unit Planning process initiated by Government prior to the last analysis.
2.5.8.1 Fraser River Block
There have been no OGMA established in the Fraser Valley South Landscape Unit that would require a reduction to the land base or THLB of TFL 43. Continuing operations in the Fraser portion of TFL 43 will be guided by the Provincial Non-Spatial Old Growth Order which was effective June 30th 2004.
2.5.8.2 Homathko River Block
Landscape Unit Planning and the creation of a series of OGMA in Homathko River portion of TFL 43 was completed as of September 20 2001. Efforts were made to include forested stands adjacent to high value feeding sites within OGMA wherever possible to maximize the overlap between old growth representation and specific wildlife habitat requirements‡. The establishment of these OGMA in the Homathko portion of TL 43 resulted in a 26 ha reduction of the THLB
2.5.8.3 Kingcome River Block
There have been no OGMA established in the Lower or Upper Kingcome Landscape Units that would require a reduction to the land base or THLB of TFL 43. Continuing operations in the Kingcome portion of TFL 43 will be guided by the Provincial Non-Spatial Old Growth Order which was effective June 30th 2004.
Table 12. Land base reductions for Spatial OGMA's in TFL: 43.
Description Total Area (ha) Total Area (ha)
Netdown Area (ha)Fraser Homathko Kingcome
Old Growth Management Areas 0 195 0 195 16
2.5.9Cultural Heritage Resources
No reductions have been made to the THLB for cultural heritage resources in the TFL. Archaeological impact assessments conducted to date on several cutblocks within the Fraser Block have not revealed any significant cultural heritage values. The dynamic nature of the flood plains along with extensive history of managing some of these areas has guided the decision not to make specific reductions for cultural heritage resources through the TSR
‡ Pg 7, Homathko Landscape Unit Plan, September 27th 2001
September 21, 200921
TFL 43 Timber Supply Analysis Report
process. Operationally Kruger Products Limited continues to explore avenues by which we could acquire site specific cultural heritage information.
2.6 Non Recoverable LossesNo reductions have been made to the TFL land base as a result of non-recoverable losses. This would include the effects of fire, insect damage or erosion. Although a small amount of erosion has occurred throughout the TFL since the last analysis it represents an insignificant amount of the overall THLB.
2.7 Rotation LengthsRotation length is a critical driver of an area-based timber supply analysis. Rotation lengths are a combination of the regeneration delay (the time it takes to establish a commercial crop of trees after harvest) and the time it takes to achieve a defined set of merchantability requirements after a commercial crop is established (i.e. harvest age). For example, in the previous management plan, a rotation age of 26 years was used for the Fraser Block (harvest age of 25 years and regeneration delay of 1 year).
Several sources of information were considered in the determination of rotation lengths for this Timber Supply Analysis. This section provides detail as to how rotation lengths were determined for this analysis.
2.7.1Merchantability Criteria
From Kruger’s perspective, a merchantable stand is one that has achieved an average diameter at breast height (DBH) of between 30 and 35 cm at a utilization level of 12.5cm DBH. Although height and fiber brightness are important characteristics of our stands, they are not as important as the average diameter.
2.7.2Regeneration Delays
In the previous Timber Supply Analysis for TFL 43, the regeneration delay for the Fraser and Homathko / Kingcome blocks was set at 1 and 3 years accordingly
Current practices in the Fraser block of TFL 43 virtually eliminate the need to invoke a regeneration delay at all. Harvesting in the Fraser is limited to the winter and spring months as a result of limited access. Harvesting which is limited to the last and first three months of any one year with planting in March eliminates the need to incorporate a regeneration delay.
The same practices hold true for both the Homathko and Kingcome River blocks of the TFL. Although a 3 year regeneration delay was utilized in the last analysis it in no way represents current management practices. A review of silviculture activities since the last analysis clearly indicates a more appropriate regeneration delay for these areas is 1 year is more reflective of current practices. It is in the best interest of the company economically to establish a new plantation as soon after harvesting as possible. Hybrid Poplar is susceptible to competition which a 3 year regeneration delay would exacerbate.
2.7.3Espacement Trial
September 21, 200922

TFL 43 Timber Supply Analysis Report
In 1987, an espacement trial was established at the Harrison Mills Nursery which is located adjacent to the Fraser Block. The site index for this site is estimated to be 45m and is considered representative of average conditions in the Fraser Block. Four clones were tested at 5 different spacing distances (3.6m, 3.9m, 4.2m, 4.5m, and 4.8m). In 1987, thirty two whips were planted for each clone and spacing combination for a total of 640 trees. Height and diameter at breast height (DBH) measurements were recorded every year starting in 1991 all the way through to 2008.
Operationally, Kruger typically uses a 4.5m spacing (approximately 500 stems per hectare) so for the purposes of this analysis, the trial data was limited to this subset of the data (sample size = ~128 trees). Figure 15 shows the average DBH over time for the 4 clones planted at this density. There is very little variation between the clones. This growth trend indicates that an average DBH of 35 cm will be achieved at an age of 24-25 years old. Thus a rotation length of 26 years for the Fraser block appears reasonable (25 years age to rotation plus 1 year regeneration delay).
0
5
10
15
20
25
30
35
40
1 2 3 4 5 6 7 8 9 10 11 12 13 14 15 16 17 18 19 20 21 22
Age
DB
H (c
m)
Figure 15. Average Diameter Breast Height (cm) for 4 clones planted at the Harrison Mill Nursery Espacement Trial established in 1987 with 4.5m x 4.5m spacing.§
The site index for this espacement trial site has been estimated to be 45m, similar to the weighted average site index of the THLB on the Fraser Block (44.1m). If the weighted average site index of the Homathko and Kingcome blocks is used to proportionally adjust the harvest age, these blocks would have ages of 31 and 29 years respectively (Table 13). This assumes that all things besides site index are equal (i.e. similar management practices) and diameter changes linearly with age.
§ Red dotted segment in figure indicate years where no data was collected or available and interpolation between data points was made.
September 21, 200923
TFL 43 Timber Supply Analysis Report
Table 13. Inferred harvest ages based on Fraser Block results and average site indices.
Block
Area Weighted Average Site Index on the
THLBApproximate Harvest Age Notes
Fraser 44.1 25 Espacement trial results Homathko 34.0 31 Inferred as a ratio of SI differenceKingcome 36.4 29 Inferred as a ratio of SI difference
2.7.4Permanent Sample Plot Data
Since the last TSR, several new Permanent Sample Plots (PSPs) have been established and several older PSPs have been re-measured. PSP data is stored on Kruger’s behalf by the MFR Forest Analysis and Inventory Branch and they provided compiled plot data for this project in June 2009. PSP information is presented here to help support rotation lengths.
Two types of PSP plots have been established in the TFL: type ‘T’ plots are established in stands influenced by silviculture and type ‘G’ plots are established in natural stands, unaffected by silvicultural practice (i.e. they have not been harvested previously). Type T plots consist of managed hybrid popular stands and thus are similar to the stands we are attempting to establish rotation lengths for so only these plots were assessed.
2.7.4.1 PSPs associated with Historic Management Practices
PSPs established prior to 1998 have a longer measurement history associated with them, making it easier to investigate diameter increment trends. However, these plots are also associated with older management practices. Plantations established prior to 1998 were planted at higher planting densities and natural ingress was not as strictly controlled.
In total 6 of these older type ‘T’ PSPs were assessed from the Fraser Block. The average site index for these six plots is very close to the average site of the THLB area within the Fraser Block (45.4 m average for PSP vs. 44.1 m average for Fraser THLB area). The PSP plot data was filtered to cottonwood (hybrid poplar) and reported at the 12.5 cm utilization level.
The average total stand density including all species and utilization levels at 20 years old for the 6 plots was approximately 980 sph, ranging from 564 sph to 1640 sph. For these older PSPs, it is necessary to look at total stand density since ingress has not been controlled and higher densities will result in a reduced diameter increment. Thus, it is expected that these plots will tend to show slower diameter growth and longer time periods to achieve the minimum diameter targets than stands established under current practices.
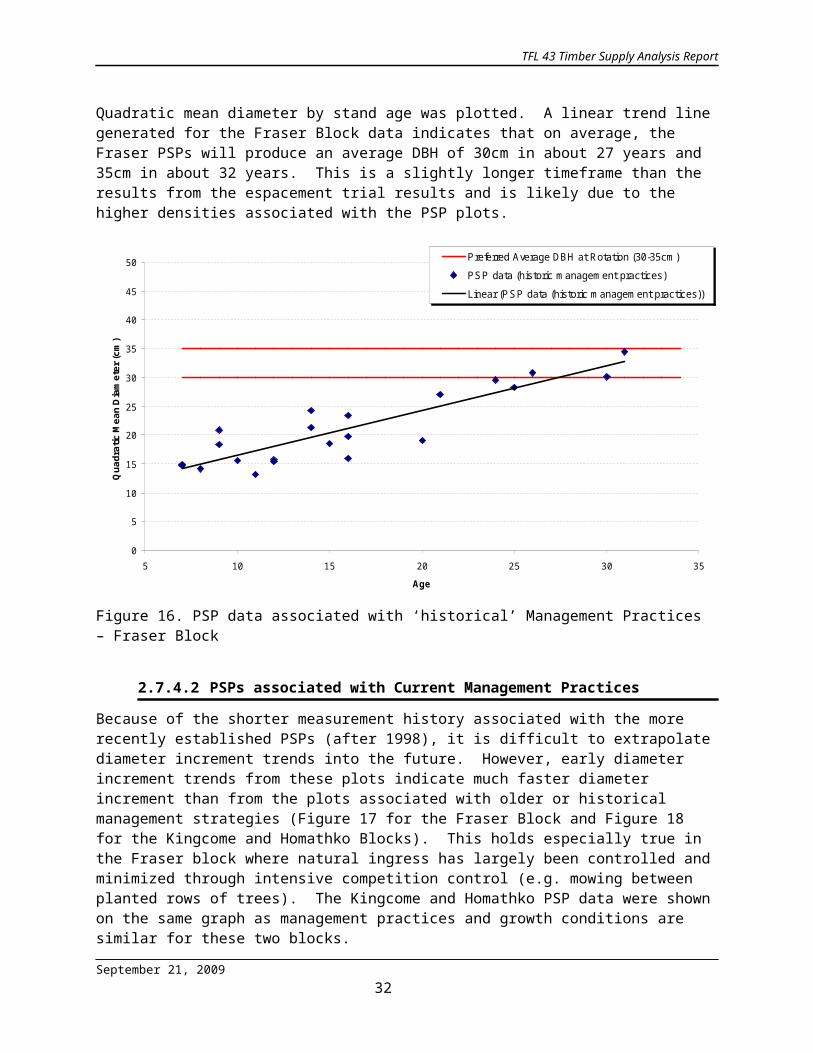
Quadratic mean diameter by stand age was plotted. A linear trend line generated for the Fraser Block data indicates that on average, the Fraser PSPs will produce an average DBH of 30cm in about 27 years and 35cm in about 32 years. This is a slightly longer timeframe than the results from the espacement trial results and is likely due to the higher densities associated with the PSP plots.
September 21, 200924

TFL 43 Timber Supply Analysis Report
0
5
10
15
20
25
30
35
40
45
50
5 10 15 20 25 30 35
Age
Qua
drat
ic M
ean
Dia
met
er (c
m)
Preferred Average DBH at Rotation (30-35cm)
PSP data (historic management practices)
Linear (PSP data (historic management practices))
Figure 16. PSP data associated with ‘historical’ Management Practices – Fraser Block
2.7.4.2 PSPs associated with Current Management Practices
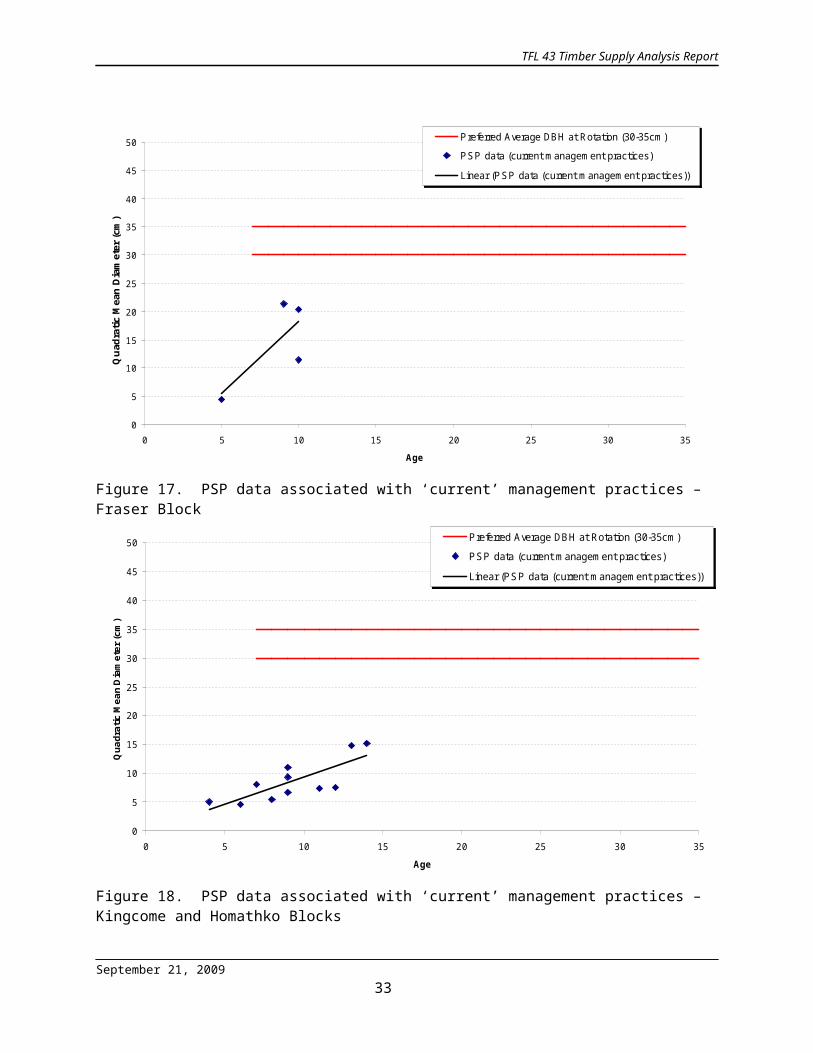
Because of the shorter measurement history associated with the more recently established PSPs (after 1998), it is difficult to extrapolate diameter increment trends into the future. However, early diameter increment trends from these plots indicate much faster diameter increment than from the plots associated with older or historical management strategies (Figure 17 for the Fraser Block and Figure 18 for the Kingcome and Homathko Blocks). This holds especially true in the Fraser block where natural ingress has largely been controlled and minimized through intensive competition control (e.g. mowing between planted rows of trees). The Kingcome and Homathko PSP data were shown on the same graph as management practices and growth conditions are similar for these two blocks.
September 21, 200925

TFL 43 Timber Supply Analysis Report
0
5
10
15
20
25
30
35
40
45
50
0 5 10 15 20 25 30 35
Age
Qua
drat
ic M
ean
Dia
met
er (c
m)
Preferred Average DBH at Rotation (30-35cm)
PSP data (current management practices)
Linear (PSP data (current management practices))
Figure 17. PSP data associated with ‘current’ management practices – Fraser Block
0
5
10
15
20
25
30
35
40
45
50
0 5 10 15 20 25 30 35
Age
Qua
drat
ic M
ean
Dia
met
er (c
m)
Preferred Average DBH at Rotation (30-35cm)
PSP data (current management practices)
Linear (PSP data (current management practices))
Figure 18. PSP data associated with ‘current’ management practices – Kingcome and Homathko Blocks
September 21, 200926
TFL 43 Timber Supply Analysis Report
2.7.5Kruger’s Operational Experience
The process of modeling the land base through the application of specific utilization criteria presents a sanitized approach as to how we manage the THLB of TFL 43. For example, although we’ve used an average stand diameter of between 30 and 35 cm in our modeling, in reality it’s not uncommon for us to operate in stands from the 25 to 30 cm DBH class. Activities on the TFL are strongly influenced by logistical and environmental factors such that when an area becomes available to harvest we are typically very flexible at to stand attribute characteristics.
Cheam Island in the Fraser portion of TFL 43 was available to harvest as a direct result of the construction of a bridge associated with gravel extraction activities. This represents an example of a logistically driven harvest that may not have been harvested today had the bridge not been built.
The point of this section is to point out that harvesting activities, stand selection and harvest criteria are influenced by a variety of outside sources and that considerable variability exists between what is modeled and operational realities.
2.7.6Selected Rotation Lengths
Based on Kruger espacement trial and PSP data presented above, and achieving a preferred stand diameter of 30-35cm dbh at a 12.5cm utilization level, the following rotation lengths will be used in this analysis:
Table 14. Selected Rotation Lengths for Timber Supply Analysis
BlockApproximate Harvest Age +
Regeneration delay = Rotation length
Fraser 25 + 1 = 26Homathko 31 + 1 = 32Kingcome 30 + 1 = 31
These rotation lengths were largely influenced by Kruger espacement trial data presented in Section 2.7.3. This data has the longest measurement history and best reflects current management practices (i.e. planting density of ~500 sph and intensive density management). PSP information associated with older management practices suggest slightly longer rotation ages however, these plots are associated with historical management practices no longer implemented (i.e. higher initial planting densities with no subsequent density management).
2.8 Integrated Resource ManagementIntegrated resource management (IRM) objectives are typically represented in timber supply models through forest cover requirements. Due to the nature of the area-based Allowable Annual Cut calculation, no forest cover requirements have been established for TFL 43. Instead a combination of land base reductions and operational cutblock scheduling were used to fulfil the necessary forest cover requirements. A part of this decision is based on the knowledge that a substantial area – approximately 2,625 ha or 41% of the productive land base – is already withdrawn from the timber harvesting land base to provide riparian, fisheries and wildlife habitat requirements along with the protection of environmentally sensitive areas and other protected
September 21, 200927
TFL 43 Timber Supply Analysis Report
areas. The following sections describe the IRM issues present on the TFL and Kruger’s approach to addressing them.
2.9 Green-up/adjacency
A green-up height of 3 meters will be used for both timber supply and operational purposes. Although this height will not be used for area based timber supply purposes, it will be incorporated into operational planning through cutblock scheduling to ensure fulfillment of this height requirement. Harvesting of adjacent cutblocks will proceed once harvested cutblocks have reached 3 metres in height and achieved the required stocking and block coverage as specified in the Operational Planning Regulations. This height, stocking and, block coverage is normally achieved at the age of 3 years by stands of hybrid poplar/cottonwood in TFL 43.
2.10 Visual resources
Fraser Block
Of the three blocks which make up TFL 43 only the Fraser block is considered visually sensitive and it is the only block with established VQOs. On the other hand, the landscape includes large scale agriculture, utility and highway corridors, gravel and sand bars and residential development which all contribute to a highly altered landscape. For this analysis, as with the last, no downward adjustments have been made to the landbase in the Fraser to account for any visually sensitive concerns.
Homathko Block
The isolated nature of the area along with it’s valley bottom features (flat) and rapid green-up post harvest has negated the requirement to consider the visual resource in the area. There are no established VQO for the Homathko River portion of TFL 43 and no net downs to the land base in this analysis.
Kingcome Block
The isolated nature of the area along with it’s valley bottom features (flat) and rapid green-up post harvest has negated the requirement to consider the visual resource in the area. There are no established VQO for the Kingcome River portion of TFL 43 and no net downs to the land base in this analysis.
2.11 Wildlife – Grizzly Bear
Homathko Block
On December 4th 2006 the Deputy Minister of Environment established a series of Grizzly Bear Wildlife Habitat Areas (WHA) within the Homathko Block of TFL 43. These WHA were established via the Government Actions Regulation ( BC Reg 582/04 ) and brought to a close the Identified Wildlife Management Strategy (IWMS) for the area. The area associated with these newly created Grizzly Bear WHAs has been removed from TFL 43 land base for this analysis (Section 2.5.7).
September 21, 200928

TFL 43 Timber Supply Analysis Report
Kingcome Block
WHA for Grizzly Bears have not been established for the Kingcome block of TFL 43 as part of the completion of governments IWMS. No spatial reductions have been made in this analysis. It should be noted that a significant portion of the land base of TFL 43 in Kingcome River is reserved from harvesting (45 %). These reserved areas represent a variety of functional habitats spread throughout the landbase of TFL 43 in Kingcome River.
2.12 Biodiversity
Biodiversity is managed at both landscape and stand levels. The primary mechanism for landscape-level management is retention of old and mature seral forest. Stand-level biodiversity is protected through retention of wildlife trees and wildlife patches. The following sections outline how retention of old and mature forest are addressed in this analysis.
2.12.1 Landscape-level biodiversity
A Legal Order issued June 30th, 2004 established Non-Spatial Old Growth Objectives for the Province. In areas where Landscape Unit Planning (LUP) is not yet complete this Order is used to address biodiversity issues in the Landscape Unit in which a licence has operations. Once the LUP process is complete in an established Landscape Unit, and OGMA have been spatially established the original Legal Order is no longer applicable to the area.
Fraser Block
It has been recognized by various government agencies over the years that the highly altered nature of the islands associated with the Fraser block of TFL 43 could not provide adequate area at the landscape level to satisfy the current Old Growth Order or LUP process. No OGMA have been established to date in the Fraser Valley South Landscape Unit that would require reductions to the land base for this analysis
Homathko Block
Landscape Unit Planning (LUP) and the establishment of a series of Old Growth Management Area (OGMA) was completed on September 27th 2001. As such the provincial Non-Spatial Old Growth Order issued June 30th 2004 has no relevance in the Homathko Block of TFL 43. The spatial establishment of OGMA in the Homathko block of TFL 43 has satisfied all future landscape level biodiversity requirements. For this analysis the area associated with these OGMA has been netted out of the land base Kingcome River
A significant portion of the land base within the Kingcome block of TFL 43 has been reserved from harvesting (upwards of 45 %). Throughout the Kingcome block these reserved areas represents a wide range of biologically diverse landscapes, which by default, satisfy the current requirements of the provincial Non-Spatial Old Growth Order. As such, no additional area net downs have been made to the Kingcome block of TFL 43 .
September 21, 200929

TFL 43 Timber Supply Analysis Report
2.12.2 Stand-level biodiversity — Wildlife Tree Retention
Wildlife Tree Retention (WTR) is one of the primary methods of addressing stand level biodiversity objectives. Kruger Products has an extensive history of retaining wildlife trees within the riparian areas as part of normal management practices.
Fraser Block
In the Fraser Block, the Ministry of Environment has exempted the company from fulfilling Wildlife Tree Patch requirements on areas previously planted with hybrid poplar. The objective is to ensure that WTR requirements are met within the natural cottonwood stands in this block of the TFL. With the exception of a few stands, natural cottonwood is found mainly on the smaller islands within this block. A number of these stands have been declared as inoperable and reserved from harvesting. For the operable natural cottonwood stands -approximately 35% of the operable land base - riparian reserves will largely fulfill WTR requirements. Thus, within this block 100% of the WTR requirements will be satisfied through constrained areas.
Homathko Block
Stand level biodiversity in the Homathko block follows Objective # 2 in the Homathko Landscape Unit Plan dated September 27th 2001. As with the provincial Non-Spatial Old Growth Order this Objective establishes Wildlife Tree Retention rates by BEC Subzones. Stand-level biodiversity requirements in Homathko River are captured through Riparian Reserves associated with cut blocks and other net downs to the overall land base. Over 48 percent of the Total Productive Forest is reserved from harvesting which for the size of the landbase is more than enough to satisfy Objective 2 of the Homathko Landscape Unit Plan. No additional net downs to address this issue have been incorporated into this analysis.
Kingcome River
The existing 30 percent reduction to the Kingcome THLB and 45 percent reduction to the Gross Area represent more than enough area to satisfy the legal requirements associated with the provincial Old Growth Order. As with landscape –level biodiversity in Kingcome River no additional area has been removed from the Kingcome landbase in this analysis to address the issue of stand-level biodiversity.
2.13 Changes from MP4Since the last management plan review for the TFL, several input datasets and assumptions have changed and they are summarized here.
Differences that affect the THLB Definition include:- CAD based Forest Cover converted to ArcGIS Format, updated for depletions with
RESULTS data. Ages have been projected forward and are now current to 2009 – although volumes were not re-projected (not used here).
- OGMA’s removed for the Sunshine Coast TSA.- Grizzly Bear Wildlife Habitat Areas (2-072, 2-208, 2-210, 2-213, 2-214, 2-298) removed
– all in the Homathko block- Operability Reviewed – minor changes where areas previously classes as inoperable
have been harvested.- Some changes to ESA as a result of Grizzly WHAs
September 21, 200930

TFL 43 Timber Supply Analysis Report
- Fully spatial riparian reserves were developed by buffering streams/rivers. - Wildlife ESA’s in Homathko and Kingcome were dropped in favor of using established
WHA’s.- Updates to the landbase to account for erosion and accretion since the last analysis.
Other differences include:- MP4 conducted a volume-based analysis for the Fraser block. This analysis has been
entirely conducted as an area-based analysis. MoFR did not request a supplemental volume based analysis.
- The Regeneration delay for the Homathko and Kingcome block has been decreased from 3 years to 1 years to reflect current management practices.
- The harvest age for the Homathko block has been increased by 1 year recognizing the slightly lower Site Indexes in this block compared to the Kingcome Block.
- The changes in regeneration delays and harvest age result in a rotation length for the Fraser, Kingcome, and Homathko Block is now 26, 31, and 32 years, respectively.
September 21, 200931

TFL 43 Timber Supply Analysis Report
3.0 Timber Supply Analysis ResultsAs a result of the changes in the landbase definition and rotation lengths, the allowable annual cut (AAC) has been re-calculated. The following sections show these calculations for each block. A summary of these calculations is provided in Section 3.4.
3.1 Fraser Block Harvest Level and Proposed AAC Calculation
Table 15. Timber harvesting land base area netdown summary - Fraser Block
Effective Netdown Area (ha) Total
Effective Netdown Area (ha)
Schedule 'A'
Schedule 'B'
Gross Area 1,195 2,361 3,556
Less Non-forest / Non-productive forest / Non-TFL 459 1438 1897Existing roads, trails and landings 0 0 0
Total Productive Forest 736 924 1,660Less:
Protected Areas 0 0 0
Non-Commercial Land (NP BR) 92 307 399Inoperable/Inaccessible 8 42 50Environmentally Sensitive Area 1 5 9 15Environmentally Sensitive Area 2 0 0 0Low Productivity Sites 0 0 0Riparian Reserves 12 16 28Wildlife Habitat Areas - Grizzly 0 0 0Old Growth Management Areas 0 0 0Cultural heritage resources 0 0 0
Timber Harvesting Land Base –THLB (ha) 618 549 1,167Less Other Removals:
Estimate of Future Roads, Trails, and Landings (1%) 0 0 Effective Long-term THLB (ha) 618 549 1,167
Fraser Block proposed AAC = 1167.1 ha26 Year Rotation Length
= 44.9 hectares / year
September 21, 200932
TFL 43 Timber Supply Analysis Report
3.2 Homathko Block Harvest Level and Proposed AAC Calculation
Table 16. Timber harvesting land base area netdown summary - Homathko Block
Effective Netdown Area (ha)
Gross Area 5,661Less
Non-forest / Non-productive forest 1712Existing roads, trails and landings 71
Total Productive Forest 3,878Less:
Protected Areas 212Non-Commercial Land (NP BR) 307Inoperable/Inaccessible 843Environmentally Sensitive Area 1 491Environmentally Sensitive Area 2 0Low Productivity Sites 0Riparian Reserves 79Wildlife Habitat Areas - Grizzly 97Old Growth Management Areas 16Cultural heritage resources 0
Timber Harvesting Land Base –THLB (ha) 1,833Less Other Removals:
Estimate of Future Roads, Trails, and Landings (1%) 4Effective Long-term THLB (ha) 1,829
*All lands in the Homathko Block are Schedule ‘B’
Homathko Block proposed AAC = 1828.8 ha
32 Year Rotation Length
= 57.1 hectares / year
September 21, 200933
TFL 43 Timber Supply Analysis Report
3.3 Kingcome Block Harvest Level and Proposed AAC Calculation
Table 17. Timber harvesting land base area netdown summary - Kingcome Block
Effective Netdown Area (ha)
Gross Area 958Less
Non-forest / Non-productive forest 198Existing roads, trails and landings 21
Total Productive Forest 740Less:
Protected Areas 0Non-Commercial Land (NP BR) 25Inoperable/Inaccessible 67Environmentally Sensitive Area 1 137Environmentally Sensitive Area 2 0Low Productivity Sites 0Riparian Reserves 21Wildlife Habitat Areas - Grizzly 0Old Growth Management Areas 0Cultural heritage resources 0
Timber Harvesting Land Base –THLB (ha) 491Less Other Removals:
Estimate of Future Roads, Trails, and Landings (1%) 1Effective Long-term THLB (ha) 490
*All lands in the Kingcome Block are Schedule ‘B’
Kingcome Block proposed AAC = 489.8 ha
31 Year Rotation Length
= 15.8 hectares / year
September 21, 200934
TFL 43 Timber Supply Analysis Report
3.4 Total TFL AreaGiven the net THLB area calculations and the refined rotation lengths for this analysis, the Total TFL AAC is estimated to be 124.8 ha (Table 18). Volume equivalents were approximated by determining the average inventory stand yield (m³/ha) for stands currently > 30 years old and multiplying this value by the proposed area AAC. Since no attempt was made to project stand volumes since the last management plan, this volume equivalent is likely conservative (i.e. current inventory volumes would be slightly higher).
Table 18. Summary of proposed Allowable Annual Cut Calculations for TFL 43.
BlockRotation length
Schedule 'A' Schedule 'B' Total
Hectares / year
Approximate Volume
Equivalent (m³/year)
Hectares / year
Approximate Volume
Equivalent (m³/year)
Hectares / year
Approximate Volume
Equivalent (m³/year)
Fraser 26 23.8 6,831 21.1 6,055.7 44.9 12,886.3Homathko 32 57.1 18,957.2 57.1 18,957.2Kingcome 31 15.8 8,121.2 15.8 8,121.2Total 23.8 6,831 94 33,134.1 117.8 39,964.7
3.5 Sensitivity AnalysisIn an area based analysis, the two factors that impact the harvest levels are rotation lengths and the size of the timber harvesting land base. Both of these factors were adjusted to gauge the sensitivity of changes in these factors and are described below.
3.5.1Rotation Lengths
The base case scenario uses a rotation age of 26 years for the Fraser Block, 32 years for the Homathko block and 31 years for the Kingcome block. These planned rotation ages are based on the information and experience presented in Section 2.7. The effect of reducing and increasing the rotation by 2 years is shown below:
3.5.1.1 Sensitivity (-2 years)
Table 19. Sensitivity - Rotation length decreased by 2 years.
BlockRotation length
Schedule 'A' Schedule 'B' Total
Hectares / year
Approximate Volume
Equivalent (m³/year)
Hectares / year
Approximate Volume
Equivalent (m³/year)
Hectares / year
Approximate Volume
Equivalent (m³/year)
Fraser 24 25.8 7,405 22.9 6,572.3 48.7 13,976.9Homathko 30 60.9 20,218.8 60.9 20,218.8Kingcome 29 16.8 8,635.2 16.8 8,635.2Total 25.8 7,405 100.6 35,426.3 126.4 42,830.9
September 21, 200935

TFL 43 Timber Supply Analysis Report
3.5.1.2Sensitivity (+2 years)
Table 20. Sensitivity - Rotation length increase by 2 years.
BlockRotation length
Schedule 'A' Schedule 'B' Total
Hectares / year
Approximate Volume
Equivalent (m³/year)
Hectares / year
Approximate Volume
Equivalent (m³/year)
Hectares / year
Approximate Volume
Equivalent (m³/year)
Fraser 28 22.1 6,343 19.6 5,625.2 41.7 11,967.9Homathko 34 53.7 17,828.4 53.7 17,828.4Kingcome 33 14.8 7,607.2 14.8 7,607.2Total 22.1 6,343 88.1 31,060.8 110.2 37,403.5
3.5.2Size of the timber Harvesting Land Base (THLB)
Several factors that determine the size of the THLB have uncertainty around their definitions (e.g. operable area, problem types, low sites, impacts from trails and landings etc.). Different future market conditions or changes in harvesting or milling technology may also serve to reduce or expand the land base considered to be economical.
It is not known if the THLB used in this analysis is over or under-estimated, so two sensitivities have been completed. These scenarios decrease and increase the size of the THLB by 5% and the results are shown below:
3.5.2.1Sensitivity (THLB -5%)
Table 21. Sensitivity – THLB Area decreased by 5%.
BlockRotation length
Schedule 'A' Schedule 'B' Total
Hectares / year
Approximate Volume
Equivalent (m³/year)
Hectares / year
Approximate Volume
Equivalent (m³/year)
Hectares / year
Approximate Volume
Equivalent (m³/year)
Fraser 26 22.6 6,831 20.1 5,768.7 44.9 12,886.3Homathko 32 54.2 17,994.4 54.2 17,994.4Kingcome 31 15 7,710.0 15.0 7,710.0Total 22.6 6,831 89.3 31,473.1 114.1 38,303.7
3.5.2.2Sensitivity (THLB +5%)
Table 22. Sensitivity – THLB Area increased by 5%.
BlockRotation length
Schedule 'A' Schedule 'B' Total
Hectares / year
Approximate Volume
Equivalent (m³/year)
Hectares / year
Approximate Volume
Equivalent (m³/year)
Hectares / year
Approximate Volume
Equivalent (m³/year)
Fraser 26 25 7,175 22.2 7,370.4 47.2 14,545.4Homathko 32 60 19,920.0 60.0 19,920.0Kingcome 31 16.5 8,481.0 16.5 8,481.0Total 25 7,175 98.7 35,771.4 123.7 42,946.4
September 21, 200936

TFL 43 Timber Supply Analysis Report
3.6 Conclusions / Recommended Harvest LevelsThe total proposed harvest level for the TFL is 117.8 ha/year or 39,965 m3/yr. The current AAC of TFL 43 is 108.2 ha/year. The Base Case harvest level represents an increase of 9.6 ha/year or 8.9% in annual harvest area in comparison to the AAC for MP 4.
Kruger recommends the continuation of setting the Allowable Annual Cut on an area basis since the conversion process is still in progress and there is still relatively limited growth and yield information available for cottonwood/hybrid poplar. Table 1 shows the recommended annual harvest level for each of the three Blocks of the TFL.
Table 23. Recommend Harvest Levels (ha/year) for Management Plan 5
Block
Proposed AAC (ha/year)
Wtd. Avg.Volume/ha
(m³/ha)
Approximate Volume Equivalent of Proposed
AAC (m³/year)Fraser 44.9 287 12,886Homathko 57.1 332 18,957Kingcome 15.8 514 8,121
Total 117.8 39,965
September 21, 200937
TFL 43 Timber Supply Analysis Report
4.0 20 Year Plan
4.1 Introduction
A 20 year plan is a requirement within the tree farm licence management plan planning process. It provides a spatial illustration of the proposed harvest level in the base case scenario of the timber supply analysis.
4.2 Introduction In 5 year increments it shows where the projected harvest level in the base case timber
supply analysis is achieved while ensuring the defined management practices and harvesting constraints are satisfied.
Allows the public and agencies to identify areas of concerns that they may have regarding proposed development scenario.
Provide strategic guidance for future planning in each Block of the TFL.
4.3 Guidelines and ObjectivesThe objective is to validate the proposed harvest level in the base case of the timber supply analysis. The projected harvest levels represent one possible scenario for attaining the proposed harvest level.
The management practices and harvesting constraints applicable to the 20 year plan are as follows:
Ensure the requirements of the Forest and Range Practices Act are satisfied. Harvest the operable land within each Block of the TFL in accordance with the harvest
level in the base case scenario of the timber supply analysis. Minor areas of non-merch and sub-merch stands contiguous to proposed cutblocks may be harvested and subsequently converted to hybrid poplar plantations.
A separate 20 year plan summary table has been prepared for each Block of the TFL consistent with managing each Block as an individual operating unit.
Satisfy the requirements with respect to adjacency and green-up (the fast growing nature of hybrid poplar results in green-up in 3 years).
Ensure consistency with the netdowns used for Environmentally Sensitive Areas (ESAs) within the base case scenario of the timber supply analysis.
Harvest the profile of the available operable land base within each Block of the TFL. As a first priority the company will salvage harvest dead, damaged stands or stands at risk of erosion and this will be followed by older age stands within each Block. Moreover, the conversion of lower-value (merchantable) alder and coniferous stands will likely coincide with periods of favorable log market conditions.
The Wildlife Tree Retention requirements will be fulfilled through the utilization of the existing riparian reserves, inoperable areas and environmentally sensitive areas to a large extent.
Proposed block areas will exclude applicable riparian reserves.. In addition, the final block layout will ensure these areas are set aside during the operational planning stage.
September 21, 200938
TFL 43 Timber Supply Analysis Report
Blocks larger than 40 ha will be split during operational planning to ensure that not more than 40 ha is denuded at any time prior to green-up of the adjacent area.
The harvest areas for this plan are based on the following proposed allowable annual cut for each Block:
Fraser 44.9 ha/yearHomathko 57.1 ha/yearKingcome 15.8 ha/year
4.4 MapsThis plan has been streamlined with the need for separate 20 Year Plan maps eliminated. As a planning tool they are of little value to the 20 Year Plan itself. Our ability to store, manage and query data eliminates the need for this very expensive and time consuming exercise. A single series of updated colour themed maps have been produced that will be accompany and be available to reviewers of this plan.
4.5 Plan Discussion and ResultsThe plan lists the proposed harvest areas for each Block of the TFL in 4 five year periods.The proposed harvest area for each Block is based on the applicable rotation length and the long term timber harvesting land base. The rotation length used in the current analysis is 26 years for the Fraser Block (including 1 year regeneration delay) and 31 years for Kingcome and 32 years for the Homathko Block (including 1 year regeneration delay).
A specific silviculture system has not been identified with each block but clearcutting is the most appropriate and preferred system for hybrid poplar management. In actuality the management of these alluvial sites is such that riparian and/or wildlife reserves are commonly adjacent to the proposed blocks, and the decision regarding the placement and size of the reserves is appropriately made at the operational planning stage. In addition, Kruger has made an effort to retain advance coniferous regeneration if it does not interfere with regeneration objectives.
4.5.1Fraser Block
This area is managed at a very intense level because of it's proximity to the manufacturing facility, accessibility, favorable growing conditions, and historical use. The Fraser Block 20 year plan has been prepared using the proposed area-based allowable annual cut calculation as the company considers it to be the most appropriate method until more accurate growth and yield information is available and remaining areas are converted to high yielding poplar pulpwood plantations.
Figure 19 provides the current breakdown of the land base within this Block. The total area for this Block is 3,556 ha. Approximately 33% of the land base is designated as the long term timber harvesting land base and this amounts to 1,167 ha.
September 21, 200939
TFL 43 Timber Supply Analysis Report
Non-forest / Non-productive forest
55%
Timber Harvesting Land Base –THLB (ha)
33%
Environmentally Sensitive Area 1
0%
Inoperable/Inaccessible0%
Existing roads, trails and landings
0%
Non-Commercial Land (NP BR)
11%
Riparian Reserves1%
Figure 19. TFL 43 Fraser Block Land Base breakdown
The age class distribution of this available operable land base is shown in Figure 20. A significant proportion of the land base, about 41%, is made up of age classes older than the current planned rotation (26 years) for this Block. The leading species is cottonwood or hybrid poplar for all of stands within this Block.
0
20
40
60
80
100
120
140
160
180
200
0-5 6-10 11-15 16-20 21-25 26-30 31-40 41-60 61-80 81-100Age Class
Are
a (h
a)
AC/AX
Figure 20. TFL 43 Fraser Block THLB Age Class distribution
September 21, 200940
TFL 43 Timber Supply Analysis Report
Table 24 shows the 20 year plan harvest level by periods for the Fraser Block. The available operable land base within the Fraser Block consists of approximately 53% Schedule "A” lands and 47% Schedule "B" lands. The plan was prepared to harvest at a constant level using the harvest forecast in the base case scenario of the timber supply analysis. Essentially 4/5 (897 ha out of 1,167 total ha) of the available operable land base will be harvested during the plan given the 26 year rotation age. The projected volume has not been shown as it would be meaningless after the first period since these are young stands and volume changes are significant over five year periods. The plan has accommodated bald eagle nest sites through the removal of these areas from the timber harvesting land base.
Table 24. Fraser Block – 20 year plan harvest area summary
PeriodTotal
Area (ha)2010-2014 2242015-2019 2242020-2024 2202025-2029 223Total 891
Visual Landscape Management
The plan only dealt with polygons assigned Partial Retention (PR) visual quality objective (VQO) as these are considered the most important from a visual landscape management perspective. The visual quality objective of PR is applicable to approximately 91 ha of the operable available land base which amounts to 5% of the total productive land base. A number of these polygons are small islands (less than 25 ha) and it is impractical to adhere to the percent alteration limit of 15% due to operational considerations such as logistics of mobilizing equipment and achieving cost effectiveness. In these situations the whole island will be harvested in a single entry as it is found that the level topography combined with riparian reserves, highly modified surrounding landscape, sand and gravel bars, deciduous forest cover, and fast green-up mitigates the visual impact of the harvesting. This approach is consistent with current and past approved operational practices carried out on the TFL 43 Fraser Block.
4.5.2Homathko Block
The Homathko land base breakdown is shown in Figure 21. The total Block area is 5,661 ha. About 33% of the land base is classified as long term timber harvesting land base.
September 21, 200941

TFL 43 Timber Supply Analysis Report
Non-forest / Non-productive forest
30%
Existing roads, trails and landings
1%
Protected Areas4%
Non-Commercial Land (NC BR)5%Inoperable/Inaccessible
15%
Timber Harvesting Land Base –THLB (ha)
33%
Environmentally Sensitive Area 1
9%
Riparian Reserves1%
Wildlife Habitat Areas - Grizzly
2%
Old Grow th Management Areas
0%
Figure 21. TFL 43 Homathko Block Land Base breakdown
The total long term timber harvesting land base is 1,829 ha. The age class structure of this available operable land base by leading species is shown in Figure 22. The leading species in stands older than 121 years is dominated by conifers whereas 51 to 100 year old stands consisting mainly of cottonwood.
September 21, 200942

TFL 43 Timber Supply Analysis Report
0
50
100
150
200
250
300
350
400
450
500
0-5 6-10 11-15 16-20 21-25 26-30 31-40 41-60 61-80 81-100 101-120
121-140
141-250
Age Class
Are
a (h
a)ConiferOther Decid.DRAC/AX
Figure 22. TFL 43 Homathko Block THLB Age Class distribution
The harvest levels for this plan are shown in Table 25. The harvest levels are based on the proposed AAC of 57.1 ha for this Block. A further 3% reduction has been applied to the Timber Harvesting Land Base to account for Wildlife Tree Retention within cutblocks. It is assumed that 75% of stand level reserves will be met through existing constrained areas. The areas listed are net areas excluding reserves. A significant portion of this Block has been reserved from harvesting as shown in Figure 21.
The Homathko plan was prepared by using environmentally sensitive area (ESA's) netdown limits applied within the timber supply analysis. A total of 497 ha of productive forest classified as environmentally sensitive is reserved from harvesting within this plan. Although a 98% netdown has been applied to ESA1 areas in the timber supply analysis, it is expected that on a site specific basis his may vary from 90% to 100%. This arrangement was confirmed in the last analysis with the former Ministry of Environment, Lands and Parks to ensure that critical wildlife habitat polygons are reserved from harvesting while providing flexibility in less critical areas for Kruger products to carry out minor boundary refinements during cutblock layout and engineering.
Table 25. Homathko Block – 20 year plan harvest area summaryPeriod Area (ha)
2010-2014 2942015-2019 2872020-2024 2842025-2029 287Total 1152
September 21, 200943

TFL 43 Timber Supply Analysis Report
4.5.3Kingcome Block
The total land base breakdown is shown in Figure 23. The total area of this Block is only 958 ha. The long term timber harvesting land base is approximately 51% of this total area.
Non-forest / Non-productive forest
21%
Existing roads, trails and landings
2%
Non-Commercial Land (NC BR)
3%
Environmentally Sensitive Area 1
14%Riparian Reserves2%
Timber Harvesting Land Base –THLB (ha)
51%Inoperable/Inaccessible
7%
Figure 23. TFL 43 Kingcome Block Land Base breakdown
The age class structure of the long term timber harvesting land base of 490 ha is shown is Figure 24. The older age classes generally consist of conifers as leading species.
September 21, 200944
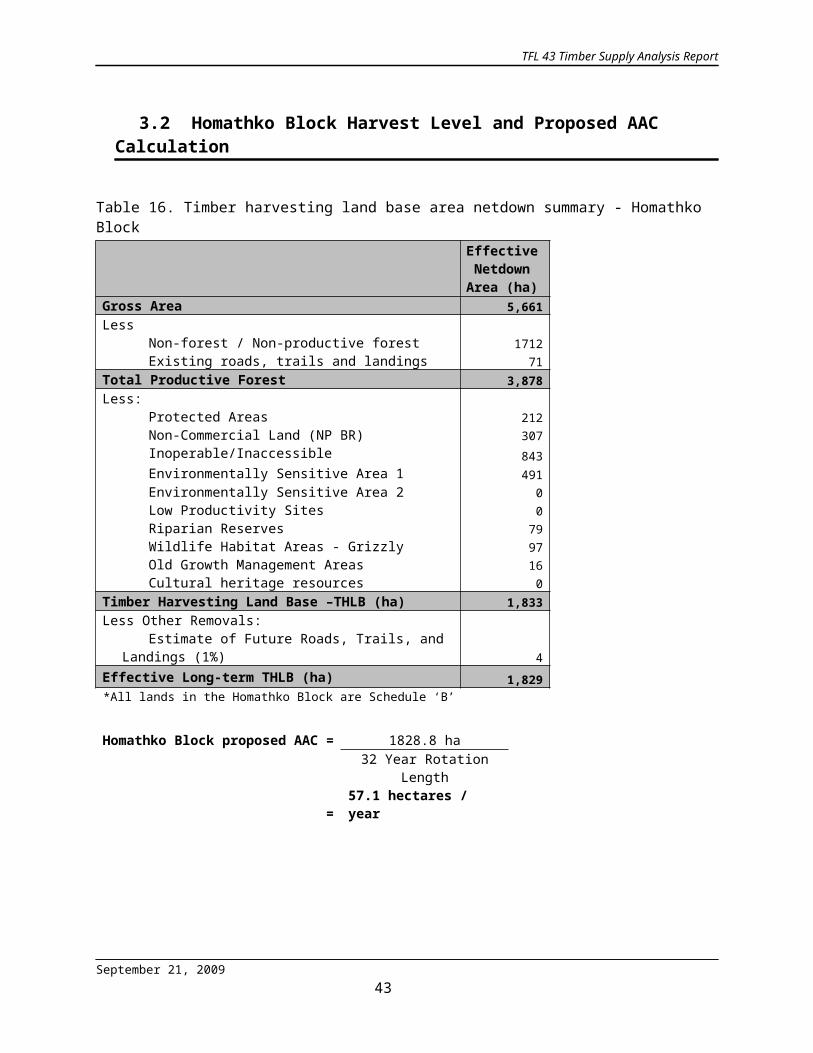
TFL 43 Timber Supply Analysis Report
0
20
40
60
80
100
120
0-5 6-10 11-15 16-20 21-25 26-30 31-40 41-60 61-80 81-100 101-120
121-140
Age Class
Are
a (h
a)ConiferDRAC/AX
Figure 24. TFL 43 Kingcome Block THLB Age Class distribution
The harvest levels within this plan are listed in Table 26. The harvest levels are based on the proposed AAC of 15.8 ha. An almost constant harvest level is projected over the term of this plan. The harvest areas do not vary significantly in each period of the plan but the company expects a high degree of variance in volumes depending upon the stand composition. The areas have been reduced for riparian reserves found adjacent to the blocks within this plan.
Table 26. Kingcome Block – 20 year plan harvest area summaryPeriod Area (ha)
2010-2014 822015-2019 812020-2024 782025-2029 81Total 279
Approximately 249 ha of productive forest consisting of ESA's, inoperable, riparian and non-productive brush areas are reserved from harvesting within this plan. These constrained areas will largely fulfill the landscape level biodiversity requirement within this Block.
September 21, 200945

TFL 43 Timber Supply Analysis Report
5.0 References
Scott Paper Limited, 1999. Management Plan No. 4 – Tree Farm Licence 43 – The Broadleaf Tree Farm Licence Including Managed Forest #23.
Scott Paper Limited and Olympic Resource Management, 1999. Management Plan No. 4 – Tree Farm Licence 43 – Appendix IV – Timber Supply Analysis Information Package.
Scott Paper Limited and Olympic Resource Management, 1999. Management Plan No. 4 – Tree Farm Licence 43 – Appendix V – Timber Supply Analysis Report.
Scott Paper Limited and Olympic Resource Management, 1999. Management Plan No. 4 – Tree Farm Licence 43 – Appendix VI – 20 Year Plan.
Kruger Forest Products, 2007. Forest Stewardship Plan for the Homathko Forest Development Unit – TFL 43. April 1, 2007 to March 31, 2011.
Kruger Forest Products, 2007. Forest Stewardship Plan for the Fraser Forest Development Unit – TFL 43. April 1, 2007 to March 31, 2012.
September 21, 200946

TFL 43 Timber Supply Analysis Report
6.0 GlossaryAllowable annual cut (AAC) The rate of timber harvest permitted each year from a specified area of land,
usually expressed as cubic meters of wood per year.Analysis unit A grouping of types of forest — for example, by species, site productivity,
silvicultural treatment, age, and or location — done to simplify analysis and generation of timber yield tables.
Base case harvest forecast The timber supply forecast which illustrates the effect of current forest management practices on the timber supply using the best available information, and which forms the reference point for sensitivity analysis.
Biodiversity (biological diversity)
The diversity of plants, animals and other living organisms in all their forms and levels of organization, including the diversity of genes, species and ecosystems, as well as the evolutionary and functional processes that link them.
Biogeoclimatic (BEC) variant A subdivision of a biogeoclimatic subzone. Variants reflect further differences in regional climate and are generally recognized for areas slightly drier, wetter, snowier, warmer or colder than other areas in the subzone.
Biogeoclimatic zones A large geographic area with broadly homogeneous climate and similar dominant tree species.
Coniferous Coniferous trees have needles or scale-like leaves and are usually 'evergreen'.Cutblock A specific area, with defined boundaries, authorized for harvest.Cutblock adjacency The spatial relationship among cutblocks. Most adjacency restrictions require
that recently harvested areas must achieve a desired condition (green-up) before nearby or adjacent areas can be harvested. Specifications for the maximum allowable proportion of a forested landscape that does not meet green-up requirements are used to approximate the timber supply impacts of adjacency restrictions.
Deciduous Deciduous trees shed their leaves annually and commonly have broad-leaves.Environmentally sensitive areas (ESA)
Areas with significant non-timber values, fragile or unstable soils, impediments to establishing a new tree crop, or high risk of avalanches.
Forest cover objectives Specify desired distributions of areas by age or size class groupings. These objectives can be used to reflect desired conditions for wildlife, watershed protection, visual quality and other integrated resource management objectives. General adjacency and green-up guidelines are also specified using forest cover objectives (see Cutblock adjacency and Green–up).
Forest inventory An assessment of British Columbia's timber resources. It includes computerized maps, a database describing the location and nature of forest cover, including size, age, timber volume, and species composition, and a description of other forest values such as recreation and visual quality.
Forest and Range Practices Act (FRPA)
Legislation that govern forest practices and planning, with a focus on ensuring management for all forest values.
Forest type The classification or label given to a forest stand, usually based on its tree species composition. Pure spruce stands and spruce-balsam mixed stands are two examples.
Free-growing An established seedling of an acceptable commercial species that is free from growth-inhibiting brush, weed and excessive tree competition.
Green-up The time needed after harvesting for a stand of trees to reach a desired condition (usually a specific height) — to ensure maintenance of water quality, wildlife habitat, soil stability or aesthetics — before harvesting is permitted in adjacent areas.
Growing stock The volume estimate for all standing timber at a particular time.Harvest forecast The flow of potential timber harvests over time. A harvest forecast is usually a
measure of the maximum timber supply that can be realized over time for a specified land base and set of management practices. It is a result of forest planning models and is affected by the size and productivity of the land base, the current growing stock, and management objectives, constraints and assumptions.
September 21, 200947

TFL 43 Timber Supply Analysis Report
Higher level plans Higher level plans establish the broader, strategic context for operational plans, providing objectives that determine the mix of forest resources to be managed in a given area.
Inoperable areas Areas defined as unavailable for harvest for terrain-related or economic reasons. Operability can change over time as a function of changing harvesting technology and economics.
Integrated resource management(IRM)
The identification and consideration of all resource values, including social, economic and environmental needs, in resource planning and decision-making.
Landscape-level biodiversity The Landscape Unit Planning Guide provides objectives for maintaining biodiversity at both the landscape level and the stand level. At the landscape level, guidelines are provided for the maintenance of seral stage distribution, patch size distribution and landscape connectivity.
Landscape unit A planning area based on topographic or geographic features, that is appropriately sized (up to 100 000 hectares), and designed for application of landscape-level biodiversity objectives.
Long-term harvest level A harvest level that can be maintained indefinitely given a particular forest management regime (which defines the timber harvesting land base, and objectives and guidelines for non-timber values) and estimates of timber growth and yield.
Mature seral Forest stands with trees between 80 and 120 years old, depending on species, site conditions and biogeoclimatic zone.
Management assumptions Approximations of management objectives, priorities, constraints and other conditions needed to represent forest management actions in a forest planning model. These include, for example, the criteria for determining the timber harvesting land base, the specification of minimum harvestable ages, utilization levels, integrated resource guidelines and silviculture and pest management programs.
Mean annual increment (MAI) Stand volume divided by stand age. The age at which average stand growth, or MAI, reaches its maximum is called the culmination age (CMAI). Harvesting all stands at this age results in a maximum average harvest over the long term.
Minimum harvestable age (MHA)
The age at which a stand of trees is expected to achieve a merchantable condition. The minimum harvestable age could be defined based on maximize average productivity (culmination of mean annual increment), minimum stand volume, or product objectives (usually related to average tree diameter).
Model An abstraction and simplification of reality constructed to help understand an actual system or problem. Forest managers and planners have made extensive use of models, such as maps, classification systems and yield projections, to help direct management activities.
Natural disturbance type (NDT) An area that is characterized by a natural disturbance regime, such as wildfires, which affects the natural distribution of seral stages. For example areas subject to less frequent stand-initiating disturbances usually have more older forests.
Not satisfactorily restocked (NSR)
An area not covered by a sufficient number of well-spaced trees of desirable species. Stocking standards are set by the B.C. Forest Service. Areas harvested prior to October 1987 and not yet sufficiently stocked according to standards are classified as backlog NSR. Areas harvested or otherwise disturbed since October 1987 are classified as current NSR.
Operational Adjustment Factor(OAF)
OAF1 and OAF2 are TIPSY input parameters that reduce predicted yield to account for factors such as non-productive areas within stands, disease and insects, non-commercial cover, stocking gaps, decay, waste, and breakage.
Operability Classification of an area considered available for timber harvesting. Operability is determined using the terrain characteristics of the area as well as the quality and quantity of timber on the area.
Productive Forest land base (PFLB)
All forested crown land in a management unit. Used to support the management of non timber resources. The THLB is a subset of this land base.
September 21, 200948

TFL 43 Timber Supply Analysis Report
Protected area A designation for areas of land and water set aside to protect natural heritage, cultural heritage or recreational values (may include national park, provincial park, or ecological reserve designations).
Riparian area Areas of land adjacent to wetlands or bodies of water such as swamps, streams, rivers or lakes.
Scenic area Any visually sensitive area or scenic landscape identified through a visual landscape inventory or planning process carried out or approved by a district manager.
Sensitivity analysis A process used to examine how uncertainties about data and management practices could affect timber supply. Inputs to an analysis are changed, and the results are compared to a baseline or base case.
Seral stages Sequential stages in the development of plant communities that successively occupy a site and replace each other over time.
Site index A measure of site productivity. The indices are reported as the average height, in meters, that the tallest trees in a stand are expected to achieve at 50 years (age is measured at 1.3 meters above the ground). Site index curves have been developed for British Columbia's major commercial tree species.
Stand-level biodiversity A stand is a relatively localized and homogeneous land unit that can be managed using a single set of treatments. In stands, objectives for biodiversity are met by maintaining specified stand structure (wildlife trees or patches), vegetation species composition and coarse woody debris levels.
Stocking The proportion of an area occupied by trees, measured by the degree to which the crowns of adjacent trees touch, and the number of trees per hectare.
Table Interpolation Program for Stand Yields (TIPSY)
A B.C. Forest Service computer program used to generate yield projections for managed stands based on interpolating from yield tables of a model (TASS) that simulates the growth of individual trees based on internal growth processes, crown competition, environmental factors and silvicultural practices.
Timber harvesting land base (THLB)
Productive Forest land within the timber supply area where timber harvesting is considered both acceptable and economically feasible, given objectives for all relevant forest values, existing timber quality, market values and applicable technology.
Timber supply The amount of timber that is forecast to be available for harvesting over a specified time period, under a particular management regime.
Timber supply area (TSA) An integrated resource management unit established in accordance with Section 7 of the Forest Act.
Tree farm license (TFL) Provides rights to harvest timber, and outlines responsibilities for forest management, in a particular area.
Ungulate A hoofed herbivore, such as deer.Unsalvaged losses The volume of timber killed or damaged annually by natural causes (e.g., fire,
wind, insects and disease) that is not harvested.Variable Density Yield Prediction (VDYP)
An empirical yield prediction system, supported by the Ministry of Forests and Range, designed to predict average yields and provide forest inventory updates over large areas (i.e., Timber Supply Areas). It is intended for use in unmanaged natural stands of pure or mixed species composition.
Vegetation Resources Inventory(VRI)
An assessment of British Columbia's vegetation resources. It includes computerized maps, a database describing the location and nature of forest information, including timber size, stand age, timber volume, tree species composition, and shrub, herb, and bryoid information. It replaces the older forest inventory.
Visual quality objective (VQO) Defines a level of acceptable landscape alteration resulting from timber harvesting and other activities. A number of visual quality classes have been defined on the basis of the maximum amount of alteration permitted.
Volume estimates Estimates of yields from forest stands over time. Yield projections can be developed for stand volume, stand diameter or specific products, and for empirical (average stocking), normal (optimal stocking) or managed stands.
Yield projections See volume estimates
September 21, 200949
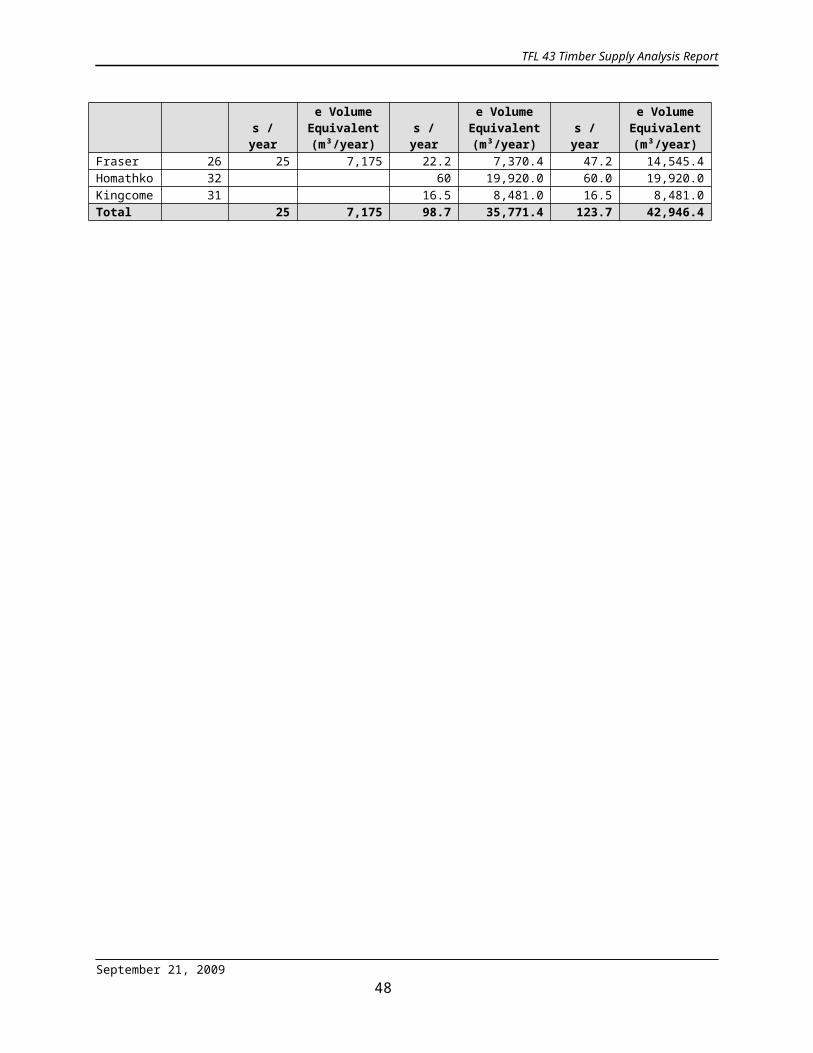
TFL 43 Timber Supply Analysis Report
Watershed An area drained by a stream or river. A large watershed may contain several smaller watersheds.
Wildlife tree A standing live or dead tree with special characteristics that provide valuable habitat for conservation or enhancement of wildlife.
Woodlot licence An agreement entered into under the Forest Act. It allows for small-scale forestry to be practised in a described area (Crown and private) on a sustained yield basis.
September 21, 200950
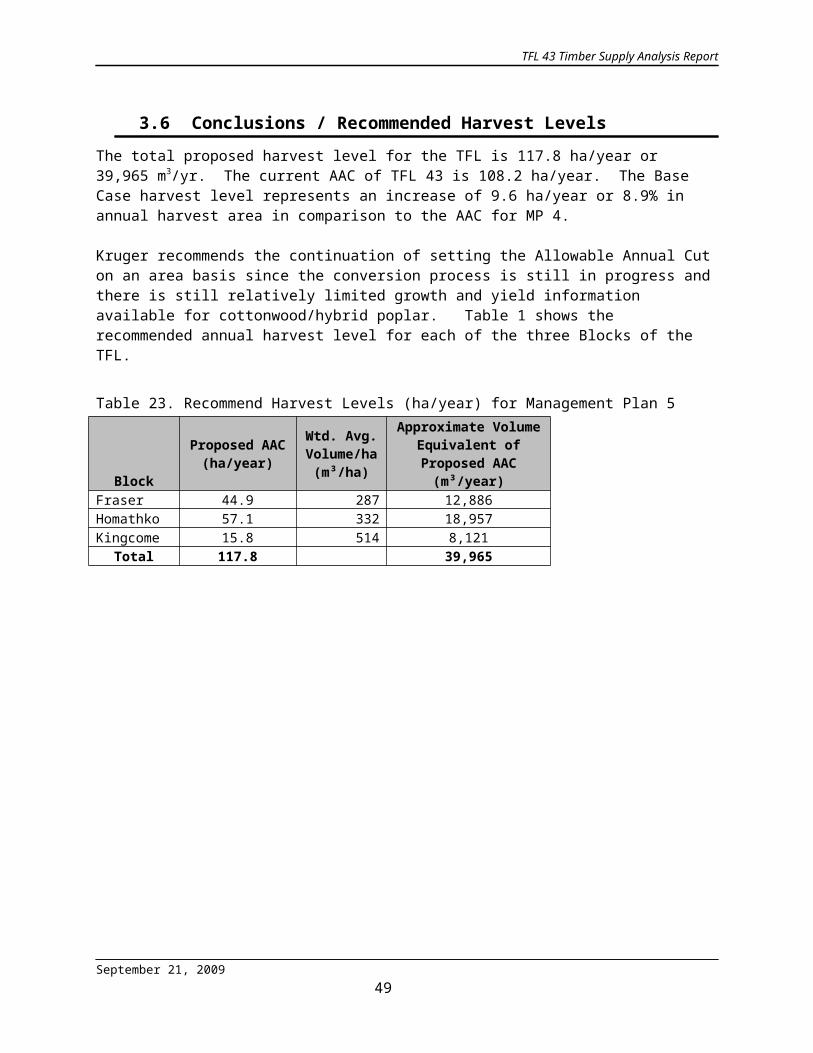
TFL 43 Timber Supply Analysis Report
7.0 AcronymsAAC Allowable Annual CutAnalysis Timber Supply AnalysisAU Analysis UnitBCTS British Columbia Timber SalesBEC Biogeoclimatic Ecosystem ClassificationBEO Biodiversity Emphasis OptionCF Chief ForesterDFO Department of Fisheries and OceansDM District ManagerDP Data PackageESA Environmentally Sensitive AreaFAIB Forest Analysis and Inventory BranchFIZ Forest Inventory ZoneFPC Forest Practices CodeFPPR Forest Planning and Practices RegulationFSP Forest Stewardship PlanGAR Government Action RegulationGIS Geographic Information SystemHLP Higher Level PlanILMB Integrated Land Management Bureau (Ministry of Agriculture and Lands)IRM Integrated Resource ManagementLRMP Land and Resource Management PlanLU Landscape UnitMHA Minimum Harvestable AgeMOE Ministry of EnvironmentMOGMA Mature + Old Growth Management AreaMFR Ministry of Forests and RangeMO Ministerial OrderNCC Non-Commercial CoverNDT Natural Disturbance TypeNRL Non-Recoverable LossesNSR Not Satisfactorily RestockedOAF Operational Adjustment FactorOGMA Old Growth Management AreaPSP Permanent Sample PlotPFLB Productive Forest Land BasePSYU Public Sustained Yield UnitRMR TFL 43 Mountain ResortRMZ Riparian Management ZoneRRZ Riparian Reserve ZoneRVQC Recommended Visual Quality ClassSI Site IndexTFL Tree Farm LicenseTHLB Timber harvesting land base VAC Visual Absorption CapabilityVQO Visual Quality ObjectiveWHA Wildlife habitat area
September 21, 200951

TFL 43 Timber Supply Analysis Report
Appendix A - 20 Year Plan Maps
This page intentionally left blank
September 21, 200952