reverse auction bidding:bidding strategy pattern of first
TRANSCRIPT

REVERSE AUCTION BIDDING:
BIDDING STRATEGY PATTERN OF FIRST TIME BIDDERS
A Thesis
by
SHREYAS VINAYAK BEDEKAR
Submitted to the Office of Graduate Studies of
Texas A&M University
in partial fulfillment of the requirements for the degree of
MASTER OF SCIENCE
December 2010
Major Subject: Construction Management

Reverse Auction Bidding:
Bidding Strategy Pattern of First Time Bidders
Copyright 2010 Shreyas Vinayak Bedekar
REVERSE AUCTION BIDDING:
BIDDING STRATEGY PATTERN OF FIRST TIME BIDDERS
A Thesis
by
SHREYAS VINAYAK BEDEKAR
Submitted to the Office of Graduate Studies of
Texas A&M University
in partial fulfillment of the requirements for the degree of
MASTER OF SCIENCE
Approved by:
Co-Chairs of Committee, John Morgan Nichols
Boong Yeol Ryoo
Committee Members, Ivan Damnjanovic
Head of Department, Joseph P. Horlen
December 2010
Major Subject: Construction Management

iii
Reverse Auction Bidding:
Bidding Strategy Pattern of First Time Bidders.
(December 2010)
Shreyas Vinayak Bedekar, B.E., Shivaji University, India
Co-Chairs of Advisory Committee: Dr. John Morgan Nichols
Dr. Boong Yeol Ryoo
The advancement of computer technology is playing an important role in almost
all fields in the construction industry in the current era. It has become a tool for
exchanging legal contract information, including bid data. In the traditional closed
bidding system, the bidders were unaware of their competitors‟ bid quotes and had no
opportunity available to make a counter an offer to the bid at a different level. However,
in reverse auction bidding (RAB), contractors can track their competitors‟ bids and take
the given opportunity to re-bid the projects at lower rates. Unlike traditional auctions,
where buyers raise their purchasing prices to outbid competitors, reverse auctions permit
buyers to purchase goods and services from suppliers who are encouraged to sell them at
the lowest price. The benefit of the reverse auction bidding is either that the vendors are
able to re-bid, or lower their bid multiple times. This is an example of transparent
economic information.
ABSTRACT

iv
Van Vleet initiated the ongoing Reverse Auction Bidding study at Texas A&M
University. Van Vleet had created a Microsoft Access database system and ASP web
based user interface for RAB study. The methodology developed by van Vleet is still
being used today, and this study has been extended into analyzing different personality
types and the impact on the bidding system. In the previous studies conducted by
different researchers in TAMU, the performance of participants in the RAB process
along with their behavior are being observed with respect to their personality.
Personality of each player is tested using the Keirsey Temperament Sorter (KTS) test.
The previous study states that there appears to be a strong correlation between
personality type and game performance. The first case study conducted by van Vleet
involved five participants who had no prior experience in Reverse Auction Bidding. The
number of participants has varied from three to ten participants.
This research has been conducted on graduate students of the Construction
Science Department of TAMU who have no prior experience in RAB. In continuation
with the previous studies held in TAMU, the results show that there is an observable
pattern in the bidding strategy of first time bidders while taking part in Reverse Auction
Bidding.

v
I would like to thank my co-chairs, Dr. John Nichols and Dr. Boong Yeol Ryoo
for being my guide, teacher and an advisor. I would also like to thank my committee
member, Dr. Ivan Damnjanovic for all of his help and support in this journey.
I would also like to thank my parents for supporting me. My friends and well-
wishers always strengthened me in this endeavor. I strongly appreciate the help of my
peer friends who already had studied RAB under Dr. Nichols without whom this thesis
could not have been completed.
ACKNOWLEDGEMENTS
vi
ASP Application Service Provider
KTS Keirsey Temperament Sorter
RAB Reverse Auction Bidding
SQL Sequential Query Language
TAMU Texas A&M University
NOMENCLATURE

vii
Page
ABSTRACT ..................................................................................................................... iii
ACKNOWLEDGEMENTS ............................................................................................... v
NOMENCLATURE .......................................................................................................... vi
TABLE OF CONTENTS .................................................................................................vii
LIST OF FIGURES ........................................................................................................... ix
LIST OF TABLES ............................................................................................................. x
INTRODUCTION .............................................................................................................. 1
Background .................................................................................................................. 1 Problem Statement ....................................................................................................... 3
Research Problem ........................................................................................................ 3 Sub Problem ................................................................................................................. 3 Limitations ................................................................................................................... 3
Significance .................................................................................................................. 4
LITERATURE REVIEW ................................................................................................... 5
Introduction .................................................................................................................. 5 Definitions .................................................................................................................... 5
Game Definitions ......................................................................................................... 7 Personality Type .......................................................................................................... 8 Different Personality Types ......................................................................................... 8
Reverse Auction System ............................................................................................ 10 Analysis of the Game ................................................................................................. 15 Summary .................................................................................................................... 15
METHODOLOGY ........................................................................................................... 16
Introduction ................................................................................................................ 16 Game Setup ................................................................................................................ 16 Game Play .................................................................................................................. 19 Data Collection .......................................................................................................... 19
TABLE OF CONTENTS

viii
Page
Personality Types ....................................................................................................... 24
RESULTS ......................................................................................................................... 25
Introduction ................................................................................................................ 25 Personality Testing ..................................................................................................... 25 Reverse Auction Bidding Game ................................................................................ 26 Analysis of Results..................................................................................................... 27
CONCLUSIONS .............................................................................................................. 46
REFERENCES ................................................................................................................. 48
APPENDIX A KEIRSEY TEMPERAMENT SORTER TEST ...................................... 50
APPENDIX B IRB – APPROVAL FORM ..................................................................... 56
VITA ................................................................................................................................ 57

ix
Page
Figure 1 All Current Bids Screen from RAB Web Site (Guhya,2010) .......................... 21
Figure 2 Bank Guarantee Web Form (Guhya,2010) ...................................................... 21
Figure 3 Higher than Acceptable Bid Web Statement (Guhya, 2010) ........................... 22
Figure 4 My Bid Info Web Page (Guhya,2010) ............................................................. 22
Figure 5 All Completed Jobs Screen (Guhya,2010) ...................................................... 24
Figure 6 Histogram of Number of Jobs and Number of Bids per Week ........................ 27
Figure 7 Boxplot for Profit ............................................................................................. 35
Figure 8 Number of Bids Versus Number of Jobs ......................................................... 36
Figure 9 High, Low and Average Bid in Every Minute Boxplot ................................... 38
Figure 10 Trend of Average Bids per Minute .................................................................. 39
Figure 11 Bank Loan against Profit ................................................................................. 41
Figure 12 Number of Entries in the Each Normalized Profit Range ............................... 43
Figure 13 Number of Entries Versus Normalized Profit Range ...................................... 45
Figure 14 Number of Entries Versus Cumulative Normalized Profit Range ................... 45
LIST OF FIGURES

x
Page
Table 1 KTS Different Personality Types ........................................................................ 9
Table 2 Summary of Individual Components of the Different Personality Types ......... 10
Table 3 Site Location Details ......................................................................................... 18
Table 4 Player and Personality Type .............................................................................. 25
Table 5 Number of Jobs per Week and Descriptive Statistics ....................................... 26
Table 6 Trend Periods and Data as Postulated by Chouhan (2009) ............................... 28
Table 7 First Bid Period ................................................................................................. 29
Table 8 Second Bid Period ............................................................................................. 30
Table 9 Third Bid Period ................................................................................................ 30
Table 10 Forth Bid Period ................................................................................................ 31
Table 11 Fifth Bid Period ................................................................................................. 31
Table 12 Sixth Bid Period ................................................................................................ 32
Table 13 Seventh Bid Period ............................................................................................ 32
Table 14 Eighth Bid Period .............................................................................................. 33
Table 15 Ninth Bid Period ............................................................................................... 33
Table 16 Student‟s t-test Analysis .................................................................................... 34
Table 17 High, Low and Average Bids in Each Minute .................................................. 37
Table 18 Bid Efficiency of Each Personality ................................................................... 39
LIST OF TABLES

xi
Page
Table 19 Bank Loan and Profit Data ................................................................................ 40
Table 20 Total Number of Entries in Normalized Profit Period ...................................... 44

1
BACKGROUND
With the global presence of computers and the nearly universal reach of the
Internet, there is widespread use of online auctioning for the sale of goods. Therefore, it
should be a surprise to no one that owners would think of a way to use them to get lower
prices for purchase of goods and services. The concept is to describe what someone
wants to buy and then let providers compete with one another to lower their prices until
a pre-set time or other cut-off, and it is called electronic reverse auction bidding
(ERAB).
In 2004 Van Vleet found that some construction firms were claiming they were
finding it difficult to compete and remain profitable in the current economic market. He
also observed that those firms had a high failure and lower rates of returns. Van Vleet
then researched a new system of bidding called reverse auction bidding (RAB). Reverse
auction bidding has created a great deal of dispute tied with the added issues of rising
costs, increasing competition, high failure rates and marginal rates of return. However,
comprehensive research at Texas A&M University has provided some evidence that
RAB can offer a reasonable return to shareholders and banks of the contractors, even
though with the strain of the bidding system perhaps interfering with the development of
the contractor to owner relationship (van Vleet 2004).
____________
This thesis follows the style of Adult Education Quarterly.
INTRODUCTION

2
Some researchers propose that RAB reduces contractor profit which in turn may
compromise quality of the job and safety on the sites. Angelo (2002), Gregory (2006);
and Panchal (2007) identified three different classifications of bidders as:
Economic winner – One who generates the highest average job price
Economic loser – One who generates the lowest average job price
Average bidder – Bidder with average returns
Sushil (2009) proposed that an owner‟s representative‟s interference in bidding can
affect the result of reverse auction bidding and his research demonstrated this
phenomenal. Chouhan (2009) categorized the personalities of the bidder using Keirsey
Temperament Sorter (KTS) and postulated the following classification as:
Economically effective bidder
Economically ineffective bidder
Members generating average distribution returns
Guhya (2010) extended the above study and defined series of games within RAB.
Machado (2009) proposed that Number of bidder‟s participating in Reverse Auction
Bidding is directly proportional to psychological effect on bidder‟s personality and
Aggressive bidder is more successful in Reverse Auction Bidding than Average bidder.
Saigaonkar (2010) and Gupta (2010) showed that out of the four primary personalities
according to the KTS, the Guardians have a better performance than the other three
personality types in a controlled game.
3
PROBLEM STATEMENT
This research study is carried out to evaluate the bidding strategy and the
observable typical pattern for the first time bidders of reverse auction bidding. The
research will use game theory to analyze bidder‟s behavior changes in changing
situations and personality testing to determine if there is a relationship between first time
bidding and generated patterns.
RESEARCH PROBLEM
Is there an observational pattern of the bidding strategy of the first time bidders
using reverse auction bidding?
SUB PROBLEM
Is there any correlation between first time bidding and the profits patterns of the
bidding, irrespective of the personality of the bidder in a Reverse Auction Bidding
model?
LIMITATIONS
The scope of research study will be limited to following factors:
The study is limited to construction management graduate students from
the Department of Construction Science, Texas A&M University
This study was performed in a controlled setting, limiting the variables
that exist in the market place, as well as the risk related to the daily
transaction of business. The controlled setting was necessary in order to
establish clear lines for evaluating participant behavior patterns.

4
This study will not address any misprint errors, omissions and
miscalculations that are caused due to participant‟s online bidding
process.
The bidder‟s background e.g. their origin, past will not be taken into
account in details.
SIGNIFICANCE
Although Reverse Auction Bidding has been proved to be very useful in
procuring goods and services, there are some controversial arguments that it has created
serious impact on owner-bidder relationship. This study aims to analyze first time
bidder‟s behavior and strategy to gain strategic position over other bidders. This study
will also try to analyze the profit patterns of the first time bidders.

5
INTRODUCTION
The research is divided into four detailed aspects namely definitions of the game,
the reverse auction bidding process, the personality testing and the analysis of the game.
DEFINITIONS
A comprehensive set of definitions was provided by Guhya (2010) that are
relevant to the reverse auction bidding system applied at Texas A&M University
System. These definitions taken verbatim are as follows:
Reverse Auction Bidding: Single or multiple-item, open, descending-price
auction. The initiator specifies the opening bid price and bid decrement.
Each bidder submits a successively lower bid. At the end of the auction,
the bidders with the lowest bids win (van Vleet 2004).
Game Theory: A formal analysis of conflict and cooperation among
intelligent and rational decision makers (van Vleet 2004).
Collusion: A secret agreement between two or more parties for a
fraudulent, illegal, or deceitful purpose (van Vleet 2004).
Bidders Personality: “The dictionary defines personality in several ways.
One definition emphasizes the public, social stimulus, or behavioral
characteristics of a person that are visible to other people and make an
impression on them. Another definition stresses a person‟s private,
central, inner core. Included within this private core are the motives,
LITERATURE REVIEW

6
attitudes, interests, believes, fantasies, cognitive styles and other mental
processes of an individual. Some definitions of personality emphasize its
“person” quality, personal existence, or identity features. Other meanings
of personality are associated with specific disciplines or professions”
(Panchal 2007).
Responsive Bidder: A bidder whose bid satisfies all the terms and
conditions of bidding, delivery requirements, detailed specifications is
called responsive bidder.
Aggressive Bidder: Aggressive bidders are the bidders who attain highest
overall returns in the entire bidding process (Chouhan 2009).
Average Bidder: Average bidders are bidders who attain average
distribution of returns in the entire bidding process (Chouhan 2009).
Success Rate: It is a ratio of number of bids won by a bidder to total
number of bids made by that particular bidder.
Bidding Aggression: It is a ratio of total number of bids made by an
individual bidder to total number of bids made by all the bidders in the
reverse auction bidding pool.
Bidder: An entity that submits bid. In this game, there are usually three to
ten bidders.

7
GAME DEFINITIONS
The following list contains terms associated with the reverse auction bidding
game. These terms were defined by Van Vleet (2004), Panchal (2007), Chaudhary
(2009) and Guhya (2010). They are:
player : This represents the bidder group, treated as a single entity for
the purpose of game analysis.
i player : The i
th bidder in the bidding group.
player : This represents the purchaser.
game : The postulated sub-game played between bidders in seeking
economic advantage over the remaining bidders. This game almost
always disadvantages the player, but the player created the system
and so is responsible for the player‟s economic losses as a result.
game : The postulated sub-game played within the Reverse Auction
Bidding game between the purchaser and the bidders. In terms of this
analysis, it is deemed to effectively reduce to a two-player game, with
competition implications for all players. The player in reality sees only
the average of all won bids.
: Bid time allowed for each round of play in the game.
: Period between bid times that represents the work time in the
game.
jB : i
th bid

8
vB : Accepted bid for each job.
: This variable is a fixed dollar sum, representing the player‟s base
price, although in this game K is a vector of costs.
: This variable is a fixed dollar sum, representing the player‟s
maximum incremental price above
: This variable is normally defined by the set of numbers
{ | 0 1} , although negative values of are permitted by the
Reverse Auction Bidding system. is used to normalize the profit data.
A negative j represents a loss on direct costs to the
i player who
makes this type of bid, and enough of these bids will lead to a bankrupt
player. This type of play is discouraged as the assumption in the game is
steady state economic conditions in the outside economy. Future studies
may look at a failing market, but that is beyond this study.
PERSONALITY TYPE
Rogers (2010) originally suggested the use of the Keirsey Temperament Sorter
Test to look at the difference in personality between a Type and Type types. It
consists of 71 questions. The exact questions were listed in Appendix A.
DIFFERENT PERSONALITY TYPES
Table 1 below shows the Keirsey Temperament Sorter Test Summary.

9
Table 1 KTS Different Personality Types
Temperament Role Role Variant
Introspective
(N)
Idealist (NF)
Diplomatic
Mentor (NFJ)
Developing
Teacher (ENFJ): Educating
Counselor (INFJ): Guiding
Advocate (NFP)
Mediating
Champion (ENFP): Motivating
Healer (INFP): Conciliating
Rational (NT)
Strategic
Coordinator (NTJ)
Arranging
Field marshal (ENTJ): Mobilizing
Mastermind (INTJ): Entailing
Engineer (NTP)
Constructing
Inventor (ENTP): Devising
Architect (INTP): Designing
Observant
(S)
Guardian (SJ)
Logistical
Administrator (STJ)
Regulating
Supervisor (ESTJ): Enforcing
Inspector (ISTJ): Certifying
Conservator (SFJ)
Supporting
Provider (ESFJ): Supplying
Protector (ISFJ): Securing
Artisan (SP)
Tactical
Operator (STP)
Expediting
Promoter (ESTP): Persuading
Crafter (ISTP): Instrumenting
Entertainer (SFP)
Improvising
Performer (ESFP): Demonstrating
Composer (ISFP): Synthesizing
Table 2 shows the individual components in the temperament scale. The issue is
equal scores between groups being assigned to one category. The issue should be
considered in future studies.

10
Table 2 Summary of Individual Components of the Different Personality Types
Letter Name Meaning
E Extraversion Feel motivated by interaction with people. Tend to enjoy a
wide circle of acquaintances, and gain energy in social
situations
N Intuition More abstract than concrete. Focus attention on the big picture
rather than the details, and on future possibilities rather than
immediate realities
F Feeling Value personal considerations above objective criteria. When
making decisions, often give more weight to social
implications than to logic
J Judgment Plan activities and make decisions early. Derive a sense of
control through predictability
I Introversion Quiet and reserved. Generally prefer interacting with a few
close friends rather than a wide circle of acquaintances, and
expend energy in social situations
P Perception Withhold judgment and delay important decisions, preferring
to "keep their options open" should circumstances change
T Thinking Value objective criteria above personal preference. When
making decisions, generally give more weight to logic than to
social considerations
S Sensing More concrete than abstract. Focus attention on the details
rather than the big picture, and on
immediate realities rather than future possibilities
REVERSE AUCTION SYSTEM
Reverse Auction Bidding (RAB) is a process in which a buyer of goods and
services continues to request bids from sellers until the buyer is satisfied they have
received an acceptably low price although time does become a problem that ultimately
limits the bidding process. In a conventional bidding method, general contractors submit
their bids, or pre-selected general contractors plead for bids from subcontractors, and
there is no opportunity for subsequent bidding after the specified time for bid opening.

11
In recent years, the Reverse Auction Bidding process has become a more
accepted tool, which facilitates competitive and collaborative interactions among buyers
and suppliers with online negotiations, even though with resistance in the construction
field due to the perception of bid shopping.
Horlen et al., (2005) noted that reverse auction can harm owner-buyer long term
relationship, collaboration, quality of product, reliability, service and product delivery.
Further, involvement of third party and unknown bidders in competition will result in
poor selection of bidders affecting long-term business relationships, standing,
performance, and responsibility. This observation is not necessarily true for all
relationships and requires further work to be proven at his stage, although Panchel
(2007) briefly considered this issue in his research.
Jap (2007) provides quantitative evidence that suppliers tends to become
suspicious about buyers strategy, which affects the owner – bidder relationship in
reverse auction bidding. One can consider that the selection of a RAB system will not
cultivate a positive relationship as the purchaser is making the strong statement that
“Price is everything with all else equal” (Nichols, 2010). As stated by Nichols:
“In some settings this is acceptable, but the purchaser must expect the supplier to
respond in kind”. Van Vleet (2004) noted this behavior and it was termed as tacit
collusions. Recent work suggests that it is part of a game strategy adopted by the
suppliers in response to the purchaser‟s acquisition method. Nichols considers that it is
normal economic behavior and reflects in part the lack of understanding of the

12
purchasers of the problems with RAB created by their adoption of this economic system.
A simple way to look at it is “that a fool and his money are soon parted.”
Jap (2007) reports that only 5% of the people they interviewed suggested that
reverse auction process can improve relationships. Chouhan (2009) opined that this
means that rest (95%) believe it is harmful, although the converse may simply be that the
average supplier sees no change in the relationship as they continue to treat the client in
a professional manner.
Engelbrecht – Wiggans (2007) argues that as there are repeated interactions
between owner and bidders in the whole bidding process, bidder‟s behavior can be
affected by issues external to auction like gaining a strategic position over other bidders
and buyer for his own economic concerns. Jap conducted research on aggressiveness of
bidder by considering various factors such as total number of bids a supplier make, the
rate of making bids and degree of price concessions they offer. From this Jap concluded
the following:
“Suppliers who are interested in making specific investment with buyer and also
those who want to develop long term relationship with the buyer will submit few bids,
bid at greater intervals and make less reduction in profit margin in the entire bidding
process compared to rest of the suppliers”. Guhya‟s (2010) work would not necessarily
support this view, it is dependent on the Herfindahl Index of the bidding game and the
personalities of the bidders.
Suppliers who frequently submitted bids and made heavy reductions in profit
margin have lower propensity of relationship post-auction with the buyer, which suggest

13
that reverse auction is a “negative price haggling” process. Nichols suggests this may be
personality driven by looking at the statistics of the lost money in the bidding process.
Guhya was the first to determine the lost money.
From these observations, Jap concluded that, “Strategic bidding behavior of
suppliers in which they appear to trade off potential economic and rational investments
is long term exchange with short term pricing concessions”.
There were several other key findings regarding reverse auctions in Jap‟s
research as the number of bidders in the auction increases, suppliers lose interest in
reverse auction bidding process and tend to bid less aggressively. The reasons for this
are yet to be determined according to Jap. Although in any reasoned consideration of the
cost of doing business this is to be expected. Some believe that bidders become skeptical
about the presence of non-qualified bidders bidding in the reverse auction process or of
faked bidding as studied by Panchal (2007).
There may be possibility that if number of suppliers is excessive within bidding
process, bidders may lose interest, refuse to bid against non-responsible bidders and start
looking for alternative buyers. Again this is normal economic behavior.
According to Staw (1976), “Bidding aggressiveness in response to total number
of bids by others may represent a psychological escalation of commitment”. Jap (2007)
states that supplier‟s frequency of bidding decreases with increase in duration of event of
reverse auction, which could affect overall price savings for the buyer. This is normal
behavior observed in the current set of studies.

14
It has been postulated that emotions can affect a bidder‟s personality and
response to the RAB game in a systematic way. Bosman and Riedl (2004) argue that
bidders who are in negative emotional state of mind have a tendency to increase the
number of made bids in bidding process. But, bidders with positive emotional state of
mind remain unchanged in their bidding behavior. This statement suggests that negative
emotions induce more competitive bidding, although this is far from proven.
Further Bosman and Riedl (2004) concluded that it is very necessary to
understand bidder‟s behavior and his emotions need to be taken into consideration at the
time of bidding. The available evidence suggests that people who feel good are inclined
to take less risk than people who feel neutral, in particular when the stakes are high.
Bosman and Riedl (2004) noted that people with positive emotions retain their
state of mind whereas people with negative emotions can affect risk behavior in different
ways. Raghunathan and Pham (1999) suggested that anxious individuals opt for “low
risk – low reward” option whereas sad individuals opt for “high risk – high reward”
option. People in positive emotional states tend to make optimistic judgments and
choices whereas people with negative emotional states tend to make pessimistic
judgments and choices.
Chouhan (2009) postulated that there is a difference between aggressive and
average bidders. Chaudhary (2009) suggests with good reason that this is due to
personality types and factors.

15
ANALYSIS OF THE GAME
The standard methods were established by Guhya (2010) for an analysis of the
Reverse Auction Bidding game.
The key factors are as follows:
Rate of bidding in units of minutes
Distribution of the bids during the game play
Lost money
Return
Return against loan
Personality
SUMMARY
It is a common held belief that reverse auction bidding drive down the cost of the
project which in turns saves large amount of money for the owner. Horlen and others
(2005) point out that there are lots of advantages to using reverse auction bidding to the
owner, but along with all of these advantages there are lots of barriers. Reverse auction
can and will harm the owner‟s long-term relationship with the contractor. It also may
create some problem with quality of product, reliability, service, and product delivery.
With the involvement of a third party and many unknown bidders in competition, it
might result in a poor selection of bidders which will affect long term business
relationships, reputation, performance and accountability (Horlen & others 2005,
Machado 2009, Van Vleet, 2004, Jabs, 2007). This study will conclude some of these
points.

16
INTRODUCTION
The methodology of the research is divided into two distinctive sections namely
the game setup and the data collection.
GAME SETUP
In this game, KTS is used to test the personalities of the bidders. Four players are
invited to take part in the RAB game. The consent form will be signed by all the
participants who are willing to participate in the RAB game. The bidders are encouraged
to gain maximum profit out of each job. All bidders are provided with an initial amount
of 40,000 USD. As we are assuming that this is a normal economic period, the RAB
system Considers realistic scenarios and factors such as travel and delivery charges, rain
delays, delays due to distant projects and other variables that affect the construction
daily business. The bidders bid for 15 minutes.
A set of instructions and rules provided to the bidders (participants) in the game
process during simulation. It includes the details related to the project, description, and
variables that affect the project as well as its duration. The instructions set are as
follows:
The total duration of the game will be a maximum of nine consecutive
weeks.
All bidders initially have an equal dollar amount of $40,000 available in
their bank accounts.
METHODOLOGY

17
The base cost for each job has been estimated by a competent estimator
as $10,000 (van Vleet, 2004). This cost does not include any applicable
travel and delivery charges. The amount of these excluded costs will be
posted on web site for each job along with some other relevant details
such as job site address, access information and other details necessary
to commence the job on time.
The default duration to complete each job is five scenario days of
construction time, excluding rain periods.
Work week begins on Monday and ends on Saturday. The work week is
six days long.
All bidders are limited initially to work on only three jobs per week.
If they desire to work on more than three jobs per week they then have to
take a loan out to finance for each additional job. The additional
borrowing charges are $500 that will be charged automatically every
time they borrow a loan irrespective of whether they win a job or not.
Since the base cost for all jobs is $10,000, and the default duration is five
days, each bidder makes $2000 per day for all jobs. This construction
cost will be accrued on daily basis. In addition, travel expenses and
delivery charges are also accrued on a daily basis, as determined by the
job site location costs built into the system.
The main office of the owner is located in Sugar Land and the travel and
delivery expenses will be determined on the basis of distance of job site
18
from this location as all subcontractors have offices within a mile of the
owner.
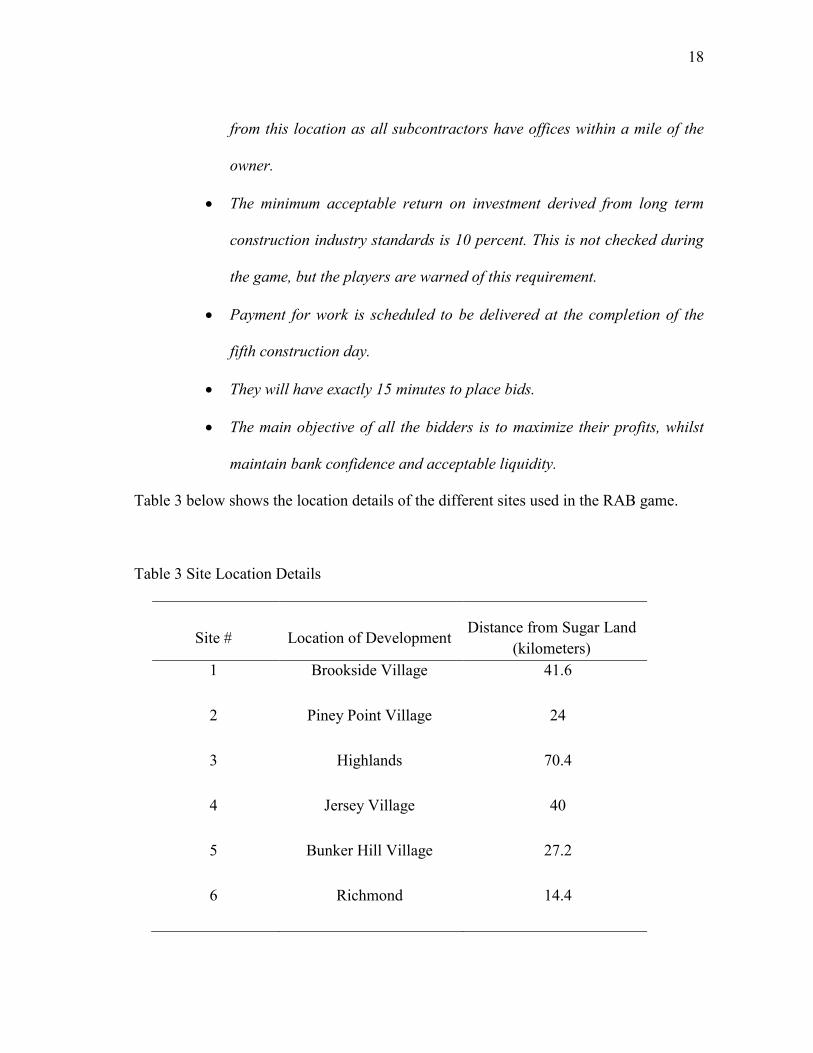
The minimum acceptable return on investment derived from long term
construction industry standards is 10 percent. This is not checked during
the game, but the players are warned of this requirement.
Payment for work is scheduled to be delivered at the completion of the
fifth construction day.
They will have exactly 15 minutes to place bids.
The main objective of all the bidders is to maximize their profits, whilst
maintain bank confidence and acceptable liquidity.
Table 3 below shows the location details of the different sites used in the RAB game.
Table 3 Site Location Details
Site # Location of Development Distance from Sugar Land
(kilometers)
1 Brookside Village 41.6
2 Piney Point Village 24
3 Highlands 70.4
4 Jersey Village 40
5 Bunker Hill Village 27.2
6 Richmond 14.4

19
GAME PLAY
As the game had four players with a nominal capacity of three jobs per week,
random dice rolls using two dice were used to determine the number of jobs that were
available each week. The number of jobs per week had also been determined by using
dice previously. However, bidders can increase the bid capacity and also can acquire an
additional job above their financial capacity by utilizing the option of borrowing money
taking a loan from the bank. This option was made available to each participant during
actual bidding process. Once the bidders are at their full capacity, the program is set in
such a way that it will ask the participant if they would like to increase their capacity.
DATA COLLECTION
In 2004 using Microsoft Access, van Vleet created a website using ASP
programming connected to an access database. This ASP site was used to run the online
simulation of the bidding game. This website allowed participants to submit their bid
information, and the site would also collect the data for the analysis of the bidding
behavior. Details of the ASP programming are given in the paper by Guhya (2010).
Gregory encountered connection problems with the Microsoft Access database as ten
bidders tried to get online at one time.
Wellington configured an alternative SQL Server 2005 database for the game site
in 2006. Texas A&M University‟s College of Architecture computers were set as the
server location created to host the reverse auction game where each participant enters the
system and they assigned a login screen with username and password entry boxes for
each individual participant.

20
Each participant was provided with a unique login name, being:
Hammer Co.
Driver Co.
Pliers Co.
Concrete Co.
Using a unique password, each participant controls their access to the site. These
specific login name and password allowed each participant to enter the website and
access the contract data. However, the limitation of the server is that it restricted
participant‟s access to the information that was relevant only to their bidding.
In the design of the web page, allowances were made such that the bidding
process minimized the irrelevant information given to the bidders. The significant
information includes the job cost, current bids and the bidder‟s name. In addition, before
bidding time commences or after bidding was closed, no bids could be placed. Bidding
is set to occur for a 15 minute time span, and then the system was closed for 5 minutes.
It is usually considered as a break time for the participants.
After starting a session, the participants were taken to the All Current Bids screen
as shown in Fig. 1. This screen provides bid information including location of the site
and related cost for each job. This was the identical information provided for all
participants.

21
Figure 1. All Current Bids Screen from RAB Web Site (Guhya,2010)
As described earlier, participants were limited to bid on only three jobs per week.
Upon accepting the bank guarantee, a fee of five hundred dollars was deducted from the
bidders account located on the My Bids Info page. Fig. 2 shows the screen that offers the
participant a chance to accept the bank cost.
Figure 2. Bank Guarantee Web Form (Guhya,2010)

22
There are some strict protocols established while designing the game to ensure
that only a lower value is accepted during the bidding process. The screen is prompted as
shown in Fig.3 to warn the bidders that they are not allowed to enter a higher bid amount
than the current lowest bid amount.
Figure 3. Higher than Acceptable Bid Web Statement (Guhya, 2010)
My Jobs in Progress bar shows My Bids Info page as shown in Fig. 4.
Figure 4. My Bid Info Web Page (Guhya,2010)

23
As Saigaonkar (2010) noted „My Bid Info Page‟ displays the bid and job
information relevant to a particular bidder. Participants were able to have access to this
page throughout this game process and they were encouraged to visit it frequently. This
page contains job relevant information that helps the participant to ensure their job
status. This page includes the following data:
All active jobs that participant has won, under the category My Jobs in
Progress
Jobs that participant is bidding, under the category “My Active Bids. All
information under this tab came directly from All Current Bids page, so
this also provides the current status of the bidding game to show whether
the participant had been outbid on a particular job.
List of all successfully completed jobs, under the category My Completed
Jobs.
This screen also shows the financial state of the participant, which helps the
bidder in framing a future strategies such as how many jobs a bidder could bid for, and if
the bidder is already lagging behind due to his uncompleted jobs, how much money a
bidder would have to borrow from bank and other financial institutions to bid for a job in
the following week. This financial information is provided under the category My
Summary. The information is:
Current calculated cash assets
Capacity for additional works including jobs with bank guarantees
Cumulative loan charges till date

24
Current financial condition provides the working capital information to the
participants as shown on Fig. 5. It is calculated by deducting costs of current jobs and
bank loans from the profits of completed jobs. The initial capitol is $40,000 and the bank
guarantee is $500 per loan. The formula used is:
Current Financial Condition = (Capital + Profits) – (Costs of Current Jobs +
Bank Costs)
Figure 5. All Completed Jobs Screen (Guhya,2010)
PERSONALITY TYPES
Each participant involved in the bidding was requested to take the Keirsey
Temperament Sorter (KTS) Test. Guhya (2010) had developed the standard set of
procedures to analyze the results. The information about personality type of a bidder
involved in the game process was collected to compare the personality types against the
returns each participant made in the game.

25
INTRODUCTION
The research is conducted in three phases, namely:
Personality Testing
Reverse Auction Bidding Game Play
Analysis of the Results
PERSONALITY TESTING
The preliminary step of this research was personality testing. Four students from
the graduate class in the Construction Science Department were randomly selected and
tasked to take the Keirsey Temperament Personality Sorter Test. The precaution taken
was none of the participant should have any prior experience of RAB. The bidders and
their personality types are presented in Table 4.
Table 4 Player and Personality Type
Bidder Name Assigned No. KTS Result Personality Type
Hammer 1 ISFP Artisan-Composer
Driver 2 INFP Idealist-Healer
Plier 3 ESTJ Guardian-Supervisor
Concrete 4 ISFJ Guardian-Protector
RESULTS

26
REVERSE AUCTION BIDDING GAME
The game was played on 21st Sep. 2010 at College of Architecture, TAMU. The
game commenced at 4:00 PM and lasted for nine game sets of fifteen minutes duration
each. Number of jobs available in each week is shown in Table 5.
Table 5 Number of Jobs per Week and Descriptive Statistics
Week No. of jobs
1 6
2 13
3 3
4 5
5 9
6 7
7 11
8 4
9 11
Mean 7.67
Std. deviation 3.5
Total 69
Fig. 6 shows a histogram of the jobs per week.

27
Figure 6. Histogram of Number of Jobs and Number of Bids per Week
ANALYSIS OF RESULTS
The analysis of results examines bid period results, profit data and differential
bid data from the bidding process.
(Chouhan 2009) proposed that there are four trend periods which could be
observed in a reverse auction bidding game. The trends were generally observed in the
majority of the research studies conducted previously on Reverse Auction Bidding. The
four trend periods are shown in Table 6.
0
20
40
60
80
100
120
140
160
1 2 3 4 5 6 7 8 9
No. of jobs per Week
No. of bids per Week

28
Table 6 Trend Periods and Data as Postulated by Chouhan (2009)
Period Identifier Description of the Trend Period
A Learning
B Discovering
C Competitive
D Profit Gain
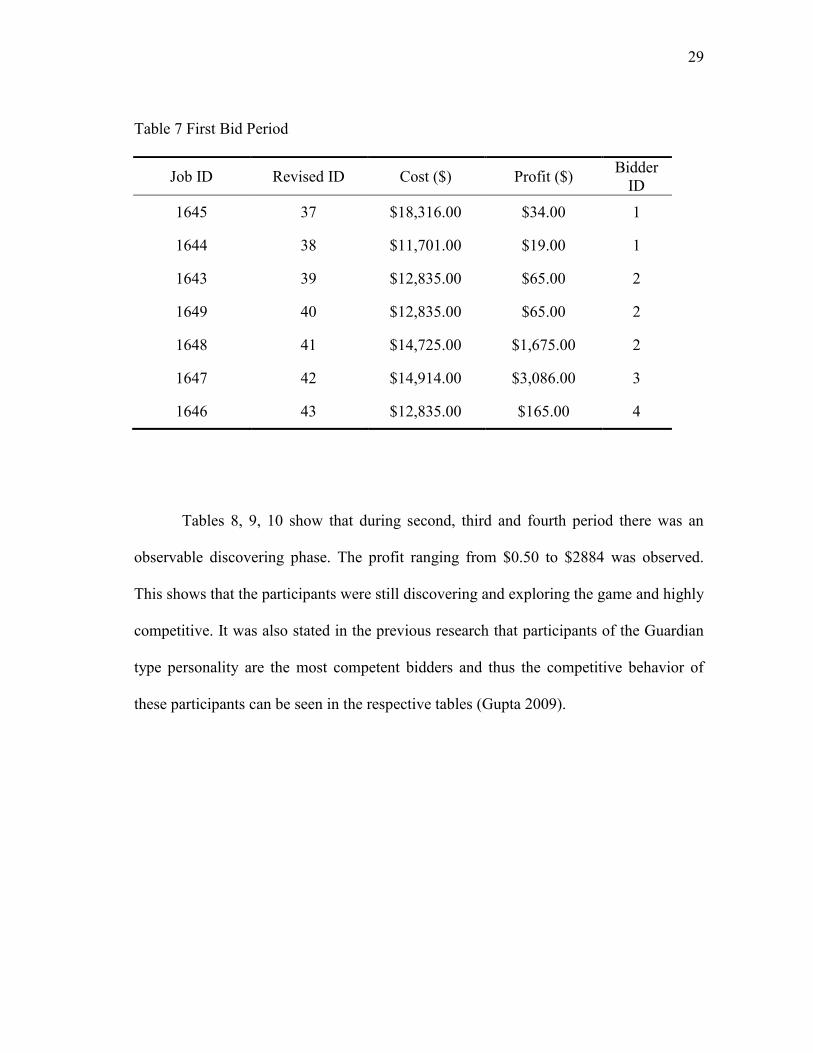
The analysis of the bidding trend of the current participants was done by dividing
the game into nine consecutive game sets. The profit gained by the winning bidder
assists in identifying the trend. Table 7 provides the profit data and the winner in the first
15 minutes of the game play. It can be seen that profits range from $19 to $3086. This
confirms that all the participants have not yet acquainted to the game play and are being
competitive. The data showed that they also made some errors in bidding process. This
tells us that it‟s their learning phase. The discovering trend of the participants is not
observable in this study which is not a typical.
29
Table 7 First Bid Period
Job ID Revised ID Cost ($) Profit ($) Bidder
ID
1645 37 $18,316.00 $34.00 1
1644 38 $11,701.00 $19.00 1
1643 39 $12,835.00 $65.00 2
1649 40 $12,835.00 $65.00 2
1648 41 $14,725.00 $1,675.00 2
1647 42 $14,914.00 $3,086.00 3
1646 43 $12,835.00 $165.00 4
Tables 8, 9, 10 show that during second, third and fourth period there was an
observable discovering phase. The profit ranging from $0.50 to $2884 was observed.
This shows that the participants were still discovering and exploring the game and highly
competitive. It was also stated in the previous research that participants of the Guardian
type personality are the most competent bidders and thus the competitive behavior of
these participants can be seen in the respective tables (Gupta 2009).

30
Table 8 Second Bid Period
Job ID Revised ID Cost ($) Profit ($) Bidder
ID
1613 7 $18,316.00 $1.00 4
1615 8 $18,316.00 $2,884.00 4
1616 9 $13,213.00 $2,786.00 4
1618 10 $12,835.00 $2,515.00 4
1619 11 $14,725.00 $1,275.00 4
1620 12 $13,213.00 $2,336.00 4
1621 13 $14,725.00 $25.00 4
1622 14 $18,316.00 $0.50 4
1625 15 $18,316.00 $33.00 4
1614 16 $11,701.00 $1,099.00 4
1617 17 $11,701.00 $749.00 4
1623 18 $11,701.00 $749.00 4
1624 19 $11,701.00 -$201.00 4
Table 9 Third Bid Period
Job ID Revised ID Cost ($) Profit ($) Bidder
ID
1627 20 $18,316.00 $184.00 1
1626 21 $11,701.00 $1,099.00 2
1628 22 $12,835.00 $565.00 2

31
Table 10 Forth Bid Period
Job ID Revised ID Cost ($) Profit ($) Bidder
ID
1630 23 $14,914.00 $1,086.00 1
1629 24 $18,316.00 $2,584.00 2
1631 25 $14,725.00 $2,275.00 2
1633 26 $18,316.00 $84.00 2
1632 27 $12,835.00 $2,165.00 3
Tables 11, 12, 13 show that during fifth, sixth and seventh period there was
extremely high competition. Everybody tried to win the bid even though the profit
margins were low. This is again atypical.
Table 11 Fifth Bid Period
Job ID Revised ID Cost ($) Profit ($) Bidder
ID
1634 28 $14,725.00 $275.00 2
1635 29 $11,701.00 $199.00 2
1636 30 $13,213.00 $687.00 2
1638 31 $14,914.00 -$14.00 2
1641 32 $13,213.00 $1.00 4
1637 33 $12,835.00 $5.00 4
1639 34 $18,316.00 $2.00 4
1640 35 $18,316.00 $1.00 4
1642 36 $14,914.00 $1.00 4

32
Table 12 Sixth Bid Period
Job ID Revised ID Cost ($) Profit ($) Bidder
ID
1645 37 $18,316.00 $34.00 1
1644 38 $11,701.00 $19.00 1
1643 39 $12,835.00 $65.00 2
1649 40 $12,835.00 $65.00 2
1648 41 $14,725.00 $1,675.00 2
1647 42 $14,914.00 $3,086.00 3
1646 43 $12,835.00 $165.00 4
Table 13 Seventh Bid Period
Job ID Revised ID Cost ($) Profit ($) Bidder
ID
1659 44 $18,316.00 $133.00 1
1650 45 $12,835.00 -$1.00 2
1652 46 $12,835.00 $1,155.00 3
1651 47 $14,725.00 $14.00 4
1653 48 $13,213.00 -$3.00 4
1654 49 $14,914.00 $636.00 4
1655 50 $11,701.00 $1,148.00 4
1656 51 $11,701.00 $299.00 4
1657 52 $14,914.00 $86.00 4
1658 53 $11,701.00 -$502.00 4
1660 54 $14,914.00 $285.00 4

33
During eighth and ninth bid period we can observe the maximum profit gain
range as shown in Tables 14, and 15. Even though there was one negative profit job in
ninth period, rest all jobs have a higher profit which matches the Chouhan theory.
Table 14 Eighth Bid Period
Job ID Revised ID Cost ($) Profit ($) Bidder
ID
1664 55 $11,701.00 $16,299.00 1
1661 56 $14,725.00 $5,275.00 2
1663 57 $13,213.00 $11,787.00 3
1662 58 $14,725.00 $5,274.00 4
Table 15 Ninth Bid Period
Job ID Revised ID Cost ($) Profit ($) Bidder
ID
1665 59 $12,835.00 $2,164.00 4
1666 60 $18,316.00 $2,683.00 4
1668 61 $14,725.00 $2,175.00 4
1669 62 $14,725.00 $2,274.00 4
1670 63 $12,835.00 -$175.00 4
1671 64 $14,914.00 $2,536.00 4
1673 65 $13,213.00 $5,787.00 4
1674 66 $12,835.00 $1,155.00 4
1667 67 $11,701.00 $2,049.00 4
1672 68 $11,701.00 $2,299.00 4
1675 69 $11,701.00 $2,669.00 4

34
Table 16 compares the results of the bid periods using the statistical t-test
analysis. This confirmed the bidding trends as postulated by Chouhan (2009). There was
significant difference in bidding period one and two. Again during fourth and fifth, there
was a very significant difference in bidding trend, which proved that the bidding trend
shifted from discovering to competitive phase. The same difference was observed in
seventh and eighth bidding period.
Table 16 Student‟s t-test Analysis
Bid Period Compared to t test value Difference
1 2 3.37 Significant
2 3 0.69 Not Significant
3 4 1.58 Not Significant
4 5 4.31 Very Significant
5 6 1.67 Not Significant
6 7 1.27 Not Significant
7 8 6.11 Extremely Significant
8 9 4.37 Significant
Fig. 7 represents the nature of the bidding during the course of the game. Four
different phases can be clearly marked and shown with the different colors as learning,
discovering, competitive and profit gain. The boxplot shows the profit range of the
participants. Fifth order polynomial trend line generated in the boxplot clearly identified

35
the four prominent trends of the bidding game. The trend is further increase by one
interval to predict the future of the profit gain for all the participants. The R-square value
of 0.808 shows a strong positive trend. Thus it can be said that during next rounds of the
bidding game with the same players, maximum profit gain can be achieved.
Figure 7. Boxplot for Profit
Fig. 8 represents a trend for the number of jobs against the number of bids. The
trend clearly identified that a steady increase in the number of bids is seen with the
increase in the number of jobs although the correlation is not so strong.

36
Figure 8. Number of Bids versus Number of Jobs
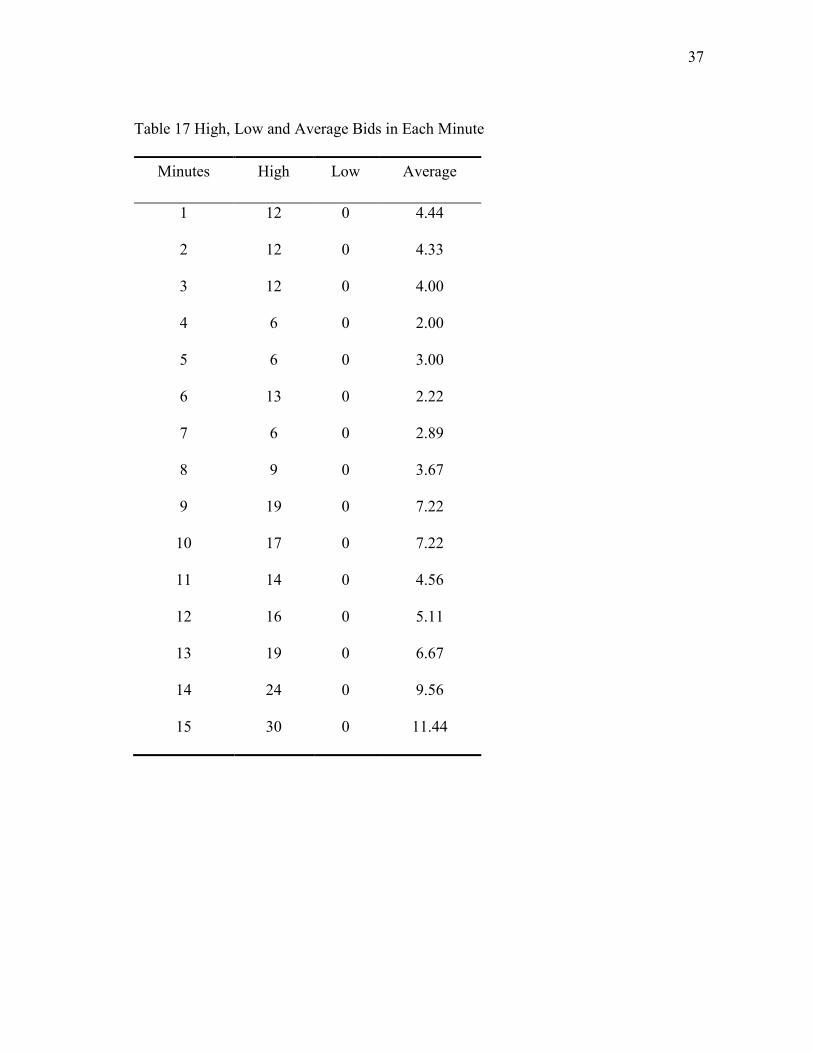
Table 17 and Fig. 9 show the number of bids in each minute of the bidding game
play. A trend is observed. During first minute period the average bids were 4.44 and
during last minute the average bids observed were 11.44. This is typical behavior.
y = 6x + 32.333
R² = 0.2099
0
20
40
60
80
100
120
140
160
0 2 4 6 8 10 12 14
No
. o
f b
ids
per
wee
k
No. of jobs per week
37
Table 17 High, Low and Average Bids in Each Minute
Minutes High Low Average
1 12 0 4.44
2 12 0 4.33
3 12 0 4.00
4 6 0 2.00
5 6 0 3.00
6 13 0 2.22
7 6 0 2.89
8 9 0 3.67
9 19 0 7.22
10 17 0 7.22
11 14 0 4.56
12 16 0 5.11
13 19 0 6.67
14 24 0 9.56
15 30 0 11.44

38
Figure 9. High, Low and Average Bid in Every Minute Boxplot
The trend line in Fig. 10 also shows an increase in the bidding. The R-square
value of 0.862 confirmed this trend for the polynomial fit.
y = -0.0002x6 + 0.0081x5 - 0.1632x4 + 1.5618x3 -
7.1255x2 + 13.482x - 3.5618
R² = 0.8889
0
5
10
15
20
25
30
35
1 2 3 4 5 6 7 8 9 10 11 12 13 14 15
No
. o
f b
ids
Minutes
High
Low
Average
Poly. (Average)

39
Figure 10. Trend of Average Bids per Minute
Table 18 summarizes the rank of the bidder along with number of jobs, number
of bids and bid efficiency. First bidder has a highest bid efficiency (Saigaonkar
2010).This matches previous results.
Table 18 Bid Efficiency of Each Personality
Rank Bidder No. of Bids No. of jobs Bid Efficiency
1 4 113 45 40%
2 3 202 4 2%
3 1 174 6 3%
4 2 219 14 6%
y = 0.0007x5 - 0.0269x4 + 0.3485x3 - 1.8044x2 + 3.1094x + 2.9338
R² = 0.8628
0.00
2.00
4.00
6.00
8.00
10.00
12.00
14.00
0 2 4 6 8 10 12 14 16
No
. o
f b
ids
Minutes

40
Fig. 11 and Table 19 represent the rank of the bidder along with their loan
amount and profit. It was clearly observed that rank one bidder took the minimum loan
but gained maximum profit. This result is contradicting the previously stated results by
Chouhan (2009), Peterson (2010), and Saigaonkar (2010) and requires further study.
Table 19 Bank Loan and Profit Data
Rank Loan Profit
1 500 44028.5
2 1000 18193
3 2000 17755
4 4000 14833

41
Figure 11. Bank Loan against Profit
0
5000
10000
15000
20000
25000
30000
35000
40000
45000
50000
0 1000 2000 3000 4000 5000
Pro
fit
Loan

42
Fig. 12 and Table 20 compare this study and the behavior of participants to the
previous studies conducted by Gupta (2010), Van Vleet (2004) and Saigaonkar (2010).
The participants from these prior researcher‟s study were selected because they had no
prior experience of bidding i.e. first time bidders. This is a key constraint to the current
work. All the previous studies studied the behavior of four major personalities
(Guardian, Rational, Artisan and Idealist), it is interesting to observe the pattern of four
of the role variants of the previously winning personality.
The normalized profit is achieved by dividing all the profits in every job, by the
maximum profit achieved. This procedure provides a maximum profit of one. The
number of jobs being offered to participants was again observed to be different in
previous studies (van Vleet, 2004; Saigaonkar, 2010; Gupta 2010), this is shown in
Table 20. Thus these were again normalized using the same procedure. This procedure
helps in making the comparison unbiased. It is clearly seen that the first time participants
are more competitive driving the profits in the lower range (0 to 0.11). Again a high
number of profits are observed in the range of 0.7 to 0.9. This indicates that during this
phase the bidders have the strong understanding of the game thus gaining a high profit
gain.

43
Figure 12. Number of Entries in the Each Normalized Profit Range
Table 20 shows the summation of total number of entries by Gupta (2010), Van
Vleet (2004) and Saigaonkar (2010) and this research during each normalized profit
period.
-20
-10
0
10
20
30
40
50
60
Normalized profit range
Shreyas
Saigaonkar
Van Vleet
Gupta
Poly. (Shreyas)
Poly. (Saigaonkar)
Poly. (Van Vleet)
Poly. (Gupta)

44
Table 20 Total Number of Entries in Normalized Profit Period
Bedekar Saigaonkar Van Vleet Gupta Total
<0 12 2 0 4 18
0-0.1 37 11 3 48 99
0.11-0.2 9 7 35 1 52
0.21-0.3 0 14 13 0 27
0.31-0.4 0 9 4 0 13
0.41-0.5 0 6 5 0 11
0.51-0.6 0 2 2 1 5
0.61-0.7 0 4 7 11 22
0.71-0.8 0 2 2 12 16
0.81-0.9 0 1 1 9 11
0.91-1.0 1 5 1 7 14
Fig. 13 and Fig. 14 show the observable strategic pattern of the first time bidders
in RAB. Fig. 13 shows the graph of total number of entries against the normalized profit
range period and Fig. 14 shows the graph of cumulative total number of entries against
the normalized profit range period.
It is very interesting to observe the competitive nature of the first time bidders in
RAB. It is clearly observed in Fig. 14 that 50% of the total number of entries is located
in the first 10% region of the normalized profit period.

45
Figure 13. Number of Entries Versus Normalized Profit Range
Figure 14. Number of Entries Versus Cumulative Normalized Profit Range
0
20
40
60
80
100
120
140
160
Normalized Profit Range
0
50
100
150
200
250
300
350
400
450
Normalized Profit Range

46
This study is a part of ongoing research on Reverse Auction Bidding at TAMU.
To summarize, the game was conducted between four participants of the Construction
Science Department who had no prior experience of RAB. Using KTS (Keirsey
Temperament Sorter) test, the personality testing was completed for the bidders. The
RAB game comprised 9 bidding periods, each 15 minutes long. The bidding data was
analyzed so as to obtain different strategic patterns of the bidding. The studies which
were carried out previously at TAMU analyzed different personalities, their competency
levels and the effect of interference of owner‟s agent during bidding. Different
personalities were tested in different competitive bidding scenario.
In this research, it is observed that the first time bidders have shown a significant
pattern in their bidding strategy. The bidders were extremely competitive throughout the
bidding, therefore the normalized profit level was very low. The profit gain phase started
very late. During profit gain phase, bidders had enough understanding of RAB and
nature of their competitors. The significant statistical pattern was found when the
research results were compared with the previous first time bidding results. In this study,
the bidder with the Guardian personality won majority of the jobs, hence confirmed the
theory that the Guardians are the most proficient bidders. Four different phases of
bidding namely learning, discovering, and competitive and profit gain were also
observed during bidding process, but some were not strongly shown.
CONCLUSIONS

47
This research was under the final phase of the preliminary study of RAB in
TAMU. It can be taken one step further by creating an algorithms and computerized
programs which will be designed to recognize the bidding strategy of the most efficient
bidders during RAB process. The study can also be taken to an extent that those
algorithms and programs will outbid that efficient bidder.

48
Angelo, W. J. (2002). Reverse Auctions and Mold Risks Are Worrying AGC
Contractors. ENR - Engineering News-Record 249(14), 1- 12.
Bosman, R. and A. Riedl. (2004). Emotions and Economic Shocks in First Price
Auctions: An Experimental Study, Amsterdam: EU-TMR Research Work.
Chaudary, S. (2009). [Unpublished Manuscript]. Reverse Auction Bidding. Construction
Science Department. College Station: Texas A&M University.
Chouhan, M. (2009). [Unpublished Manuscript]. Reverse Auction Bidding. College
Station: Texas A&M University.
Engelbrecht, T. and R. Wiggans (2007). Regret in Auctions: Theory and Evidence.
Industrial Marketing Management 34, 167-171.
Gregory, S. (2006). [Unpublished Manuscript]. Reverse Auction Bidding: Case Study.
College Station: Texas A&M University.
Guhya, D. (2010). [Unpublished Manuscript]. Reverse Auction Bidding: A Statisitcal
Review of the First Case Study. Construction Science Department. College Station:
Texas A&M University.
Gupta, A. (2010). [Unpublished Manuscript]. Reverse Auction Bidding: Studying the
Reverse Auction Bidding Game for the Role Variants of Guardians in the Facilities
Management Industry. Construction Science Department. College Station: Texas A&M
University.
Horlen, J., Eldin, N. and Ajinkya, Y. (2005). Reverse Auctions: Controversial Bidding
Practices. Journal of Professional Issues in Engineering Education and Practice 131(1),
76-81.
Jap, S. (2007). The Impact of Online Reverse Auction Design on Buyer – Supplies
Relationships. Journal of Marketing 71, 146 -159.
Machado, S. (2009). [Unpublished Manuscript]. Reverse Auction Bidding: Impact of
Bidder’s Personality on Reverse Auction Bidding. Construction Science Department.
College Station: Texas A&M University.
REFERENCES

49
Nichols, J. M. (2009). [Unpublished Manuscript]. Cost of Doing Business in the
Consulting Industry. Construction Science Department. College Station: Texas A&M
University.
Nichols, J. M. (2010). [Unpublished Manuscript]. Tacit Collusion in Reverse Auction
Bidding. Construction Science Department. College Station: Texas A&M University.
Panchal, N. (2007). [Unpublished Manuscript]. Reverse Auction Bidding: Case Study.
Construction Science Department. College Station: Texas A&M University.
Petersen, N. (2010). [Unpublished Manuscript]. Reverse Auction Bidding. Construction
Science Department. College Station: Texas A&M University.
Raghunathan, R. and M. Pham (1999). All Negative Moods Are Not Equal: Motivational
Influences of Anxiety and Sadness on Decision Making. Organizational Behaviour and
Human Performance 79, 56-77.
Rogers, G. (2010). [Unpublished Manuscript]. Reverse Auction Bidding - Suggested
Analysis Methods. Construction Science Department. College Station: Texas A&M
University.
Saigaonkar, S. (2010). [Unpublished Manuscript]. Reverse Auction of Bidding, Bidding
Personality, Its Significance and Impact on Returns. Construction Science Department.
College Station: Texas A&M University.
Staw, M. (1976). Knee-Deep in the Big Muddy: A Study of Escalating Commitment to a
Chosen Course of Action. Organizational Behavior and Human Performance 16(1), 27 -
44.
Sushil, C. (2009). [Unpublished Manuscript]. Reverse Auction Bidding: Owner’s
Interface in Reverse Auction Bidding to Skew a Free Market. Construction Science
Department. College Station: Texas A&M University.
Tieger, P. D. and B. B. Tieger (1999). The Art of Speed Reading People. New York:
Little, Brown and Company.
van Vleet, R. G. (2004). [Unpublished Manuscript]. Reverse Auction Bidding: An
Analysis of a Case Study. Construction Science Department. College Station: Texas
A&M University.
Wellington, V. (2006). [Unpublished Manuscript]. SQL Database Development for
Reverse Auction Bidding Site at Texas A&M University. Construction Science
Department. College Station: Texas A&M University.

50
KEIRSEY TEMPERAMENT SORTER TEST
Test method
This test is taken from ………………………………………………………
For each question, decide on answer a or b and put a check mark in the
proper column of the answer sheet. Scoring directions are provided. There is no
right or wrong answers since about half the population agrees with whatever answer
you choose.
1. When the phone rings do you
a. hurry to get to it first
b. hope someone will
answer
2. Are you more
a. observant than
introspective
b. introspective than
observant
3. Is it worse to
a. have your head in the
clouds
b. be in a rut
4. With people are you usually
more
a. firm than gentle
b. gentle than firm
5. Are you more comfortable in
making
a. critical judgments
b. value judgments
6. Is clutter in the workplace
something you
a. take time to straighten up
b. tolerate pretty well
7. Is it your way to
a. make up your mind
quickly
b. pick an choose at some
length
8. Waiting in line, do you often
a. chat with others
b. stick to business
9. Are you more
a. sensible than ideational
b. ideational than sensible
10. Are you more interested in
a. what is actual
b. what is possible
11. In making up your mind are you
more likely
a. to go by data
b. to go by desires
12. In sizing up others do you tend
to be
a. objective and impersonal
b. friendly and personal
13. Do you prefer contracts to be
a. signed, sealed, and
delivered
b. settled on a handshake
14. Are you more satisfied having
a. a finished product
b. work in progress
15. At a party, do you
a. interact with many, even
strangers
APPENDIX A

51
b. interact with a few
friends
16. Do you tend to be more
a. factual than speculative
b. speculative than factual
17. Do you like writers who
a. say what they mean
b. use metaphors and
symbolism
18. Which appeals to you more:
a. consistency of thought
b. harmonious relationships
19. If you must disappoint someone
are you
a. usually frank and
straightforward
b. warm and considerate
20. On the job do you want your
activities
a. scheduled
b. unscheduled
21. Do you more often prefer
a. final, unalterable
statements
b. tentative, preliminary
statements
22. Does interacting with strangers
a. energize you
b. tax your reserves
23. Facts
a. speak for themselves
b. illustrate principles
24. Do you find visionaries and
theorists
a. somewhat annoying
b. rather fascinating
25. In a heated discussion, do you
a. stick to your guns
b. look for common ground
26. Is it better to be
a. Just
b. merciful
27. At work, is it more natural for
you to
a. point out mistakes
b. try to please others
28. Are you more comfortable
a. after a decision
b. before a decision
29. Do you tend to
a. say right out what‟s on
your mind
b. keep your ears open
30. Common sense is
a. usually reliable
b. frequently questionable
31. Children often do not
a. make themselves useful
enough
b. exercise their fantasy
enough
32. When in charge of others do you
tend to be
a. firm and unbending
b. forgiving and lenient
33. Are you more often
a. a cool-headed person
b. a warm-hearted person
34. Are you prone to
a. nailing things down
b. exploring the possibilities
35. In most situations are you more
a. deliberate than
spontaneous
b. spontaneous than
deliberate
36. Do you think of yourself as
a. an outgoing person
b. a private person
37. Are you more frequently
a. a practical sort of person
b. a fanciful sort of person
38. Do you speak more in
a. particulars than
generalities
b. generalities than
particular
39. Which is more of a compliment:

52
a. “There‟s a logical
person”
b. “There‟s a sentimental
person”
40. Which rules you more
a. your thoughts
b. your feelings
41. When finishing a job, do you
like to
a. tie up all the loose ends
b. move on to something
else
42. Do you prefer to work
a. to deadlines
b. just whenever
43. Are you the kind of person who
a. is rather talkative
b. doesn‟t miss much
44. Are you inclined to take what is
said
a. more literally
b. more figuratively
45. Do you more often see
a. what‟s right in front of
you
b. what can only be
imagined
46. Is it worse to be
a. softy
b. hard-nosed
47. In trying circumstances are you
sometimes
a. too unsympathetic
b. too sympathetic
48. Do you tend to choose
a. rather carefully
b. somewhat impulsively
49. Are you inclined to be more
a. hurried than leisurely
b. leisurely than hurried
50. At work do you tend to
a. be sociable with your
colleagues
b. keep more to yourself
51. Are you more likely to trust
a. your experiences
b. your conceptions
52. Are you more inclined to feel
a. down to earth
b. somewhat removed
53. Do you think of yourself as a
a. tough-minded person
b. tender-hearted person
54. Do you value in yourself more
that you are
a. reasonable
b. devoted
55. Do you usually want things
a. settled and decided
b. just penciled in
56. Would you say you are more
a. serious and determined
b. easy going
57. Do you consider yourself
a. a good conversationalist
b. a good listener
58. Do you prize in yourself
a. a strong hold on reality
b. a vivid imagination
59. Are you drawn more to
a. fundamentals
b. overtones
60. Which seems the greater fault
a. to be too compassionate
b. to be too dispassionate
61. Are you swayed more by
a. convincing evidence
b. a touching appeal
62. Do you feel better about
a. coming to closure
b. keeping your options
open
63. Is it preferable mostly to
a. make sure things are
arranged
b. just let things happen
naturally
64. Are you inclined to be

53
a. easy to approach
b. somewhat reserved
65. In stories do you prefer
a. action and adventure
b. fantasy and heroism
66. Is it easier for you to
a. put others to good use
b. identify with others
67. Which do you wish more for
yourself:
a. strength of will
b. strength of emotion
68. Do you see yourself as basically
a. thick-skinned
b. thin-skinned
69. Do you tend to notice
a. disorderliness
b. opportunities for change
70. Are you more
a. routinized than
whimsical
b. whimsical than
routinized

54
Scoring Method and Answer Sheet
Enter a check for each answer in the column for a or b
a b a b a b a b a b a b a b
1 2 3 4 5 6 7
8 9 10 11 12 13 14
15 16 17 18 19 20 21
22 23 24 25 26 27 28
29 30 31 32 33 34 35
36 37 38 39 40 41 42
43 44 45 46 47 48 49
50 51 52 53 54 55 56
57 58 59 60 61 62 63
64 65 66 67 68 69 70
1 2 3 4 3 4 5 6 5 6 7 8 7
2
3 4
5 6
7
E I S N T F J P
1

55
Directions for Scoring
These scoring directions are obtained from
Add down so that the total number of a answers is written in the box at
the bottom of each column. Do the same for the b answers you have
checked. Each of the 14 boxes should have a number it.
Transfer the number in box #1 of the answer grid to box #1 below the
answer grid. Do this for box # 2 as well. Note, however, that you have
two numbers for boxes 3 through 8. Bring down the first number for each
box beneath the second, as indicated by the arrows. Now add all the
pairs of numbers and enter the total in the boxes below the answer grid,
so each box has only one number.
Now you have four pairs of numbers. Circle the letter below the larger
numbers of each pair. If the two numbers of any pair are equal, then
circle neither, but put a large X below them and circle it.

56
APPENDIX B
IRB – APPROVAL FORM

57
Name: Shreyas Vinayak Bedekar
Address: 3137 TAMU, Langford Building A, Room 422,
Department of Construction Science, College of
Architecture, Texas A&M University, College
Station, Texas 77843-3137
Email Address: [email protected]
Education: B.E. (Civil Engineering), Walchand College of
Engineering, Sangli, India, 2006
M.S., Construction Management, Texas A&M
University, College Station, Texas, 2010
VITA