reverse engineering the ancient ceramic technology based...
TRANSCRIPT
Reverse engineering the ancient ceramic technology based on X-rayfluorescence spectromicroscopy†
Philippe Sciau,*a Yoanna Leon,a Philippe Goudeau,b Sirine C. Fakra,c Sam Webbd and Apurva Mehtad
Received 22nd November 2010, Accepted 15th February 2011
DOI: 10.1039/c0ja00212g
We present results of X-ray fluorescence (XRF) microprobe analyses of ancient ceramic cross-sections
aiming at deciphering the different firing protocols used for their production. Micro-focused XRF
elemental mapping, Fe chemical mapping and Fe K-edge X-ray absorption near edge structure
spectroscopy were performed on pre-sigillata ceramics from southern Gaul, and terra Sigillata vessels
from Italy and southern Gaul. Pieces from the different workshops and regions showed significant
difference in the starting clay material, clay conditioning and kiln firing condition. By contrast, sherds
from the same workshop exhibited more subtle differences and possible misfirings. Understanding the
precise firing conditions and protocols would allow recreation of kilns for various productions.
Furthermore, evolution and modification of kiln design would shed some light on how ancient potters
devised solutions to diverse technological problems they encountered.
Introduction
The ceramic production in the Greek and Roman periods
reached new heights, through the development of high-gloss
surface finishes and control of color (red or black) through
vitrification and redox chemistry of an iron oxide-rich clay
material.1–6 From settling and decantation of the starting clay,
a liquid slip was prepared. Vessels were either painted or dipped
into this liquid clay slip before firing. The high-gloss black
coatings were the first ceramics of this kind produced. They are
the famous Attic vessels,1 first developed and perfected by the
Athenians at the late 6th century BC, but were also produced in
other parts of Greece and Greek colonies.7 The Greek pottery
technology further developed to produce several types of red
slips and at its pinnacle was creating iconic red and black vessels.
The manufacture of the high-gloss black pottery continued in to
the Roman period and in particular through the production of
Campanian tableware.2,3
aCNRS, CEMES, Universit�e de Toulouse, 29 rue J. Marvig, F-31055Toulouse, France. E-mail: [email protected]; Fax: +33562257999;Tel: +33562257850bInstitut Pprime, CNRS, Universit�e de Poitiers, ENSMA, Bd Marie etPierre Curie, F-86962 Futuroscope Chasseneuil, France. E-mail: [email protected]; Fax: +33 549496692; Tel: +33 549496726cALS, Lawrence Berkeley National Lab, 1 Cyclotron Road, Berkeley, CA,94720, USA. E-mail: [email protected]; Fax: +1 5104864102; Tel: +15104952855dSSRL, SLAC, 2575, Sand Hill Road, Menlo Park, CA, 94025, USA.E-mail: [email protected]; Fax: +1 6509264791; Tel: +16509264791
† This article is part of a themed issue highlighting the latest research inthe area of synchrotron radiation in art and archaeometry.
The vessels with black slip were fired at high temperature and
in reducing conditions to sinter the slips. On cooling, oxygen was
unable to diffuse into the more vitrified slips keeping them black,
whereas the more porous material re-oxidized becoming red. A
key technological development in production of these vessels was
the control of the macro- and nanoscale porosity, and the control
of the redox atmosphere of the firing kiln. The vessels with high-
gloss red slips, on the other hand, were sintered under oxidizing
conditions. The challenge here was to maintain a sufficiently
oxidizing condition at high temperatures in a wood-fired kiln.
For both color of glosses, once the slips began to vitrify, the
process of re-oxidation was difficult to control, resulting in parts
of slips intended to be black accidentally turning red, and red
slips coming out of the kiln non-uniform in shade. The fully
oxidized slips were brick red whereas the less oxidized were dull
brown or even grey. The Romans overcame these difficulties by
improved kiln designs that enabled production of Terra Sigillata,
a fine Roman tableware ceramic generated in industrial quantity
by a few large workshops. In these new kilns the vessels were
isolated from the flames and the products of wood combustion,
such as smoke, soot and other unburned hydrocarbons,4,8,9 lead
to the fabrication of thousands of vessels with high gloss and very
homogeneous red color.10
The practitioners of this complex and evolving technology
must have paid a lot of attention to the nature of the starting
clay, and the master potters must have understood intricacies of
firing Fe-rich clay sufficiently well to develop the kilns through
the different stages as the pottery evolved. Unfortunately,
however, very few kilns from this period have been discovered
during the excavations of pottery workshops and even when
a few were discovered not much of it was found besides the base.
Over the past decade several state of the art characterization
techniques, such as synchrotron based micro-focused beam
X-ray Fluorescence (mXRF) and X-ray Absorption Near Edge
Structure (mXANES) spectroscopy have been used to study
archeological and cultural heritage material. Here, we have
applied these techniques to study the local mineralogy and map
the Fe valence state, to better understand the firing technology
used to produce these remarkable vessels. In that respect we are
following in the foot-steps of previous pioneers, such as Manolis
Pantos and his group at Daresbury (UK) who have investigated
Greek, Roman and Etruria ceramics using synchrotron based
techniques and showed for instance that the magnetite/hercynite
ratio varies greatly between different productions.11,12 Unfortu-
nately, however, in their studies, the size of beam was greater
than 50 mm, whereas the slip layers on most of these vessels are
between 20 and 40 mm thick, making it impossible to map
precisely the spatial distribution of iron oxides and other asso-
ciated mineral phases in the slip. The distribution of Fe minerals
in the slips provides important clues into the technology used to
make sophisticated ceramic that are still challenging to replicate
to these days. Furthermore probing the firing protocol, kiln
atmosphere and slip composition are key features for assessing
the production quality of the potteries.
Here, we performed synchrotron based micro-focused X-ray
Fluorescence (mXRF) and X-ray Absorption Near Edge Struc-
ture (mXANES) spectroscopy on pottery specimen cross-sections
previously prepared for scanning electron microscopy (SEM) or
electron microprobe analyses. We used a micro-X-ray beam to
map the mineralogy of the ceramic samples and show that the
essential aspect of the firing protocol can be traced back from the
nature and the spatial distribution of iron oxides in the slip and
the body. Moreover, we performed in depth iron valence distri-
bution mapping to gain information on the redox conditions and
the temperatures undergone by the ceramics, crucial for reverse
engineering the technology.
To further our understanding of the evolution of the ceramic
technology of this period, we studied vessels produced by
different technologies, but from the same workshop, La Grau-
fesenque (Millau, France), the leading Gallic workshop of the
first century AD.13–15 Before starting the production of high
quality sigillata, La Graufesenque generated ceramics that
imitated the Italian sigillata forms (more often called pre-sigil-
lata).16 The slip, like the Italian and earlier Attica ware, was made
by the application of a fine-textured clay applied to a coarser-
textured clay body. From the color (black and/or red) and aspect
(mainly non-vitrified) of the pre-sigillata tableware it is evident
that these vessels were not fired in the special, highly oxidizing
kilns used for the sigillata production but in traditional kilns
where ceramics were in contact with flames. Thus, the atmo-
sphere during the heating phase was often reducing and the
degree of reduction depended on the presence and amount of
smoke in the heating phase. There was a little more control of the
atmosphere in the kiln during the cooling step, through control
of ventilation. Depending on sufficiently more reducing (or
oxidizing) redox conditions on cooling, black (or red respec-
tively) body and slip resulted.17 Potters were attempting to reach
a high enough temperature during the heating phase, and in some
cases achieved it, to vitrify the slip and produce impermeable
glossy black coating, and if the cooling was sufficiently oxidizing
brown or red body. Initially these vessels were considered
a consequence of a research phase in which the Gallic potters
tried to re-invent the black-gloss ceramic process, but lately
many consider these vessels as a specific type of pottery produced
for the market. Therefore, different terms are used to classify
these vessels based on whether one wants to emphasize either
their relationship with Italian sigillata (imitations) or their
chronology and refer to them as pre-sigillata or proto-sigillata.
The goal of this paper is to show how we can get more precise
information on the firing protocol used in the pre-sigillata
productions through a comparative investigation between pre-
sigillata, Italian and Gallic sigillata previously studied by X-ray
diffraction (XRD), Raman spectroscopy and electron micros-
copy.18–21 For this purpose, we selected different sherds in the
three groups: two Italian terra sigillata from Arezzo (Italy), two
Gallic terra sigillata from La Graufesenque (France) and five pre-
sigillata from La Graufesenque and Bram (France). Archaeo-
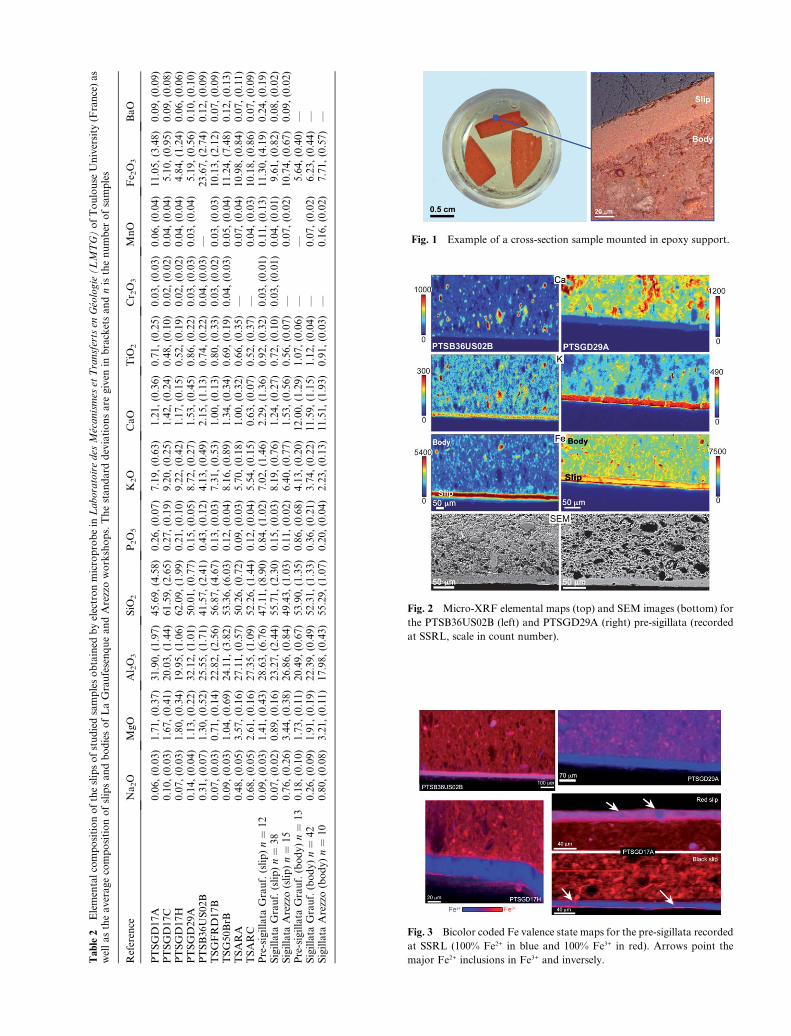
logical details are given in Table 1. Table 2 reports the global
elemental composition of the slip of individual sherds and the
average value for each group. The elemental and mineral
compositions of each type of terra sigillata slip—Italian and
Gallic—form two distinctive homogenous groups.19,21,22 The
main phases in the Gallic slips are corundum, hematite and
quartz while in the Italian slips, spinel, hematite and quartz were
found.18,23 By contrast, the pre-sigillata slips do not constitute
a homogeneous group and the elemental and mineral composi-
tions vary greatly from one sample to another.19
Experimental details
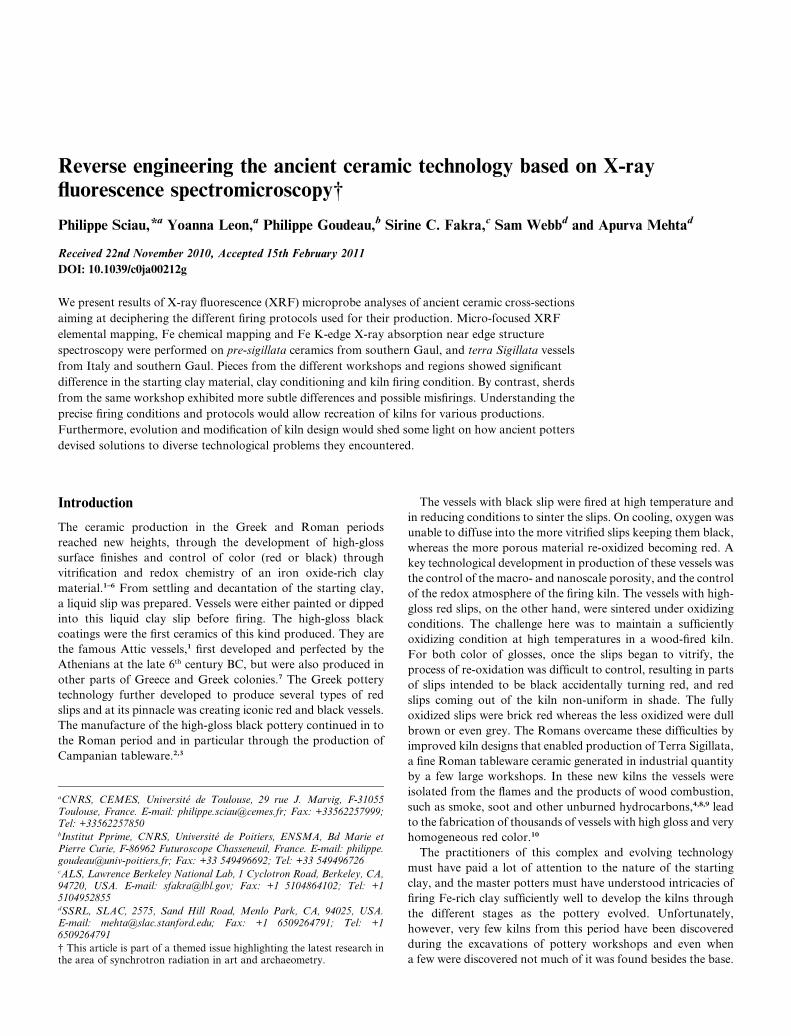
X-Ray microprobe measurements were directly performed on the
polished cross-sections made for previous electron microprobe
analyses. The sherds were cut with a diamond saw and the
resulting sections were mounted in epoxy and mechanically
polished as shown in Fig. 1.
Micro-XRF and mXANES measurements were performed on
Beamline 2.3 of the Stanford Synchrotron Radiation Lightsource
(Stanford, USA) and on Beamline 10.3.2 of the Advanced Light
Source (Lawrence Berkeley National Lab, USA).24
Coarse mXRF elemental maps were first acquired at 10 keV
with a seven-element Ge solid-state detector (Canberra) using
a pixel size of 20 mm � 20 mm and a counting time of 50 ms per
pixel to locate areas of interest. Fluorescence emission counts
were collected for Fe, K, Ca, and Ti, and several other elements.
High resolution Fe chemical maps were then acquired on these
areas at several incident energies 7100 (pre-edge background),
7122, 7134 and 7138 eV with a beam size of 2.5 mm � 2 mm (on
the sample), pixel size of 2 mm � 2 mm and a counting time of
50 ms per pixel. The middle two energies, 7122 and 7134 eV, were
selected to give the highest positive and negative contrast
between Fe2+ (e.g., hercynite) and Fe3+ (e.g., hematite) respec-
tively. The fluorescence yield difference between Fe2+ and Fe3+ is
not large at 7100 and 7138 eV and therefore those two energies
were selected to normalize the difference in the fluorescence
signal due to differences in Fe concentration. The individual
energy maps were normalized, deadtime corrected and registered
to each other to correct for small spatial drifts. Amount of Fe2+
and Fe3+ at every pixel was estimated from the least square fit of
the fluorescence yields at the four energies to background and
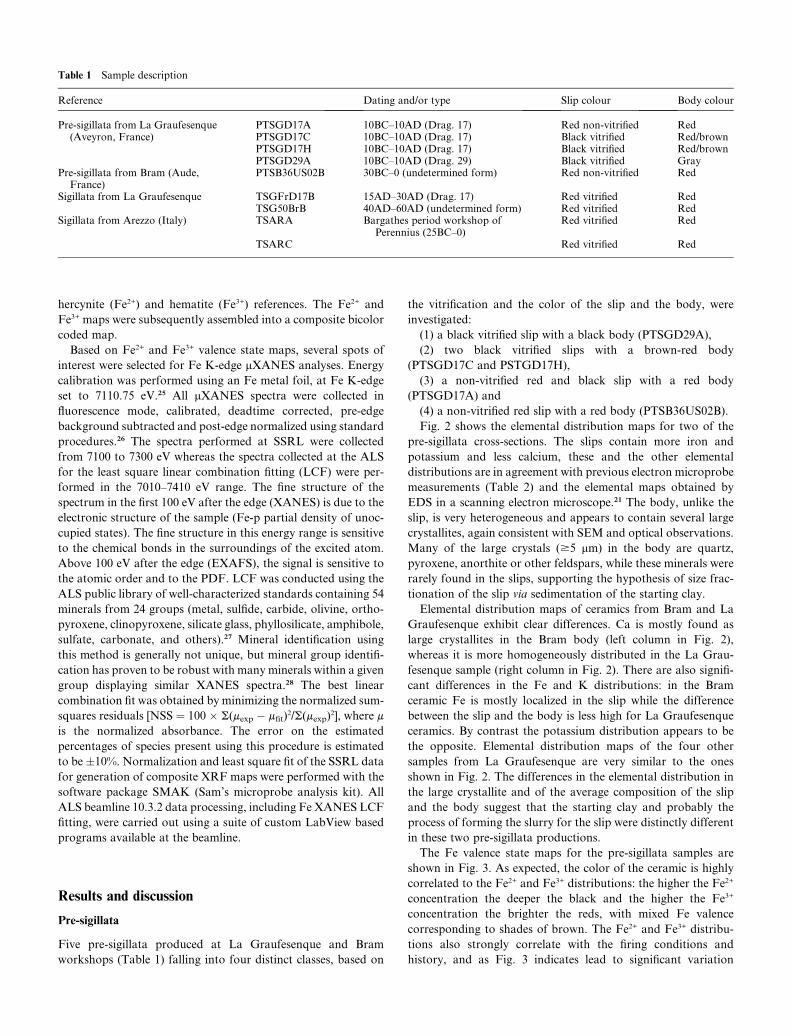
Table 1 Sample description
Reference Dating and/or type Slip colour Body colour
Pre-sigillata from La Graufesenque(Aveyron, France)
PTSGD17A 10BC–10AD (Drag. 17) Red non-vitrified RedPTSGD17C 10BC–10AD (Drag. 17) Black vitrified Red/brownPTSGD17H 10BC–10AD (Drag. 17) Black vitrified Red/brownPTSGD29A 10BC–10AD (Drag. 29) Black vitrified Gray
Pre-sigillata from Bram (Aude,France)
PTSB36US02B 30BC–0 (undetermined form) Red non-vitrified Red
Sigillata from La Graufesenque TSGFrD17B 15AD–30AD (Drag. 17) Red vitrified RedTSG50BrB 40AD–60AD (undetermined form) Red vitrified Red
Sigillata from Arezzo (Italy) TSARA Bargathes period workshop ofPerennius (25BC–0)
Red vitrified Red
TSARC Red vitrified Red
hercynite (Fe2+) and hematite (Fe3+) references. The Fe2+ and
Fe3+ maps were subsequently assembled into a composite bicolor
coded map.
Based on Fe2+ and Fe3+ valence state maps, several spots of
interest were selected for Fe K-edge mXANES analyses. Energy
calibration was performed using an Fe metal foil, at Fe K-edge
set to 7110.75 eV.25 All mXANES spectra were collected in
fluorescence mode, calibrated, deadtime corrected, pre-edge
background subtracted and post-edge normalized using standard
procedures.26 The spectra performed at SSRL were collected
from 7100 to 7300 eV whereas the spectra collected at the ALS
for the least square linear combination fitting (LCF) were per-
formed in the 7010–7410 eV range. The fine structure of the
spectrum in the first 100 eV after the edge (XANES) is due to the
electronic structure of the sample (Fe-p partial density of unoc-
cupied states). The fine structure in this energy range is sensitive
to the chemical bonds in the surroundings of the excited atom.
Above 100 eV after the edge (EXAFS), the signal is sensitive to
the atomic order and to the PDF. LCF was conducted using the
ALS public library of well-characterized standards containing 54
minerals from 24 groups (metal, sulfide, carbide, olivine, ortho-
pyroxene, clinopyroxene, silicate glass, phyllosilicate, amphibole,
sulfate, carbonate, and others).27 Mineral identification using
this method is generally not unique, but mineral group identifi-
cation has proven to be robust with many minerals within a given
group displaying similar XANES spectra.28 The best linear
combination fit was obtained by minimizing the normalized sum-
squares residuals [NSS ¼ 100 � S(mexp � mfit)2/S(mexp)2], where m
is the normalized absorbance. The error on the estimated
percentages of species present using this procedure is estimated
to be�10%. Normalization and least square fit of the SSRL data
for generation of composite XRF maps were performed with the
software package SMAK (Sam’s microprobe analysis kit). All
ALS beamline 10.3.2 data processing, including Fe XANES LCF
fitting, were carried out using a suite of custom LabView based
programs available at the beamline.
Results and discussion
Pre-sigillata
Five pre-sigillata produced at La Graufesenque and Bram
workshops (Table 1) falling into four distinct classes, based on
the vitrification and the color of the slip and the body, were
investigated:
(1) a black vitrified slip with a black body (PTSGD29A),
(2) two black vitrified slips with a brown-red body
(PTSGD17C and PSTGD17H),
(3) a non-vitrified red and black slip with a red body
(PTSGD17A) and
(4) a non-vitrified red slip with a red body (PTSB36US02B).
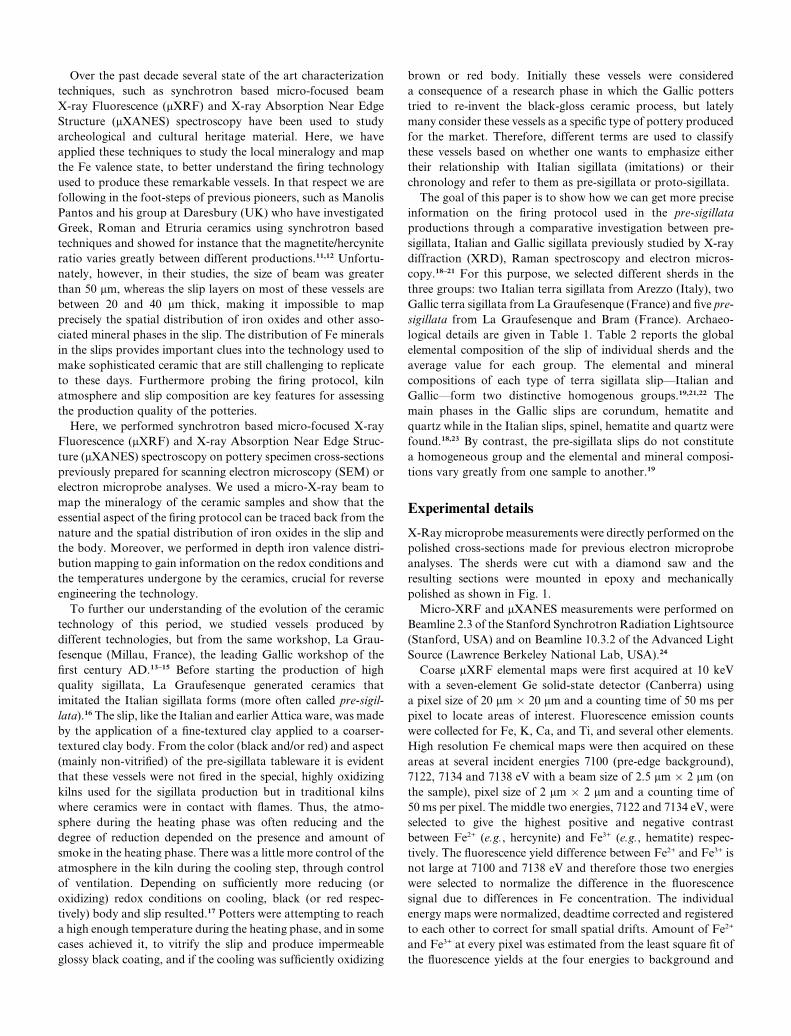
Fig. 2 shows the elemental distribution maps for two of the
pre-sigillata cross-sections. The slips contain more iron and
potassium and less calcium, these and the other elemental
distributions are in agreement with previous electron microprobe
measurements (Table 2) and the elemental maps obtained by
EDS in a scanning electron microscope.21 The body, unlike the
slip, is very heterogeneous and appears to contain several large
crystallites, again consistent with SEM and optical observations.
Many of the large crystals ($5 mm) in the body are quartz,
pyroxene, anorthite or other feldspars, while these minerals were
rarely found in the slips, supporting the hypothesis of size frac-
tionation of the slip via sedimentation of the starting clay.
Elemental distribution maps of ceramics from Bram and La
Graufesenque exhibit clear differences. Ca is mostly found as
large crystallites in the Bram body (left column in Fig. 2),
whereas it is more homogeneously distributed in the La Grau-
fesenque sample (right column in Fig. 2). There are also signifi-
cant differences in the Fe and K distributions: in the Bram
ceramic Fe is mostly localized in the slip while the difference
between the slip and the body is less high for La Graufesenque
ceramics. By contrast the potassium distribution appears to be
the opposite. Elemental distribution maps of the four other
samples from La Graufesenque are very similar to the ones
shown in Fig. 2. The differences in the elemental distribution in
the large crystallite and of the average composition of the slip
and the body suggest that the starting clay and probably the
process of forming the slurry for the slip were distinctly different
in these two pre-sigillata productions.
The Fe valence state maps for the pre-sigillata samples are
shown in Fig. 3. As expected, the color of the ceramic is highly
correlated to the Fe2+ and Fe3+ distributions: the higher the Fe2+
concentration the deeper the black and the higher the Fe3+
concentration the brighter the reds, with mixed Fe valence
corresponding to shades of brown. The Fe2+ and Fe3+ distribu-
tions also strongly correlate with the firing conditions and
history, and as Fig. 3 indicates lead to significant variation
Ta
ble
2E
lem
enta
lco
mp
osi
tio
no
fth
esl
ips
of
stu
die
dsa
mp
les
ob
tain
edb
yel
ectr
on
mic
rop
rob
ein
Lab
ora
toir
ed
esM
� eca
nis
mes
etT
ran
sfer
tsen
G� eo
log
ie(
LM
TG
)o
fT
ou
lou
seU
niv
ersi
ty(F
ran
ce)
as
wel
la
sth
ea
ver
ag
eco
mp
osi
tio
no
fsl
ips
an
db
od
ies
of
La
Gra
ufe
sen
qu
ea
nd
Are
zzo
wo
rksh
op
s.T
he
sta
nd
ard
dev
iati
on
sa
reg
iven
inb
rack
ets
an
dn
isth
en
um
ber
of
sam
ple
s
Ref
eren
ceN
a2O
Mg
OA
l 2O
3S
iO2
P2O
5K
2O
Ca
OT
iO2
Cr 2
O3
Mn
OF
e 2O
3B
aO
PT
SG
D1
7A
0.0
6,
(0.0
3)
1.7
1,
(0.3
7)
31
.90,
(1.9
7)
45
.69,
(4.5
8)
0.2
6,
(0.0
7)
7.1
9,
(0.6
3)
1.2
1,
(0.3
6)
0.7
1,
(0.2
5)
0.0
3,
(0.0
3)
0.0
6,
(0.0
4)
11
.05
,(3
.48
)0
.09
,(0
.09
)P
TS
GD
17
C0
.10
,(0
.03
)1
.67
,(0
.41
)2
0.0
3,
(1.4
4)
61
.59,
(2.6
5)
0.2
7,
(0.1
9)
9.2
0,
(0.2
5)
1.4
2,
(0.2
4)
0.4
8,
(0.1
0)
0.0
2,
(0.0
2)
0.0
4,
(0.0
4)
5.1
0,
(0.9
5)
0.0
9,
(0.0
8)
PT
SG
D1
7H
0.0
7,
(0.0
3)
1.8
0,
(0.3
4)
19
.95,
(1.0
6)
62
.09,
(1.9
9)
0.2
1,
(0.1
0)
9.2
2,
(0.4
2)
1.1
7,
(0.1
5)
0.5
2,
(0.1
9)
0.0
2,
(0.0
2)
0.0
4,
(0.0
4)
4.8
4,
(1.2
4)
0.0
6,
(0.0
6)
PT
SG
D2
9A
0.1
4,
(0.0
4)
1.1
3,
(0.2
2)
32
.12,
(1.0
1)
50
.01,
(0.7
7)
0.1
5,
(0.0
5)
8.7
2,
(0.2
7)
1.5
3,
(0.4
5)
0.8
6,
(0.2
2)
0.0
3,
(0.0
3)
0.0
3,
(0.0
4)
5.1
9,
(0.5
6)
0.1
0,
(0.1
0)
PT
SB
36
US
02B
0.3
1,
(0.0
7)
1.3
0,
(0.5
2)
25
.55,
(1.7
1)
41
.57,
(2.4
1)
0.4
3,
(0.1
2)
4.1
3,
(0.4
9)
2.1
5,
(1.1
3)
0.7
4,
(0.2
2)
0.0
4,
(0.0
3)
—2
3.6
7,
(2.7
4)
0.1
2,
(0.0
9)
TS
GF
RD
17
B0
.07
,(0
.03
)0
.71
,(0
.14
)2
2.8
2,
(2.5
6)
56
.87,
(4.6
7)
0.1
3,
(0.0
3)
7.3
1,
(0.5
3)
1.0
0,
(0.1
3)
0.8
0,
(0.3
3)
0.0
3,
(0.0
2)
0.0
3,
(0.0
3)
10
.13
,(2
.12
)0
.07
,(0
.09
)T
SG
50
BrB
0.0
9,
(0.0
3)
1.0
4,
(0.6
9)
24
.11,
(3.8
2)
53
.36,
(6.0
3)
0.1
2,
(0.0
4)
8.1
6,
(0.8
9)
1.3
4,
(0.3
4)
0.6
9,
(0.1
9)
0.0
4,
(0.0
3)
0.0
5,
(0.0
4)
11
.24
,(7
.48
)0
.12
,(0
.13
)T
SA
RA
0.4
8,
(0.0
5)
3.5
7,
(0.1
6)
27
.11,
(0.5
7)
50
.26,
(0.7
2)
0.0
9,
(0.0
3)
5.7
0,
(0.1
8)
1.0
0,
(0.3
2)
0.6
6,
(0.3
5)
—0
.07
,(0
.04
)1
0.9
8,
(0.8
4)
0.0
7,
(0.1
1)
TS
AR
C0
.68
,(0
.05
)2
.61
,(0
.16
)2
7.3
5,
(1.0
9)
52
.26,
(1.4
4)
0.1
2,
(0.0
4)
5.5
4,
(0.1
5)
0.6
3,
(0.0
7)
0.5
2,
(0.3
7)
—0
.04
,(0
.03
)1
0.1
8,
(0.8
6)
0.0
7,
(0.0
9)
Pre
-sig
illa
taG
rau
f.(s
lip
)n¼
12
0.0
9,
(0.0
3)
1.4
1,
(0.4
3)
28
.63,
(6.7
6)
47
.11,
(8.9
0)
0.8
4,
(1.0
2)
7.0
2,
(1.4
6)
2.2
9,
(1.3
6)
0.9
2,
(0.3
2)
0.0
3,
(0.0
1)
0.1
1,
(0.1
3)
11
.30
,(4
.19
)0
.24
,(0
.19
)S
igil
lata
Gra
uf.
(sli
p)
n¼
38
0.0
7,
(0.0
2)
0.8
9,
(0.1
6)
23
.27,
(2.4
4)
55
.71,
(2.3
0)
0.1
5,
(0.0
3)
8.1
9,
(0.7
6)
1.2
4,
(0.2
7)
0.7
2,
(0.1
0)
0.0
3,
(0.0
1)
0.0
4,
(0.0
1)
9.6
1,
(0.8
2)
0.0
8,
(0.0
2)
Sig
illa
taA
rezz
o(s
lip
)n¼
15
0.7
6,
(0.2
6)
3.4
4,
(0.3
8)
26
.86,
(0.8
4)
49
.43,
(1.0
3)
0.1
1,
(0.0
2)
6.4
0,
(0.7
7)
1.5
3,
(0.5
6)
0.5
6,
(0.0
7)
—0
.07
,(0
.02
)1
0.7
4,
(0.6
7)
0.0
9,
(0.0
2)
Pre
-sig
illa
taG
rau
f.(b
od
y)
n¼
13
0.1
8,
(0.1
0)
1.7
3,
(0.1
1)
20
.49,
(0.6
7)
53
.90,
(1.3
5)
0.8
6,
(0.6
8)
4.1
3,
(0.2
0)
12
.00,
(1.2
9)
1.0
7,
(0.0
6)
——
5.6
4,
(0.4
0)
—S
igil
lata
Gra
uf.
(bo
dy
)n¼
42
0.2
6,
(0.0
9)
1.9
1,
(0.1
9)
22
.39,
(0.4
9)
52
.31,
(1.3
3)
0.3
6,
(0.2
1)
3.7
4,
(0.2
2)
11
.59,
(1.1
5)
1.1
2,
(0.0
4)
—0
.07
,(0
.02
)6
.23
,(0
.44
)—
Sig
illa
taA
rezz
o(b
od
y)
n¼
10
0.8
0,
(0.0
8)
3.2
1,
(0.1
1)
17
.98,
(0.4
3)
55
.29,
(1.0
7)
0.2
0,
(0.0
4)
2.2
3,
(0.1
3)
11
.51,
(1.9
3)
0.9
1,
(0.0
3)
—0
.16
,(0
.02
)7
.71
,(0
.57
)—
Fig. 1 Example of a cross-section sample mounted in epoxy support.
Fig. 2 Micro-XRF elemental maps (top) and SEM images (bottom) for
the PTSB36US02B (left) and PTSGD29A (right) pre-sigillata (recorded
at SSRL, scale in count number).
Fig. 3 Bicolor coded Fe valence state maps for the pre-sigillata recorded
at SSRL (100% Fe2+ in blue and 100% Fe3+ in red). Arrows point the
major Fe2+ inclusions in Fe3+ and inversely.
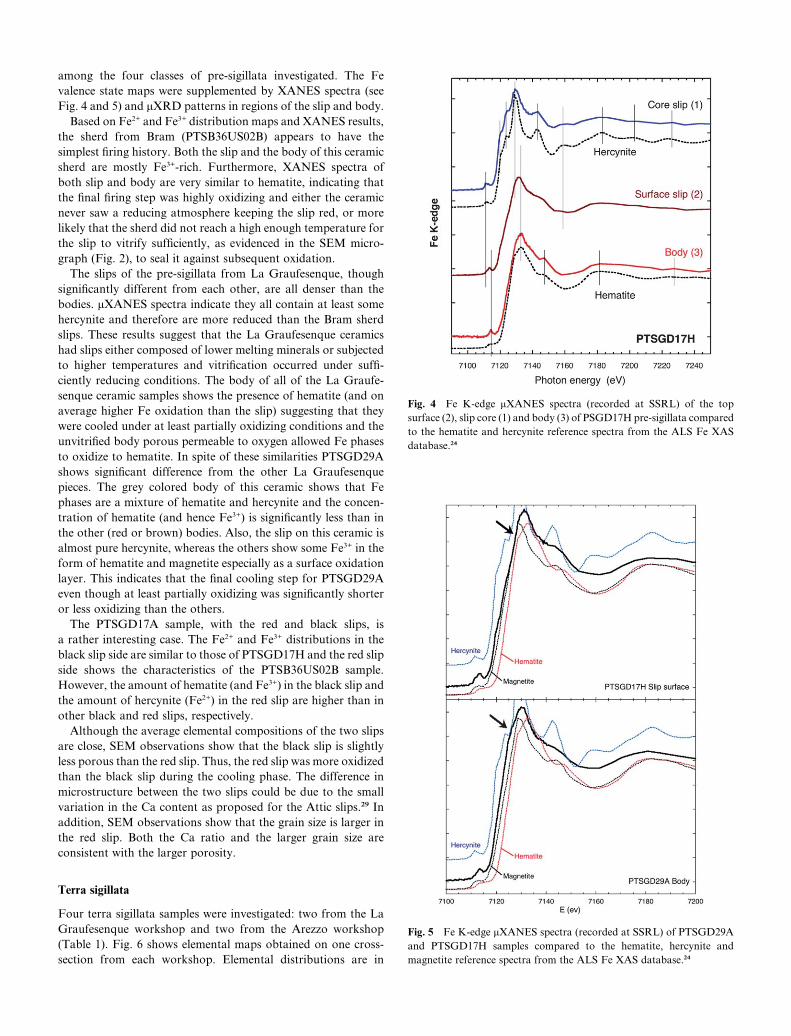
Fig. 4 Fe K-edge mXANES spectra (recorded at SSRL) of the top
surface (2), slip core (1) and body (3) of PSGD17H pre-sigillata compared
to the hematite and hercynite reference spectra from the ALS Fe XAS
database.24
among the four classes of pre-sigillata investigated. The Fe
valence state maps were supplemented by XANES spectra (see
Fig. 4 and 5) and mXRD patterns in regions of the slip and body.
Based on Fe2+ and Fe3+ distribution maps and XANES results,
the sherd from Bram (PTSB36US02B) appears to have the
simplest firing history. Both the slip and the body of this ceramic
sherd are mostly Fe3+-rich. Furthermore, XANES spectra of
both slip and body are very similar to hematite, indicating that
the final firing step was highly oxidizing and either the ceramic
never saw a reducing atmosphere keeping the slip red, or more
likely that the sherd did not reach a high enough temperature for
the slip to vitrify sufficiently, as evidenced in the SEM micro-
graph (Fig. 2), to seal it against subsequent oxidation.
The slips of the pre-sigillata from La Graufesenque, though
significantly different from each other, are all denser than the
bodies. mXANES spectra indicate they all contain at least some
hercynite and therefore are more reduced than the Bram sherd
slips. These results suggest that the La Graufesenque ceramics
had slips either composed of lower melting minerals or subjected
to higher temperatures and vitrification occurred under suffi-
ciently reducing conditions. The body of all of the La Graufe-
senque ceramic samples shows the presence of hematite (and on
average higher Fe oxidation than the slip) suggesting that they
were cooled under at least partially oxidizing conditions and the
unvitrified body porous permeable to oxygen allowed Fe phases
to oxidize to hematite. In spite of these similarities PTSGD29A
shows significant difference from the other La Graufesenque
pieces. The grey colored body of this ceramic shows that Fe
phases are a mixture of hematite and hercynite and the concen-
tration of hematite (and hence Fe3+) is significantly less than in
the other (red or brown) bodies. Also, the slip on this ceramic is
almost pure hercynite, whereas the others show some Fe3+ in the
form of hematite and magnetite especially as a surface oxidation
layer. This indicates that the final cooling step for PTSGD29A
even though at least partially oxidizing was significantly shorter
or less oxidizing than the others.
The PTSGD17A sample, with the red and black slips, is
a rather interesting case. The Fe2+ and Fe3+ distributions in the
black slip side are similar to those of PTSGD17H and the red slip
side shows the characteristics of the PTSB36US02B sample.
However, the amount of hematite (and Fe3+) in the black slip and
the amount of hercynite (Fe2+) in the red slip are higher than in
other black and red slips, respectively.
Although the average elemental compositions of the two slips
are close, SEM observations show that the black slip is slightly
less porous than the red slip. Thus, the red slip was more oxidized
than the black slip during the cooling phase. The difference in
microstructure between the two slips could be due to the small
variation in the Ca content as proposed for the Attic slips.29 In
addition, SEM observations show that the grain size is larger in
the red slip. Both the Ca ratio and the larger grain size are
consistent with the larger porosity.
Fig. 5 Fe K-edge mXANES spectra (recorded at SSRL) of PTSGD29A
and PTSGD17H samples compared to the hematite, hercynite and
magnetite reference spectra from the ALS Fe XAS database.24
Terra sigillata
Four terra sigillata samples were investigated: two from the La
Graufesenque workshop and two from the Arezzo workshop
(Table 1). Fig. 6 shows elemental maps obtained on one cross-
section from each workshop. Elemental distributions are in
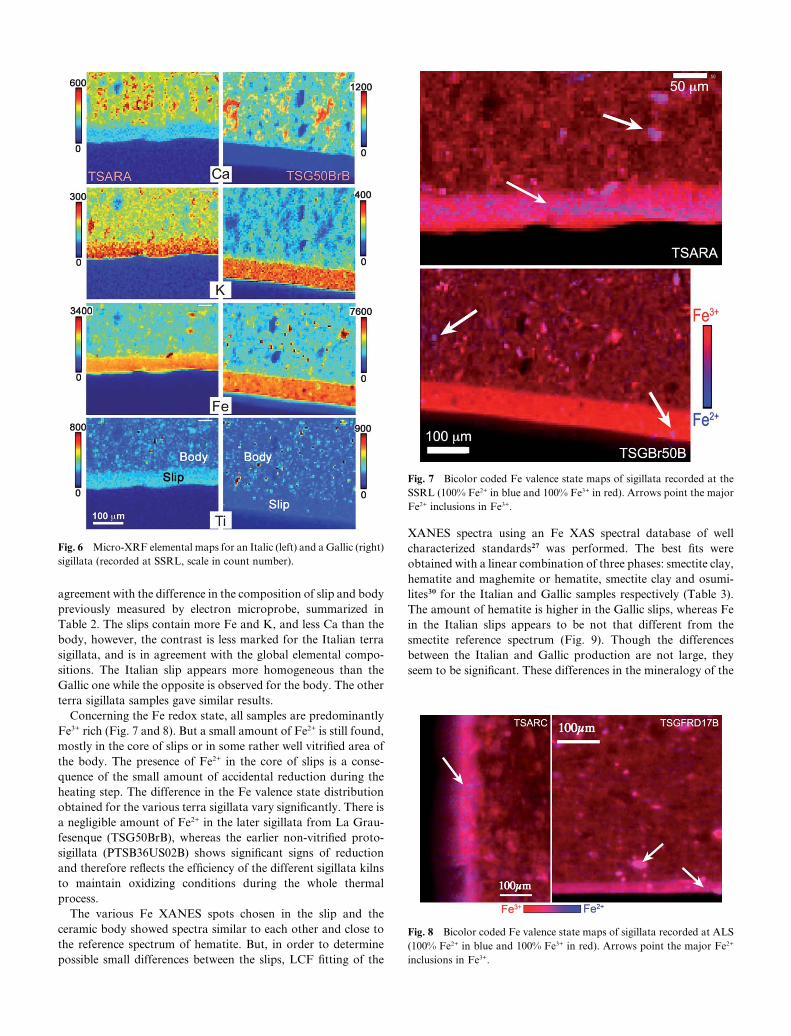
Fig. 6 Micro-XRF elemental maps for an Italic (left) and a Gallic (right)
sigillata (recorded at SSRL, scale in count number).
Fig. 7 Bicolor coded Fe valence state maps of sigillata recorded at the
SSRL (100% Fe2+ in blue and 100% Fe3+ in red). Arrows point the major
Fe2+ inclusions in Fe3+.
Fig. 8 Bicolor coded Fe valence state maps of sigillata recorded at ALS
(100% Fe2+ in blue and 100% Fe3+ in red). Arrows point the major Fe2+
inclusions in Fe3+.
agreement with the difference in the composition of slip and body
previously measured by electron microprobe, summarized in
Table 2. The slips contain more Fe and K, and less Ca than the
body, however, the contrast is less marked for the Italian terra
sigillata, and is in agreement with the global elemental compo-
sitions. The Italian slip appears more homogeneous than the
Gallic one while the opposite is observed for the body. The other
terra sigillata samples gave similar results.
Concerning the Fe redox state, all samples are predominantly
Fe3+ rich (Fig. 7 and 8). But a small amount of Fe2+ is still found,
mostly in the core of slips or in some rather well vitrified area of
the body. The presence of Fe2+ in the core of slips is a conse-
quence of the small amount of accidental reduction during the
heating step. The difference in the Fe valence state distribution
obtained for the various terra sigillata vary significantly. There is
a negligible amount of Fe2+ in the later sigillata from La Grau-
fesenque (TSG50BrB), whereas the earlier non-vitrified proto-
sigillata (PTSB36US02B) shows significant signs of reduction
and therefore reflects the efficiency of the different sigillata kilns
to maintain oxidizing conditions during the whole thermal
process.
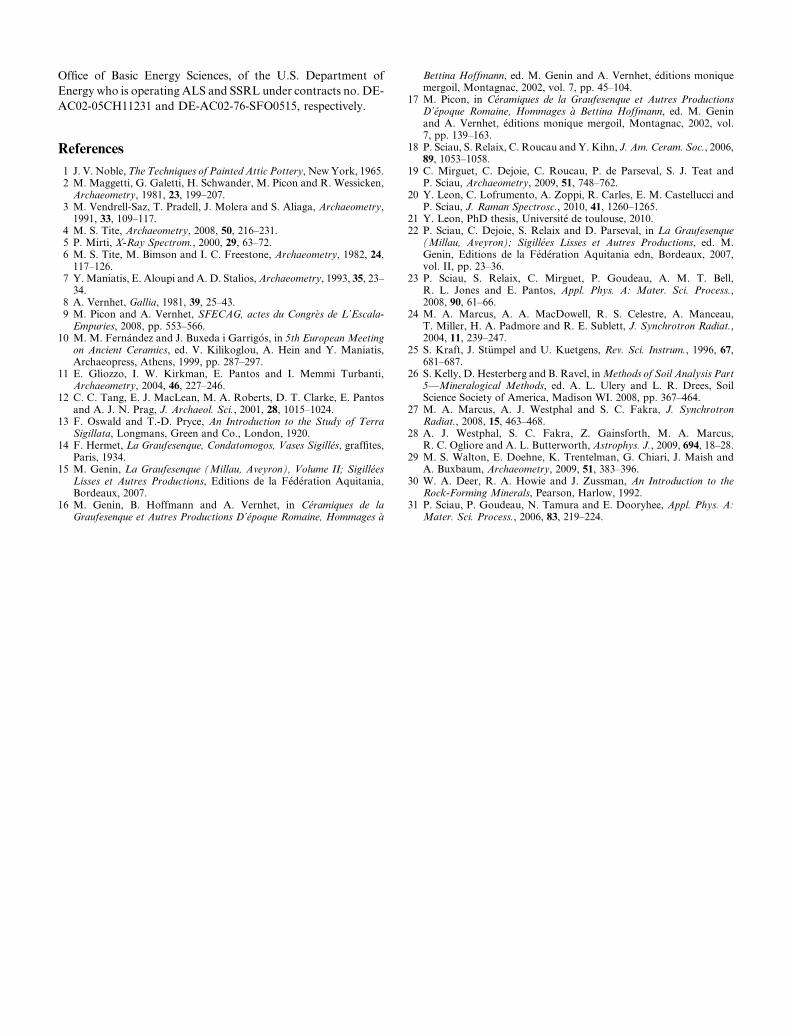
The various Fe XANES spots chosen in the slip and the
ceramic body showed spectra similar to each other and close to
the reference spectrum of hematite. But, in order to determine
possible small differences between the slips, LCF fitting of the
XANES spectra using an Fe XAS spectral database of well
characterized standards27 was performed. The best fits were
obtained with a linear combination of three phases: smectite clay,
hematite and maghemite or hematite, smectite clay and osumi-
lites30 for the Italian and Gallic samples respectively (Table 3).
The amount of hematite is higher in the Gallic slips, whereas Fe
in the Italian slips appears to be not that different from the
smectite reference spectrum (Fig. 9). Though the differences
between the Italian and Gallic production are not large, they
seem to be significant. These differences in the mineralogy of the
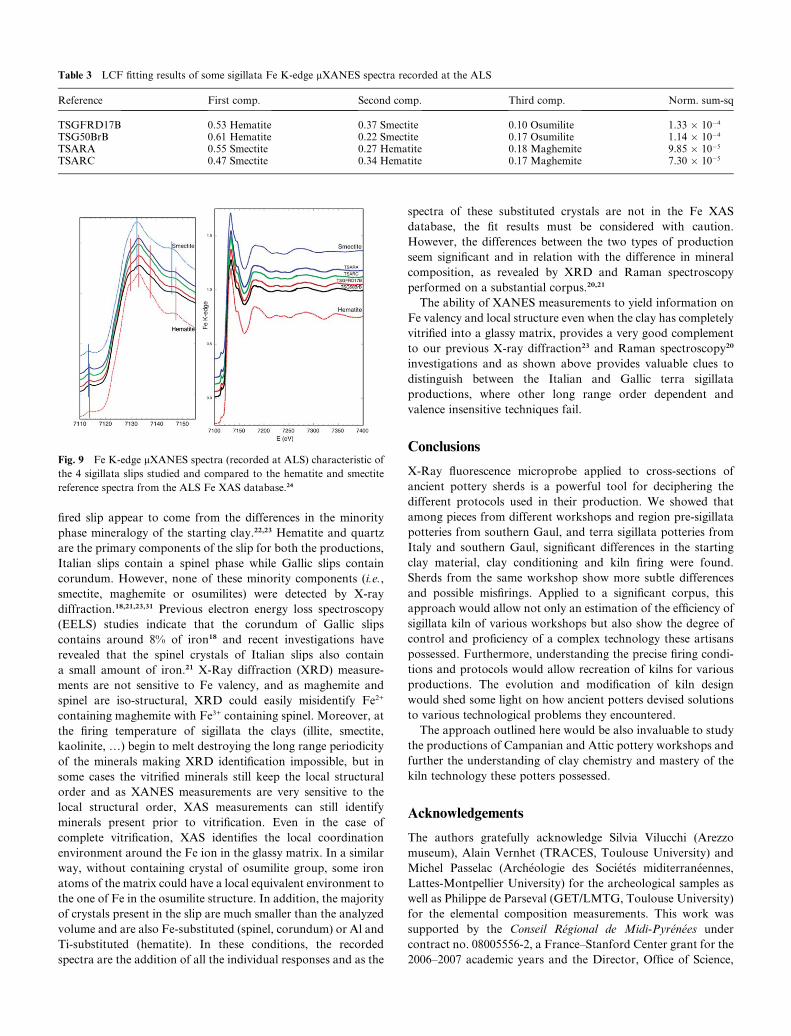
Table 3 LCF fitting results of some sigillata Fe K-edge mXANES spectra recorded at the ALS
Reference First comp. Second comp. Third comp. Norm. sum-sq
TSGFRD17B 0.53 Hematite 0.37 Smectite 0.10 Osumilite 1.33 � 10�4
TSG50BrB 0.61 Hematite 0.22 Smectite 0.17 Osumilite 1.14 � 10�4
TSARA 0.55 Smectite 0.27 Hematite 0.18 Maghemite 9.85 � 10�5
TSARC 0.47 Smectite 0.34 Hematite 0.17 Maghemite 7.30 � 10�5
Fig. 9 Fe K-edge mXANES spectra (recorded at ALS) characteristic of
the 4 sigillata slips studied and compared to the hematite and smectite
reference spectra from the ALS Fe XAS database.24
fired slip appear to come from the differences in the minority
phase mineralogy of the starting clay.22,23 Hematite and quartz
are the primary components of the slip for both the productions,
Italian slips contain a spinel phase while Gallic slips contain
corundum. However, none of these minority components (i.e.,
smectite, maghemite or osumilites) were detected by X-ray
diffraction.18,21,23,31 Previous electron energy loss spectroscopy
(EELS) studies indicate that the corundum of Gallic slips
contains around 8% of iron18 and recent investigations have
revealed that the spinel crystals of Italian slips also contain
a small amount of iron.21 X-Ray diffraction (XRD) measure-
ments are not sensitive to Fe valency, and as maghemite and
spinel are iso-structural, XRD could easily misidentify Fe2+
containing maghemite with Fe3+ containing spinel. Moreover, at
the firing temperature of sigillata the clays (illite, smectite,
kaolinite, .) begin to melt destroying the long range periodicity
of the minerals making XRD identification impossible, but in
some cases the vitrified minerals still keep the local structural
order and as XANES measurements are very sensitive to the
local structural order, XAS measurements can still identify
minerals present prior to vitrification. Even in the case of
complete vitrification, XAS identifies the local coordination
environment around the Fe ion in the glassy matrix. In a similar
way, without containing crystal of osumilite group, some iron
atoms of the matrix could have a local equivalent environment to
the one of Fe in the osumilite structure. In addition, the majority
of crystals present in the slip are much smaller than the analyzed
volume and are also Fe-substituted (spinel, corundum) or Al and
Ti-substituted (hematite). In these conditions, the recorded
spectra are the addition of all the individual responses and as the
spectra of these substituted crystals are not in the Fe XAS
database, the fit results must be considered with caution.
However, the differences between the two types of production
seem significant and in relation with the difference in mineral
composition, as revealed by XRD and Raman spectroscopy
performed on a substantial corpus.20,21
The ability of XANES measurements to yield information on
Fe valency and local structure even when the clay has completely
vitrified into a glassy matrix, provides a very good complement
to our previous X-ray diffraction23 and Raman spectroscopy20
investigations and as shown above provides valuable clues to
distinguish between the Italian and Gallic terra sigillata
productions, where other long range order dependent and
valence insensitive techniques fail.
Conclusions
X-Ray fluorescence microprobe applied to cross-sections of
ancient pottery sherds is a powerful tool for deciphering the
different protocols used in their production. We showed that
among pieces from different workshops and region pre-sigillata
potteries from southern Gaul, and terra sigillata potteries from
Italy and southern Gaul, significant differences in the starting
clay material, clay conditioning and kiln firing were found.
Sherds from the same workshop show more subtle differences
and possible misfirings. Applied to a significant corpus, this
approach would allow not only an estimation of the efficiency of
sigillata kiln of various workshops but also show the degree of
control and proficiency of a complex technology these artisans
possessed. Furthermore, understanding the precise firing condi-
tions and protocols would allow recreation of kilns for various
productions. The evolution and modification of kiln design
would shed some light on how ancient potters devised solutions
to various technological problems they encountered.
The approach outlined here would be also invaluable to study
the productions of Campanian and Attic pottery workshops and
further the understanding of clay chemistry and mastery of the
kiln technology these potters possessed.
Acknowledgements
The authors gratefully acknowledge Silvia Vilucchi (Arezzo
museum), Alain Vernhet (TRACES, Toulouse University) and
Michel Passelac (Arch�eologie des Soci�et�es miditerran�eennes,
Lattes-Montpellier University) for the archeological samples as
well as Philippe de Parseval (GET/LMTG, Toulouse University)
for the elemental composition measurements. This work was
supported by the Conseil R�egional de Midi-Pyr�en�ees under
contract no. 08005556-2, a France–Stanford Center grant for the
2006–2007 academic years and the Director, Office of Science,
Office of Basic Energy Sciences, of the U.S. Department of
Energy who is operating ALS and SSRL under contracts no. DE-
AC02-05CH11231 and DE-AC02-76-SFO0515, respectively.
References
1 J. V. Noble, The Techniques of Painted Attic Pottery, New York, 1965.2 M. Maggetti, G. Galetti, H. Schwander, M. Picon and R. Wessicken,
Archaeometry, 1981, 23, 199–207.3 M. Vendrell-Saz, T. Pradell, J. Molera and S. Aliaga, Archaeometry,
1991, 33, 109–117.4 M. S. Tite, Archaeometry, 2008, 50, 216–231.5 P. Mirti, X-Ray Spectrom., 2000, 29, 63–72.6 M. S. Tite, M. Bimson and I. C. Freestone, Archaeometry, 1982, 24,
117–126.7 Y. Maniatis, E. Aloupi and A. D. Stalios, Archaeometry, 1993, 35, 23–
34.8 A. Vernhet, Gallia, 1981, 39, 25–43.9 M. Picon and A. Vernhet, SFECAG, actes du Congr�es de L’Escala-
Empuries, 2008, pp. 553–566.10 M. M. Fern�andez and J. Buxeda i Garrig�os, in 5th European Meeting
on Ancient Ceramics, ed. V. Kilikoglou, A. Hein and Y. Maniatis,Archaeopress, Athens, 1999, pp. 287–297.
11 E. Gliozzo, I. W. Kirkman, E. Pantos and I. Memmi Turbanti,Archaeometry, 2004, 46, 227–246.
12 C. C. Tang, E. J. MacLean, M. A. Roberts, D. T. Clarke, E. Pantosand A. J. N. Prag, J. Archaeol. Sci., 2001, 28, 1015–1024.
13 F. Oswald and T.-D. Pryce, An Introduction to the Study of TerraSigillata, Longmans, Green and Co., London, 1920.
14 F. Hermet, La Graufesenque, Condatomogos, Vases Sigill�es, graffites,Paris, 1934.
15 M. Genin, La Graufesenque (Millau, Aveyron), Volume II; Sigill�eesLisses et Autres Productions, Editions de la F�ed�eration Aquitania,Bordeaux, 2007.
16 M. Genin, B. Hoffmann and A. Vernhet, in C�eramiques de laGraufesenque et Autres Productions D’�epoque Romaine, Hommages �a
Bettina Hoffmann, ed. M. Genin and A. Vernhet, �editions moniquemergoil, Montagnac, 2002, vol. 7, pp. 45–104.
17 M. Picon, in C�eramiques de la Graufesenque et Autres ProductionsD’�epoque Romaine, Hommages �a Bettina Hoffmann, ed. M. Geninand A. Vernhet, �editions monique mergoil, Montagnac, 2002, vol.7, pp. 139–163.
18 P. Sciau, S. Relaix, C. Roucau and Y. Kihn, J. Am. Ceram. Soc., 2006,89, 1053–1058.
19 C. Mirguet, C. Dejoie, C. Roucau, P. de Parseval, S. J. Teat andP. Sciau, Archaeometry, 2009, 51, 748–762.
20 Y. Leon, C. Lofrumento, A. Zoppi, R. Carles, E. M. Castellucci andP. Sciau, J. Raman Spectrosc., 2010, 41, 1260–1265.
21 Y. Leon, PhD thesis, Universit�e de toulouse, 2010.22 P. Sciau, C. Dejoie, S. Relaix and D. Parseval, in La Graufesenque
(Millau, Aveyron); Sigill�ees Lisses et Autres Productions, ed. M.Genin, Editions de la F�ed�eration Aquitania edn, Bordeaux, 2007,vol. II, pp. 23–36.
23 P. Sciau, S. Relaix, C. Mirguet, P. Goudeau, A. M. T. Bell,R. L. Jones and E. Pantos, Appl. Phys. A: Mater. Sci. Process.,2008, 90, 61–66.
24 M. A. Marcus, A. A. MacDowell, R. S. Celestre, A. Manceau,T. Miller, H. A. Padmore and R. E. Sublett, J. Synchrotron Radiat.,2004, 11, 239–247.
25 S. Kraft, J. St€umpel and U. Kuetgens, Rev. Sci. Instrum., 1996, 67,681–687.
26 S. Kelly, D. Hesterberg and B. Ravel, in Methods of Soil Analysis Part5—Mineralogical Methods, ed. A. L. Ulery and L. R. Drees, SoilScience Society of America, Madison WI. 2008, pp. 367–464.
27 M. A. Marcus, A. J. Westphal and S. C. Fakra, J. SynchrotronRadiat., 2008, 15, 463–468.
28 A. J. Westphal, S. C. Fakra, Z. Gainsforth, M. A. Marcus,R. C. Ogliore and A. L. Butterworth, Astrophys. J., 2009, 694, 18–28.
29 M. S. Walton, E. Doehne, K. Trentelman, G. Chiari, J. Maish andA. Buxbaum, Archaeometry, 2009, 51, 383–396.
30 W. A. Deer, R. A. Howie and J. Zussman, An Introduction to theRock-Forming Minerals, Pearson, Harlow, 1992.
31 P. Sciau, P. Goudeau, N. Tamura and E. Dooryhee, Appl. Phys. A:Mater. Sci. Process., 2006, 83, 219–224.