reverse-phase high-performance liquid chromatography ...jmlvll/lab-reports/hplc/hplc.pdf · uc...
TRANSCRIPT
UC Berkeley College of Chemistry
Chemistry 105
Instrumental Methods in Analytical Chemistry
Reverse-Phase High-PerformanceLiquid Chromatography Analysis of
BiomoleculesShort Report
Author:
Jonathan Melville
Lab Partners:
Jake Precht, Phuong Tran, and Jeremy Hsu
Graduate Student Instructors:
Richard Cooper & Daniel Mortensen
April 23, 2014

1 Theory
RP-HPLC, or Reverse-Phase High-Performance Liquid Chromatography is a type of chro-
matography the features a liquid mobile phase, higher resolving power than traditional
liquid chromatography, and a specific combination of stationary- and mobile-phases that
results in separations that are the opposite of a “traditional” HPLC. Chromatogra-
phy, in general, utilizes the flow of a “mobile-phase” containing the analyte through
a “stationary-phase” – depending on the intermolecular forces of attraction between the
individual analytes and the stationary- and mobile-phases, the various components of
the sample will exit the chromatographic “column” at different times[?]. A substance
that experiences greater intermolecular forces of attraction to the stationary-phase will
be slowed, and will exit the column later than a substance without such attraction. If
the mobile-phase is a liquid (as opposed to, say, a gas), the process is considered “liquid
chromatography”; HPLC improves upon this process by pumping a pressurized liquid
mobile-phase through an adsorbant stationary-phase, yielding far greater separation and
resolving power than regular gravitationally-run liquid chromatography. The labelling
“reverse-phase” is far more arbitrary in origin – historically, chromatographic columns
utilized a polar stationary-phase and a nonpolar mobile-phase; “reverse-phase chromatog-
raphy”, by contrast, uses a nonpolar stationary-phase and a polar mobile-phase, resulting
in an inverted separation from “normal-phase” chromatography: more polar analytes will
tend to elute earlier due to decreased interaction with the now-nonpolar stationary-phase.
Because of its versatility, ease-of-use, and superior separation, HPLC is one of the
most commonly-used classes of chromatography (itself one of the most common analytical
methods), along with other methods like gas chromatography and column chromatogra-
phy.
2 Results and Discussion
This section contains only tabulated results from the Appendix. Derivations can be found
in Appendix A on page 5. Graphs can be found in Appendix B on page 12. Raw data
1

Figure 1: Methionine, a nonpolar amino acid and one of our peptides
can be found in Appendix A.1 on page 5.
2.1 Results
Due to experimental failures that are detailed further in the appendix, we were unable
to absolutely and quantitatively determine the concentration of peptides in our unknown
sample. However, we were able to determine the ratios of peptides in our sample relative
to the concentration of our calibration samples:
Peak 1:40.63160.012312
+ 4.134980.051785
2= 1690. ppm (relative)
Peak 2:11.964110.03288
+ 15.3068−0.02443
2= −131.3 ppm (relative) (?!)
2.2 Accuracy and Error
Of course, our accuracy in this experiment was exceedingly low. Ignoring the fact that we
are missing a crucial piece of data to turn our relative concentration values into absolute
ones (due to a failure for the instrument to read our sample, no less), the data we do have
conspires to give us abysmal fits that lead to nonsensical data. A brief examination of
our calibration curves shows that our error bars are gigantic and our R2 values abysmal
(even, in one case, producing a negative slope that directly caused the apparently negative
concentration of peptide seen above). Because of the vast amounts of missing data points
in our tables (every N/A was a point not found on the instrument), we are simply not
able to calculate anything with any degree of confidence.
2

Figure 2: Bradykinin, a blood-vessel-dilating peptide that is comparatively polar
2.3 Discussion
While we cannot make many quantitative statements about the success of our experiment,
we can still state certain facts with a reasonable degree of certainty. We can, for instance,
determine the identity of the first and second peaks eluted by looking at the structures
of the two peptides analyzed.
Methionine, the first peptide, is a rather small essential amino acid and is largely
nonpolar in character due to the presence of a fairly lengthy alkyl chain. Compared
to the much larger bradykinin, enriched with numerous amines, amides, imines, and
aromatic groups, we can say with a reasonable amount of certainty that the first peak
is that of bradykinin and the second is methionine. Because we are performing reverse-
phase HPLC, our stationary phase is a rather waxy resin with long alkyl chains that
give it significant nonpolar character, whereas our mobile phases are comparatively polar
in nature. As a result, the more nonpolar methionine is more slowed by intermolecular
interactions with the stationary phase, allowing the more polar bradykinin to elute first.
Our data was analyzed using the HPLC’s built-in light source, an Agilent 1100/1200
Diode Array Detector that filters light from a tungsten-filament bulb through a coupling
lens, a deuterium lamp, an achromatic lens, a holmium oxide filter, a support lens, a
flow cell, and a spectro lens befor finally passing through a programmable slit and onto
a grating which projects a final spectrum[3]. Because our sample only called for UV
irradiation and not visible light (a detail noticeable in the ACQ.TXT data reports), only
the deuterium lamp is used.
Because of the data loss that plagued this entire experiment, we are unable to cal-
culate the niceties of our isocratic separations, such as the number of theoretical plates.
3

For the exact same reasons, we are unable to determine the amount of peptide in our
unknown sample. We were able to determine the relative concentrations (1690. ppm and
-131.3 ppm) by using the relative response factor, but even this approach is unhelpful due
to abysmal correlation coefficients (ranging from 0.65 to 0.05) and simply nonsensical an-
swers (negative concentration?!). While it is possible that our poor outputs are the result
of detection limits and exceeding the linear range of the instrument, it is unlikely that our
samples deviated so significantly from reasonable values that virtually none of them were
able to construct a decent fit. Changing the wavelength of the detector would change
the response factors of our analytes; methionine, containing little to no π-conjugation,
is likely not an exceptional absorber compared to bradykinin, which has large, extended
πsystems that likely absorb electrons of UV/Vis light readily. This also explains the
comparatively lower absorption values of methionine compared to bradykinin.
Nevertheless, the many flaws that riddled this experiment were likely a result of poor
experimental preparation and instrumental methods rather than shortcomings of the
HPLC instrument itself. Because our group was one of the last groups to complete this
lab, we were forced to make do with insufficient quantities of peptide starting material,
and whilst coordinating our sample preparation with another group we inadvertently
screwed up the preparation of several of our samples. We most likely failed to get all
of our results out of the HPLC due to a combination of this experimental error and
incorrect setup of the HPLC methods, causing several of our key analytical data points
to be dropped. Worst of all, we were unable to recreate and rerun our samples because
we had run out of lab time over the semester with which to attempt to fix our mistakes.
HPLC is a useful analytical method, even over other comparable separation methods
like electrophoresis or other forms of chromatography, because it combines the relative
ease-of-use of many chromatographic methods with the high-precision data that many
more qualitative chromatographic methods lack.
4

References
[1] SHU HPLC ; Yuri Kazakevich. http://hplc.chem.shu.edu/ (accessed April 22, 2014).
[2] Diode Array Detector Optimization [Online]; Agilent Technologies.
https://www.chem.agilent.com/Library/slidepresentation/Public/2%20Diode%20Array%20Detector%20Optimization.pdf
(accessed Apr 19, 2014).
A Calculations
A.1 Peak Resolution Data
RA,B = 2 ∗ tret,A−tret,BWA+WB
RA,B=peak resolution
tret=retention time
W=baseline width
A.1.1 1000 ppm std.
Trial Method Peak 1 (min) Peak 2 (min) Peak 1 width Peak 2 width Resolution
1 C 1.134 2.311 0.202 0.166 6.3967391304
2 C N/A N/A N/A N/A N/A
3 C N/A N/A N/A N/A N/A
A.1.2 500 ppm std.
Trial Method Peak 1 (min) Peak 2 (min) Peak 1 width Peak 2 width Resolution
1 A 2.191 6.44 0.182 0.185 23.1553133515
2 A 2.022 6.06 0.207 0.179 20.9222797927
3 A 2.076 6.156 0.172 0.176 23.4482758621
5

A.1.3 100 ppm std.
Trial Method Peak 1 (min) Peak 2 (min) Peak 1 width Peak 2 width Resolution
1 A 2.195 6.386 0.169 0.184 23.7450424929
2 A 2.063 6.165 0.18 0.19 22.172972973
3 A 2.044 6.241 0.161 0.199 23.3166666667
4 B N/A 2.19 0.151 0.157 7.025974026
5 B N/A 2.011 0.172 0.177 3.0601719198
6 B N/A 2.125 0.148 0.161 4.2459546926
7 C 1.112 2.198 0.164 0.149 6.9392971246
8 C N/A 2.198 N/A 0.16 N/A
9 C N/A 2.341 N/A 0.187 N/A
A.1.4 10 ppm std.
Trial Method Peak 1 (min) Peak 2 (min) Peak 1 width Peak 2 width Resolution
1 A 1.158 2.202 0.21 0.188 5.2462311558
2 A 1.465 2.039 0.165 0.204 3.1111111111
3 A 1.457 2.062 0.189 0.212 3.0174563591
A.1.5 1 ppm std.
Trial Method Peak 1 (min) Peak 2 (min) Peak 1 width Peak 2 width Resolution
1 A 1.176 2.478 0.17 0.173 7.5918367347
2 A 1.518 2.129 0.193 0.201 3.1015228426
3 A 1.448 2.127 0.21 0.171 3.5643044619
A.1.6 0.1 ppm std.
Trial Method Peak 1 (min) Peak 2 (min) Peak 1 width Peak 2 width Resolution
1 A 1.168 2.204 0.217 0.181 5.2060301508
2 A 1.481 2.067 0.127 0.185 3.7564102564
3 A 1.452 2.1 0.184 0.186 3.5027027027
6
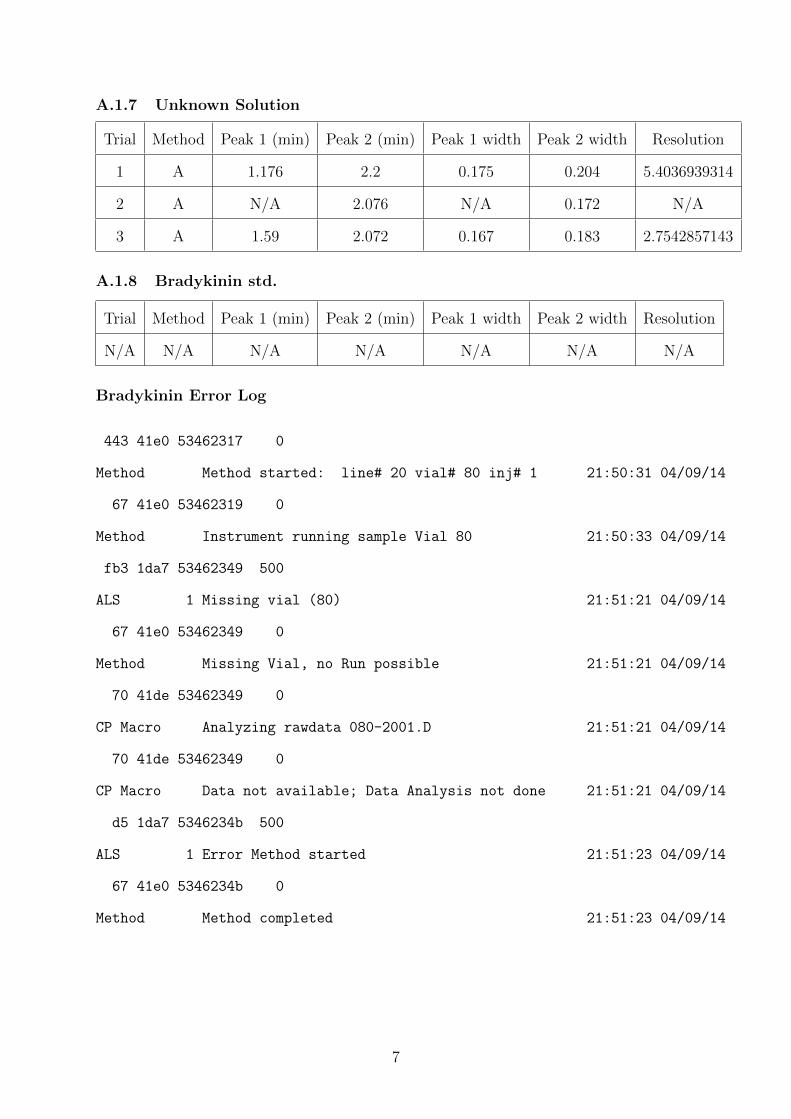
A.1.7 Unknown Solution
Trial Method Peak 1 (min) Peak 2 (min) Peak 1 width Peak 2 width Resolution
1 A 1.176 2.2 0.175 0.204 5.4036939314
2 A N/A 2.076 N/A 0.172 N/A
3 A 1.59 2.072 0.167 0.183 2.7542857143
A.1.8 Bradykinin std.
Trial Method Peak 1 (min) Peak 2 (min) Peak 1 width Peak 2 width Resolution
N/A N/A N/A N/A N/A N/A N/A
Bradykinin Error Log
443 41e0 53462317 0
Method Method started: line# 20 vial# 80 inj# 1 21:50:31 04/09/14
67 41e0 53462319 0
Method Instrument running sample Vial 80 21:50:33 04/09/14
fb3 1da7 53462349 500
ALS 1 Missing vial (80) 21:51:21 04/09/14
67 41e0 53462349 0
Method Missing Vial, no Run possible 21:51:21 04/09/14
70 41de 53462349 0
CP Macro Analyzing rawdata 080-2001.D 21:51:21 04/09/14
70 41de 53462349 0
CP Macro Data not available; Data Analysis not done 21:51:21 04/09/14
d5 1da7 5346234b 500
ALS 1 Error Method started 21:51:23 04/09/14
67 41e0 5346234b 0
Method Method completed 21:51:23 04/09/14
7

A.1.9 Methionine std.
Trial Method Peak 1 (min) Peak 2 (min) Peak 1 width Peak 2 width Resolution
N/A N/A N/A N/A N/A N/A N/A
Methionine Error Log
443 41e0 534625d5 0
Method Method started: line# 22 vial# 81 inj# 1 22:02:13 04/09/14
67 41e0 534625d7 0
Method Instrument running sample Vial 81 22:02:15 04/09/14
fb3 1da7 53462600 500
ALS 1 Missing vial (81) 22:02:56 04/09/14
67 41e0 53462601 0
Method Missing Vial, no Run possible 22:02:57 04/09/14
70 41de 53462601 0
CP Macro Analyzing rawdata 081-2201.D 22:02:57 04/09/14
70 41de 53462601 0
CP Macro Data not available; Data Analysis not done 22:02:57 04/09/14
d5 1da7 53462603 500
ALS 1 Error Method started 22:02:59 04/09/14
67 41e0 53462603 0
Method Method completed 22:02:59 04/09/14
A.2 Bradykinin and Methionine Calibration
These calibration curves could not be created, due to a lack of any data (whatsoever)
from their respective samples1. As a result, we are completely unable to create calibration
curves for these analytes, as well as calculating LoD or quantitative determination of the
unknown peptide mixture, due to the lack of a known standard to use as a reference.
Nevertheless, we will attempt to answer as many of these questions as possible using
1See error logs on pages 7 and 8.
8

relative values.
Based on the error logs, it is likely that human error was responsible for this data
loss, as the samples simply failed to run. This could be caused by an incorrect method or
by physical misplacement of the samples into the HPLC chamber. Whatever the cause,
however, there is no way for us to make up for this lost information (by interpolation or
the like) because there is simply no data to interpolate from.
A.3 Response Factor Calculation
fi = Ai
Astdfstd
Because of the limitations detailed earlier regarding the peptide standards, we are
unable to calculate absolute response factor and must settle for relative response factor:
fri = fifstd
= Ai
Astd
We can calculate this value by plotting analyte concentration against response (in the
form of area or height) and taking the slope of the best-fit line.
Unfortunately, in this instance “best-fit” may be a misnomer. “Mediocre-fit” is prob-
ably more accurate.
9

10
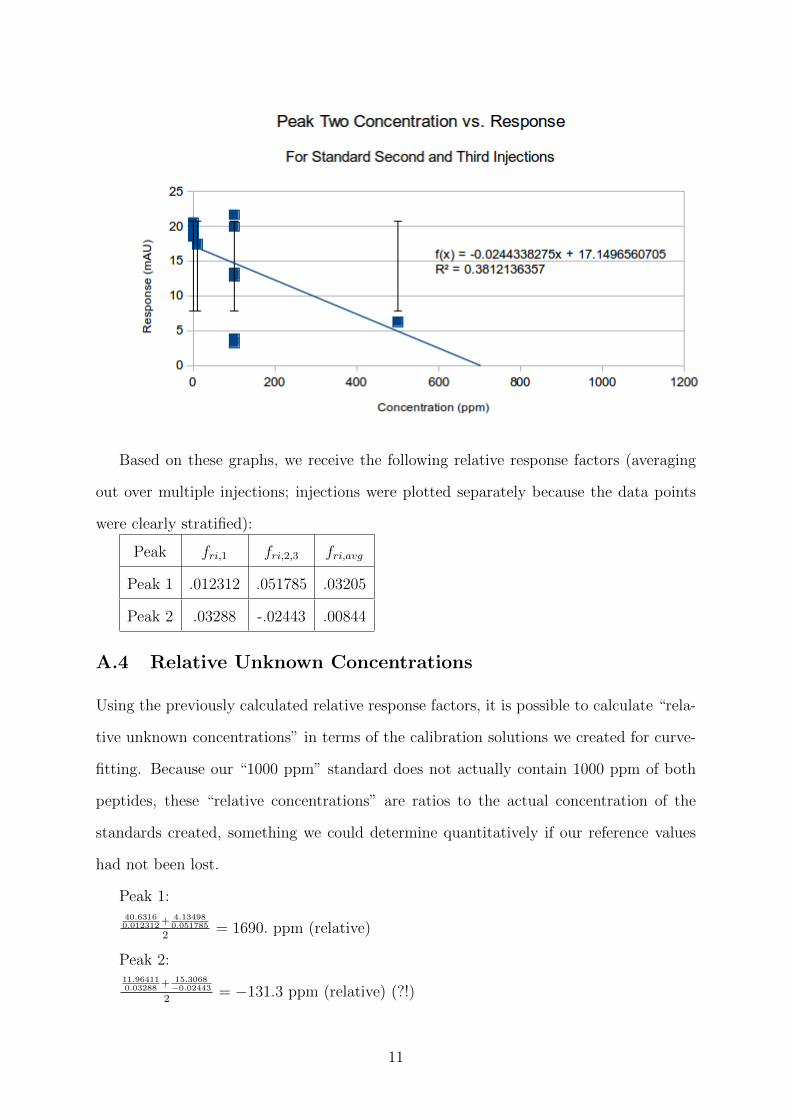
Based on these graphs, we receive the following relative response factors (averaging
out over multiple injections; injections were plotted separately because the data points
were clearly stratified):
Peak fri,1 fri,2,3 fri,avg
Peak 1 .012312 .051785 .03205
Peak 2 .03288 -.02443 .00844
A.4 Relative Unknown Concentrations
Using the previously calculated relative response factors, it is possible to calculate “rela-
tive unknown concentrations” in terms of the calibration solutions we created for curve-
fitting. Because our “1000 ppm” standard does not actually contain 1000 ppm of both
peptides, these “relative concentrations” are ratios to the actual concentration of the
standards created, something we could determine quantitatively if our reference values
had not been lost.
Peak 1:40.63160.012312
+ 4.134980.051785
2= 1690. ppm (relative)
Peak 2:11.964110.03288
+ 15.3068−0.02443
2= −131.3 ppm (relative) (?!)
11

A.5 Detection Limits
Once again, without concrete values to pin our relative numbers to, we cannot quantita-
tively determine this value. Qualitatively, however, a cursory glance at the error bars of
our “calibration curves” assures us that hitting the detection limit is likely the least of
our worries.
B Chromatographs
12

=====================================================================Acq. Operator : Chem 105 Seq. Line : 2Acq. Instrument : 305 Lat HPLC Location : Vial 71Injection Date : 4/9/2014 2:59:51 PM Inj : 1 Inj Volume : 20.0 µlSequence File : C:\Chem32\1\DATA\9 APRIL 2014\CHEM105 2014-04-09 14-47-10\CHEM105.SMethod : C:\CHEM32\1\DATA\9 APRIL 2014\CHEM105 2014-04-09 14-47-10\CHEM105C.MLast changed : 4/2/2014 2:18:05 PM by Chem 105
min0 1 2 3 4 5 6 7 8 9
mAU
0
10
20
30
40
50
60
DAD1 A, Sig=254,4 Ref=360,100 (071-0201.D)
1.1
34
2.1
68 2
.311
===================================================================== Area Percent Report ===================================================================== Sorted By : SignalMultiplier: : 1.0000Dilution: : 1.0000Use Multiplier & Dilution Factor with ISTDs Signal 1: DAD1 A, Sig=254,4 Ref=360,100 Peak RetTime Type Width Area Height Area # [min] [min] [mAU*s] [mAU] %----|-------|----|-------|----------|----------|--------| 1 1.134 BB 0.1262 550.56732 65.42467 59.5121 2 2.168 BV 0.2501 100.07494 4.98669 10.8173 3 2.311 VB 0.1326 274.49249 33.14954 29.6705 Totals : 925.13476 103.56089 ===================================================================== *** End of Report ***
Data File C:\CHEM32\1\DATA\9 APRIL 2014\CHEM105 2014-04-09 14-47-10\071-0201.DSample Name: 1000Standard
305 Lat HPLC 4/9/2014 3:10:05 PM Chem 105 Page 1 of 1

=====================================================================Acq. Operator : Chem 105 Seq. Line : 2Acq. Instrument : 305 Lat HPLC Location : Vial 71Injection Date : 4/9/2014 3:11:27 PM Inj : 2 Inj Volume : 20.0 µlSequence File : C:\Chem32\1\DATA\9 APRIL 2014\CHEM105 2014-04-09 14-47-10\CHEM105.SMethod : C:\CHEM32\1\DATA\9 APRIL 2014\CHEM105 2014-04-09 14-47-10\CHEM105C.MLast changed : 4/2/2014 2:18:05 PM by Chem 105
min0 1 2 3 4 5 6 7 8 9
mAU
-4
-3.5
-3
-2.5
-2
-1.5
DAD1 A, Sig=254,4 Ref=360,100 (071-0202.D)
===================================================================== Area Percent Report ===================================================================== Sorted By : SignalMultiplier: : 1.0000Dilution: : 1.0000Use Multiplier & Dilution Factor with ISTDs No peaks found ===================================================================== *** End of Report ***
Data File C:\CHEM32\1\DATA\9 APRIL 2014\CHEM105 2014-04-09 14-47-10\071-0202.DSample Name: 1000Standard
305 Lat HPLC 4/9/2014 3:21:41 PM Chem 105 Page 1 of 1

=====================================================================Acq. Operator : Chem 105 Seq. Line : 2Acq. Instrument : 305 Lat HPLC Location : Vial 71Injection Date : 4/9/2014 3:23:03 PM Inj : 3 Inj Volume : 20.0 µlSequence File : C:\Chem32\1\DATA\9 APRIL 2014\CHEM105 2014-04-09 14-47-10\CHEM105.SMethod : C:\CHEM32\1\DATA\9 APRIL 2014\CHEM105 2014-04-09 14-47-10\CHEM105C.MLast changed : 4/2/2014 2:18:05 PM by Chem 105
min0 1 2 3 4 5 6 7 8 9
mAU
-2
-1.75
-1.5
-1.25
-1
-0.75
-0.5
-0.25
0
DAD1 A, Sig=254,4 Ref=360,100 (071-0203.D)
===================================================================== Area Percent Report ===================================================================== Sorted By : SignalMultiplier: : 1.0000Dilution: : 1.0000Use Multiplier & Dilution Factor with ISTDs No peaks found ===================================================================== *** End of Report ***
Data File C:\CHEM32\1\DATA\9 APRIL 2014\CHEM105 2014-04-09 14-47-10\071-0203.DSample Name: 1000Standard
305 Lat HPLC 4/9/2014 3:33:18 PM Chem 105 Page 1 of 1

=====================================================================Acq. Operator : Chem 105 Seq. Line : 4Acq. Instrument : 305 Lat HPLC Location : Vial 72Injection Date : 4/9/2014 3:45:31 PM Inj : 1 Inj Volume : 20.0 µlSequence File : C:\Chem32\1\DATA\9 APRIL 2014\CHEM105 2014-04-09 14-47-10\CHEM105.SMethod : C:\CHEM32\1\DATA\9 APRIL 2014\CHEM105 2014-04-09 14-47-10\CHEM105A.MLast changed : 3/18/2014 3:50:33 PM by Chem 105
min0 2 4 6 8
mAU
-10
0
10
20
30
40
50
DAD1 A, Sig=254,4 Ref=360,100 (072-0401.D)
1.2
09
2.1
13 2
.191
2.5
01
4.8
43
6.4
40
6.6
97
===================================================================== Area Percent Report ===================================================================== Sorted By : SignalMultiplier: : 1.0000Dilution: : 1.0000Use Multiplier & Dilution Factor with ISTDs Signal 1: DAD1 A, Sig=254,4 Ref=360,100 Peak RetTime Type Width Area Height Area # [min] [min] [mAU*s] [mAU] %----|-------|----|-------|----------|----------|--------| 1 1.209 BB 0.1403 495.95142 53.40386 31.4287 2 2.113 BV 0.2614 103.35991 4.75820 6.5500 3 2.191 VV 0.0857 80.62334 12.10583 5.1091 4 2.501 VV 0.1670 65.41753 5.91853 4.1455 5 4.843 BB 0.1155 8.37328 1.09158 0.5306 6 6.440 BV 0.1376 533.22046 56.76577 33.7905 7 6.697 VV 0.1579 291.07367 26.97762 18.4455 Totals : 1578.01961 161.02139
Data File C:\CHEM32\1\DATA\9 APRIL 2014\CHEM105 2014-04-09 14-47-10\072-0401.DSample Name: 500Standard
305 Lat HPLC 4/9/2014 3:55:43 PM Chem 105 Page 1 of 2

===================================================================== *** End of Report ***
Data File C:\CHEM32\1\DATA\9 APRIL 2014\CHEM105 2014-04-09 14-47-10\072-0401.DSample Name: 500Standard
305 Lat HPLC 4/9/2014 3:55:43 PM Chem 105 Page 2 of 2

=====================================================================Acq. Operator : Chem 105 Seq. Line : 4Acq. Instrument : 305 Lat HPLC Location : Vial 72Injection Date : 4/9/2014 3:57:07 PM Inj : 2 Inj Volume : 20.0 µlSequence File : C:\Chem32\1\DATA\9 APRIL 2014\CHEM105 2014-04-09 14-47-10\CHEM105.SMethod : C:\CHEM32\1\DATA\9 APRIL 2014\CHEM105 2014-04-09 14-47-10\CHEM105A.MLast changed : 3/18/2014 3:50:33 PM by Chem 105
min0 1 2 3 4 5 6 7 8 9
mAU
-50
-40
-30
-20
-10
0
10
DAD1 A, Sig=254,4 Ref=360,100 (072-0402.D)
0.8
75
1.5
13
2.0
22 2
.122
6.0
60
6.3
32
===================================================================== Area Percent Report ===================================================================== Sorted By : SignalMultiplier: : 1.0000Dilution: : 1.0000Use Multiplier & Dilution Factor with ISTDs Signal 1: DAD1 A, Sig=254,4 Ref=360,100 Peak RetTime Type Width Area Height Area # [min] [min] [mAU*s] [mAU] %----|-------|----|-------|----------|----------|--------| 1 0.875 BV 0.3477 1113.19348 39.63150 48.5831 2 1.513 VV 0.0415 15.75548 5.48666 0.6876 3 2.022 VV 0.2473 594.30695 30.24431 25.9373 4 2.122 VV 0.1684 382.46872 28.53759 16.6921 5 6.060 BV 0.2640 118.48067 6.28218 5.1709 6 6.332 VV 0.1934 67.11346 4.67787 2.9290 Totals : 2291.31877 114.86010
Data File C:\CHEM32\1\DATA\9 APRIL 2014\CHEM105 2014-04-09 14-47-10\072-0402.DSample Name: 500Standard
305 Lat HPLC 4/9/2014 4:07:19 PM Chem 105 Page 1 of 2

===================================================================== *** End of Report ***
Data File C:\CHEM32\1\DATA\9 APRIL 2014\CHEM105 2014-04-09 14-47-10\072-0402.DSample Name: 500Standard
305 Lat HPLC 4/9/2014 4:07:19 PM Chem 105 Page 2 of 2
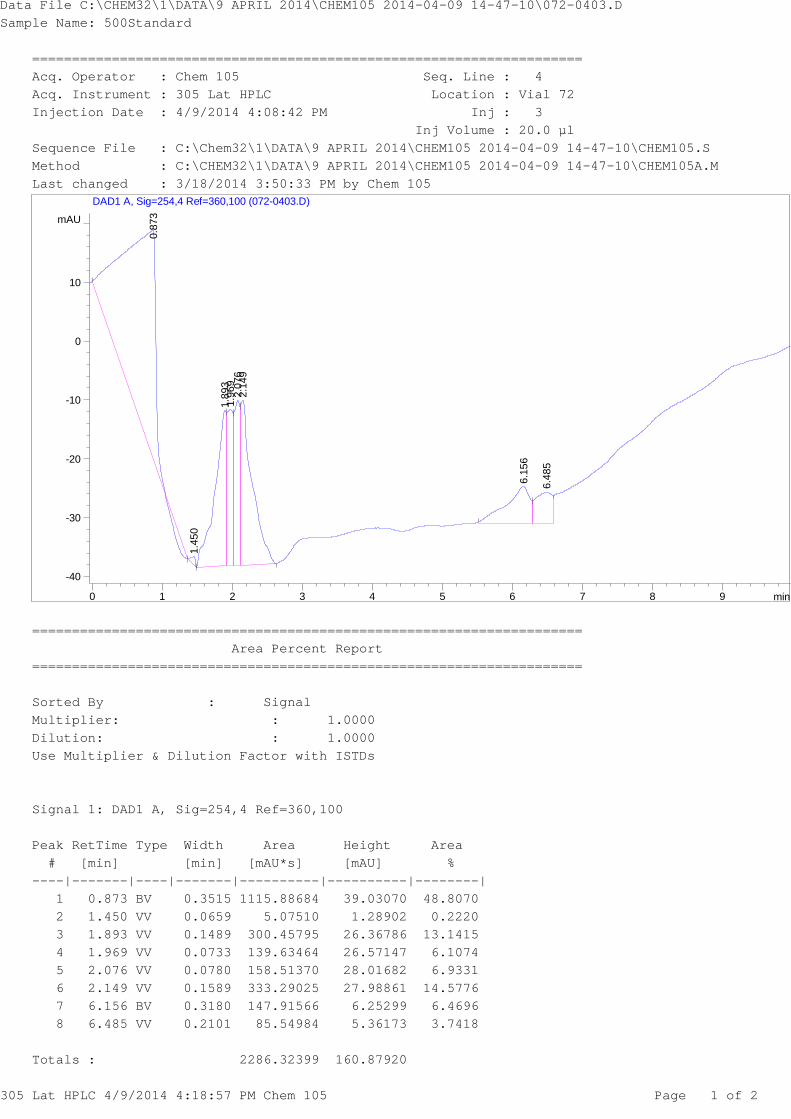
=====================================================================Acq. Operator : Chem 105 Seq. Line : 4Acq. Instrument : 305 Lat HPLC Location : Vial 72Injection Date : 4/9/2014 4:08:42 PM Inj : 3 Inj Volume : 20.0 µlSequence File : C:\Chem32\1\DATA\9 APRIL 2014\CHEM105 2014-04-09 14-47-10\CHEM105.SMethod : C:\CHEM32\1\DATA\9 APRIL 2014\CHEM105 2014-04-09 14-47-10\CHEM105A.MLast changed : 3/18/2014 3:50:33 PM by Chem 105
min0 1 2 3 4 5 6 7 8 9
mAU
-40
-30
-20
-10
0
10
DAD1 A, Sig=254,4 Ref=360,100 (072-0403.D)
0.8
73
1.4
50
1.8
93 1
.969
2.0
76 2
.149
6.1
56
6.4
85
===================================================================== Area Percent Report ===================================================================== Sorted By : SignalMultiplier: : 1.0000Dilution: : 1.0000Use Multiplier & Dilution Factor with ISTDs Signal 1: DAD1 A, Sig=254,4 Ref=360,100 Peak RetTime Type Width Area Height Area # [min] [min] [mAU*s] [mAU] %----|-------|----|-------|----------|----------|--------| 1 0.873 BV 0.3515 1115.88684 39.03070 48.8070 2 1.450 VV 0.0659 5.07510 1.28902 0.2220 3 1.893 VV 0.1489 300.45795 26.36786 13.1415 4 1.969 VV 0.0733 139.63464 26.57147 6.1074 5 2.076 VV 0.0780 158.51370 28.01682 6.9331 6 2.149 VV 0.1589 333.29025 27.98861 14.5776 7 6.156 BV 0.3180 147.91566 6.25299 6.4696 8 6.485 VV 0.2101 85.54984 5.36173 3.7418 Totals : 2286.32399 160.87920
Data File C:\CHEM32\1\DATA\9 APRIL 2014\CHEM105 2014-04-09 14-47-10\072-0403.DSample Name: 500Standard
305 Lat HPLC 4/9/2014 4:18:57 PM Chem 105 Page 1 of 2

===================================================================== *** End of Report ***
Data File C:\CHEM32\1\DATA\9 APRIL 2014\CHEM105 2014-04-09 14-47-10\072-0403.DSample Name: 500Standard
305 Lat HPLC 4/9/2014 4:18:57 PM Chem 105 Page 2 of 2

=====================================================================Acq. Operator : Chem 105 Seq. Line : 6Acq. Instrument : 305 Lat HPLC Location : Vial 73Injection Date : 4/9/2014 4:31:13 PM Inj : 1 Inj Volume : 20.0 µlSequence File : C:\Chem32\1\DATA\9 APRIL 2014\CHEM105 2014-04-09 14-47-10\CHEM105.SMethod : C:\CHEM32\1\DATA\9 APRIL 2014\CHEM105 2014-04-09 14-47-10\CHEM105A.MLast changed : 3/18/2014 3:50:33 PM by Chem 105
min0 2 4 6 8
mAU
-10
0
10
20
30
40
DAD1 A, Sig=254,4 Ref=360,100 (073-0601.D)
1.1
46
2.1
10 2
.195
2.4
62
6.3
86
6.6
67
===================================================================== Area Percent Report ===================================================================== Sorted By : SignalMultiplier: : 1.0000Dilution: : 1.0000Use Multiplier & Dilution Factor with ISTDs Signal 1: DAD1 A, Sig=254,4 Ref=360,100 Peak RetTime Type Width Area Height Area # [min] [min] [mAU*s] [mAU] %----|-------|----|-------|----------|----------|--------| 1 1.146 BB 0.1168 353.13898 47.47415 39.8047 2 2.110 BV 0.2295 97.19534 5.16706 10.9555 3 2.195 VV 0.0838 78.58721 12.42897 8.8581 4 2.462 VV 0.1476 74.40478 7.25996 8.3867 5 6.386 BV 0.1241 202.56482 23.59933 22.8325 6 6.667 VV 0.1476 81.28827 8.06572 9.1626 Totals : 887.17940 103.99518
Data File C:\CHEM32\1\DATA\9 APRIL 2014\CHEM105 2014-04-09 14-47-10\073-0601.DSample Name: 100Standard
305 Lat HPLC 4/9/2014 4:41:26 PM Chem 105 Page 1 of 2

===================================================================== *** End of Report ***
Data File C:\CHEM32\1\DATA\9 APRIL 2014\CHEM105 2014-04-09 14-47-10\073-0601.DSample Name: 100Standard
305 Lat HPLC 4/9/2014 4:41:26 PM Chem 105 Page 2 of 2

=====================================================================Acq. Operator : Chem 105 Seq. Line : 6Acq. Instrument : 305 Lat HPLC Location : Vial 73Injection Date : 4/9/2014 4:42:51 PM Inj : 2 Inj Volume : 20.0 µlSequence File : C:\Chem32\1\DATA\9 APRIL 2014\CHEM105 2014-04-09 14-47-10\CHEM105.SMethod : C:\CHEM32\1\DATA\9 APRIL 2014\CHEM105 2014-04-09 14-47-10\CHEM105A.MLast changed : 3/18/2014 3:50:33 PM by Chem 105
min0 1 2 3 4 5 6 7 8 9
mAU
-40
-30
-20
-10
0
10
DAD1 A, Sig=254,4 Ref=360,100 (073-0602.D)
0.8
52
1.4
55
2.0
63 2
.138
6.1
65
===================================================================== Area Percent Report ===================================================================== Sorted By : SignalMultiplier: : 1.0000Dilution: : 1.0000Use Multiplier & Dilution Factor with ISTDs Signal 1: DAD1 A, Sig=254,4 Ref=360,100 Peak RetTime Type Width Area Height Area # [min] [min] [mAU*s] [mAU] %----|-------|----|-------|----------|----------|--------| 1 0.852 BV 0.3558 1071.70447 38.37623 56.6523 2 1.455 VV 0.0866 10.96265 1.81107 0.5795 3 2.063 VV 0.2603 493.35745 24.36183 26.0798 4 2.138 VV 0.1800 244.35648 22.62403 12.9171 5 6.165 BV 0.2528 71.34130 3.80328 3.7712 Totals : 1891.72234 90.97643 =====================================================================
Data File C:\CHEM32\1\DATA\9 APRIL 2014\CHEM105 2014-04-09 14-47-10\073-0602.DSample Name: 100Standard
305 Lat HPLC 4/9/2014 4:53:05 PM Chem 105 Page 1 of 1

=====================================================================Acq. Operator : Chem 105 Seq. Line : 6Acq. Instrument : 305 Lat HPLC Location : Vial 73Injection Date : 4/9/2014 4:54:31 PM Inj : 3 Inj Volume : 20.0 µlSequence File : C:\Chem32\1\DATA\9 APRIL 2014\CHEM105 2014-04-09 14-47-10\CHEM105.SMethod : C:\CHEM32\1\DATA\9 APRIL 2014\CHEM105 2014-04-09 14-47-10\CHEM105A.MLast changed : 3/18/2014 3:50:33 PM by Chem 105
min0 1 2 3 4 5 6 7 8 9
mAU
-40
-30
-20
-10
0
10
DAD1 A, Sig=254,4 Ref=360,100 (073-0603.D)
0.8
20
1.4
64 1.5
68
1.8
80 2.0
44
6.2
41
===================================================================== Area Percent Report ===================================================================== Sorted By : SignalMultiplier: : 1.0000Dilution: : 1.0000Use Multiplier & Dilution Factor with ISTDs Signal 1: DAD1 A, Sig=254,4 Ref=360,100 Peak RetTime Type Width Area Height Area # [min] [min] [mAU*s] [mAU] %----|-------|----|-------|----------|----------|--------| 1 0.820 BV 0.3312 995.76886 37.81387 51.8885 2 1.464 VV 0.0901 27.89626 4.16753 1.4536 3 1.568 VV 0.0524 25.14947 7.63329 1.3105 4 1.880 VV 0.1588 264.83774 21.33795 13.8004 5 2.044 VV 0.2770 533.56476 23.49139 27.8035 6 6.241 BV 0.2922 71.83978 3.27133 3.7435 Totals : 1919.05686 97.71537
Data File C:\CHEM32\1\DATA\9 APRIL 2014\CHEM105 2014-04-09 14-47-10\073-0603.DSample Name: 100Standard
305 Lat HPLC 4/9/2014 5:04:46 PM Chem 105 Page 1 of 2

===================================================================== *** End of Report ***
Data File C:\CHEM32\1\DATA\9 APRIL 2014\CHEM105 2014-04-09 14-47-10\073-0603.DSample Name: 100Standard
305 Lat HPLC 4/9/2014 5:04:46 PM Chem 105 Page 2 of 2

=====================================================================Acq. Operator : Chem 105 Seq. Line : 8Acq. Instrument : 305 Lat HPLC Location : Vial 74Injection Date : 4/9/2014 5:17:05 PM Inj : 1 Inj Volume : 20.0 µlSequence File : C:\Chem32\1\DATA\9 APRIL 2014\CHEM105 2014-04-09 14-47-10\CHEM105.SMethod : C:\CHEM32\1\DATA\9 APRIL 2014\CHEM105 2014-04-09 14-47-10\CHEM105B.MLast changed : 4/2/2014 2:00:08 PM by Chem 105
min0 1 2 3 4 5 6 7 8 9
mAU
-10
0
10
20
30
40
DAD1 A, Sig=254,4 Ref=360,100 (074-0801.D)
1.1
08
2.1
04 2
.190
2.4
71
===================================================================== Area Percent Report ===================================================================== Sorted By : SignalMultiplier: : 1.0000Dilution: : 1.0000Use Multiplier & Dilution Factor with ISTDs Signal 1: DAD1 A, Sig=254,4 Ref=360,100 Peak RetTime Type Width Area Height Area # [min] [min] [mAU*s] [mAU] %----|-------|----|-------|----------|----------|--------| 1 1.108 BB 0.1259 377.30368 46.85508 58.6071 2 2.104 BV 0.2398 110.27272 5.59915 17.1288 3 2.190 VV 0.0810 81.81421 13.08161 12.7083 4 2.471 VV 0.1572 74.39433 6.93048 11.5558 Totals : 643.78493 72.46632 ===================================================================== *** End of Report ***
Data File C:\CHEM32\1\DATA\9 APRIL 2014\CHEM105 2014-04-09 14-47-10\074-0801.DSample Name: 100Standard
305 Lat HPLC 4/9/2014 5:27:18 PM Chem 105 Page 1 of 1

=====================================================================Acq. Operator : Chem 105 Seq. Line : 8Acq. Instrument : 305 Lat HPLC Location : Vial 74Injection Date : 4/9/2014 5:28:44 PM Inj : 2 Inj Volume : 20.0 µlSequence File : C:\Chem32\1\DATA\9 APRIL 2014\CHEM105 2014-04-09 14-47-10\CHEM105.SMethod : C:\CHEM32\1\DATA\9 APRIL 2014\CHEM105 2014-04-09 14-47-10\CHEM105B.MLast changed : 4/2/2014 2:00:08 PM by Chem 105
min0 1 2 3 4 5 6 7 8 9
mAU
-60
-50
-40
-30
-20
-10
0
DAD1 A, Sig=254,4 Ref=360,100 (074-0802.D) 1
.477
2.0
11 2
.089
===================================================================== Area Percent Report ===================================================================== Sorted By : SignalMultiplier: : 1.0000Dilution: : 1.0000Use Multiplier & Dilution Factor with ISTDs Signal 1: DAD1 A, Sig=254,4 Ref=360,100 Peak RetTime Type Width Area Height Area # [min] [min] [mAU*s] [mAU] %----|-------|----|-------|----------|----------|--------| 1 1.477 BV 0.1058 29.45708 4.00656 4.0340 2 2.011 VV 0.2417 400.07516 21.64254 54.7883 3 2.089 VV 0.1815 300.68777 20.94538 41.1777 Totals : 730.22001 46.59448 ===================================================================== *** End of Report ***
Data File C:\CHEM32\1\DATA\9 APRIL 2014\CHEM105 2014-04-09 14-47-10\074-0802.DSample Name: 100Standard
305 Lat HPLC 4/9/2014 5:38:57 PM Chem 105 Page 1 of 1

=====================================================================Acq. Operator : Chem 105 Seq. Line : 8Acq. Instrument : 305 Lat HPLC Location : Vial 74Injection Date : 4/9/2014 5:40:23 PM Inj : 3 Inj Volume : 20.0 µlSequence File : C:\Chem32\1\DATA\9 APRIL 2014\CHEM105 2014-04-09 14-47-10\CHEM105.SMethod : C:\CHEM32\1\DATA\9 APRIL 2014\CHEM105 2014-04-09 14-47-10\CHEM105B.MLast changed : 4/2/2014 2:00:08 PM by Chem 105
min0 2 4 6 8
mAU
-50
-40
-30
-20
-10
0
DAD1 A, Sig=254,4 Ref=360,100 (074-0803.D) 1
.469
2.0
05 2.1
25
2.5
06 3.0
97
===================================================================== Area Percent Report ===================================================================== Sorted By : SignalMultiplier: : 1.0000Dilution: : 1.0000Use Multiplier & Dilution Factor with ISTDs Signal 1: DAD1 A, Sig=254,4 Ref=360,100 Peak RetTime Type Width Area Height Area # [min] [min] [mAU*s] [mAU] %----|-------|----|-------|----------|----------|--------| 1 1.469 BV 0.0939 13.76783 1.96233 2.1276 2 2.005 VV 0.2091 291.84280 17.27595 45.0995 3 2.125 VV 0.1991 299.09973 19.93204 46.2209 4 2.506 VV 0.0738 8.66611 1.63504 1.3392 5 3.097 VV 0.2704 33.73269 1.53500 5.2128 Totals : 647.10917 42.34035 =====================================================================
Data File C:\CHEM32\1\DATA\9 APRIL 2014\CHEM105 2014-04-09 14-47-10\074-0803.DSample Name: 100Standard
305 Lat HPLC 4/9/2014 5:50:36 PM Chem 105 Page 1 of 1

=====================================================================Acq. Operator : Chem 105 Seq. Line : 10Acq. Instrument : 305 Lat HPLC Location : Vial 75Injection Date : 4/9/2014 6:02:55 PM Inj : 1 Inj Volume : 20.0 µlSequence File : C:\Chem32\1\DATA\9 APRIL 2014\CHEM105 2014-04-09 14-47-10\CHEM105.SMethod : C:\CHEM32\1\DATA\9 APRIL 2014\CHEM105 2014-04-09 14-47-10\CHEM105C.MLast changed : 4/2/2014 2:18:05 PM by Chem 105
min0 2 4 6 8
mAU
-10
0
10
20
30
DAD1 A, Sig=254,4 Ref=360,100 (075-1001.D)
1.1
12
2.1
12 2
.198
2.4
51
===================================================================== Area Percent Report ===================================================================== Sorted By : SignalMultiplier: : 1.0000Dilution: : 1.0000Use Multiplier & Dilution Factor with ISTDs Signal 1: DAD1 A, Sig=254,4 Ref=360,100 Peak RetTime Type Width Area Height Area # [min] [min] [mAU*s] [mAU] %----|-------|----|-------|----------|----------|--------| 1 1.112 BB 0.1237 389.47934 48.47914 58.5246 2 2.112 BV 0.2201 107.68982 5.98011 16.1819 3 2.198 VV 0.0835 81.19841 12.89202 12.2012 4 2.451 VV 0.1499 87.12939 8.34221 13.0924 Totals : 665.49696 75.69348 ===================================================================== *** End of Report ***
Data File C:\CHEM32\1\DATA\9 APRIL 2014\CHEM105 2014-04-09 14-47-10\075-1001.DSample Name: 100Standard
305 Lat HPLC 4/9/2014 6:13:09 PM Chem 105 Page 1 of 1

=====================================================================Acq. Operator : Chem 105 Seq. Line : 10Acq. Instrument : 305 Lat HPLC Location : Vial 75Injection Date : 4/9/2014 6:14:38 PM Inj : 2 Inj Volume : 20.0 µlSequence File : C:\Chem32\1\DATA\9 APRIL 2014\CHEM105 2014-04-09 14-47-10\CHEM105.SMethod : C:\CHEM32\1\DATA\9 APRIL 2014\CHEM105 2014-04-09 14-47-10\CHEM105C.MLast changed : 4/2/2014 2:18:05 PM by Chem 105
min0 1 2 3 4 5 6 7 8 9
mAU
-6
-4
-2
0
2
4
6
DAD1 A, Sig=254,4 Ref=360,100 (075-1002.D)
2.1
98
===================================================================== Area Percent Report ===================================================================== Sorted By : SignalMultiplier: : 1.0000Dilution: : 1.0000Use Multiplier & Dilution Factor with ISTDs Signal 1: DAD1 A, Sig=254,4 Ref=360,100 Peak RetTime Type Width Area Height Area # [min] [min] [mAU*s] [mAU] %----|-------|----|-------|----------|----------|--------| 1 2.198 BV 0.0796 78.62127 12.80807 100.0000 Totals : 78.62127 12.80807 ===================================================================== *** End of Report ***
Data File C:\CHEM32\1\DATA\9 APRIL 2014\CHEM105 2014-04-09 14-47-10\075-1002.DSample Name: 100Standard
305 Lat HPLC 4/9/2014 6:24:52 PM Chem 105 Page 1 of 1

=====================================================================Acq. Operator : Chem 105 Seq. Line : 10Acq. Instrument : 305 Lat HPLC Location : Vial 75Injection Date : 4/9/2014 6:26:21 PM Inj : 3 Inj Volume : 20.0 µlSequence File : C:\Chem32\1\DATA\9 APRIL 2014\CHEM105 2014-04-09 14-47-10\CHEM105.SMethod : C:\CHEM32\1\DATA\9 APRIL 2014\CHEM105 2014-04-09 14-47-10\CHEM105C.MLast changed : 4/2/2014 2:18:05 PM by Chem 105
min0 1 2 3 4 5 6 7 8 9
mAU
-6
-4
-2
0
2
4
6
DAD1 A, Sig=254,4 Ref=360,100 (075-1003.D)
2.3
41
===================================================================== Area Percent Report ===================================================================== Sorted By : SignalMultiplier: : 1.0000Dilution: : 1.0000Use Multiplier & Dilution Factor with ISTDs Signal 1: DAD1 A, Sig=254,4 Ref=360,100 Peak RetTime Type Width Area Height Area # [min] [min] [mAU*s] [mAU] %----|-------|----|-------|----------|----------|--------| 1 2.341 BV 0.0872 87.91441 13.28189 100.0000 Totals : 87.91441 13.28189 ===================================================================== *** End of Report ***
Data File C:\CHEM32\1\DATA\9 APRIL 2014\CHEM105 2014-04-09 14-47-10\075-1003.DSample Name: 100Standard
305 Lat HPLC 4/9/2014 6:36:36 PM Chem 105 Page 1 of 1

=====================================================================Acq. Operator : Chem 105 Seq. Line : 12Acq. Instrument : 305 Lat HPLC Location : Vial 76Injection Date : 4/9/2014 6:48:51 PM Inj : 1 Inj Volume : 20.0 µlSequence File : C:\Chem32\1\DATA\9 APRIL 2014\CHEM105 2014-04-09 14-47-10\CHEM105.SMethod : C:\CHEM32\1\DATA\9 APRIL 2014\CHEM105 2014-04-09 14-47-10\CHEM105A.MLast changed : 3/18/2014 3:50:33 PM by Chem 105
min0 2 4 6 8
mAU
-10
0
10
20
30
DAD1 A, Sig=254,4 Ref=360,100 (076-1201.D)
1.1
58
2.1
14 2
.202
2.4
69
===================================================================== Area Percent Report ===================================================================== Sorted By : SignalMultiplier: : 1.0000Dilution: : 1.0000Use Multiplier & Dilution Factor with ISTDs Signal 1: DAD1 A, Sig=254,4 Ref=360,100 Peak RetTime Type Width Area Height Area # [min] [min] [mAU*s] [mAU] %----|-------|----|-------|----------|----------|--------| 1 1.158 BB 0.1196 346.50757 45.10763 56.8083 2 2.114 BV 0.2235 105.23031 5.80513 17.2520 3 2.202 VV 0.0847 79.10258 12.35888 12.9685 4 2.469 VV 0.1539 79.11915 7.44728 12.9712 Totals : 609.95960 70.71892 ===================================================================== *** End of Report ***
Data File C:\CHEM32\1\DATA\9 APRIL 2014\CHEM105 2014-04-09 14-47-10\076-1201.DSample Name: 10Standard
305 Lat HPLC 4/9/2014 6:59:04 PM Chem 105 Page 1 of 1

=====================================================================Acq. Operator : Chem 105 Seq. Line : 12Acq. Instrument : 305 Lat HPLC Location : Vial 76Injection Date : 4/9/2014 7:00:31 PM Inj : 2 Inj Volume : 20.0 µlSequence File : C:\Chem32\1\DATA\9 APRIL 2014\CHEM105 2014-04-09 14-47-10\CHEM105.SMethod : C:\CHEM32\1\DATA\9 APRIL 2014\CHEM105 2014-04-09 14-47-10\CHEM105A.MLast changed : 3/18/2014 3:50:33 PM by Chem 105
min0 1 2 3 4 5 6 7 8 9
mAU
-40
-30
-20
-10
0
10
DAD1 A, Sig=254,4 Ref=360,100 (076-1202.D)
0.8
12
1.4
65
2.0
39 2
.154
===================================================================== Area Percent Report ===================================================================== Sorted By : SignalMultiplier: : 1.0000Dilution: : 1.0000Use Multiplier & Dilution Factor with ISTDs Signal 1: DAD1 A, Sig=254,4 Ref=360,100 Peak RetTime Type Width Area Height Area # [min] [min] [mAU*s] [mAU] %----|-------|----|-------|----------|----------|--------| 1 0.812 BV 0.3228 981.17834 37.55931 62.8206 2 1.465 VV 0.0885 16.10502 2.52281 1.0311 3 2.039 VV 0.2610 365.82404 17.41731 23.4221 4 2.154 VV 0.1558 198.76657 16.83013 12.7262 Totals : 1561.87397 74.32956 ===================================================================== *** End of Report ***
Data File C:\CHEM32\1\DATA\9 APRIL 2014\CHEM105 2014-04-09 14-47-10\076-1202.DSample Name: 10Standard
305 Lat HPLC 4/9/2014 7:10:44 PM Chem 105 Page 1 of 1

=====================================================================Acq. Operator : Chem 105 Seq. Line : 12Acq. Instrument : 305 Lat HPLC Location : Vial 76Injection Date : 4/9/2014 7:12:09 PM Inj : 3 Inj Volume : 20.0 µlSequence File : C:\Chem32\1\DATA\9 APRIL 2014\CHEM105 2014-04-09 14-47-10\CHEM105.SMethod : C:\CHEM32\1\DATA\9 APRIL 2014\CHEM105 2014-04-09 14-47-10\CHEM105A.MLast changed : 3/18/2014 3:50:33 PM by Chem 105
min0 1 2 3 4 5 6 7 8 9
mAU
-40
-30
-20
-10
0
10
DAD1 A, Sig=254,4 Ref=360,100 (076-1203.D)
0.8
43
1.4
57
2.0
62
2.4
96
===================================================================== Area Percent Report ===================================================================== Sorted By : SignalMultiplier: : 1.0000Dilution: : 1.0000Use Multiplier & Dilution Factor with ISTDs Signal 1: DAD1 A, Sig=254,4 Ref=360,100 Peak RetTime Type Width Area Height Area # [min] [min] [mAU*s] [mAU] %----|-------|----|-------|----------|----------|--------| 1 0.843 BV 0.3553 1039.12500 37.72928 66.3530 2 1.457 VV 0.0743 7.42794 1.59660 0.4743 3 2.062 VV 0.3713 513.24847 17.44443 32.7733 4 2.496 VV 0.0717 6.25335 1.26443 0.3993 Totals : 1566.05476 58.03474 ===================================================================== *** End of Report ***
Data File C:\CHEM32\1\DATA\9 APRIL 2014\CHEM105 2014-04-09 14-47-10\076-1203.DSample Name: 10Standard
305 Lat HPLC 4/9/2014 7:22:23 PM Chem 105 Page 1 of 1

=====================================================================Acq. Operator : Chem 105 Seq. Line : 14Acq. Instrument : 305 Lat HPLC Location : Vial 77Injection Date : 4/9/2014 7:34:36 PM Inj : 1 Inj Volume : 20.0 µlSequence File : C:\Chem32\1\DATA\9 APRIL 2014\CHEM105 2014-04-09 14-47-10\CHEM105.SMethod : C:\CHEM32\1\DATA\9 APRIL 2014\CHEM105 2014-04-09 14-47-10\CHEM105A.MLast changed : 3/18/2014 3:50:33 PM by Chem 105
min0 1 2 3 4 5 6 7 8 9
mAU
-10
-5
0
5
10
15
20
25
30
DAD1 A, Sig=254,4 Ref=360,100 (077-1401.D)
1.1
76
2.2
11 2.4
78
6.2
65
===================================================================== Area Percent Report ===================================================================== Sorted By : SignalMultiplier: : 1.0000Dilution: : 1.0000Use Multiplier & Dilution Factor with ISTDs Signal 1: DAD1 A, Sig=254,4 Ref=360,100 Peak RetTime Type Width Area Height Area # [min] [min] [mAU*s] [mAU] %----|-------|----|-------|----------|----------|--------| 1 1.176 BB 0.1264 351.41290 43.44933 62.2963 2 2.211 BV 0.2961 48.73400 2.07436 8.6393 3 2.478 VV 0.1485 42.87768 4.29428 7.6011 4 6.265 BB 0.1297 121.07437 14.16961 21.4633 Totals : 564.09895 63.98757 ===================================================================== *** End of Report ***
Data File C:\CHEM32\1\DATA\9 APRIL 2014\CHEM105 2014-04-09 14-47-10\077-1401.DSample Name: 1Standard
305 Lat HPLC 4/9/2014 7:44:50 PM Chem 105 Page 1 of 1

=====================================================================Acq. Operator : Chem 105 Seq. Line : 14Acq. Instrument : 305 Lat HPLC Location : Vial 77Injection Date : 4/9/2014 7:46:16 PM Inj : 2 Inj Volume : 20.0 µlSequence File : C:\Chem32\1\DATA\9 APRIL 2014\CHEM105 2014-04-09 14-47-10\CHEM105.SMethod : C:\CHEM32\1\DATA\9 APRIL 2014\CHEM105 2014-04-09 14-47-10\CHEM105A.MLast changed : 3/18/2014 3:50:33 PM by Chem 105
min0 1 2 3 4 5 6 7 8 9
mAU
-40
-30
-20
-10
0
10
DAD1 A, Sig=254,4 Ref=360,100 (077-1402.D)
0.8
16
1.5
18
1.9
41 2
.129
===================================================================== Area Percent Report ===================================================================== Sorted By : SignalMultiplier: : 1.0000Dilution: : 1.0000Use Multiplier & Dilution Factor with ISTDs Signal 1: DAD1 A, Sig=254,4 Ref=360,100 Peak RetTime Type Width Area Height Area # [min] [min] [mAU*s] [mAU] %----|-------|----|-------|----------|----------|--------| 1 0.816 BV 0.3217 987.76434 37.45297 62.5851 2 1.518 VV 0.1092 18.65267 2.23923 1.1818 3 1.941 VV 0.2315 297.23730 17.21082 18.8331 4 2.129 VV 0.1872 274.61975 18.49891 17.4000 Totals : 1578.27407 75.40192 ===================================================================== *** End of Report ***
Data File C:\CHEM32\1\DATA\9 APRIL 2014\CHEM105 2014-04-09 14-47-10\077-1402.DSample Name: 1Standard
305 Lat HPLC 4/9/2014 7:56:30 PM Chem 105 Page 1 of 1

=====================================================================Acq. Operator : Chem 105 Seq. Line : 14Acq. Instrument : 305 Lat HPLC Location : Vial 77Injection Date : 4/9/2014 7:57:55 PM Inj : 3 Inj Volume : 20.0 µlSequence File : C:\Chem32\1\DATA\9 APRIL 2014\CHEM105 2014-04-09 14-47-10\CHEM105.SMethod : C:\CHEM32\1\DATA\9 APRIL 2014\CHEM105 2014-04-09 14-47-10\CHEM105A.MLast changed : 3/18/2014 3:50:33 PM by Chem 105
min0 2 4 6 8
mAU
-40
-30
-20
-10
0
10
DAD1 A, Sig=254,4 Ref=360,100 (077-1403.D)
0.8
48
1.4
48
2.1
27
===================================================================== Area Percent Report ===================================================================== Sorted By : SignalMultiplier: : 1.0000Dilution: : 1.0000Use Multiplier & Dilution Factor with ISTDs Signal 1: DAD1 A, Sig=254,4 Ref=360,100 Peak RetTime Type Width Area Height Area # [min] [min] [mAU*s] [mAU] %----|-------|----|-------|----------|----------|--------| 1 0.848 BV 0.3432 1053.58057 38.02576 64.9938 2 1.448 VV 0.0727 10.03283 2.06460 0.6189 3 2.127 VV 0.3468 557.43555 19.65986 34.3873 Totals : 1621.04895 59.75022 ===================================================================== *** End of Report ***
Data File C:\CHEM32\1\DATA\9 APRIL 2014\CHEM105 2014-04-09 14-47-10\077-1403.DSample Name: 1Standard
305 Lat HPLC 4/9/2014 8:08:08 PM Chem 105 Page 1 of 1
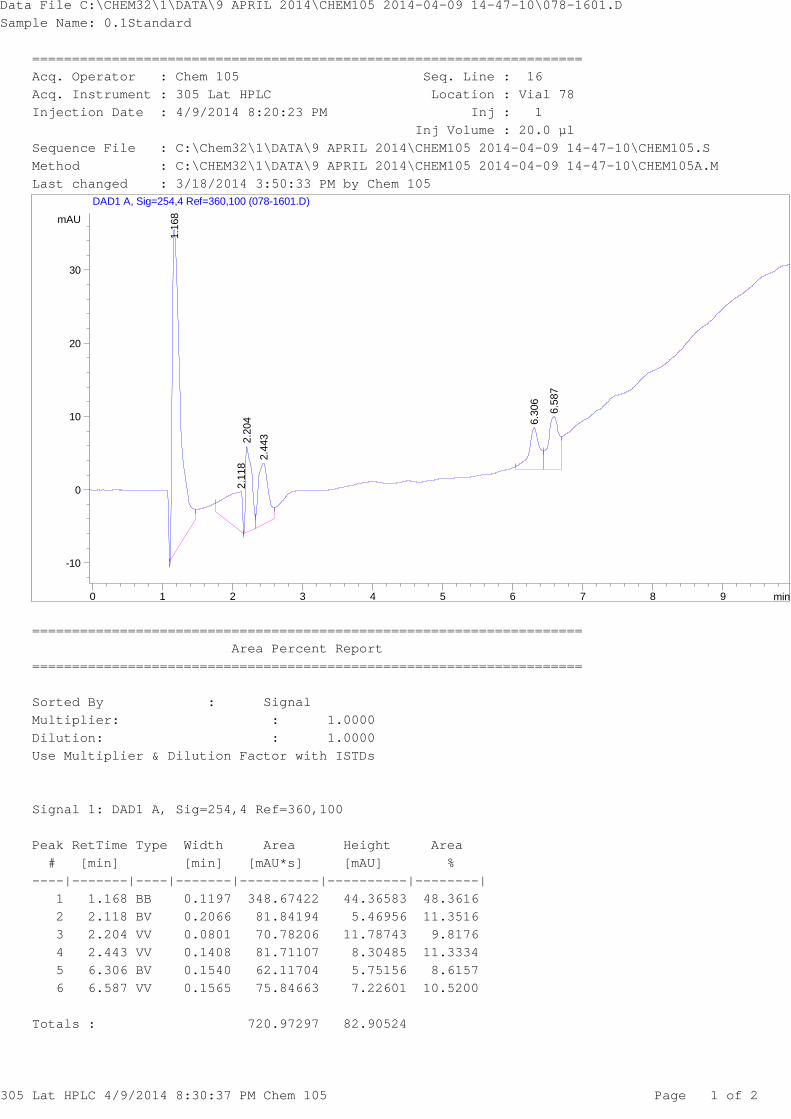
=====================================================================Acq. Operator : Chem 105 Seq. Line : 16Acq. Instrument : 305 Lat HPLC Location : Vial 78Injection Date : 4/9/2014 8:20:23 PM Inj : 1 Inj Volume : 20.0 µlSequence File : C:\Chem32\1\DATA\9 APRIL 2014\CHEM105 2014-04-09 14-47-10\CHEM105.SMethod : C:\CHEM32\1\DATA\9 APRIL 2014\CHEM105 2014-04-09 14-47-10\CHEM105A.MLast changed : 3/18/2014 3:50:33 PM by Chem 105
min0 1 2 3 4 5 6 7 8 9
mAU
-10
0
10
20
30
DAD1 A, Sig=254,4 Ref=360,100 (078-1601.D)
1.1
68
2.1
18 2
.204
2.4
43
6.3
06 6.5
87
===================================================================== Area Percent Report ===================================================================== Sorted By : SignalMultiplier: : 1.0000Dilution: : 1.0000Use Multiplier & Dilution Factor with ISTDs Signal 1: DAD1 A, Sig=254,4 Ref=360,100 Peak RetTime Type Width Area Height Area # [min] [min] [mAU*s] [mAU] %----|-------|----|-------|----------|----------|--------| 1 1.168 BB 0.1197 348.67422 44.36583 48.3616 2 2.118 BV 0.2066 81.84194 5.46956 11.3516 3 2.204 VV 0.0801 70.78206 11.78743 9.8176 4 2.443 VV 0.1408 81.71107 8.30485 11.3334 5 6.306 BV 0.1540 62.11704 5.75156 8.6157 6 6.587 VV 0.1565 75.84663 7.22601 10.5200 Totals : 720.97297 82.90524
Data File C:\CHEM32\1\DATA\9 APRIL 2014\CHEM105 2014-04-09 14-47-10\078-1601.DSample Name: 0.1Standard
305 Lat HPLC 4/9/2014 8:30:37 PM Chem 105 Page 1 of 2

===================================================================== *** End of Report ***
Data File C:\CHEM32\1\DATA\9 APRIL 2014\CHEM105 2014-04-09 14-47-10\078-1601.DSample Name: 0.1Standard
305 Lat HPLC 4/9/2014 8:30:37 PM Chem 105 Page 2 of 2

=====================================================================Acq. Operator : Chem 105 Seq. Line : 16Acq. Instrument : 305 Lat HPLC Location : Vial 78Injection Date : 4/9/2014 8:32:03 PM Inj : 2 Inj Volume : 20.0 µlSequence File : C:\Chem32\1\DATA\9 APRIL 2014\CHEM105 2014-04-09 14-47-10\CHEM105.SMethod : C:\CHEM32\1\DATA\9 APRIL 2014\CHEM105 2014-04-09 14-47-10\CHEM105A.MLast changed : 3/18/2014 3:50:33 PM by Chem 105
min0 1 2 3 4 5 6 7 8 9
mAU
-40
-30
-20
-10
0
10
DAD1 A, Sig=254,4 Ref=360,100 (078-1602.D)
0.8
17
1.4
81 1
.583
1.7
00
2.0
67
2.4
98
===================================================================== Area Percent Report ===================================================================== Sorted By : SignalMultiplier: : 1.0000Dilution: : 1.0000Use Multiplier & Dilution Factor with ISTDs Signal 1: DAD1 A, Sig=254,4 Ref=360,100 Peak RetTime Type Width Area Height Area # [min] [min] [mAU*s] [mAU] %----|-------|----|-------|----------|----------|--------| 1 0.817 BV 0.3190 977.10211 37.37093 59.9091 2 1.481 VV 0.0985 28.41631 4.11997 1.7423 3 1.583 VV 0.0471 16.49159 5.47909 1.0111 4 1.700 VV 0.0782 53.69276 9.76090 3.2921 5 2.067 VV 0.3344 546.24152 19.64394 33.4917 6 2.498 VB 0.0809 9.03005 1.52827 0.5537 Totals : 1630.97435 77.90310
Data File C:\CHEM32\1\DATA\9 APRIL 2014\CHEM105 2014-04-09 14-47-10\078-1602.DSample Name: 0.1Standard
305 Lat HPLC 4/9/2014 8:42:16 PM Chem 105 Page 1 of 2
===================================================================== *** End of Report ***
Data File C:\CHEM32\1\DATA\9 APRIL 2014\CHEM105 2014-04-09 14-47-10\078-1602.DSample Name: 0.1Standard
305 Lat HPLC 4/9/2014 8:42:16 PM Chem 105 Page 2 of 2

=====================================================================Acq. Operator : Chem 105 Seq. Line : 16Acq. Instrument : 305 Lat HPLC Location : Vial 78Injection Date : 4/9/2014 8:43:41 PM Inj : 3 Inj Volume : 20.0 µlSequence File : C:\Chem32\1\DATA\9 APRIL 2014\CHEM105 2014-04-09 14-47-10\CHEM105.SMethod : C:\CHEM32\1\DATA\9 APRIL 2014\CHEM105 2014-04-09 14-47-10\CHEM105A.MLast changed : 3/18/2014 3:50:33 PM by Chem 105
min0 1 2 3 4 5 6 7 8 9
mAU
-40
-30
-20
-10
0
10
DAD1 A, Sig=254,4 Ref=360,100 (078-1603.D)
0.8
32
1.4
52 1
.542
2.1
00
2.5
00
===================================================================== Area Percent Report ===================================================================== Sorted By : SignalMultiplier: : 1.0000Dilution: : 1.0000Use Multiplier & Dilution Factor with ISTDs Signal 1: DAD1 A, Sig=254,4 Ref=360,100 Peak RetTime Type Width Area Height Area # [min] [min] [mAU*s] [mAU] %----|-------|----|-------|----------|----------|--------| 1 0.832 BV 0.3460 1031.66931 37.85192 59.5494 2 1.452 VV 0.0862 24.26524 4.54972 1.4006 3 1.542 VV 0.0426 18.93858 6.78764 1.0932 4 2.100 VV 0.3806 644.79871 20.51986 37.2187 5 2.500 VV 0.0846 12.78787 2.05389 0.7381 Totals : 1732.45971 71.76302 =====================================================================
Data File C:\CHEM32\1\DATA\9 APRIL 2014\CHEM105 2014-04-09 14-47-10\078-1603.DSample Name: 0.1Standard
305 Lat HPLC 4/9/2014 8:53:55 PM Chem 105 Page 1 of 1

=====================================================================Acq. Operator : Chem 105 Seq. Line : 18Acq. Instrument : 305 Lat HPLC Location : Vial 79Injection Date : 4/9/2014 9:06:09 PM Inj : 1 Inj Volume : 20.0 µlSequence File : C:\Chem32\1\DATA\9 APRIL 2014\CHEM105 2014-04-09 14-47-10\CHEM105.SMethod : C:\CHEM32\1\DATA\9 APRIL 2014\CHEM105 2014-04-09 14-47-10\CHEM105A.MLast changed : 3/18/2014 3:50:33 PM by Chem 105
min0 1 2 3 4 5 6 7 8 9
mAU
-10
-5
0
5
10
15
20
25
30
DAD1 A, Sig=254,4 Ref=360,100 (079-1801.D)
1.1
76
2.1
15 2
.200
2.4
95
6.2
04
===================================================================== Area Percent Report ===================================================================== Sorted By : SignalMultiplier: : 1.0000Dilution: : 1.0000Use Multiplier & Dilution Factor with ISTDs Signal 1: DAD1 A, Sig=254,4 Ref=360,100 Peak RetTime Type Width Area Height Area # [min] [min] [mAU*s] [mAU] %----|-------|----|-------|----------|----------|--------| 1 1.176 BB 0.1154 297.52802 40.63152 45.2417 2 2.115 BV 0.1941 88.30638 5.59623 13.4277 3 2.200 VV 0.0826 76.47616 11.96411 11.6289 4 2.495 VV 0.1685 72.60163 6.20496 11.0397 5 6.204 BB 0.2100 122.72923 7.86909 18.6620 Totals : 657.64141 72.26591 =====================================================================
Data File C:\CHEM32\1\DATA\9 APRIL 2014\CHEM105 2014-04-09 14-47-10\079-1801.DSample Name: Unknown
305 Lat HPLC 4/9/2014 9:16:21 PM Chem 105 Page 1 of 1

=====================================================================Acq. Operator : Chem 105 Seq. Line : 18Acq. Instrument : 305 Lat HPLC Location : Vial 79Injection Date : 4/9/2014 9:17:44 PM Inj : 2 Inj Volume : 20.0 µlSequence File : C:\Chem32\1\DATA\9 APRIL 2014\CHEM105 2014-04-09 14-47-10\CHEM105.SMethod : C:\CHEM32\1\DATA\9 APRIL 2014\CHEM105 2014-04-09 14-47-10\CHEM105A.MLast changed : 3/18/2014 3:50:33 PM by Chem 105
min0 1 2 3 4 5 6 7 8 9
mAU
-40
-30
-20
-10
0
10
DAD1 A, Sig=254,4 Ref=360,100 (079-1802.D)
0.8
62
1.9
65 2.0
76 2
.166
===================================================================== Area Percent Report ===================================================================== Sorted By : SignalMultiplier: : 1.0000Dilution: : 1.0000Use Multiplier & Dilution Factor with ISTDs Signal 1: DAD1 A, Sig=254,4 Ref=360,100 Peak RetTime Type Width Area Height Area # [min] [min] [mAU*s] [mAU] %----|-------|----|-------|----------|----------|--------| 1 0.862 BV 0.3561 1105.59680 38.37947 64.4417 2 1.965 VV 0.2169 285.18832 16.39925 16.6227 3 2.076 VV 0.1018 133.01527 18.09304 7.7530 4 2.166 VV 0.1484 191.85429 16.65150 11.1826 Totals : 1715.65469 89.52326 ===================================================================== *** End of Report ***
Data File C:\CHEM32\1\DATA\9 APRIL 2014\CHEM105 2014-04-09 14-47-10\079-1802.DSample Name: Unknown
305 Lat HPLC 4/9/2014 9:27:58 PM Chem 105 Page 1 of 1

=====================================================================Acq. Operator : Chem 105 Seq. Line : 18Acq. Instrument : 305 Lat HPLC Location : Vial 79Injection Date : 4/9/2014 9:29:22 PM Inj : 3 Inj Volume : 20.0 µlSequence File : C:\Chem32\1\DATA\9 APRIL 2014\CHEM105 2014-04-09 14-47-10\CHEM105.SMethod : C:\CHEM32\1\DATA\9 APRIL 2014\CHEM105 2014-04-09 14-47-10\CHEM105A.MLast changed : 3/18/2014 3:50:33 PM by Chem 105
min0 1 2 3 4 5 6 7 8 9
mAU
-40
-30
-20
-10
0
10
DAD1 A, Sig=254,4 Ref=360,100 (079-1803.D)
0.8
42
1.5
90
1.9
19 2
.072
2.1
58
===================================================================== Area Percent Report ===================================================================== Sorted By : SignalMultiplier: : 1.0000Dilution: : 1.0000Use Multiplier & Dilution Factor with ISTDs Signal 1: DAD1 A, Sig=254,4 Ref=360,100 Peak RetTime Type Width Area Height Area # [min] [min] [mAU*s] [mAU] %----|-------|----|-------|----------|----------|--------| 1 0.842 BV 0.3098 918.49908 36.23124 62.7453 2 1.590 VV 0.0526 14.37509 4.13498 0.9820 3 1.919 VV 0.1996 242.28671 16.66873 16.5513 4 2.072 VV 0.1038 112.53143 15.30680 7.6873 5 2.158 VV 0.1492 176.16068 14.98468 12.0340 Totals : 1463.85300 87.32643 =====================================================================
Data File C:\CHEM32\1\DATA\9 APRIL 2014\CHEM105 2014-04-09 14-47-10\079-1803.DSample Name: Unknown
305 Lat HPLC 4/9/2014 9:39:37 PM Chem 105 Page 1 of 1